Abstract
This study evaluated the phosphorus use efficiency (PUE) in two genotypes and one cultivar of Brachiaria decumbens (HD1, HD4, and Basilisk) and the productive, morphogenic, and structural responses. The experimental design used was randomized blocks with five P rates (0, 13, 26, 52, and 104 mg dm−3). There was no forage × P rate interaction (p > 0.05), but the P rates affected the leaf appearance rate (TAR; p = 0.0314), leaf life span (LLS; p = 0.0207), phyllochron (PC; p = 0.0207), leaf elongation rate (LER; p = 0.0350), stem elongation rate (SER; p = 0.0109), and the number of live leaves (NLL; p = 0.0033). The LAR, LLS, and PC followed quadratic trends, increasing up to 52 mg dm−3, while the PC declined. The FLL, SER, and NLL increased linearly. HD1 had the highest final leaf length, LER, and NLL, while Basilisk had the lowest. There was an interaction for tiller population density (p = 0.0431), with increases of 0.26, 0.28, and 0.24 tillers for HD4, HD1, and Basilisk, respectively. Forage production (FP) increased with P, gaining 0.51 g of DM for each mg dm−3 of P added. The HD1 genotype showed higher FLL, LER, NLL, FP, and higher PUE than the HD4 genotype and the Basilisk cultivar. HD1 was more responsive to higher P rates for root production, indicating a greater need for nutrients to reach its productive potential. Phosphate fertilization positively influenced morphogenesis and forage production in the evaluated genotypes and cultivars. The HD1 genotype stood out in relation to the others, showed superiority in forage and root production, and demonstrated greater efficiency in the use of P, at a dose of 13 mg dm−3.
1. Introduction
The increasing global demand for food, driven by population growth, imposes significant challenges on agriculture, requiring more efficient and sustainable production practices capable of ensuring productivity, conserving natural resources, and mitigating environmental impacts [1]. In this context, plant mineral nutrition plays a crucial role in agricultural production systems, particularly in pasture-based livestock systems, where soil fertility is a determining factor for productive sustainability.
In tropical pastures, phosphorus (P) fertilization plays a fundamental role in forage establishment and persistence, promoting increased initial growth, tillering, and root system development, while directly influencing the carrying capacity of the area [2,3]. However, a substantial proportion of soils worldwide are deficient in P, which is considered a finite and irreplaceable resource, limiting plant production—especially in tropical regions [4]—unlike nitrogen (N), which is abundantly available in the atmosphere.
The low availability of P in acidic soils of tropical and subtropical regions is one of the main limitations of agricultural production in these areas, particularly in pasture-based livestock systems [5,6]. In such environments, the high P adsorption capacity of the soil, combined with the low availability of P in the parent material and the reduced efficiency of P uptake and utilization by many modern cultivars, requires the application of high rates of P fertilizers [7]. This heavy reliance on P inputs represents both an economic and environmental challenge, as improper management can result in nutrient losses to the environment, contributing to eutrophication and pollution of water bodies [8].
In this sense, improving knowledge regarding phosphorus use efficiency (PUE) in tropical forage grasses could support the development of management strategies and the selection of genotypes better adapted to low-fertility soils, promoting more efficient nutrient use and reducing environmental losses [9].
Previous studies have demonstrated that tropical forage species, such as Brachiaria spp., develop morphological and physiological mechanisms to enhance P acquisition efficiency [10,11]. However, most research on P nutrition in tropical forage grasses has focused on selecting materials with high responsiveness to fertilization, aiming at maximum productivity in high-fertility soils. There is, however, limited research specifically addressing the cultivar Basilisk (Brachiaria decumbens), a forage grass recognized for its adaptation to low- to medium-fertility soils [5,12]. Studies evaluating its growth strategies and P use efficiency are essential to understanding its potential in production systems with varying input availability [13], helping to identify fertilization rates more aligned with tropical soil conditions [14] and preventing pasture degradation through the appropriate selection of forage species.
This study tested the hypothesis that B. decumbens genotypes exhibit different P use strategies compared to the cultivar Basilisk. Thus, the objective was to evaluate the effect of increasing P doses on morphogenetic and structural traits and forage and root production and to determine differences in P use efficiency (PUE) among B. decumbens genotypes.
2. Materials and Methods
2.1. Site, Soil, and Fertilization
The experiment was carried out in pots in a greenhouse at the Brazilian Agricultural Research Corporation—Embrapa Gado de Corte (20°26′48′′ S 54°43′07′′ W, 538 m above sea level), Campo Grande—Mato Grosso do Sul (MS), Brazil. The experimental period occurred during the rainy season, from September 2021 (late spring) to February (summer) 2022, totaling 162 days of evaluation. The soil used was an Oxisol [15], with physical characteristics of 39% clay, 7% silt, and 54% sand and chemical characteristics described in Table 1. During the experiment, the average daily temperature was 26.8 °C.

Table 1.
Chemical characteristics of the soil in each treatment before sowing.
The soil was corrected and fertilized with 1960 mg dm−3 of lime, 58.82 mg dm−3 of sulfur (S), 12.94 mg dm−3 of zinc (Zn), 12.94 mg dm−3 of copper (Cu), 3.24 mg dm−3 of boron (B), and 1.61 mg dm−3 of molybdenum (Mo). The sources were elemental sulfur, zinc sulfate, copper sulfate, sodium borate, and ammonium molybdate, respectively. The soil was left for 40 days with humidity close to field capacity for the lime to react. Triple superphosphate (SFT) was diluted and added to the soil, on the surface, at doses of 0, 13, 26, 52, and 104 mg dm−3. Seeds were sown on 1 September 2021, with approximately 50 seeds in each experimental unit, with each unit containing a soil volume of 2.55 dm3. Thinning was carried out on the 15th day after sowing, and five plants per pot were kept under irrigation for the start of the experimental evaluations.
During the experimental period (162 days), maintenance fertilizations were carried out one day after each cut (28-day interval), with 588 mg dm−3 of nitrogen (N) and 98 mg dm−3 of potassium (K). Urea was used as the N source and potassium chloride as the K source. They were diluted in water, and 25 mL of the solution was applied per pot.
2.2. Experimental Design
The experimental design was a randomized block, 3 × 5 factorial scheme, with three forage plants of the Brachiaria decumbens species, two genotypes (HD4, HD1) and one cultivar (Basilisk), and five doses of P: 0, 13, 26, 52 and 104 mg dm−3, with four replications, totaling 60 experimental units. The doses of P were applied to pots containing 2.55 dm−3 of soil, which were considered experimental units.
2.3. Morphogenic and Productive Characteristics
To evaluate the morphogenic and structural characteristics, two tillers were marked for each experimental unit, totaling 180 tillers, and evaluated weekly. Measurements of the pseudostem height, extended tiller height, and length of expanded and expanding leaves were taken and used to calculate the morphogenic variables: leaf appearance rate (LAR, cm tiller−1 day), leaf elongation rate (LER, cm tiller−1 day), leaf life span (LLS, day), stem elongation rate (SER, cm tiller−1 day), phyllochron (PC, days), final leaf length (FLL, cm), number of live leaves (NLL, leaves tiller−1).
The tiller population density (TPD) was determined by counting the tillers in each experimental unit of each treatment, with the first evaluation being performed 45 days after sowing (1st cut) and the others one day before each cut, totaling five evaluations.
For forage production (FP), the first was 58 days after sowing and the following 28 days after the first cut. The height of the residue for the cutting established was 15 cm from the ground level. The forage mass cut in each of the pots and in each cut was placed in a paper bag, identified, and subsequently dried in a forced circulation oven at 55 °C until a constant weight and weighed on an analytical balance. The sum of the mass of each pot in all cuts obtained the forage production of each cultivar at each evaluated P dose.
For root production (RP), they were removed from the pot, separated from the soil, and then washed in a gentle stream of water using two sieves of 2 and 1 mm mesh to retain the root mass of roots. The roots were then placed in paper bags and dried in an oven at 65 °C for 7 days until constant weight, the method used by [16].
2.4. Phosphorus Use Efficiency
The PUE for FP was determined by calculating the difference between the forage production of the pot (PFx) and the forage production (PF0) of the zero dose of P divided by the dose of P applied (Dx), using the following formula [17]:
PUE = (PFx − PF0)/Dx) × 100
PUE—phosphorus utilization efficiency (g DM mg dm−3 P); PFx—forage production (g pot−1); PF0—forage production at zero doses; Dx—P dose in the pot (mg dm−3).
2.5. Statistical Analysis
The data were submitted to analysis of variance and comparison between means with the Tukey test (5%), using the SAS (Ondemand) statistical package. The model used was: Yjik = µ + bj + ci + dk + (cd)ik + εjikl. Where: Yjik = value observed in block j; in forage i; in P dose k; µ = general average effect; bj = effect of block j; ci = effect of forage i; dk = effect of P dose k; (cd) ik = effect of forage × P dose interaction; εjikl = experimental error associated with observation Yjik. The effects of the P doses were analyzed using regression equations. Linear and quadratic models were tested and selected according to the significance of the regression coefficients, adopting a 5% level.
3. Results
There was an effect of the P doses for the LAR (p = 0.0314), PC (p = 0.0369), and LLS (p = 0.0207). (Table 2). The variables showed a quadratic response, with an initial increase in the LAR and LLS up to the 52 mg dm−3 dose, and a decrease in phyllochronum up to the 26 mg dm−3 dose. After these doses, the LAR and LLS decreased, and PC increased (Table 2). There was a P dose effect for the LER (p = 0.0350), SER (p = 0.0109), and NLL (p = 0.0033). The data fitted quadratic regression equations, with an increase followed by a decrease from the 52 mg dm−3 dose for all the variables (Table 2).
Table 2.
Morphogenic and structural characteristics of forage grasses fertilized with increasing doses of P.
There was no forage × dose interaction (p > 0.05), nor was there any forage effect for the variables LAR (p = 0.5336), LLS (p = 0.4116), and PC (p = 0.4022), with an average of 0.13 leaves/tiller.day, 46.05 days and 8.91 days, respectively.
There was an effect of the forage plants on FLL (p = 0.0042), LER (p = 0.0018), and NLL (0.0336). The highest FLL was in the HD1 genotype, the lowest in the Basilisk cultivar (Figure 1), and intermediate for the HD4 genotype. The LER was highest in the HD4 and HD1 genotypes and lowest in the Basilisk cultivar. The highest NLL was observed in HD1, and the lowest was in the Basilisk cultivar.
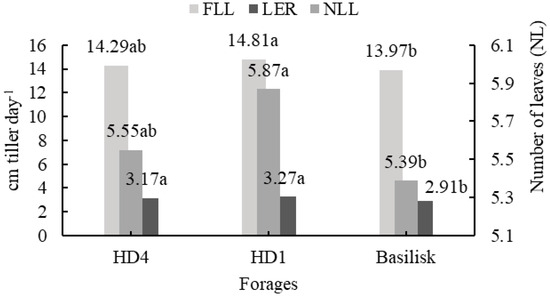
Figure 1.
Final leaf length (FLL), leaf elongation rate (LER), and the number of live leaves (NLL) of Brachiaria decumbens subjected to phosphate fertilization. Means followed by the same lowercase letter in the column do not differ by Tukey’s test at 5%.
There was a forage × P dose interaction for TPD (p = 0.0423). An increase of 0.26, 0.28, and 0.24 tillers was observed for the HD4, HD1 genotypes, and Basilisk cultivar, respectively. At doses of 0 and 52 mg dm−3 P, the highest tillering was observed in the Basilisk cultivar. The lowest TPD was in the HD4 genotype at the 0 dose and in the HD1 genotype at the 52 mg dm−3 P dose. At the 104 mg dm−3 P dose, the highest TPD was in the HD1 genotype (Table 3).
Table 3.
Tiller population density as a function of the interaction between forage plants and P doses.
There was no forage × P dose interaction for forage production (FP) (p = 0.2545). However, a linear increase was observed in response to P application (P = 0.0013), with an increase of 0.51 g forage for each mg dm−3 of P added to the soil (Figure 2A). There was a difference between the forages in relation to the P doses for FP (p = 0.0284). The highest FP was in the HD1 forage and the lowest in the Basilisk cultivar. The HD4 forage presented intermediate FP (Figure 2B).
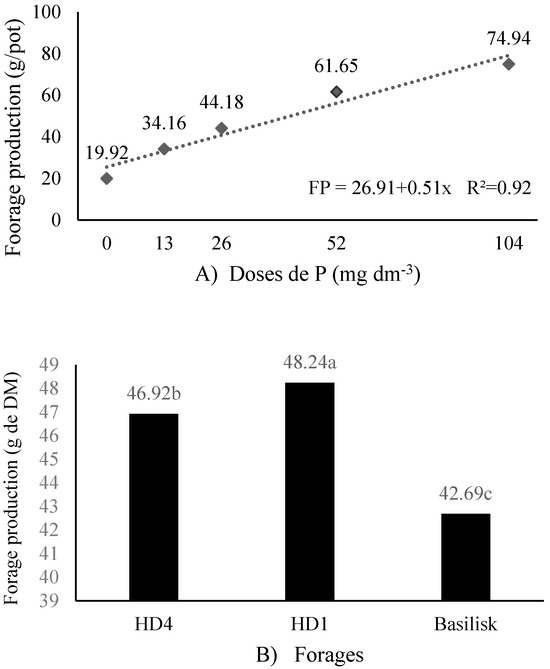
Figure 2.
Forage production (FP) as a function of different P levels (A) and different forages (B). Means followed by the same lowercase letter in the column do not differ by Tukey’s test at 5%.
There was a forage × P dose interaction for root production (PR) (P = 0.0355). The data fit increasing linear regression equations, with increases of 0.09, 0.08, and 0.05 for forages HD4, HD1, and Basilisk, respectively (Table 4). The highest root dry mass was observed in the HD1 forage at the dose of 104 mg dm−3 P. The lowest PR at the dose of 104 mg dm−3 P was for the Basilisk cultivar, with no differences between the forages at the other doses.
Table 4.
Root dry mass as a function of the forage × P dose interaction in Brachiaria decumbens forage grasses.
There was an interaction between forages and P doses for PUE (p = 0.0364). For the effect of P doses, the highest efficiency was observed at a dose of 26 mg dm−3 for the HD2 genotype and at a dose of 13 mg dm−3 for the HD1 genotype and the Basilisk cultivar (Table 5). Among the cultivars, the highest efficiency was in the HD1 genotype at all doses. The lowest efficiency was observed in the HD4 genotype at all doses, except at a dose of 102 mg dm−3, which was the same as that of the Basilisk cultivar.
Table 5.
Phosphorus use efficiency as a function of the forage × P dose interaction in Brachiaria decumbens forage grasses.
There was a significant correlation between all variables analyzed (p < 0.05). A strong positive correlation was observed between P doses and RP, FP, and TPD. A strong negative correlation was observed between PC and LAR. And moderate correlations were observed between LER and RP, FP, SER, NLL, and LER (Figure 3).
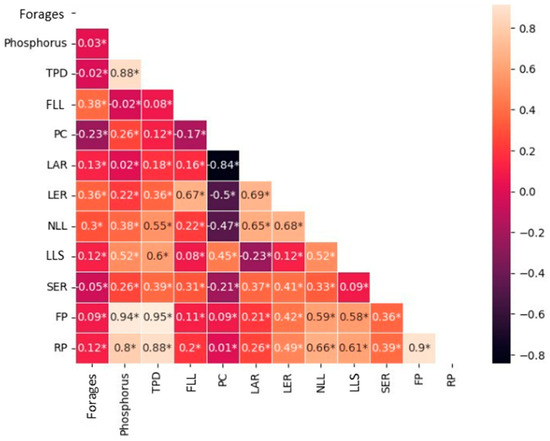
Figure 3.
Correlation between phosphorus doses, cultivars, and morphogenic and structural variables. *: significant effect.
4. Discussion
The variables LER, FLL, and NLL are morphogenic attributes desired by forage plant breeding programs, which, together with a lower dependence on P, contribute to the development and selection of cultivars adaptable to soils with a low presence of the nutrient, like the oxisols found in the Cerrado biome [6].
The effect of P doses on the LAR, LLS, and LER, as well as the similarity between forage plants for the same variables, shows that these are genetically determined morphogenic characteristics, but they can be influenced by environmental factors [18] such as temperature, nutrient supply and the state of water in the plant. As the site conditions are controlled, the effect on the variables is attributed solely to phosphate fertilization. This reinforces that, although there is genetic variability between the HD4 and HD1 genotypes and the Basilisk cultivar, environmental conditions play a crucial role in the expression of morphogenic characteristics, leading to similar behavior between genotypes of the same species when these conditions are uniform [19].
The quadratic effect of P doses, which led to an increase in the LAR and LLS and a decrease in PC up to a dose of 52 mg dm−3, suggests that moderate doses of P can maximize these variables due to P’s essential role in plant energy metabolism and the formation of nucleic acids, which regulate cell growth [1]. Thus, its availability modulates the production of new tissues [20].
However, the decrease in the LAR and NLL and, consequently, the increase in PC, reinforces that, in addition to the strong negative correlation between these variables (Figure 3), they show that doses higher than 52 mg dm−3 can cause plants to saturate and redistribute nutrients to other processes, such as leaf and stem elongation [18] and tillering (Table 4; Figure 3). This saturation is frequently reported in grasses, and not only with P [21], as observed by [22], who highlighted that N improves initial development up to a certain point, after which gains are reduced.
The initial reduction in PC with moderate doses of P (Table 2) shows that leaves emerge more quickly, favoring an increase in leaf area for light interception. However, high doses can slow down leaf production, a possible consequence of the redistribution of resources to elongation or tillering, as described by [23].
At low doses of P, the LLS increases because the plant keeps leaves longer to maximize light and nutrient uptake. At high doses, there is greater leaf renewal due to the abundance of resources, as highlighted by [24]. The species’ decumbent growth habit, with the supply of increasing doses of P, leads to increases in SER (Table 2). This growth habit may be desirable when establishing pastures in areas where there is a need for soil cover.
The genotypes evaluated in this study are still in the testing phase and are part of the Embrapa Gado de Corte breeding program. For this reason, most of the detailed information about their genetic characteristics remains confidential. The HD1 and HD4 hybrids are half-siblings, sharing the same father (B. decumbens cv. Basilisk), but from different mothers. Genetically, both the father (Basilisk) and the offspring (HD1 and H4) are different from each other (they even present molecular markers specific to each genotype). Consequently, the three genotypes present phenotypic differences between them (leaf length, leaf width, and plant height, among other characteristics), as observed in Figure 1. The HD1 genotype presented a higher FLL, LER, and NLL when compared to the others, structural characteristics that reinforce the difference between the forages.
Tillering is directly linked to the ability to capture resources and to intraspecific competition. The continuous increase in the TPD observed in the HD4 and HD1 genotypes and in the Basilisk cultivar, with the increase in P doses, reflects greater availability of energy and nutrients for the formation of new tillering meristems, as discussed by [25]. However, the Basilisk cultivar is less responsive when subjected to high doses of P, probably due to its genetic stabilization and previous adaptation to low-fertility soils [26]. The higher TPD of cultivar HD1 at a dose of 102 mg dm−3 showed that this genotype had a greater capacity to respond to higher doses.
Forage production is the result of the flow of tissues observed by morphogenesis. The greater FLL, NLL, LER (Figure 1), and TPD of the HD1 genotype allowed greater forage production. Although HD1 presented higher FP than the other forages evaluated, the positive effect of P on the flow of new tissue generation resulted in higher FP for all forages. The significant results of the strong and positive correlation (Figure 3) between P doses and the variables FP, RP, and TPD reinforce the direct influence of the nutrient on the generation of new tissues, as well as the importance of TPD both in the perenniality of the forage grass and in terms of root growth.
The increases in RP due to higher P doses can be explained by the influence of P on root growth (Figure 3) and on the formation of root hairs, which increase the surface area for nutrient and water absorption. This, combined with maintenance fertilization with N and K, which help maintain nutritional balance, led to increased forage production. Ref. [24] reported that if other macronutrients are not replaced, they can limit the growth of forage plants. The higher root production of the HD1 genotype, at a dose of 102 mg dm−3 of P, may be directly linked to both the action of nutrients that increase the number of roots, and the higher TPD (Table 3; Figure 3) presented by the genotype also at the higher dose. The higher RP may confer greater tolerance to environmental stress.
The application of 26 mg dm−3 of P resulted in the highest PUE for the HD4 genotype, while 13 mg dm−3 was more efficient for HD1 and Basilisk. These doses appear to align with the specific needs of each genotype, suggesting that PUE is optimized when P availability matches the absorption and utilization capacity of each cultivar. Studies corroborate that the response to phosphate fertilization is highly dependent on the genotype, with variations in biomass production and agronomic efficiency depending on the P doses applied [27].
The HD1 genotype demonstrated superiority in PUE at all doses, while HD4 showed lower efficiency, except at the 102 mg dm−3 dose, equaling the Basilisk cultivar. These differences can be attributed to genetic variations that affect root architecture, absorption capacity, and internal P mobilization. The activity of enzymes such as acid phosphatases, involved in the mineralization of organic P in the soil, can vary between genotypes, influencing the efficiency of nutrient use [21].
PUE is a multifactorial trait, influenced by genetic, morphological, and physiological factors. The identification of genotypes with high PUE is crucial for sustainable production systems, especially in soils with low P availability. The selection of cultivars adapted to specific fertilization conditions can reduce costs and minimize environmental impacts associated with the excessive use of fertilizers.
Therefore, P use efficiency should be considered within the context of each forage genotype and the production system. Higher doses may be required for genotypes that have a greater ability to respond to P, optimizing forage yield within the agricultural system [24].
5. Conclusions
Phosphate fertilization positively influenced morphogenesis and forage production in the genotypes and cultivars evaluated; however, P utilization efficiency decreased as the nutrient dose increased. The HD1 genotype stood out in relation to the others, showing superiority in forage and root production, in addition to a higher DPP, an essential characteristic for maintaining the productive capacity of the species. In addition, it demonstrated greater efficiency in P utilization at all doses and may be an alternative genotype to the Basilisk cultivar of the decumbens species, which has a low response to increased P doses.
Author Contributions
Conceptualization, G.d.S.D., A.R.d.A., D.B.M. and M.C.M.M.; Data curation, N.E.V.F., D.B.M., A.E.S.M., E.W.A. and J.G.R.; Formal analysis, G.d.S.D., M.d.G.P. and G.O.d.A.M.; Investigation, G.d.S.D. and D.B.M.; Methodology, N.E.V.F., G.O.d.A.M., M.d.G.P., A.E.S.M., E.W.A. and J.G.R.; Project administration, A.R.d.A. and M.C.M.M.; Supervision, G.d.S.D., A.R.d.A. and M.C.M.M.; Visualization, G.d.S.D.; Writing—original draft, N.E.V.F., G.O.d.A.M. and J.G.R.; Writing—review and editing, G.d.S.D., D.B.M. and M.d.G.P. All authors have read and agreed to the published version of the manuscript.
Funding
The authors thank the Embrapa Beef Cattle, the Federal University of Mato Grosso do Sul Foundation, through the Postgraduate Program in Animal Science, the National Council for Scientific and Technological Development (CNPq), the Higher Education Personnel Improvement Coordination (CAPES, Finance Code 001), and the Foundation for the Support of the Development of Education, Science, and Technology of the State of Mato Grosso do Sul (FUNDECT).
Institutional Review Board Statement
Not applicable.
Informed Consent Statement
Not applicable.
Data Availability Statement
The original contributions presented in this study are included in the article. Further inquiries can be directed to the corresponding author(s).
Conflicts of Interest
Authors Alexandre Romeiro de Araújo, Denise Baptaglin Montagner and Manuel Cláudio Motta Macedo were employed by the company Brazilian Agricultural Research Corporation. The remaining authors declare that the research was conducted in the absence of any commercial or financial relationships that could be construed as a potential conflict of interest.
References
- Khan, F.; Siddique, A.B.; Shabala, S.; Zhou, M.; Zhao, C. Phosphorus Plays Key Roles in Regulating Plants’ Physiological Responses to Abiotic Stresses. Plants 2023, 12, 2861. [Google Scholar] [CrossRef]
- Duarte, C.F.D.; Paiva, L.M.; Fernandes, H.J.; Prochera, D.L.; Cassaro, L.H.; Breure, M.F.; Flores, L.S.; Fernandes, R.L.; Souza, E.R.C.; Fleitas, A.C.; et al. Piata palisadegrass fertilized with different sources of phosphorus for solubility in water. Arq. Bras. Med. Veterinária Zootec. 2016, 15, 58–63. [Google Scholar] [CrossRef][Green Version]
- Heinrichs, R.; Monreal, C.M.; Santos, E.T.; Soares Filho, C.V.; Rebonatti, M.D.; Teixeira, N.M.; Moreira, A. Phosphorus Sources and Rates Associated with Nitrogen Fertilization in Mombasa Grass Yield. Commun. Soil Sci. Plant Anal. 2016, 47, 657–669. [Google Scholar] [CrossRef]
- Costa, K.S.d.Q.; de Oliveira, C.F.; Melo, M.P.; Vaz, C.F.; Melo, N.C.; Moraes, F.K.C. Fósforo no sistema solo-planta: Uma revisão. Obs. De La Econ. Latinoam. 2024, 22, e5361. [Google Scholar] [CrossRef]
- Novais, R.F.; Smyth, T.J. Fósforo em Solo e Planta em Condições Tropicais; Universidade Federal de Viçosa: Viçosa, Brazil, 1999. [Google Scholar]
- Withers, P.J.A.; Rodrigues, M.; Soltangheisi, A.; de Carvalho, T.S.; Guilherme, L.R.G.; Benites, V.d.M.; Gatiboni, L.C.; de Sousa, D.M.G.; Nunes, R.d.S.; Rosolem, C.A.; et al. Transições para o manejo sustentável do fósforo na agricultura brasileira. Sci. Rep. 2018, 8, 2537. [Google Scholar] [CrossRef]
- Roy, E.D.; Richards, P.D.; Martinelli, L.A.; Coletta, L.D.; Lins, S.R.M.; Vazquez, F.F.; Willig, E.; Spera, S.A.; Neill, C.; Porder, S. The phosphorus footprint of food production: Where should we focus for reducing environmental impacts? J. Ind. Ecol. 2016, 20, 432–444. [Google Scholar] [CrossRef]
- Haygarth, P.M.; Jarvie, H.P.; Powers, S.M.; Sharpley, A.N.; Elser, J.J.; Shen, J.; Peterson, H.M.; Chan, N.; Howden, N.J.K.; Burt, T.; et al. Sustainable phosphorus management and the need for a long-term perspective: The legacy hypothesis. Environ. Sci. Technol. 2014, 48, 8417–8419. [Google Scholar] [CrossRef]
- Costa, K.A.P.; Faquin, V.; Oliveira, I.P.; Severiano, E.C.; Simon, G.A.; Carrijo, M.S. Nutrient extraction by Marandu-grass phytomass under doses and nitrogen sources. Rev. Bras. Saúde Produção Anim. 2009, 10, 801–810. Available online: https://periodicos.ufba.br/index.php/rbspa/article/view/40060 (accessed on 19 March 2025).
- Lambers, H.; Hayes, P.E.; Laliberté, E.; Oliveira, R.S.; Turner, B.L. Leaf manganese accumulation and phosphorus-acquisition efficiency. Trends Plant Sci. 2015, 20, 83–90. [Google Scholar] [CrossRef]
- Hinsinger, P.; Bengough, A.G.; Vetterlein, D.; Young, I.M. Rhizosphere: Biophysics, biogeochemistry and ecological relevance. Plant Soil 2009, 321, 117–152. [Google Scholar] [CrossRef]
- Veneklaas, E.J.; Lambers, H.; Bragg, J.; Finnegan, P.M.; Lovelock, C.E.; Plaxton, W.C.; Price, C.A.; Scheible, W.-R.; Shane, M.W.; White, P.J.; et al. Opportunities for improving phosphorus-use efficiency in crop plants. New Phytol. 2012, 195, 306–320. [Google Scholar] [CrossRef] [PubMed]
- Bastidas, M.; Vázquez, E.; Villegas, D.M.; Rao, I.M.; Gutierrez, J.F.; Vivas-Quila, N.J.; Amado, M.; Berdugo, C.; Arango, J. Optimizing nitrogen use efficiency of six forage grasses to reduce nitrogen loss from intensification of tropical pastures. Agric. Ecosys. Environ. 2024; 367, 108970. [Google Scholar] [CrossRef]
- Santos, H.P.; Gatiboni, L.C.; Kaminski, J.; Siva, L.S.; Leites, L.; Tessier, D. Manejo da fertilidade do solo e adubação em pastagens. In Manejo Sustentável de Pastagens; Cecato, U., Santos, G.T., Branco, A.F., Soares Filho, C.V., Eds.; EDUEM: Maringá, Brazil, 2014; pp. 195–242. [Google Scholar]
- Soil Survey Staff. Soil Taxonomy: A Basic System of Soil Classification of Making and Interpreting Soil Surveys, 2nd ed.; USDA-Natural Resources Conservation Service: Washington, DC, USA, 1999; 869p. [Google Scholar]
- Emizael, M.A.; Araújp, A.R.; Difante, G.S.; Macedo, M.C.M.; Montagner, D.B.; Gurgel, A.L.C.; Zimmer, A.H.; Ferreira, A.D. Do different soil use and management systems change root eight? New Zealand J. Agric. Res. 2023, 67, 479–497. [Google Scholar] [CrossRef]
- Fageria, N.K.; Stalon, N.A.; Baligar, V.C. Nutrient Management for Improving Lowland Rice Productivity and Sustainability. Adv. Agron. 2003, 80, 63–152. [Google Scholar] [CrossRef]
- Gastal, F.; Lemaire, G. Defoliation, Shoot Plasticity, Sward Structure and Herbage Utilization in Pasture: Review of the Underlying Ecophysiological Processes. Agriculture 2015, 5, 1146–1171. [Google Scholar] [CrossRef]
- Bezerra, J.D.D.V.; Neto, J.V.E.; Alves, D.J.d.S.; Neta, I.E.B.; Neto, L.C.G.; Santos, R.d.S.; Difante, G.d.S. Productive, morfhogenic and structural characteristics of Brachiaria brizantha cultivars grown in two types of soil. Res. Soc. Dev. 2020, 9, e129972947. [Google Scholar] [CrossRef]
- Tariq, A.; Zeng, F.; Graciano, C.; Ulah, A.; Sabia, S.; Ahmed, Z.; Murtaza, G.; Ismoilov, K.; Zhang, Z. Regulation of Metabolites by Nutrients in Plants. In Plant Ionomics: Sensing, Signaling, and Regulation; Wiley: Hoboken, NJ, USA, 2023. [Google Scholar] [CrossRef]
- Nunes, F.N.; Cantarutti, R.B.; Novais, R.F.; Silva, I.R.; Tótola, M.R.; Ribeiro, B.N. Atividades de fosfatases em gramíneas forrageiras em resposta à disponibilidade de fósforo no solo e à altura de corte das plantas. Rev. Bras. Ciência Solo 2008, 32, 1899–1909. [Google Scholar] [CrossRef]
- Garcez Neto, A.F.; Nascimento Junior, D.; Regazzi, A.J.; Fonseca, D.M.; Mosquim, P.R.; Gobbi, K.F. Respostas morofgênicas e estruturais de Panicum maximum cv. Mombaça sob diferentes níveis de adubação nitrogenada e alturas de corte. Braz. J. Anim. Sci. 2002; 31, 1890–1900. [Google Scholar] [CrossRef]
- Lemaire, G.; Da Silva, M.; Agnusdei, M.; Wade, J.; Hodgson, J. Interactions between leaf lifespan and defoliation frequency in temperate and tropical pastures: A review. Grass Forage Sci. 2009, 64, 341–353. [Google Scholar] [CrossRef]
- Francisquini Junior, A.; Calonego, J.C.; Rosolem, C.A.; Santos, C.H.; Tiritan, C. Increase of nitrogen-use efficiency by phosphorus fertilization in grass–legume pastures. Nutr. Cycl. Agroecosyst. 2020, 118, 165–175. [Google Scholar] [CrossRef]
- Nunes, J.O.; Pompeu, R.C.F.F.; Bueno, L.G.; Tavares, R.K.O.; Clark, M.V.G.; Sagrilo, E.; Oliveira Júnior, J.O.L.; Souza, H.A. Response of Urochloa mosambicensis genotypes to phosphorus fertilization in soil with low phosphorus levels. Rev. Bras. Saúde Produção Anim. 2023, 24, e20230028. [Google Scholar] [CrossRef]
- Pereira, E.A.; Martuscello, J.A.; Fonseca, D.M.; Santos, M.V.; Cecon, P.R. Características morfogênicas e estruturais de gramíneas do gênero Brachiaria sob doses de nitrogênio. Ciência Anim. Bras. 2015, 16, 68–79. [Google Scholar]
- Camacho, M.A.; Silveira, L.P.O.; Silveira, M.V. Efficiency of genotypes of Brachiaria brizantha Stapf. (Syn: Urochloa brizantha) in biomass production under phosporus application. Arq. Bras. Med. Vet. Zootec. 2015, 67, 1133–1140. [Google Scholar] [CrossRef]


Disclaimer/Publisher’s Note: The statements, opinions and data contained in all publications are solely those of the individual author(s) and contributor(s) and not of MDPI and/or the editor(s). MDPI and/or the editor(s) disclaim responsibility for any injury to people or property resulting from any ideas, methods, instructions or products referred to in the content. |
© 2025 by the authors. Licensee MDPI, Basel, Switzerland. This article is an open access article distributed under the terms and conditions of the Creative Commons Attribution (CC BY) license (https://creativecommons.org/licenses/by/4.0/).