Communication

Relationship between NDVI of Patches and Cover Area of Grasses, Shrubs and Bare Soil Components of a Semi-Arid Steppe from North-West Patagonia, Argentina

by
Clara Fariña
1,
Valeria Aramayo
2,
Daiana Perri
1,
Valeria Martín Albarracín
1,
Fernando Umaña
2,
Octavio Augusto Bruzzone
1 and
Marcos H. Easdale
1,*
1
Instituto de Investigaciones Forestales y Agropecuarias Bariloche (IFAB, INTA-CONICET), San Carlos de Bariloche 8400, Argentina
2
Instituto Nacional de Tecnología Agropecuaria (INTA, EEA Bariloche), San Carlos de Bariloche 8400, Argentina
*
Author to whom correspondence should be addressed.
Grasses 2023, 2(1), 23-30; https://doi.org/10.3390/grasses2010003
Submission received: 21 September 2022 / Revised: 13 January 2023 / Accepted: 30 January 2023 / Published: 6 February 2023

Abstract

:
Distinguishing the contributions of different vegetation cover such as shrubs and grasses components into the primary production in arid and semi-arid rangelands is a key step to understanding changes at a landscape scale. The aim was to assess the contribution of shrubs, grasses and bare soil components into a total biophysical variable at a patch level, and the relationship between that biophysical variable and remote sensing vegetation index, in a grass–shrub steppe from North-West Patagonia, Argentina. We conducted a field survey in the period 2015–2017 to analyzing the relationship between monthly values of Normalized Difference Vegetation Index (NDVI) of two grasses, two shrub species and bare soil, weighted by their cover area at a patch level, and the concomitant patch NDVI records, respectively. The contribution of the patch components to the total NDVI value at a patch level was additive. The relationship between the weighted NDVI of patch components and the concomitant NDVI value at a patch level along time was linear for perennial grasses and deciduous shrub–grass patches, but linearity was not significant for most perennial shrub–grass patches. Differences among patch compositions and their surface reflectance suggest the need to move forward in a more precise distinction of the floristic composition of patches, to better understanding their contribution to NDVI temporal dynamics at a landscape scale.

1. Introduction

Arid and semi-arid rangelands are highly variable in space and time. In particular, the relationship between structural and functional attributes of arid and semi-arid steppes is one of the core study focus in landscape ecology [1]. Remote sensing information such as the Normalized Difference Vegetation Index (NDVI) is widely used as a proxy for vegetation primary productivity [2,3], and as an integrative indicator of ecosystem structure and functioning [4].
A family of vegetation phenology classifications addressing NDVI metrics, has gained increased research attention to characterizing temporal oscillations and shifts of vegetation productivity [5]. For instance, identifying a sudden increase or an abrupt surpass of a threshold value, the date and magnitude of maximum and minimum values, changes in the length of the growing season, long-term shifts or trends, a variety of time-frequencies measures and different kind of noise, e.g., [6,7,8,9,10,11,12]. Whereas NDVI time series give opportunities to characterize temporal dynamics of different ecosystems at coarse scales, identifying the contribution of different vegetation species or patches at finer scales is still a challenge.
At a landscape level, an approach oriented at separating NDVI time series into different temporal oscillations was proposed, aiming at distinguishing the contributions from different vegetation cover such as woody and herbaceous components [13,14]. In particular, it is proposed that woody vegetation has a weak annual phenological wave, which is mostly driven by inter-annual climatic variability. On the other hand, herbaceous vegetation has a strong annual phenological wave with contrasting seasons, also with year-to-year variation in amplitude [14,15]. This approach is based on two main premises: (i) the contribution of woody and herbaceous components to the total biophysical variable is additive, and (ii) the calibration relationship between the biophysical variable and the remotely sensed variable is linear [13,16]. Whereas these premises were tested in some arid environments, e.g., [14], they were not assessed neither in the Patagonian steppes nor at the patch and species level.
The aim of this study was to assess the additive and linearity assumptions between components and the concomitant patch level measurements in a grass–shrub steppe from North Patagonia, Argentina. In particular, we conducted a field survey between 2015 and 2017 aimed at analyzing the relationship between monthly NDVI values of two grasses, two shrub species and bare soil, weighted by their area cover at a patch level, and the patch NDVI records, respectively. We selected four predominant patches, which represented the most frequent situations in the studied steppe, and defined different combinations among the vegetation and bare soil components.

2. Materials and Methods

2.1. Study Area

The study area was a typical semiarid grass–shrub steppe in North Patagonia, Argentina, representative of the Patagonian Western District [17] in Río Negro province (41°02′19″ S, 70°31′20″ W) (Figure 1). Aerial vegetation cover was 45%, where 34% were grasses and 11% were shrubs. Above ground net primary productivity of this steppe is 300 kg dry matter per hectare per year. Climate is semiarid, with a mean annual temperature of 7.7 °C and a mean annual precipitation of 258.4 mm, 70% of which occurs in winter between May to September. Winters are wet and cold and summers are temperate and dry [18]. Climate variables during studied period were close to the historic average. Annual precipitation was 196.8 mm in 2015 and 252 mm in 2016. Mean temperature was 7.3 °C in 2015 and 9.1 °C in 2016.

2.2. Experimental Design

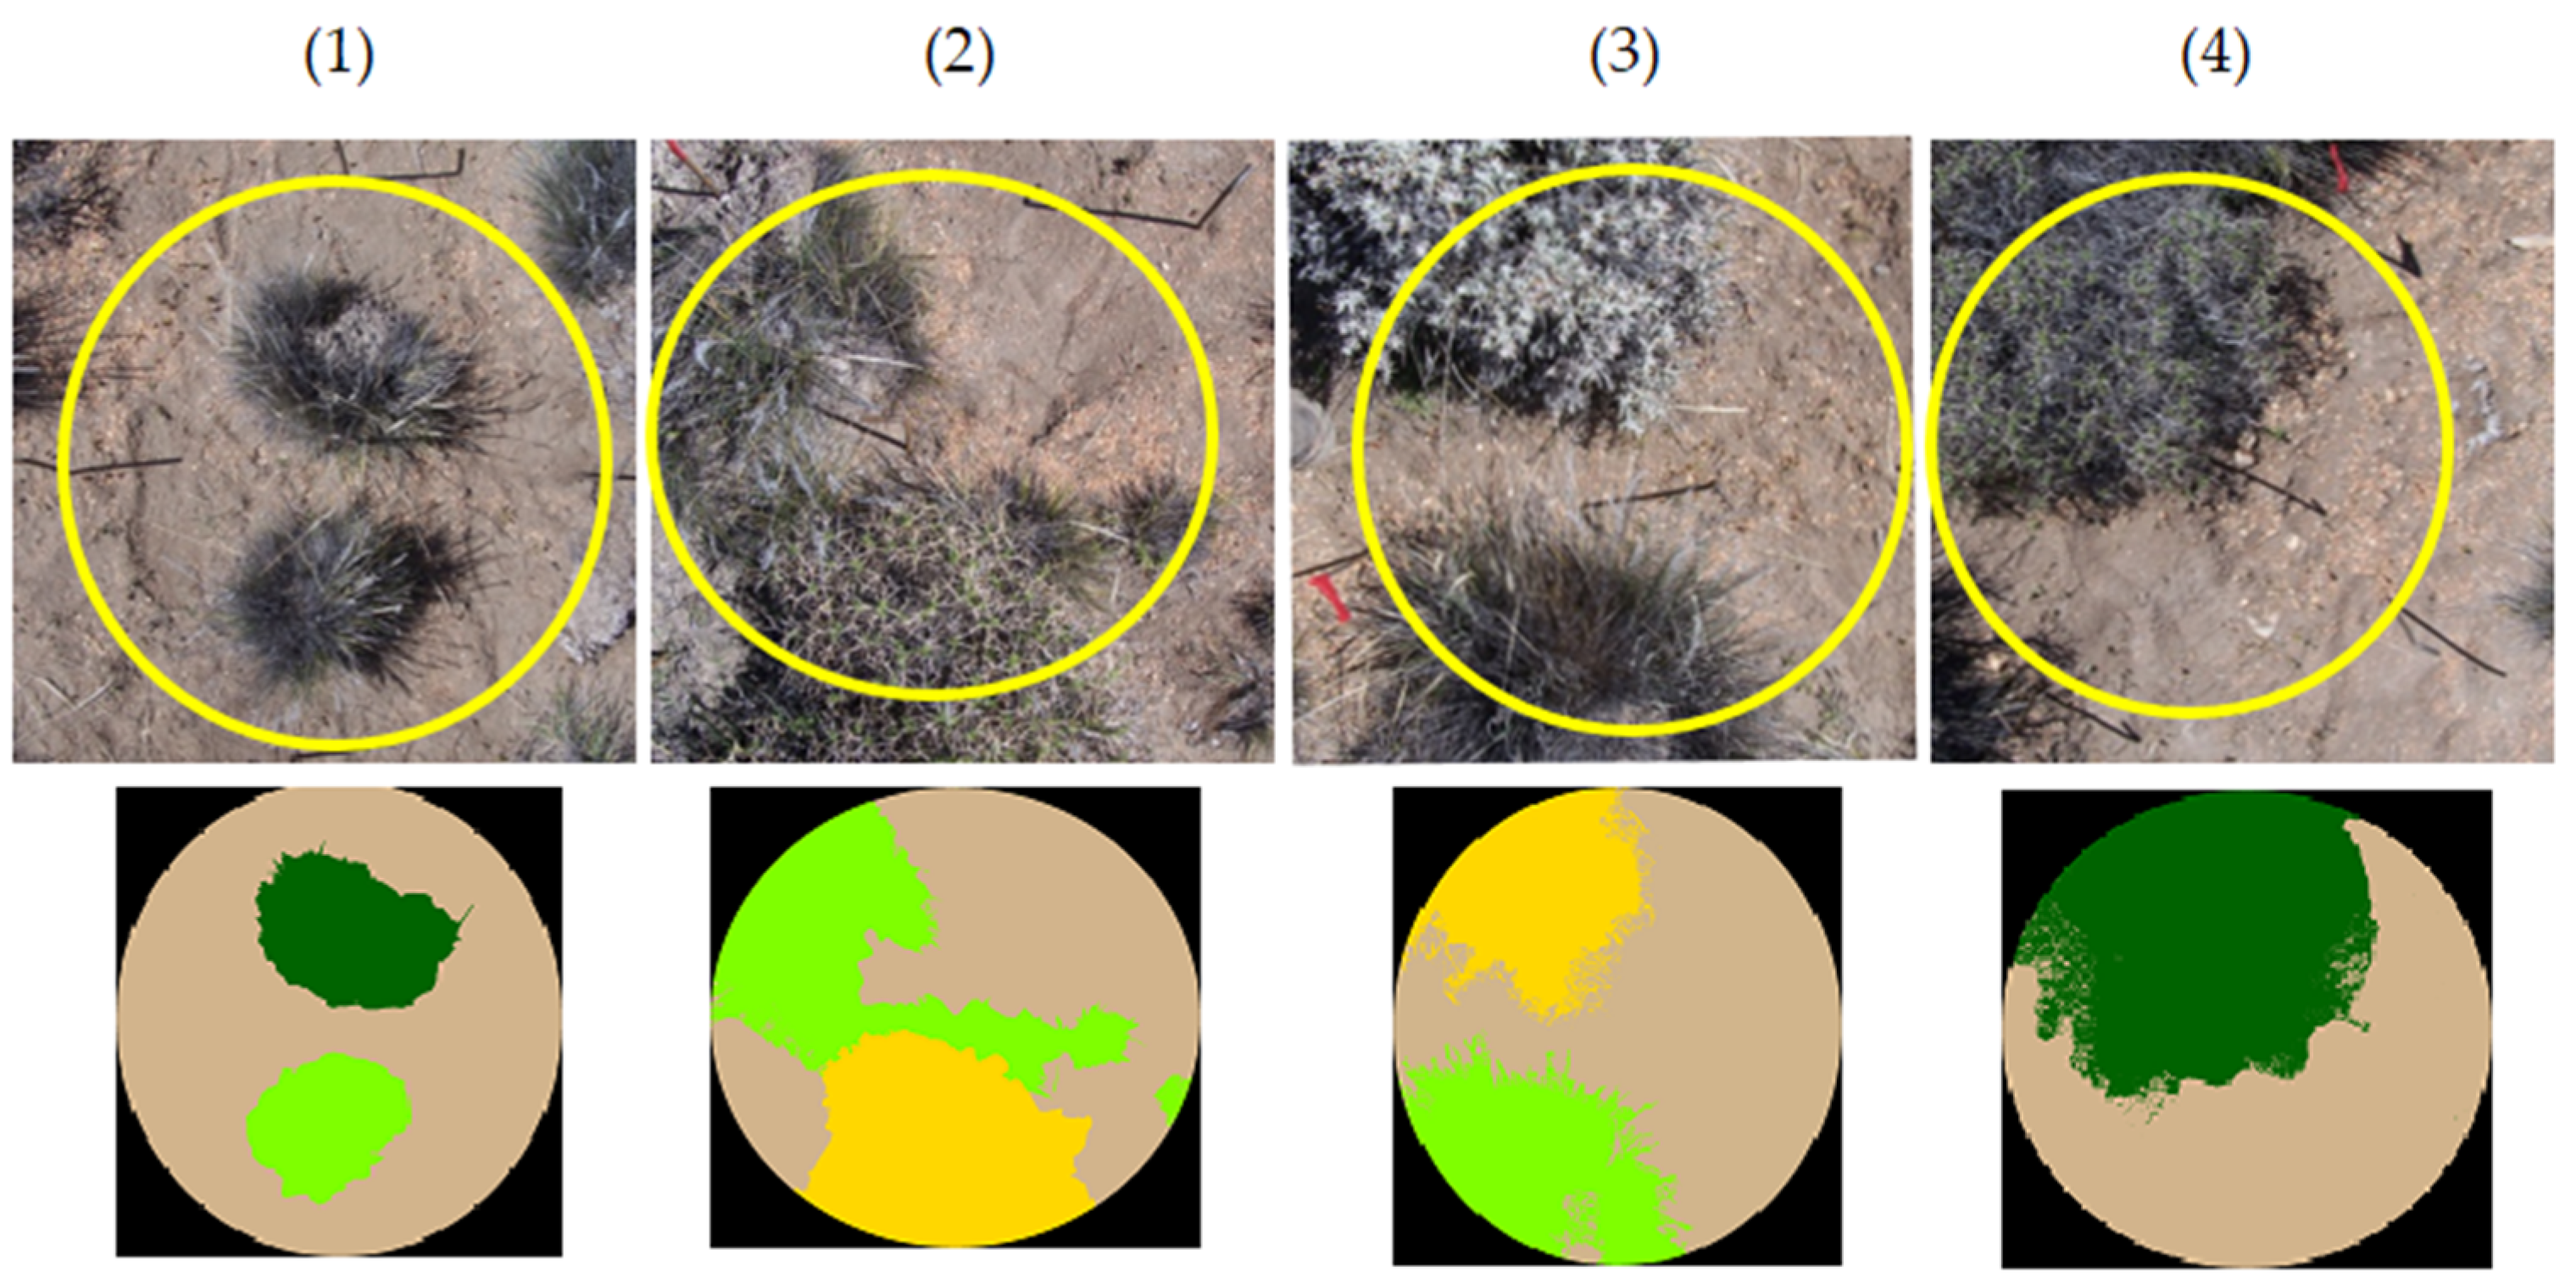
Four type of patches were identified as the main representatives of the studied steppe [19]. Different structure and species composition were defined in the field: (i) Grasses, Poa ligularis Nees ex Steud. and Pappostipa speciosa (Trin. and Rupr.) Romasch. and bare soil, (ii) Deciduous shrub, Azorella prolifera (Cav.) G.M. Plunkett and A.N. Nicolas, grass Poa ligularis and bare soil, (iii) Perennial shrub Senecio filaginoides DC. var. filaginoides, grass Poa ligularis and bare soil, and (iv) Deciduous Shrub Azorella prolifera and bare soil. Patches size was 0.5 square meter. Aerial cover of each patch component was estimated with a supervised classification of RGB photographs, respectively (Table 1, Figure 2). Three replicates of each type of patch and individual components were permanently marked in the field. All the species evaluated are representative of the study site, and account for almost the 75% of total vegetation cover.

2.3. Surface Reflectance Measurements

Surface reflectance of patches and patches components (vegetation species and bare soil) were measured with a spectrometer (Ocean Optics, JAZ) connected to an optic fiber of 100 μm, which recorded reflectance from the range of visible (400 nm) to near infrared (850) spectrum, with a vision angle of 25.4°. Measurements were made at a perpendicular position between the optical fiber and soil or vegetation surfaces. Patches were measured at a 1.75 m height to reach a measurement area of 0.5 square meter, whereas for individual components, sensor height was 0.5 m, to reach a measurement area of 0.04 square meter. A Red–Green–Blue (RGB) photograph of patches were also obtained to perform a supervised classification of the components (Figure 2), respectively. This classification was used to calculate the proportions of area occupied by each component (Table 1). Hence, NDVI was estimated at a patch level from the weighted contribution of each component as a function of their area cover, respectively. Measurements of surface reflectance were conducted every 40 days between October 2015 and March 2017 and were done under cloudless conditions at midday, to minimize effects derived from changes in solar angle. However, some observations were omitted from the analysis due to highly anomalous data (for example, data with more than 50% of difference from the earlier or later dates), most likely caused by sensor calibration problems during the measurement. From the original spectral data, we calculated NDVI for each date (Equation (1)), and we compiled them into a temporal series for each component, respectively.
NDVI = (ρNIR − ρR)/(ρNIR + ρR)
where ρNIR and ρR are the surface reflectances centered at 800 nm (near-infrared) and 650 nm (visible) portions of the electromagnetic spectrum, respectively.

3. Results

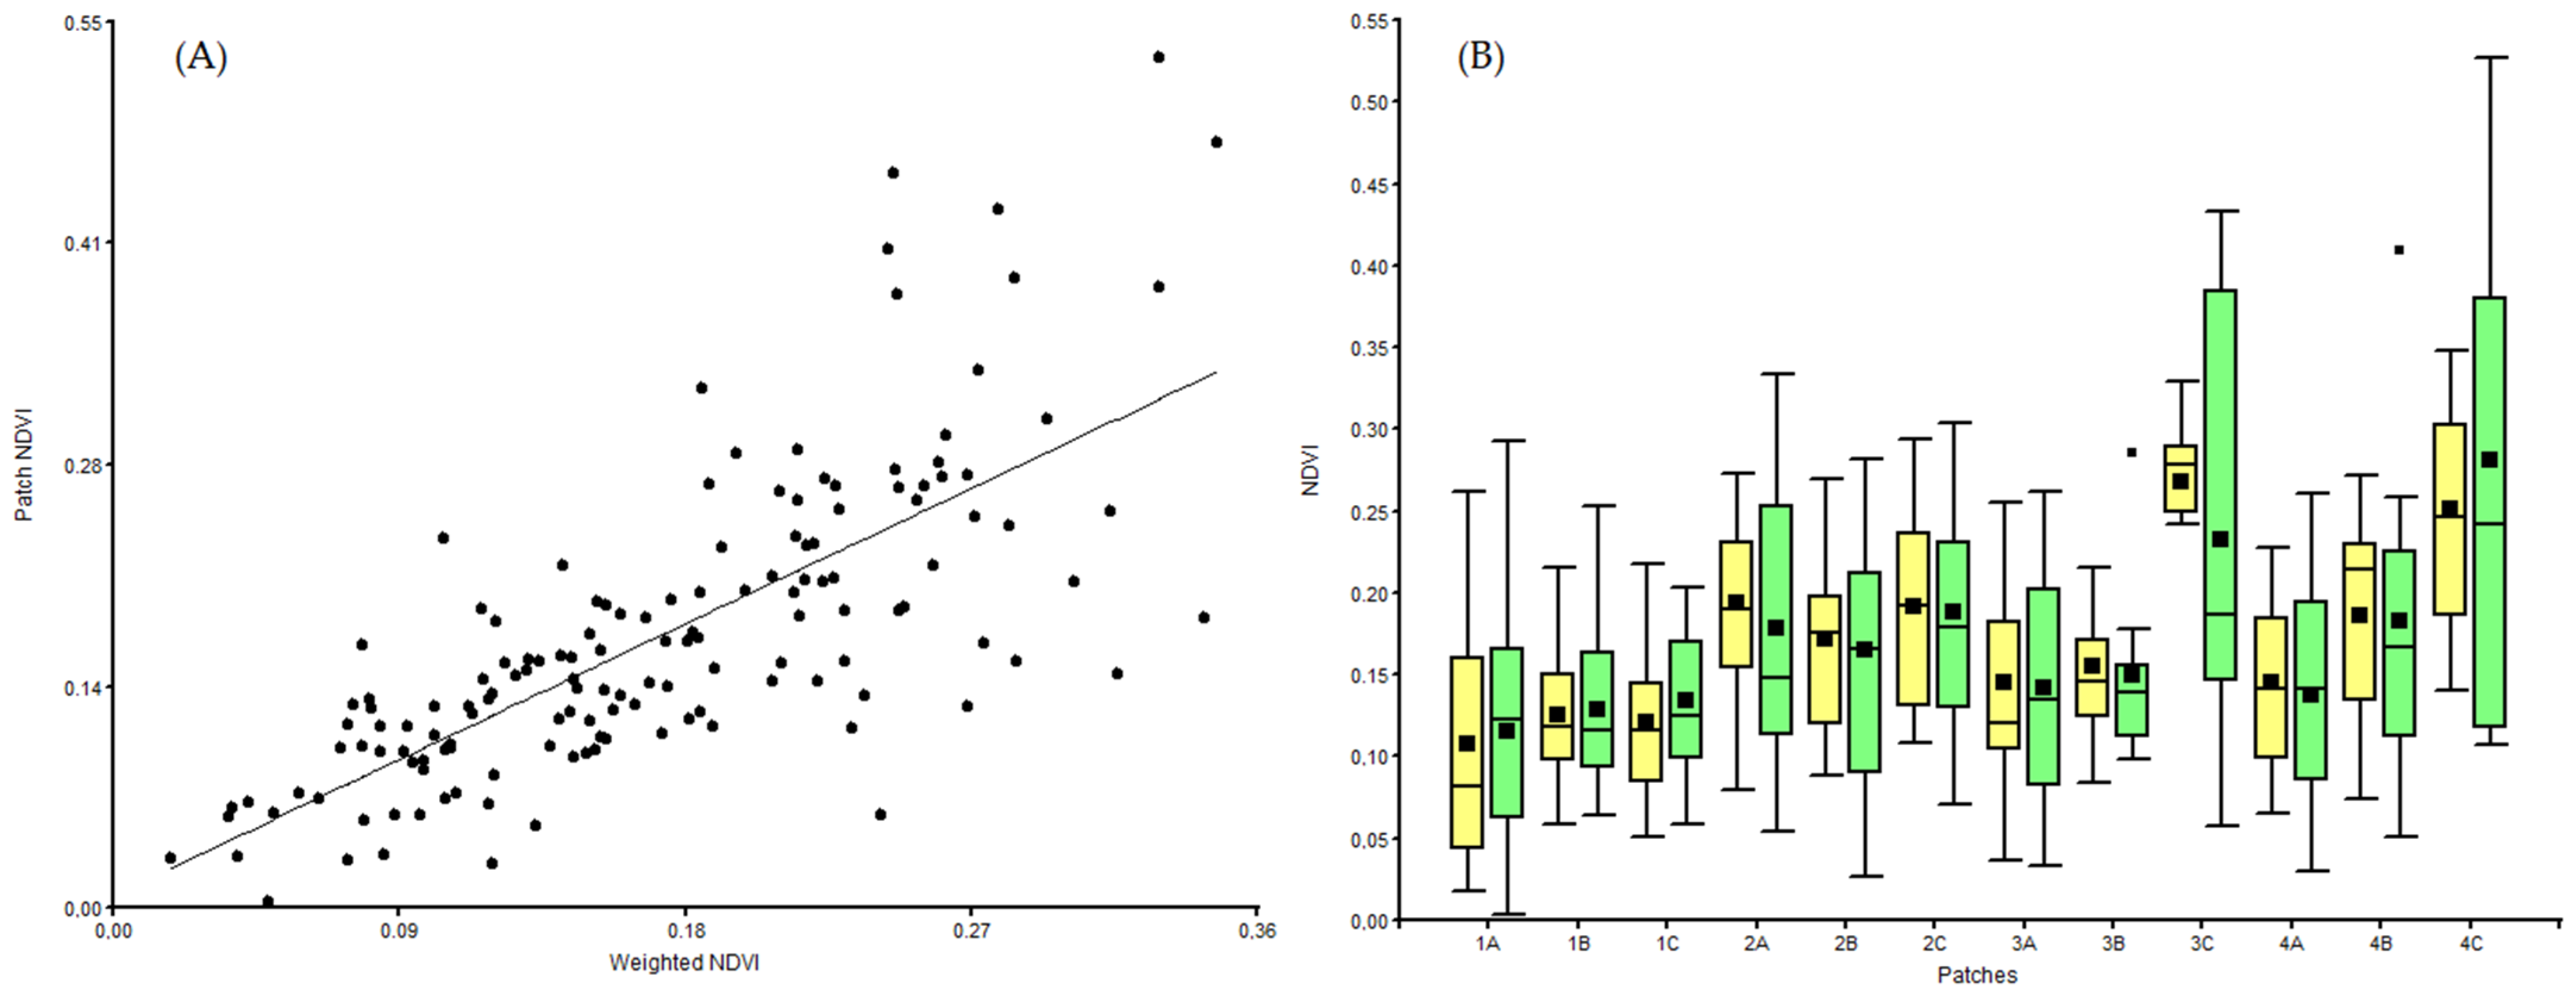
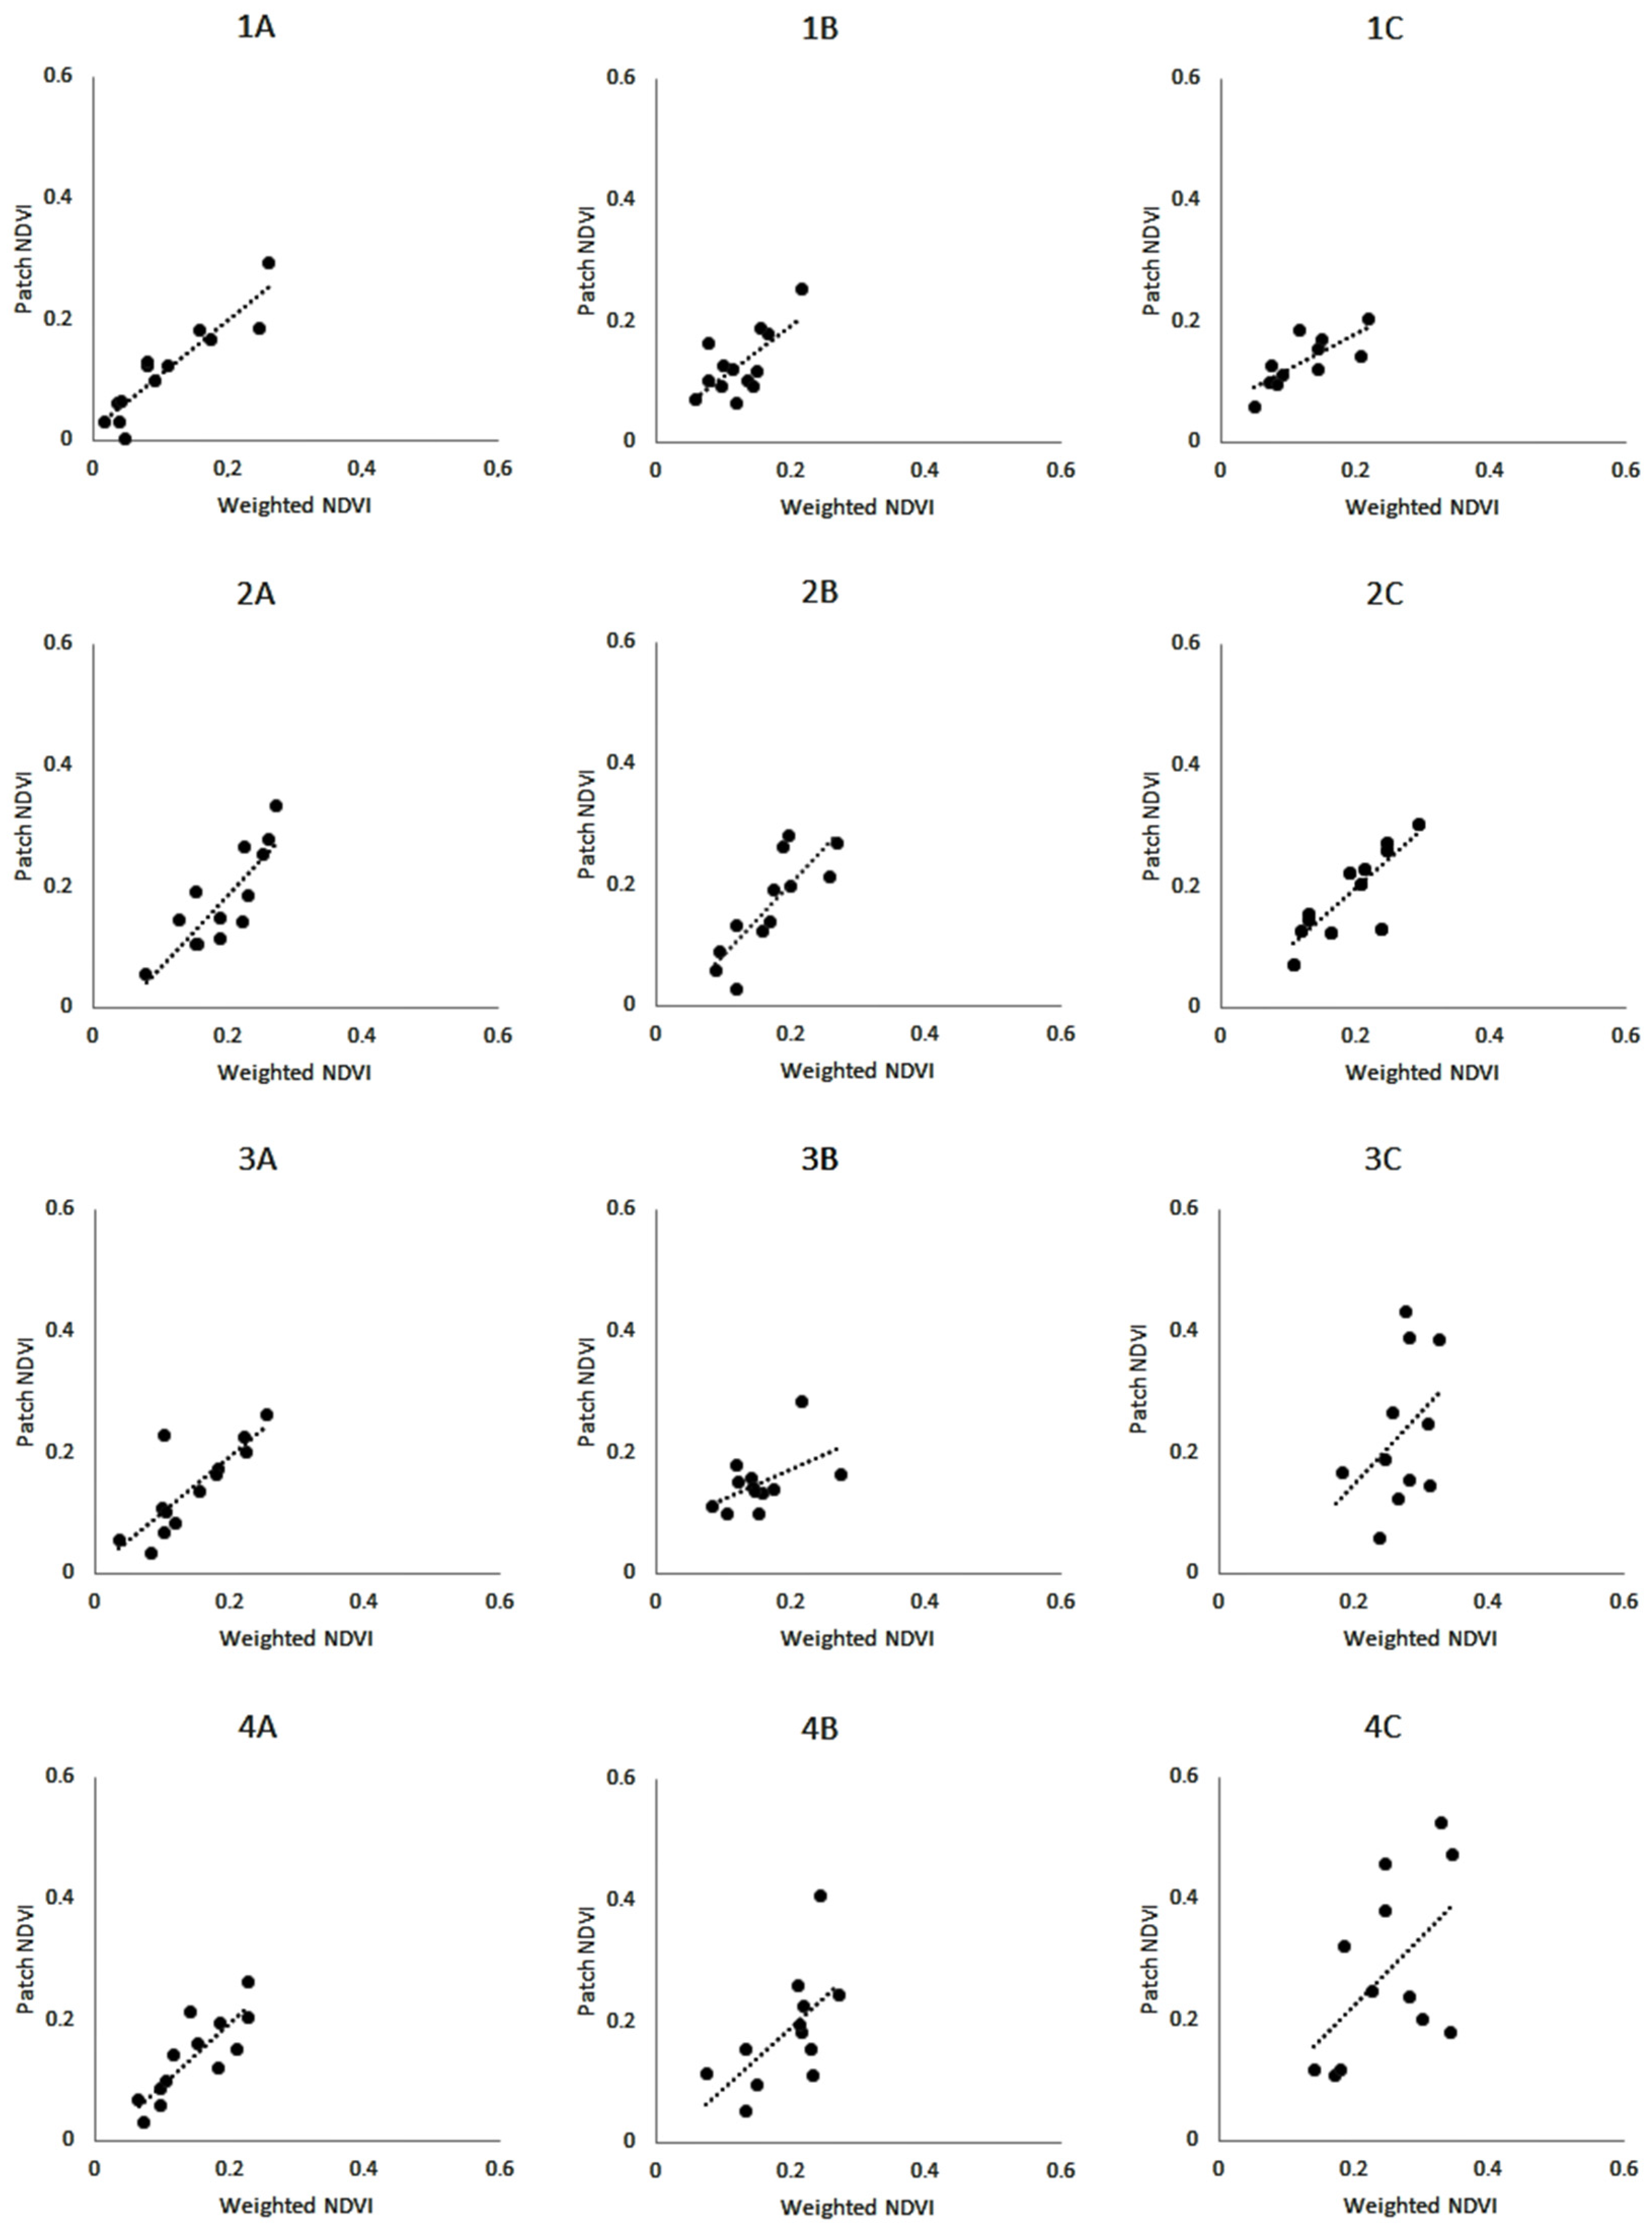
A positive linear relationship was recorded between patch NDVI as a function of individual NDVI values weighted by area cover of vegetation and bare soil components, and the NDVI at the patch level, for the whole set of measurements (Figure 3A). This linear relationship was significantly recorded in all grass and deciduous shrub–grass patches, whereas two thirds of perennial shrub–grass patches assessed recorded a non-significant linear relationship (Figure 4). Patches composed by deciduous or perennial shrubs recorded more variability than perennial grass patches (Figure 3B).

4. Discussion

The assumptions of the additive contribution of shrubs, grasses and bare soil components and the total biophysical variable at a patch level, as well as the linear relationship between a biophysical variable and a remote sensing vegetation index [13], were assessed in a grass–shrub steppe from North-West Patagonia, Argentina. First, the contribution of the patch components (i.e., different vegetation types and bare soil) to the total NDVI value at a patch level was additive. Second, the relationship between the weighted NDVI values as a function of the cover area of each component and the concomitant NDVI value at a patch level along time was linear for grass and deciduous shrub–grass patches, which constitute the most frequent patches of the study area. However, linearity was not significant for most perennial shrub–grass patches, which are less frequent in the studied steppe.
On the one hand, these results confirm the strong relationship between structural features, as measured by vegetation cover and the functional property of vegetation photosynthetic activity, by means of NDVI [20]. Studies of temporal oscillations of NDVI series aimed at distinguishing the contributions from different vegetation cover suggest a weak annual phenological wave of woody vegetation and a strong annual dynamics of herbaceous vegetation [13,14,15]. Whereas our results cannot be interpreted from a temporal dimension due to the short studied period (1.5 years), there was a tendency towards higher and more variable NDVI records in patches with shrubs, suggesting higher temporal contrasts than perennial grass patches (Figure 3B). In particular, results suggest that patches dominated by deciduous or perennial shrubs may have different surface reflectance among each other, which need more research.
There is a growing consensus that an accurate monitoring of shrub encroachment needs to link field observations, repeated ground-level photography and remote sensing perspectives [21]. Recent studies suggest that satellite-derived NDVI data might miss critical responses of vegetation growth to global climate change, potentially due to long-term shifts in plant community composition [22]. Herbaceous vegetation was recorded to be the most responsive to moderate grazing disturbances with respect to changes in phenology and productivity metrics [23]. However, our results shows that differences among patch compositions and their surface reflectance along time emphasize the need for a more accurate distinction of the floristic composition of patches to better understanding their relative contribution to NDVI temporal dynamics at a landscape scale. On the other hand, bare soil is a key component with influence on surface reflectance, which may have bidirectional reflectance [24] or vary due to changes in soil moisture [25]. Whereas results suggest a linear influence of bare soil in most patches, further research is needed in the influence of changes in the surface of soil composition at a field level, such as in the case of ash deposits occurred in Patagonia [26].
Future studies should focus on the relationship between NDVI temporal dynamics and vegetation composition at different nested hierarchical levels (e.g., species, patch, landscape unit). For instance, sub-pixel decomposition based on cover area classifications using hyperspectral reflectance [27] or multispectral images obtained from unmanned aerial vehicles (UAV) can be used in combination with satellite NDVI temporal series [28,29]. These applications aimed at moving forward in the integration of patches diversity at a landscape scale in arid and semi-arid grasslands.

Author Contributions

Conceptualization, C.F. and M.H.E.; methodology, C.F., V.A. and M.H.E.; validation, C.F., V.A. and M.H.E.; formal analysis, C.F., M.H.E., D.P., F.U. and O.A.B.; investigation, C.F., M.H.E., D.P. and O.A.B.; resources, C.F. and M.H.E.; data curation, C.F., V.A., V.M.A., F.U. and M.H.E.; writing—original draft preparation, C.F., M.H.E., D.P. and V.M.A.; writing—review and editing, M.H.E., D.P. and V.M.A.; visualization, F.U. and M.H.E.; supervision, M.H.E., D.P. and V.M.A.; project administration, C.F. and M.H.E.; funding acquisition, C.F. and M.H.E. All authors have read and agreed to the published version of the manuscript.

Funding

This research was funded by INTA, grants number PRET-1281101 and PE-I504.

Institutional Review Board Statement

Not applicable.

Informed Consent Statement

Not applicable.

Data Availability Statement

Not applicable.

Acknowledgments

We warmly thank Guillermo Siffredi for experimental design suggestions and field assistance.

Conflicts of Interest

The authors declare no conflict of interest. The funders had no role in the design of the study; in the collection, analyses, or interpretation of data; in the writing of the manuscript; or in the decision to publish the results.

References

  1. Buzzi, M.A.; Rueter, B.L.; Ghermandi, L. Multiple spectral indices to predict the variability of structural and functional attributes in arid areas. Ecol. Austral 2017, 27, 055–062. [Google Scholar] [CrossRef]
  2. Tucker, C.J. Red and photographic infrared linear combinations for monitoring vegetation. Remote Sens. Environ. 1979, 8, 127–150. [Google Scholar] [CrossRef]
  3. Paruelo, J.M.; Jobbágy, E.G.; Sala, O.E. Current distribution of ecosystem functional types in temperate South America. Ecosystems 2001, 4, 683–698. [Google Scholar] [CrossRef]
  4. McNaughton, S.J.; Oesterheld, M.; Frank, D.A.; Williams, K.J. Ecosystem-level patterns of primary productivity and herbivory in terrestrial habitats. Nature 1989, 341, 142–144. [Google Scholar] [CrossRef] [PubMed]
  5. Bradley, B.A.; Jacob, R.W.; Hermance, J.F.; Mustard, J.F. A curve fitting procedure to derive inter-annual phenologies from time series of noisy satellite NDVI data. Remote Sens. Environ. 2007, 106, 137–145. [Google Scholar] [CrossRef]
  6. Borak, J.S.; Lambin, E.F.; Strahler, A.H. The use of temporal metrics for land cover change detection at coarse spatial scales. Int. J. Remote Sens. 2000, 21, 1415–1432. [Google Scholar] [CrossRef]
  7. Hall-Beyer, M. Comparison of single-year and multiyear NDVI time series principal components in cold temperate biomes. IEEE Trans. Geosci. Remote Sens. 2003, 41, 2568–2574. [Google Scholar] [CrossRef]
  8. Kariyeva, J.; Van Leeuwen, W.J. Environmental drivers of NDVI-based vegetation phenology in Central Asia. Remote Sens. 2011, 3, 203–246. [Google Scholar] [CrossRef]
  9. Easdale, M.H.; Bruzzone, O.; Mapfumo, P.; Tittonell, P. Phases or regimes? R evisiting NDVI trends as proxies for land degradation. Land Degrad. Dev. 2018, 29, 433–445. [Google Scholar] [CrossRef]
  10. Bruzzone, O.; Easdale, M.H. Archetypal temporal dynamics of arid and semi-arid rangelands. Remote Sens. Environ. 2021, 254, 112279. [Google Scholar] [CrossRef]
  11. Easdale, M.H.; Perri, D.; Bruzzone, O.A. Arid and semiarid rangeland responses to non-stationary temporal dynamics of environmental drivers. Remote Sens. Appl. Soc. Environ. 2022, 27, 100796. [Google Scholar] [CrossRef]
  12. Jiang, P.; Ding, W.G.; Yuan, Y.; Hu, L.; Ye, W. Identifying trend shifts in vegetation greenness in China from 1982 to 2015. Land Degrad. Dev. 2022, 33, 1434–1445. [Google Scholar] [CrossRef]
  13. Lu, H.; Raupach, M.R.; McVicar, T.R.; Barrett, D.J. Decomposition of vegetation cover into woody and herbaceous components using AVHRR NDVI time series. Remote Sens. Environ. 2003, 86, 1–18. [Google Scholar] [CrossRef]
  14. Blanco, L.J.; Paruelo, J.M.; Oesterheld, M.; Biurrun, F.N. Spatial and temporal patterns of herbaceous primary production in semi-arid shrublands: A remote sensing approach. J. Veg. Sci. 2016, 27, 716–727. [Google Scholar] [CrossRef]
  15. Archibald, S.; Scholes, R.J. Leaf green-up in a semi-arid African savanna-separating tree and grass responses to environmental cues. J. Veg. Sci. 2007, 18, 583–594. [Google Scholar]
  16. Duncan, J.; Stow, D.; Franklin, J.; Hope, A. Assessing the relationship between spectral vegetation indices and shrub cover in the Jornada Basin, New Mexico. Int. J. Remote Sens. 1993, 14, 3395–3416. [Google Scholar] [CrossRef]
  17. León, R.J.; Bran, D.; Collantes, M.; Paruelo, J.M.; Soriano, A. Grandes unidades de vegetación de la Patagonia extra andina. Ecol. Austral 1998, 8, 125–144. [Google Scholar]
  18. Godagnone, R.E.; Bran, D. (Eds.) Inventario Integrado de Los Recursos Naturales de La Provincia de Río Negro: Geología, Hidrogeología, Geomorfología, Suelos, Clima, Vegetación y Fauna; Ediciones INTA: Buenos Aires, Argentina, 2009; p. 392.
  19. Aguiar, M.R.; Sala, O.E. Patch structure, dynamics and implications for the functioning of arid ecosystems. Trends Ecol. Evol. 1999, 14, 273–277. [Google Scholar] [CrossRef]
  20. Davison, J.E.; Breshears, D.D.; Van Leeuwen, W.J.; Casady, G.M. Remotely sensed vegetation phenology and productivity along a climatic gradient: On the value of incorporating the dimension of woody plant cover. Glob. Ecol. Biogeogr. 2011, 20, 101–113. [Google Scholar] [CrossRef]
  21. Huang, C.Y.; Archer, S.R.; McClaran, M.P.; Marsh, S.E. Shrub encroachment into grasslands: End of an era? PeerJ 2018, 6, e5474. [Google Scholar] [CrossRef] [PubMed]
  22. Wang, H.; Liu, H.; Huang, N.; Bi, J.; Ma, X.; Ma, Z.; Shangguan, Z.; Zhao, H.; Feng, Q.; Liang, T.; et al. Satellite-derived NDVI underestimates the advancement of alpine vegetation growth over the past three decades. Ecology 2021, 102, e03518. [Google Scholar] [CrossRef] [PubMed]
  23. Balata, D.; Gama, I.; Domingos, T.; Proença, V. Using Satellite NDVI Time-Series to Monitor Grazing Effects on Vegetation Productivity and Phenology in Heterogeneous Mediterranean Forests. Remote Sens. 2022, 14, 2322. [Google Scholar] [CrossRef]
  24. Cierniewski, J.; Courault, D. Bidirectional reflectance of bare soil surfaces in the visible and near-infrared range. Remote Sens. Rev. 1993, 7, 321–339. [Google Scholar] [CrossRef]
  25. Kaleita, A.L.; Tian, L.F.; Hirschi, M.C. Relationship between soil moisture content and soil surface reflectance. Trans. ASAE 2005, 48, 1979–1986. [Google Scholar] [CrossRef]
  26. Easdale, M.H.; Bruzzone, O. Spatial distribution of volcanic ash deposits of 2011 Puyehue-Cordón Caulle eruption in Patagonia as measured by a perturbation in NDVI temporal dynamics. J. Volcanol. Geotherm. Res. 2018, 353, 11–17. [Google Scholar] [CrossRef]
  27. Irisarri, J.G.N.; Oesterheld, M.; Verón, S.R.; Paruelo, J.M. Grass species differentiation through canopy hyperspectral reflectance. Int. J. Remote Sens. 2009, 30, 5959–5975. [Google Scholar] [CrossRef]
  28. Easdale, M.H.; Umaña, F.; Raffo, F.; Fariña, C.; Bruzzone, O. Evaluación de pastizales patagónicos con imágenes de satélites y de vehículos aéreos no tripulados. Ecol. Austral 2019, 29, 306–314. [Google Scholar] [CrossRef]
  29. Zhao, Y.; Liu, X.; Wang, Y.; Zheng, Z.; Zheng, S.; Zhao, D.; Bai, Y. UAV-based individual shrub aboveground biomass estimation calibrated against terrestrial LiDAR in a shrub-encroached grassland. Int. J. Appl. Earth Obs. Geoinf. 2021, 101, 102358. [Google Scholar] [CrossRef]
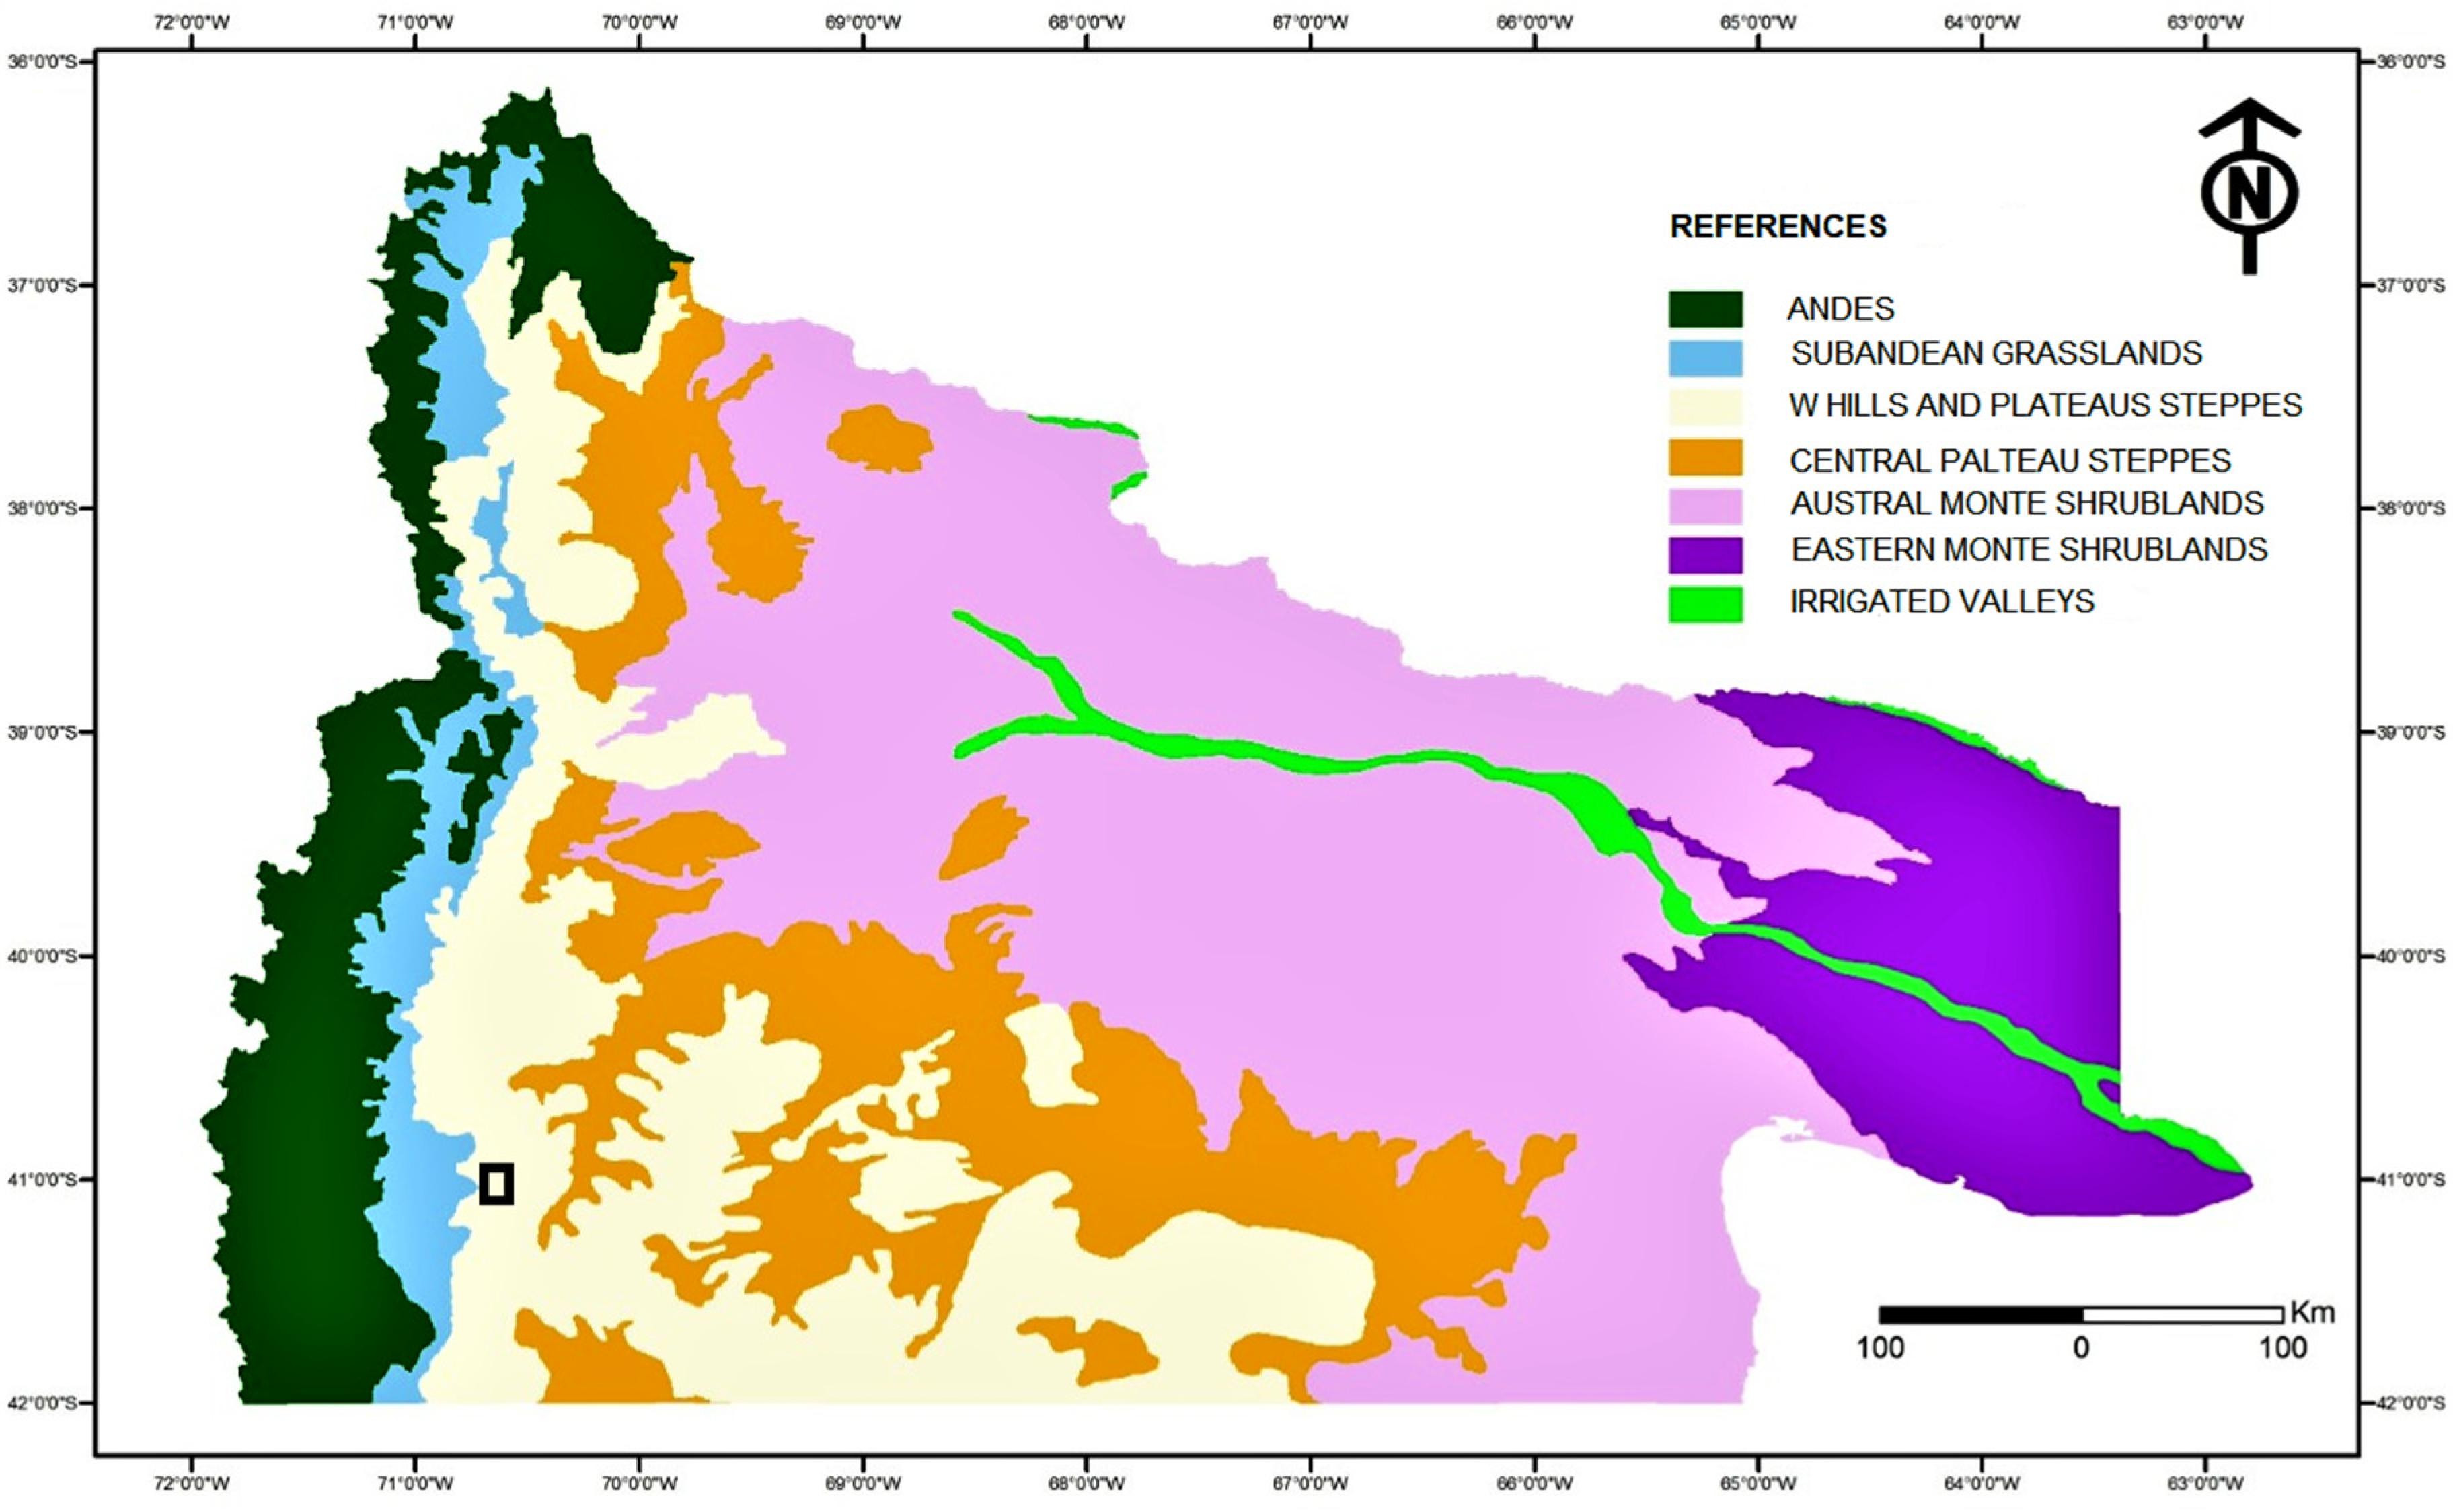
Figure 1. Study area (black rectangle). Biozones in North Patagonia, Argentina.
Grasses 02 00003 g001
Figure 2. Examples of different compositions of patches (0.5 square meter): (1) Perennial grasses (Poa ligularis, Pappostipa speciosa and bare soil), (2) Deciduous shrub-grass (Azorella prolifera, Poa ligularis and bare soil), (3) Perennial shrub-grass (Senecio filaginoides, Poa ligularis and bare soil), (4) Deciduous shrub (Azorella prolifera and bare soil). Below the photographs are the images of the performed classification to estimate area cover of each component (vegetation: green and yellow), bare soil (light brown), respectively. It should be noticed that only four of the twelve patches are shown as examples of the used procedure.
Grasses 02 00003 g002
Figure 3. (A) Linear regression between weighted and patch NDVI measurements—black dots—(y = 0.01 + 0.94x; R2 = 0.55, Adjusted R2 = 0.55, p < 0.0001). (B) Box-plots of NDVI values between October 2015 and March 2017 for weighted (yellow) and patch level (green) measurements, for the patches 1: Perennial grasses, 2: Deciduous shrub–grass, 3: Perennial shrub–grass, 4: Deciduous shrub, with their respective replicates: A, B and C (Table 1).
Grasses 02 00003 g003
Figure 4. Linear regressions between weighted and patch NDVI measurements (black dots) between October 2015 and March 2017, for the different patches: (1) Perennial Grasses, (1A) y = 0.02 + 0.91x; R2 = 0.84, AdjR2 = 0.83, p < 0.0001; (1B) y = 0.02 + 0.85x; R2 = 0.46, AdjR2 = 0.42, p = 0.0103; (1C) y = 0.06 + 0.59x; R2 = 0.57, AdjR2 = 0.52, p = 0.0074; (2) Deciduous Shrub-Grass, (2A) y = −0.05 + 1.19x; R2 = 0.69, AdjR2 = 0.67, p = 0.0004; (2B) y = −0.04 + 1.18x; R2 = 0.67, AdjR2 = 0.64, p = 0.0012; (2C) y = −1.5 × 10⁻³ + 0.99x; R2 = 0.70, AdjR2 = 0.67, p = 0.0007; (3) Perennial Shrub-Grass, (3A) y = 0.01 + 0.93x; R2 = 0.65, AdjR2 = 0.62, p = 0.0008; (3B) y = 0.07 + 0.50x; R2 = 0.26, AdjR2 = 0.19, p = 0.0902; (3C) y = −0.10 + 1.20x; R2 = 0.16, AdjR2 = 0.06, p = 0.2301; and (4) Deciduous Shrub, (4A) y = −0.01 + 0.99x; R2 = 0.69, AdjR2 = 0.66, p = 0.0004; (4B) y = −0.01 + 0.99x; R2 = 0.37, AdjR2 = 0.30, p = 0.0367; (4C) y = −3.2 × 10⁻³ + 1.13x; R2 = 0.29, AdjR2 = 0.22, p = 0.0697. Reference: Adjusted R2 (AdjR2).
Grasses 02 00003 g004
Table 1. Area cover (%) of the different vegetation and bare soil components of patches, for the different replicates, respectively (letters). References: Poa Ligularis (PL), Pappostipa speciosa (PS), Azorella prolifera (AP), Senecio filaginoides (SF), Bare Soil (BS).
PatchesArea (%)
TypeReplicatesPLPSAPSFBS
1. GrassA1014--76
B1223--65
C1631--53
2. Deciduous shrub–grassA14-46-40
B19-33-48
C27-26-47
3. Perennial shrub–grassA21--1960
B20--1862
C26--4529
4. ShrubA--34-66
B--44-56
C--51-49
Disclaimer/Publisher’s Note: The statements, opinions and data contained in all publications are solely those of the individual author(s) and contributor(s) and not of MDPI and/or the editor(s). MDPI and/or the editor(s) disclaim responsibility for any injury to people or property resulting from any ideas, methods, instructions or products referred to in the content.