Article

The Postmortem Evaluation of Anatomical Thymic Parameters in the Context of Age, Cause of Death, Sex, and Body Mass Index in the Elderly Human Population

Department of Biomedical Sciences, Kentucky College of Osteopathic Medicine, University of Pikeville, Pikeville, KY 41501, USA
*
Author to whom correspondence should be addressed.
Lymphatics 2024, 2(2), 83-96; https://doi.org/10.3390/lymphatics2020007
Submission received: 25 March 2024 / Revised: 22 April 2024 / Accepted: 6 May 2024 / Published: 9 May 2024

Abstract

:
The studies of thymic structure were performed predominantly in cohorts of younger individuals. Here, we established a cohort of body donors whose age at the time of death ranged from 57 to 103 to study the relationship between thymic structure and factors that, in the younger subjects, have shown to affect the organ’s anatomy, including the presence of the organ’s capsule, its weight, size of the left and right lobes, and a transverse diameter. We explored the relationships between these thymic parameters and the subjects’ age, sex, and cause of death (COD), asking how the thymus in the elderly differed from the organ’s macro-anatomy in a broader and younger human population, and whether age, sex, COD, and BMI could influence the thymic parameters in the elderly. Our analyses revealed that the thymic size but not thymic weight in the KYCOM cohort differed significantly from the younger individuals. The size of the thymus in males progressively decreased, but in females, the size of the right lobe increased. The encapsulated thymus was detected with a higher frequency in females than males. We found no associations between thymic parameters and the person’s COD, age, or sex. However, the person’s BMI was associated with thymic weight, suggesting that obesity may influence the aging of the immune system.

1. Introduction

The aging of the immune system has been well studied in the context of changes that occur in the secondary lymphatic organs [1,2]. However, for many years, the studies of thymic involution rested on the persisting view that the thymic role in immune responses ends on or about the first seven years of life. As such, these studies did not include elderly human subjects because the reason for the immunosenescence was ascribed solely to the aging of the thymus [3]. This tenet arose from using murine animal models to study thymic development and aging [4], as human thymic tissue is scarce and may be obtained either postmortem or from thymectomy in cases of morbid pathologies. However, because the aging and immune fitness processes depend in humans on different factors than in rodents, the data describing the thymic aging in animals offered only a glimpse of the human thymic function and structural changes.
The thymus is a vital lymphoid organ responsible for producing T-cells that recognize foreign antigens and stimulate an adaptive immune response [5,6,7,8,9,10,11]. The thymus is most active in early life and undergoes a drastic decrease in its production of T-cells starting around puberty. At that time, the thymus also begins the process of involution, where thymic epithelial tissue is replaced with adipose tissue [11,12,13,14,15]. Despite this change in the structure and function of the immune system, some functional thymic tissue remains at the end of a person’s life [14,16,17].
There is a consensus supported by multiple studies that, because of involution, the size and weight of the normal thymus decreases with age [18,19,20,21]. However, there is a difference in the kinetics of thymic aging between sexes. For example, the onset of involution in females can be delayed by 10–20 years compared to males [18], which may be influenced by the function of sex hormones [14,21,22,23,24]. These findings suggest that the function of the thymus in females may be preserved longer into adulthood, particularly in light of new data indicating that the thymus is required in adulthood to maintain the immune defense mechanisms [25].
Aging and obesity are two major contributors to thymic involution and immunosenescence [7,26,27,28]. In the elderly population, the decline in the function of the immune system can lead to increased susceptibility to diseases, including infections or cancer, and an increase in inflammation, contributing to the development of cardiovascular and Alzheimer’s diseases [29]. However, obesity also suppresses the immune system [14,18] and is linked to the development of many health problems associated with immunosenescence, including type II diabetes, cancer, and cardiovascular disease [30,31]. For example, people with a higher body mass index (BMI) may have increased rates of fatty replacement and the accelerated aging of the thymus, including a declined output of naïve T cells than those with a lower BMI index [18,32,33,34]. Additionally, an animal study showed that obesity in younger mice caused T cell exhaustion and Treg expansion similar to age-mediated thymic involution [28]. Because aging can no longer be considered the sole factor contributing to immunosenescence in older adults, it is imperative to determine what factors alter thymic anatomy in the elderly population.
The studies on the involution of the human thymus are inherently difficult because the tissue may be obtained either postmortem or from thoracic surgeries and thymectomies. The most extensive studies of thymic appearance utilizing the computed tomography (CT) scans were performed in a cohort of 2540 participants [18]. Meanwhile, another research group studied the thymic weight independently in 574 necropsies [20]. Interestingly, both cohorts comprised a population representing a broad age range from late childhood to 65+ years of age. Therefore, there is a paucity of research examining the thymus solely in the elderly population until death. Particularly, if the elderly display all hallmarks of immunosenescence, such as inadequate responses to infections, tumor formations, or increased autoimmune reactions [35].
For the current study, we established a KYCOM (Kentucky College of Osteopathic Medicine) cohort characterized by the advanced age of its subjects, averaging 83.77 years old at the time of death, to determine how thymic anatomy may support immune fitness in the late stage of life. To meet our research goal, we explored the relationships between subjects’ age, sex, cause of death (COD), and BMI in the context of thymic anatomy in the elderly population. We applied a two-fold approach: (1) we analyzed how thymus in the aged KYCOM cohort differed from the organ’s anatomy in a broader and younger human population using hypothetical means for thymic size and weight; and (2) we tested hypotheses whether thymic measurements in the elderly were equal in the context of unmatched groups representing different age, sex, COD, and BMI.

2. Results

2.1. Description of the KYCOM Cohort

All subjects were grouped into one of four age groups defined as young-old 55–75 (n = 15), middle-old 76–85 (n = 16), old-old 86–95 (n = 26), and outliers 96+ (n = 6) (Table 1). In the group of outliers, one subject was 96 years old at the time of death; two subjects died at the age of 97, two at the age of 98, and one at the age of 103. The mean age of all subjects in the KYCOM cohort was 83.77. The body donors were predominantly white (n = 59), and 60% of subjects were female (n = 38) (Table 1).
Each subject was assigned to one of the five leading causes of death (COD) categories in the elderly human population: infection, trauma, cancer, organ failure, and cognitive disorders. We based this classification on the list of the leading causes of death by the Centers for Disease Control and Prevention (CDC) [36]. As shown in Table 1, the leading CODs in the KYCOM cohort were organ failures (n = 36) and cancer (n = 12). Deaths related to trauma (n = 3) were caused by hip fractures and blunt force head injury, and all deaths related to cognitive disorders (n = 6) arose from Alzheimer’s disease. There was not a single COVID-related death in the infection group (n = 6), which mainly represented cases of septicemia or pneumonia.
Based on our calculations, there were n = 36 subjects classified as having a low/normal BMI (BMI ≤ 24.9) and n = 27 subjects classified as having an elevated BMI at the time of death (BMI ≥ 25.0) (Table 1). The range of BMI in the KYCOM cohort spanned from 17.2 to 38.4, with an average BMI of 22.86.
Almost half of the subjects in the young-old age group passed due to some form of cancer, making it the most common cause of death in this age group (Figure 1). Deaths related to cancer in the older age groups steadily declined with increasing age. Only one subject in the old-old and outliers age group passed away from cancer. Organ failure was the leading cause of death for the oldest three age groups, with 50% or more of the subjects having this COD on the death certificate (Figure 1B–D). These findings are consistent with the data from the CDC, wherein 2020, the most common cause of death in people aged 55–64 was malignant neoplasm, and in the 65+ y/o subjects, it was heart disease [36]. Infection impacted the young-old, middle-old, and outliers’ groups almost equally, with one subject each assigned to this COD category. Three subjects died of infection in the old-old age group (Figure 1). Deaths related to cognitive decline were well dispersed between age groups, with 1–2 subjects in each age group passing from Alzheimer’s disease. There was one death related to trauma in each of the youngest age groups and no deaths related to trauma in the outliers group.

2.2. Summary of the Thymic Measurements

Table 2 summarizes the mean thymic measurements and capsule observation organized by sex and age. In females, the presence of an intact capsule at the time of death remained relatively constant in the first three age groups, ranging from 66% to 59% of subjects having a retained capsule (Table 2). In males, the thymic capsule was preserved in 83% of our youngest individuals, the young-old group. Then, with the progression of subjects’ age, the number of thymi with an intact capsule progressively declined from 63% in the middle-old to 44% in the old-old age groups. There was a drastic decrease in the percentage of subjects with an intact capsule in the outliers group, with only one female subject and no male subjects presenting with an encapsulated thymus at the time of death.
Next, we looked at thymic measurements in the context of age and sex. In females, the mean length of the left lobe (LL) ranged from 7.600–7.888 cm in the younger groups to 6.775 cm in the outlier group, while the right lobe (RL) measurements ranged from 6.456 to 7.575 cm. Interestingly, with the progression of age, the size of the LL diminished while the length of the RL gradually increased. The mean transverse diameter (TD) values remained relatively stable at 7.611 cm in young-olds and 6.825 cm in the outlier group.
The thymus size was larger in males than in females by 12% and 8.9% in measurements of the LL and RL, respectively. This finding is consistent with prior data published by Araki et al. [18]. Unlike in females, the sizes of both LL and RL in males progressively diminished with age. Particularly notable was the decline in the size of the RL, which shrunk by 0.7, 1, and 3.7 cm in each consecutive decade of life in the middle-old, old-old, and outliers age groups, respectively. The mean TD values ranged from 9.117 cm in the young-old to 5.800 cm in the outliers groups. Interestingly, the decrease in the size of the RL in males also contributed to the decline in the TD values, which were diminished by 0.8, 0.5, and 2.0 cm in the respective age groups. We noticed that the middle-old and old-old groups had a larger LL than the RL, but this effect was the opposite in both the young-old and outliers groups (Table 2).
The thymic weight was noticeably more prominent in males compared to females. However, it diminished with age progression, declining by 1.3 to 2.6-fold in the old-old and outliers age groups. Except for the middle-old age group, the mean thymic weight was comparable in females, ranging from 13.75 g to 17.52 g (Table 2). It should be noted that two of the female subjects in the middle-old age group had no appreciated right lobe during organ removal; however, excluding those weights from the analysis did not significantly raise the mean thymic weight for that group. Therefore, they were included in the analysis. The mean thymic weight for the middle-old group was 7.31 g, almost half the mean weight of the other age groups.
The KYCOM cohort represents the elderly population with a mean age of 83.77 years and is quite distinctive from the cohorts studied by other research groups [20]. So, we posed a question of how the means of thymic measurements in our cohort differ from those of females and males in a human population encompassing a broader age span. We applied a one-sample t-test to analyze the size of the KYCOM cohort’s LL, RL, TD, and thymic weight means using hypothetical means for the LL, RL, and TD sizes from the conclusions of the in vivo CT scans by Araki et al. [18] and for the thymic weight from the work of Kendall et al. [20]. When comparing the means of thymic measurements in the KYCOM female cohort to the general population, including younger individuals, the mean for the LL was significantly larger in all age groups (p ≤ 0.0001 to 0.0433) (Table 2). Similar results were observed for the RL and TD. Except for the middle-old group, where the p values were insignificant, the p values ranged from p < 0.0001 to p = 0.0456 for the RL and p = 0.0026 to p = 0.0456 for the TD (Table 2). In the KYCOM three younger male age groups, the mean thymic LL, RL, and TD measurements were also significantly larger than in the general population. The p values for the LL ranged from 0.0304 in young-old to 0.0013 in old-old; the RL p values ranged from 0.0239 to 0.0041, and the TD p values ranged from 0.0324 to 0.0244 (Table 2). The male outliers group only consisted of two subjects and did not produce significant data (Table 2).
The analysis of thymic weight showed that the mean values were like that of the general population. However, the mean weight in the middle-old female group was significantly less than the hypothetical mean thymic weight (p = 0.0029). The organ’s weight in the remaining male and female age groups was similar to the general population mean (Table 2). Interestingly, while the LL, RL, and TD lengths in the KYCOM cohort were almost double the thymi size in the general population, the thymic weight means were comparable. This could be explained by water loss during embalming, decreasing the thymic weight while maintaining its size.

2.3. The Associations between Thymic Parameters and Age

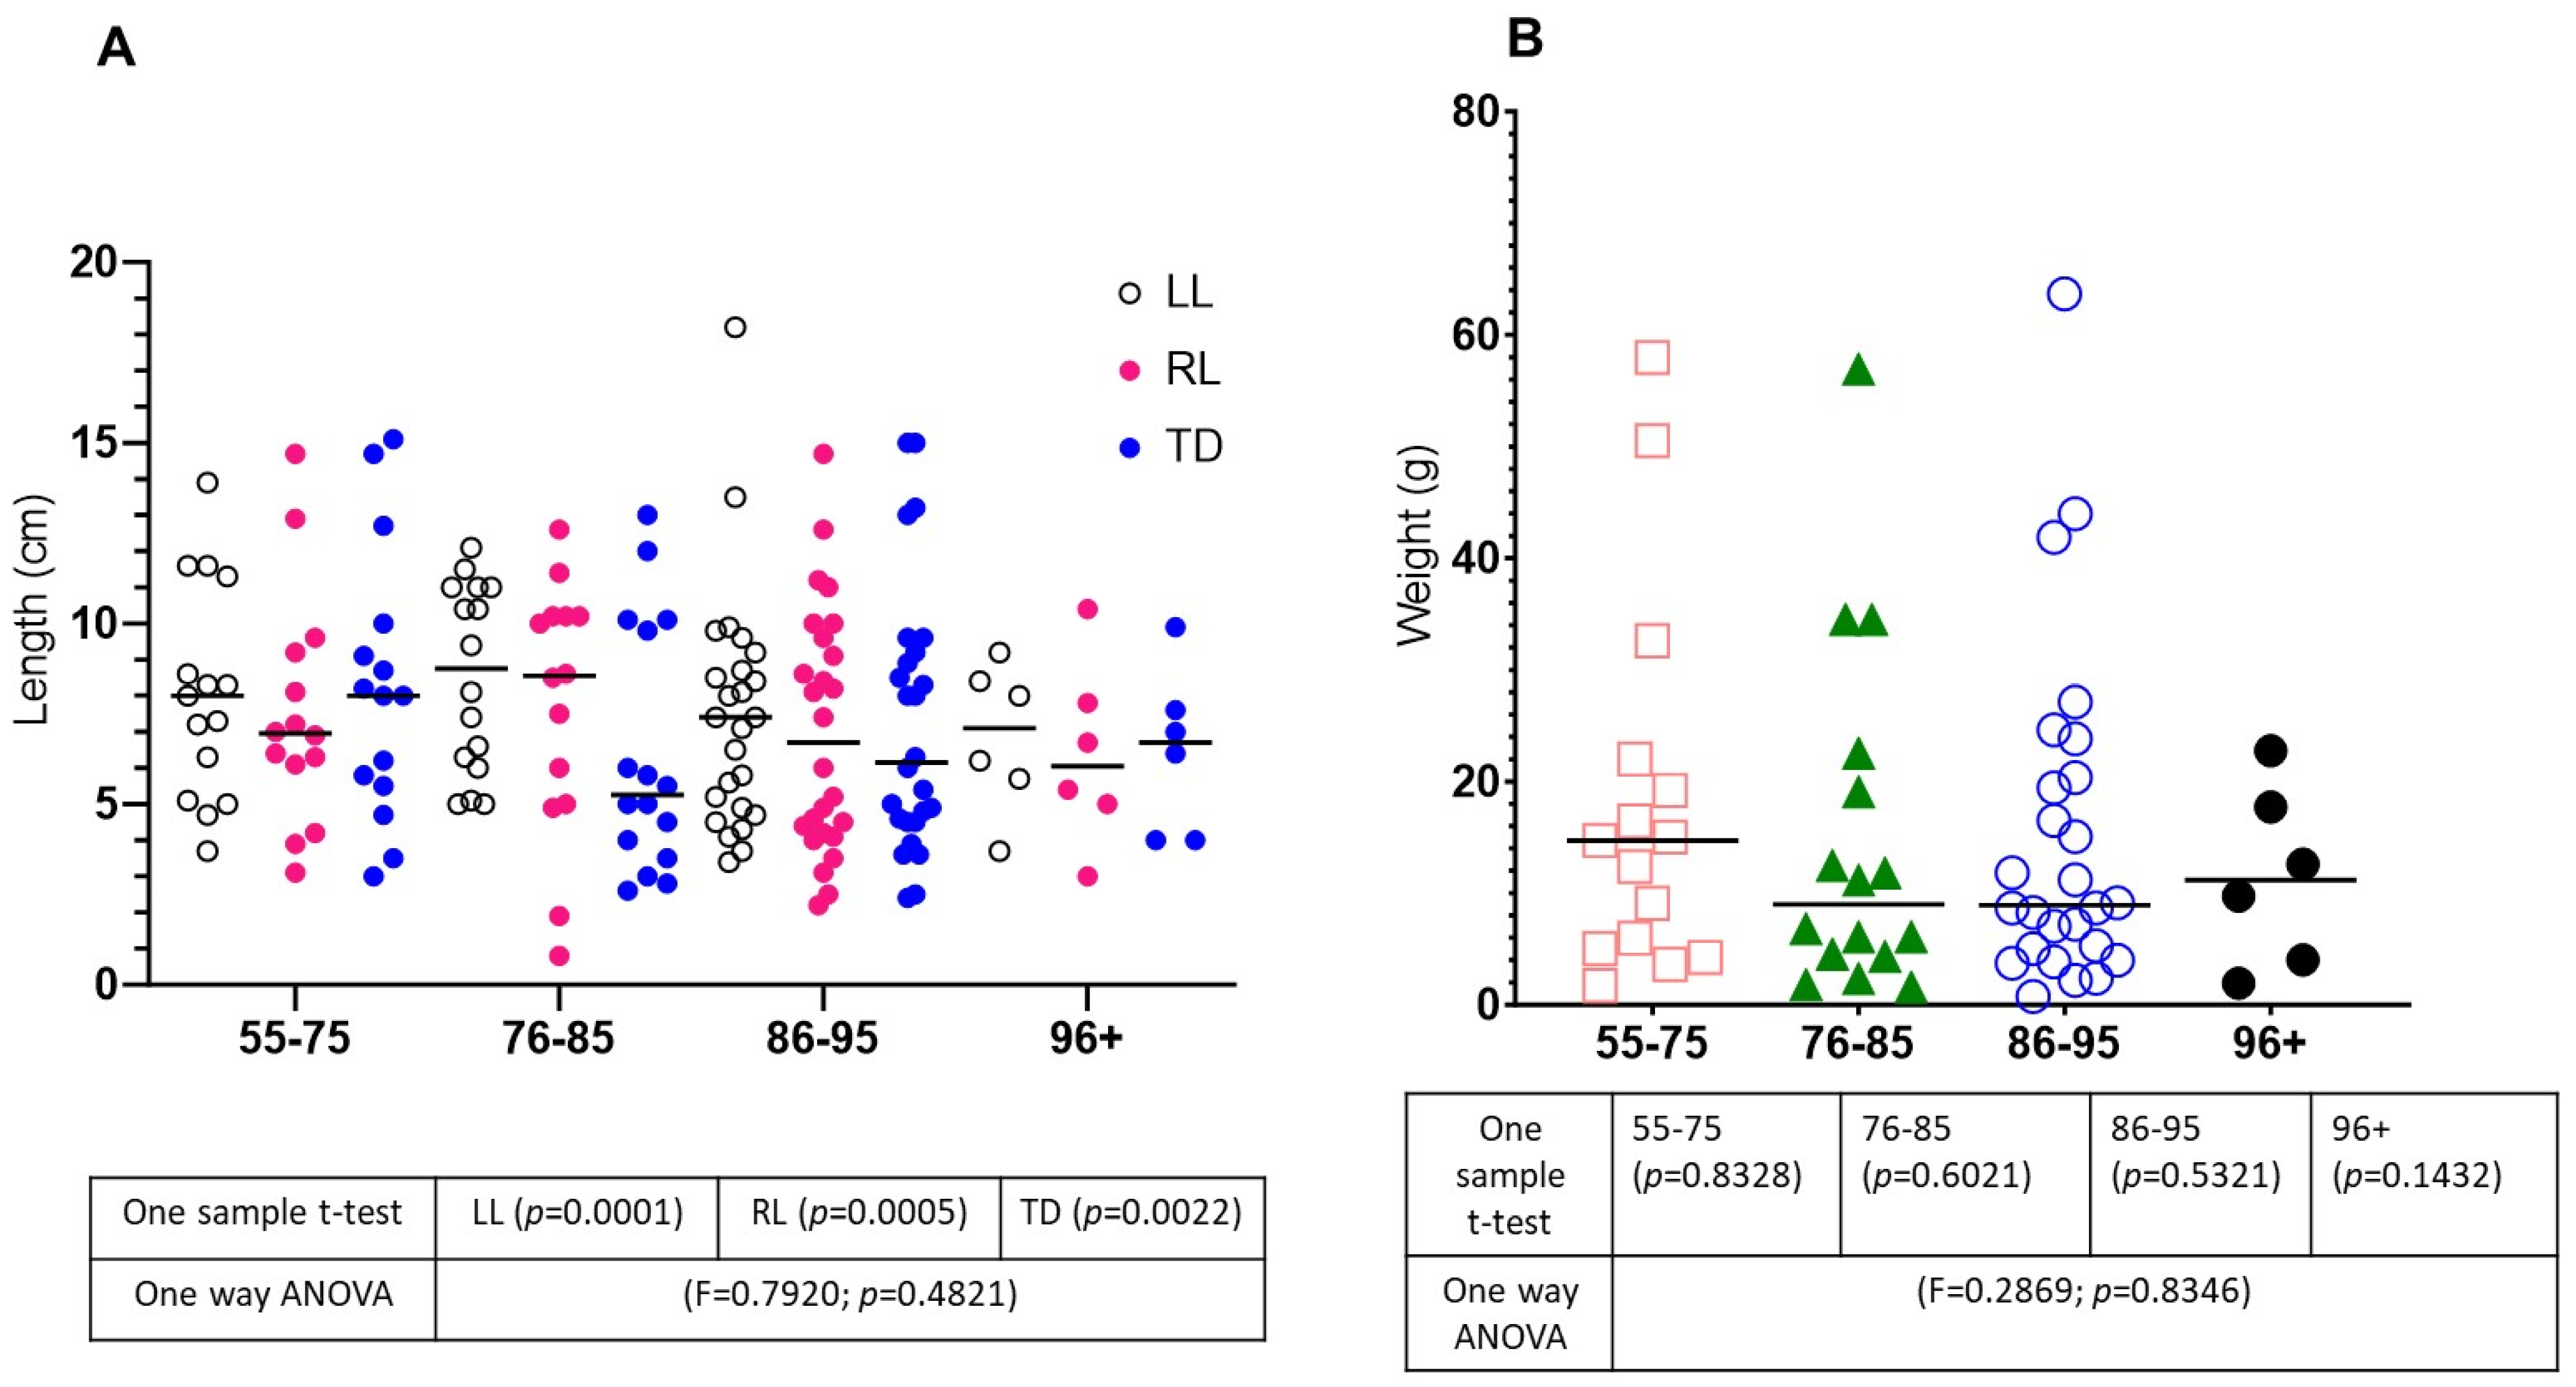
Data in Table 2 show a one-sample t-test summarizing how the means of thymic measurements in the KYCOM cohort separated by sex differ from males or females from a human population encompassing a broader age span. In the analysis shown in Figure 2, we asked whether a person’s age, regardless of sex, could influence the length of the LL, RL, TD, and thymic weight. Applying a one-sample t-test, we examined whether the means of the thymic parameters in the KYCOM cohort were different from the hypothetical means of a general population, including both males and females. We found that all thymic size (Figure 2A) but not weight (Figure 2B) parameters were significantly different in our cohort, regardless of the person’s age at the time of death. Then, applying a one-way ANOVA, we looked at thymic size measurements in the KYCOM cohort alone and asked whether thymic measurements in all age groups were statistically equal and whether at least one age group was different. This analysis showed no significant difference in the means of thymic size or weight measurements between the age groups in the combined male and female population of the KYCOM cohort (Figure 2A,B). Thus, we concluded that the thymic anatomy does not vary significantly in different age groups in the elderly population.

2.4. The Associations between Thymic Parameters and the COD

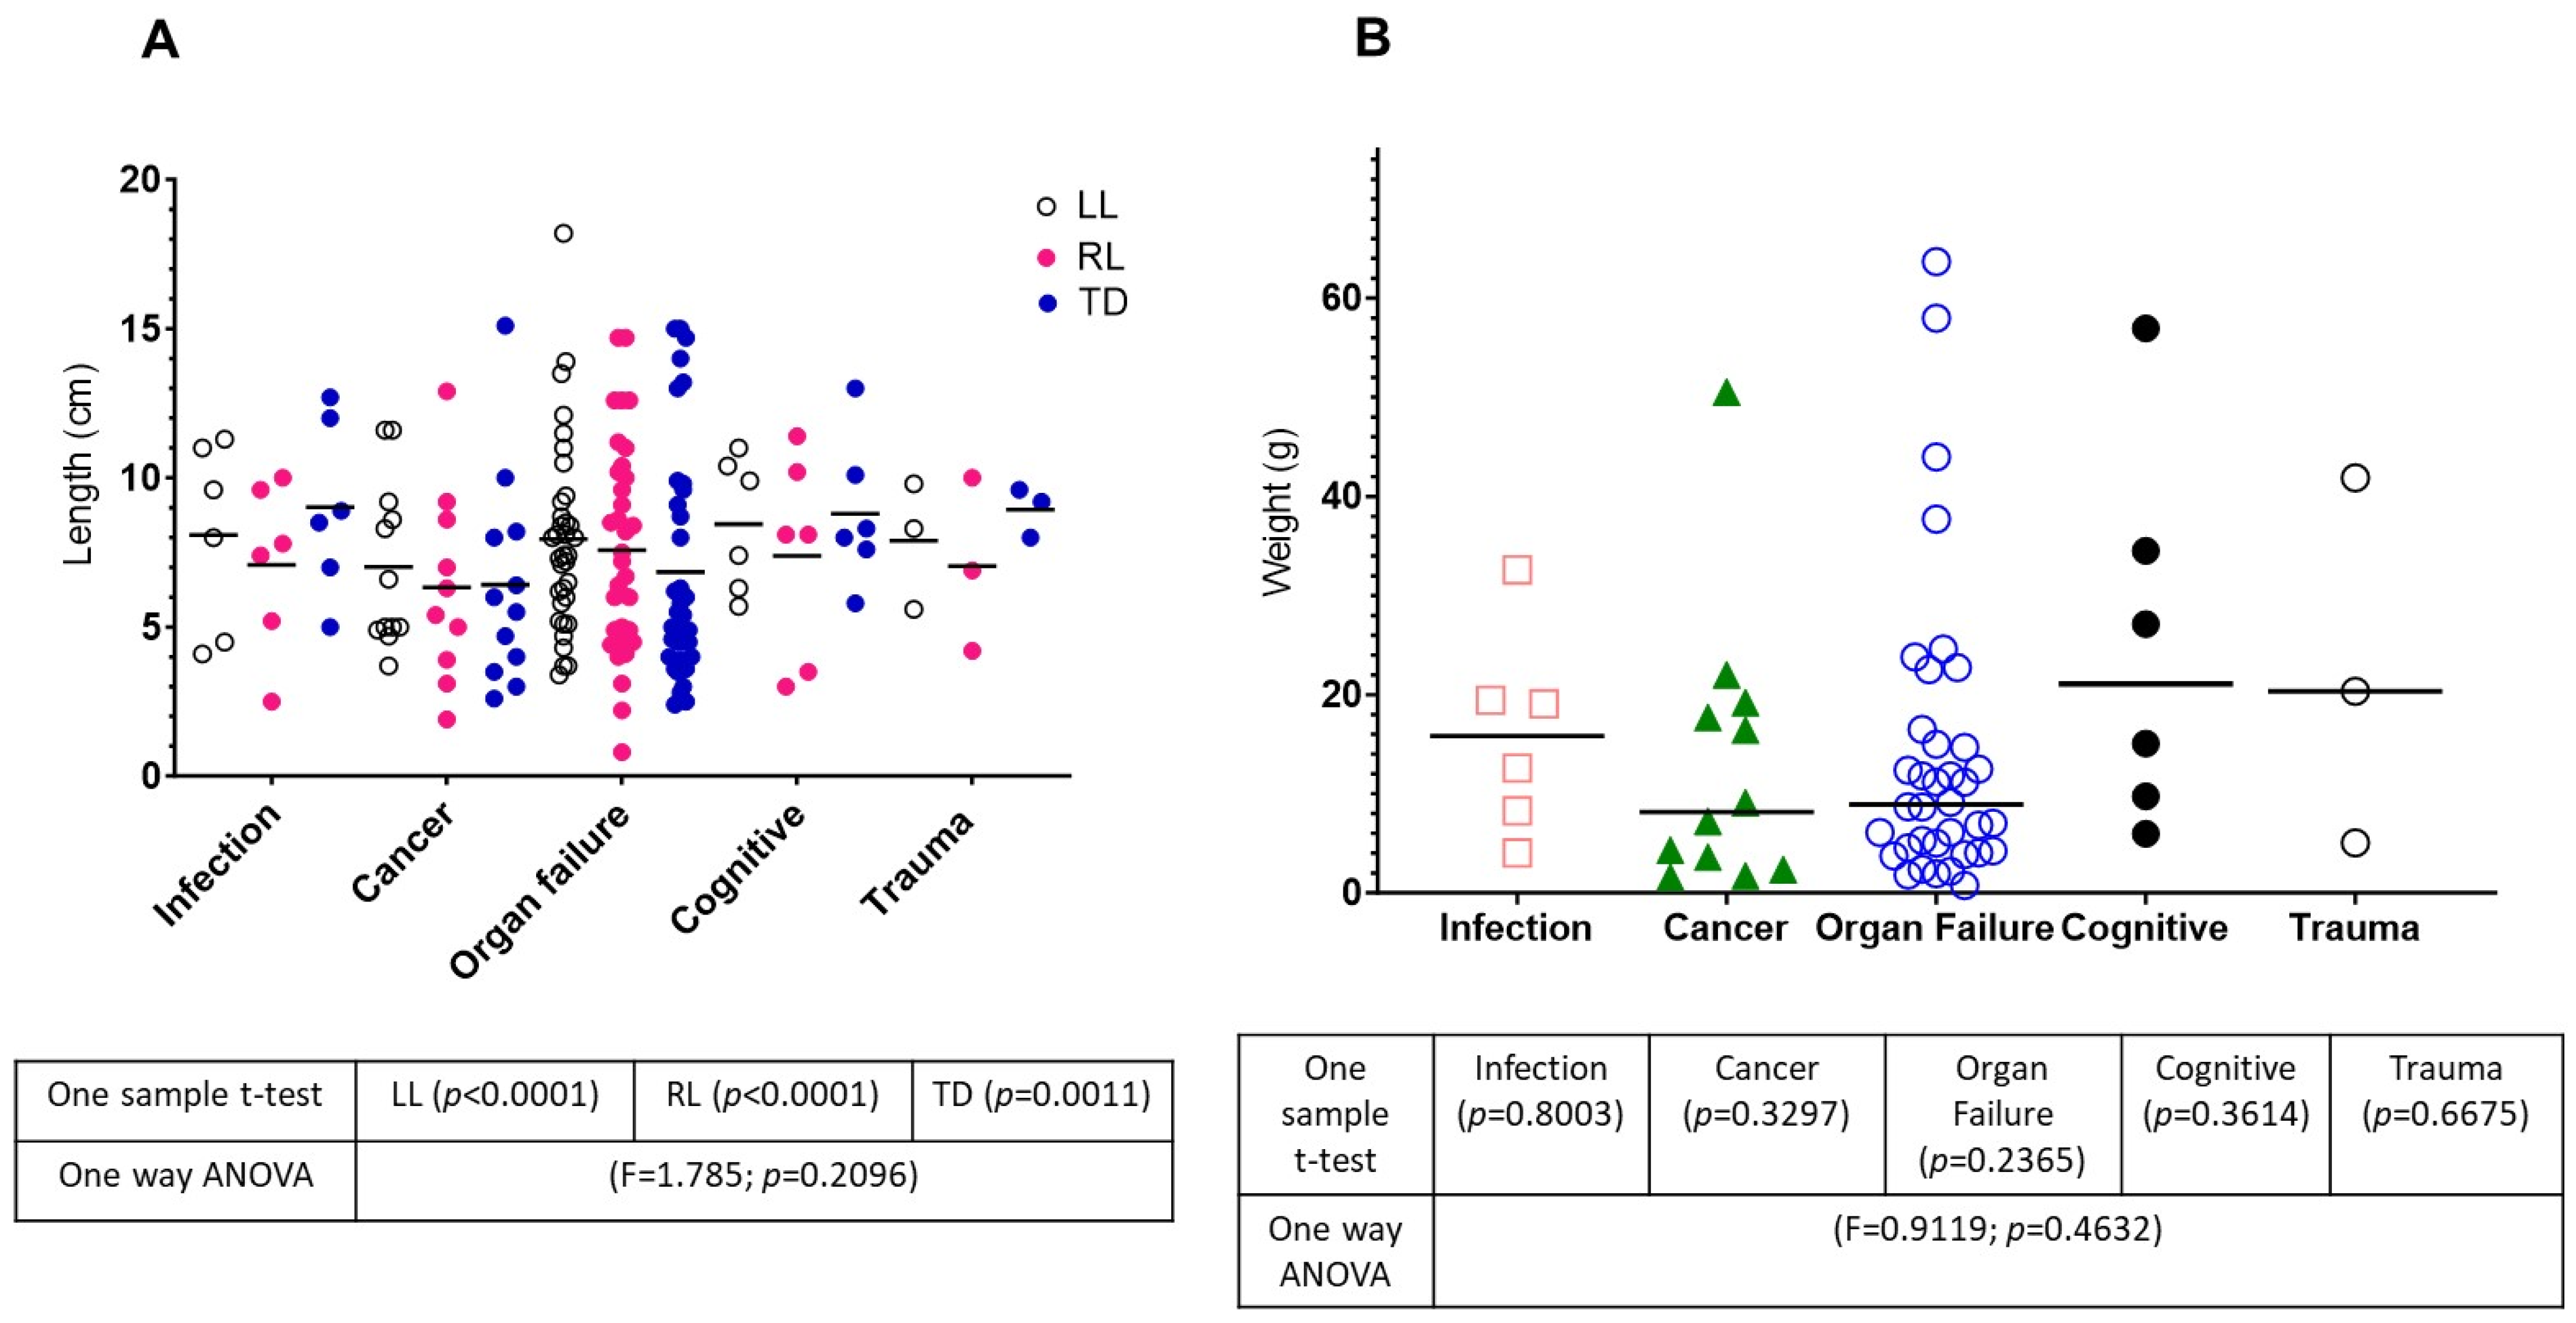
The results of one sample t-test (Table 2) showed that, in several measured parameters, the size of the thymic gland in elderly males and females was statistically different than in cohorts including the younger subjects. So, we asked whether thymic size variations in the KYCOM cohort may be associated with the COD and applied a two-fold analysis of a one-sample t-test and one-way ANOVA. Similarly, as for the analysis shown in Figure 2, the results of one sample t-test showed that the differences between the means for the thymic size (Figure 3A), but not weight (Figure 3B) measurements, were also significant in each COD category, suggesting that thymus aging may follow a particular pattern. For example, in all COD groups, the mean size of the LL was larger than that of the RL, which suggests that the LL is infiltrated by the adipose tissue sooner than the RL (Figure 3A). This asymmetrical involution of the thymus may lead to the prolonged preservation of the structure and function in the right thymic lobe as we reported before [16]. The thymi in subjects who died from infection, cognitive, or traumatic causes had the highest mean values for the TD, while in cancer and organ failure groups, the TD mean values were the lowest.
The one-way ANOVA revealed no significant difference in the mean thymic size and weights between COD groups (Figure 3A,B), suggesting that the size or weight of the thymus did not contribute to the development of certain diseases in our elderly sample.

2.5. The Associations between the Thymic Parameters and BMI

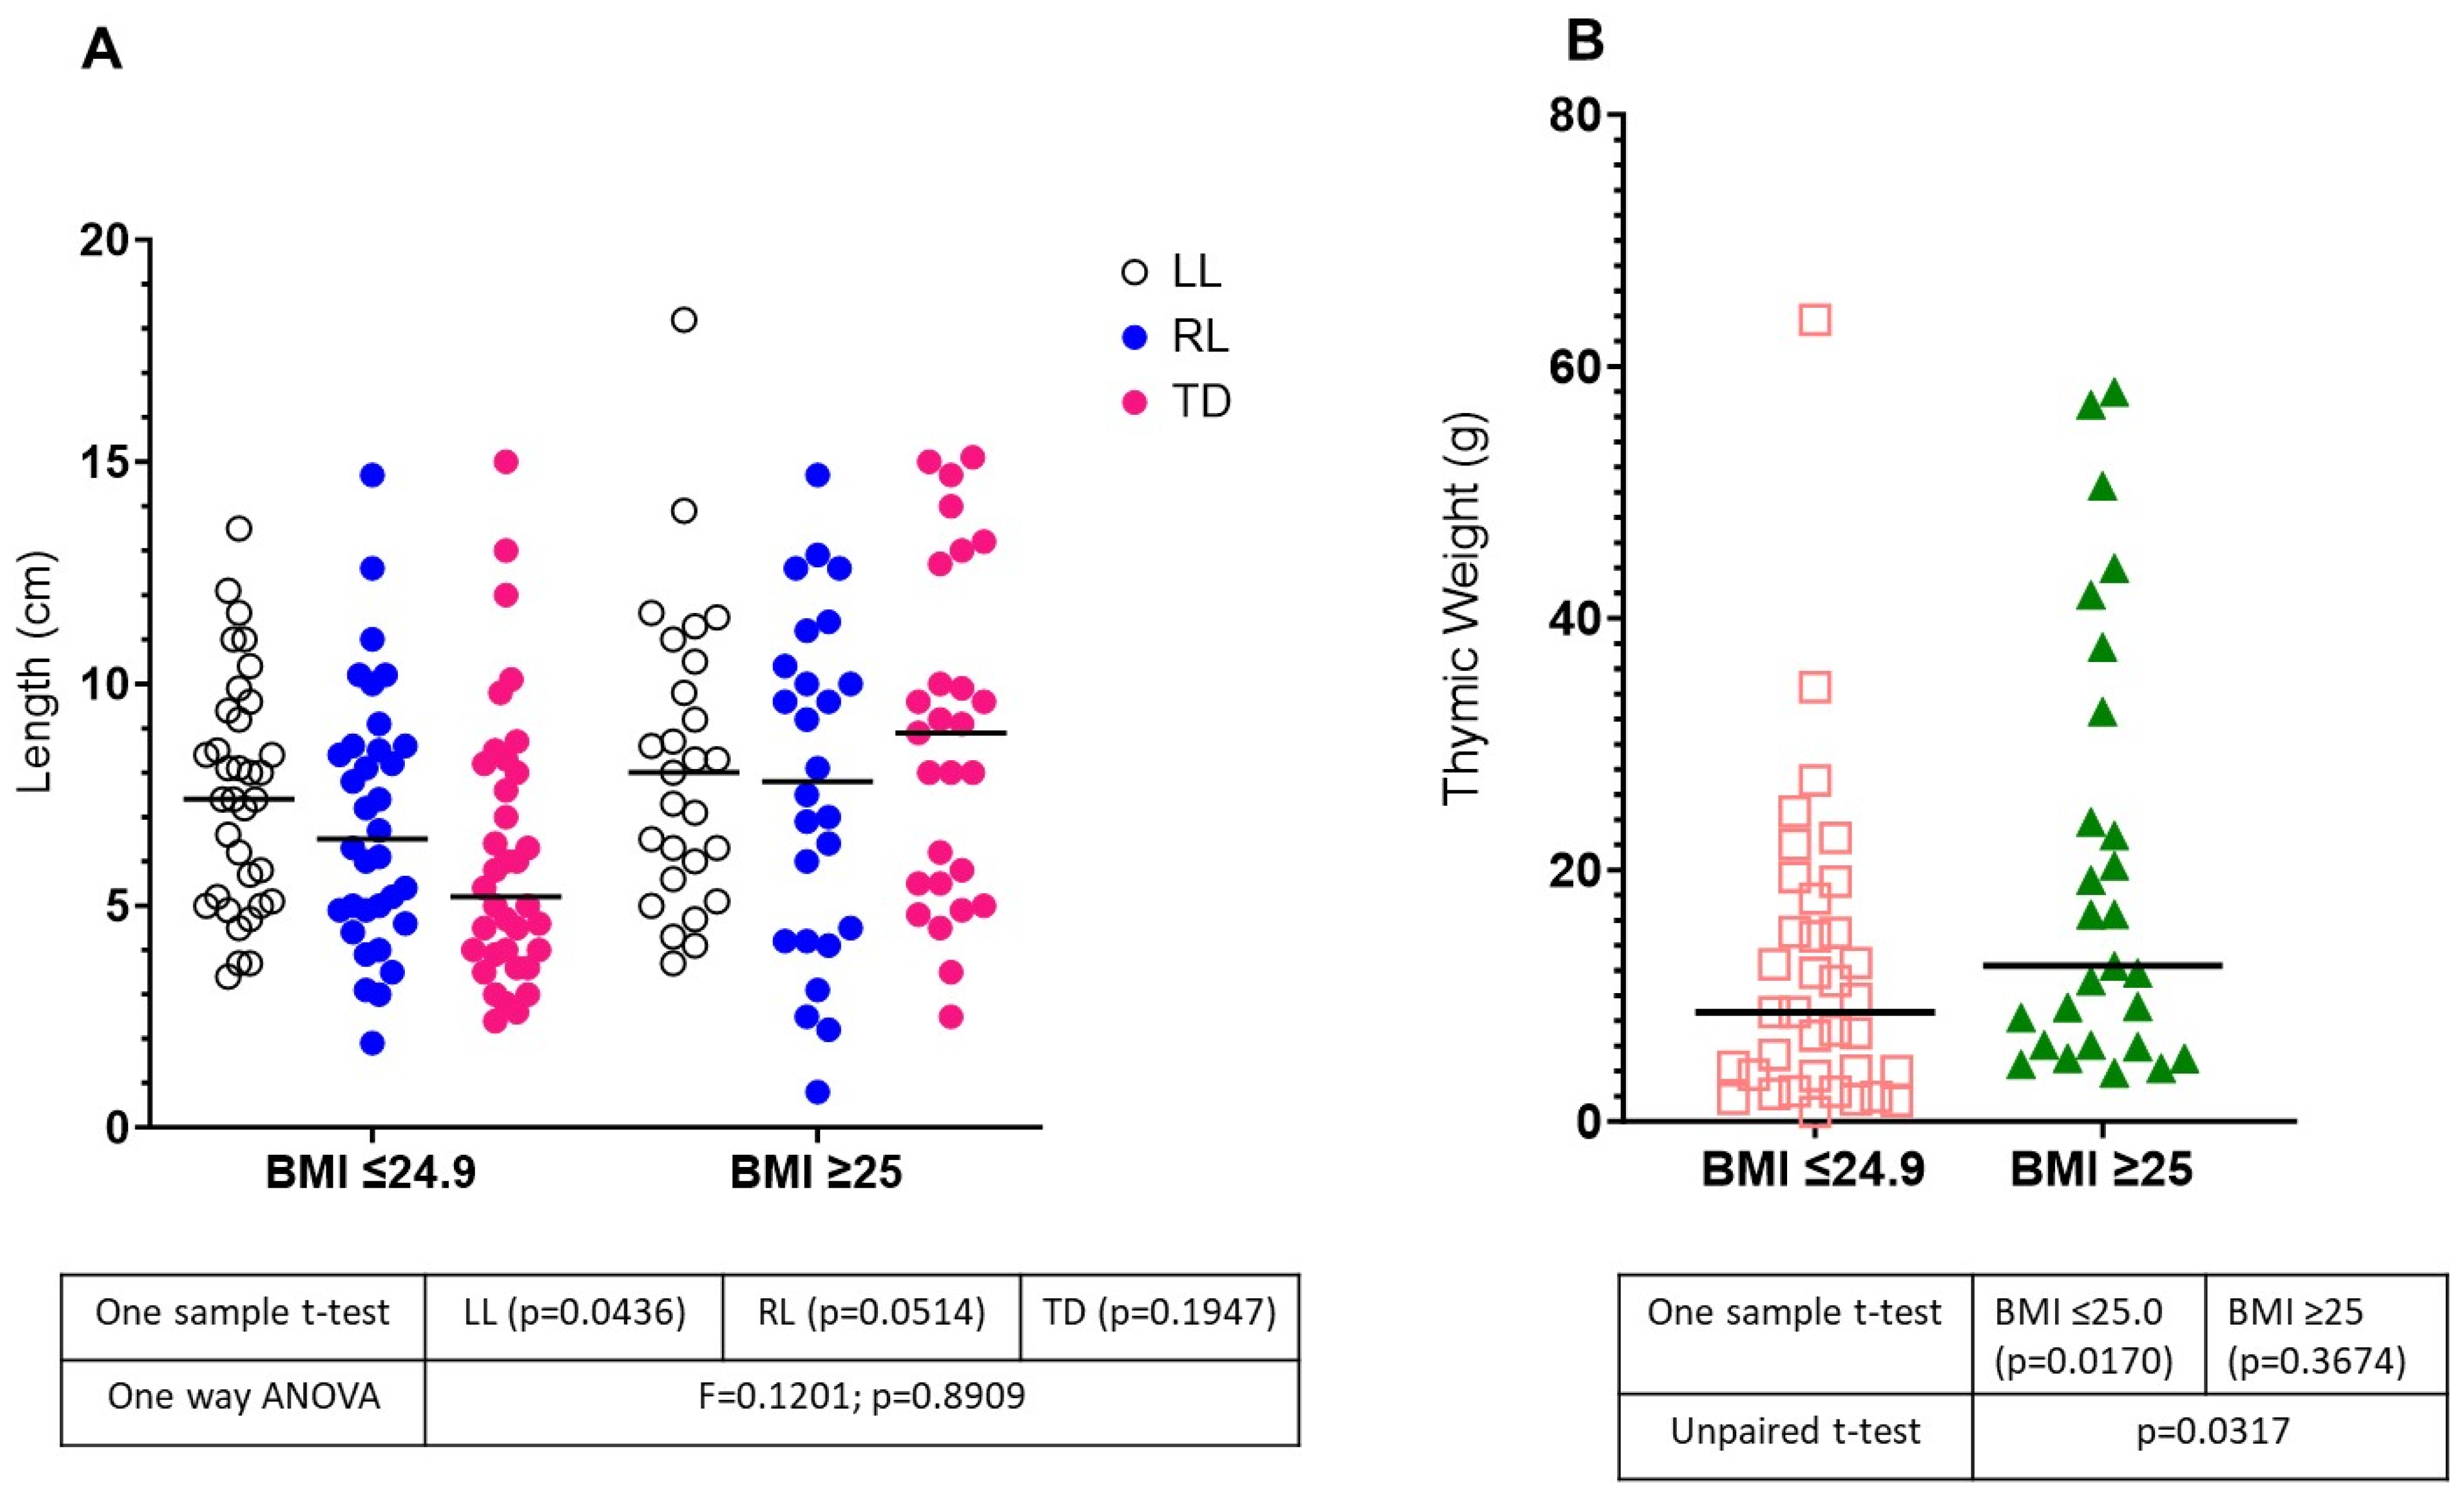
Finally, we asked whether there was any association between the person’s weight and the size of the thymus in an elderly population. The thymic sizes for all measured parameters were lower in the low/normal BMI group (Figure 4). The one-sample t-test indicated that the mean length of the LL but not the RL or TD in both BMI groups was significantly different from the means of the general population (p = 0.0436) (Figure 4A). The one-way ANOVA showed no variability among two BMI groups and thymic size parameters (F = 0.1201, p = 0.8909), suggesting that a higher BMI was not associated with having thymic size variations in the elderly population.
The mean thymic weight was smaller in the low/normal BMI group compared to the elevated BMI group (11.99 g vs. 20.13 g), respectively (Figure 4B). When we used the one-sample t-test to compare the mean thymic weight values to hypothetical weight values, the low BMI group had a significantly smaller mean thymic weight (p = 0.0170). Still, the elevated BMI group was not statistically different (p = 0.3674). Subsequently, we applied an unpaired t-test to compare the means of two BMI groups and found a significant difference in thymic weight between these two groups (p = 0.0317). Based on our data, we concluded that, although there is no variability between thymic size parameters and age, COD, or BMI, there is an association between BMI and thymic weight.

3. Discussion

The KYCOM cohort comprises a distinctive set of body donors whose ages at the time of death ranged from 57 to 103 years. With an average age of 83.77, the cohort provided a unique model to study thymic anatomy at a late age, closing on the natural end of human life. Considering the process of involution, we looked at the organ’s anatomy and analyzed the relationship between the aged thymus and factors that may contribute to the alteration of its structure, such as the subject’s age, sex, and BMI. We also looked at the correlation between the thymic anatomy and the cause of death.
Among the factors most influencing thymic anatomy are age and sex. Several research groups published the standard observation that the thymus decreases in size with the advancement of age [18,19,21,25,37,38,39,40], which was proven by the recent implementation of integrative mathematical models showing that thymic output is a function of age [41]. Others reported that the function of sex hormones, particularly androgens, may influence a size and function discrepancy between males and females [14,21,22,23,24,26,42]. In contrast, estrogens were found to block the autoimmune regulator (AIRE) expression, leading to altered thymic self-tolerance mechanisms [43]. Finally, factors like stress or viral infections may also contribute to the acute thymic involution [44,45,46]
Looking at the size of the thymus in the context of a person’s advancing age, we found interesting trends of the organ’s involution that were not observed in younger populations. In both sexes together as a group, the size of the LL was larger than the RL, which supported the findings of other research groups [18,37]. But when we looked at male and female populations individually, we noticed that, with the advancement of age, the thymus in males had progressively decreased in the size of both lobes, and transverse diameter. In females, with age progression, the size of the left lobe declined as in male subjects, but the right lobe’s size increased, which was particularly visible in the outliers group. This observation suggested that the kinetics of thymic involution in subjects over 96 years of age may deviate from the general trend observed by other teams and may arise from sexual dimorphism in thymic involution [19]. It is interesting to note that, when we analyzed thymic parameters in the whole KYCOM cohort against the unmatched variables such as sex and age, age alone, COD, or BMI, the mean of the left lobe’s size was, on average, larger than that of the right lobe, regardless of the variable.
Kendall et al. found that thymic weight decreased with age [20]. In our study, we observed this trend in males but not females. In females, the thymic weights were similar in every age group except the middle-old, which was noticeably lower than the other groups. The middle-old subjects’ COD or BMI could not explain this discrepancy, which could possibly be related to the differences in the aging of the immune system between sexes.
Another observable part of thymic anatomy absent from other studies [18,37] included the examination of the thymic capsule. The thymic capsule arises from mesenchymal elements during embryonic development [47] and maintains the integrity of the organ throughout the person’s life. Recent studies suggested that thymic adiposity may arise from the intra-thymic cellular transitions [48,49]. Therefore, the integrity of the capsule may be another indicator of delayed involution in the late stage of life. Our findings indicate that, although the percentage of male and female subjects with an intact thymic capsule declined with age, the encapsulated thymus could still be detected in 25% of females in the outlier group.
Multiple studies have found that the decline in the immune system can lead to increased susceptibility to developing certain diseases such as infections, cancer, cardiovascular disease, and Alzheimer’s disease [2,29,50,51,52,53]. Also, chronic stress dramatically contributes to the immunosenescence and involution of the thymus, likely due to the increased inflammation [20,26,54]. Interestingly, Kendal et al. reported that cardiovascular disease contributed to a higher thymic weight [20]. Our data did not support this finding. In the KYCOM cohort, subjects who passed from cognitive diseases such as Alzheimer’s disease or dementia had the highest thymic weight at the time of death. In contrast, organ failures, which also included cardiovascular disease, had the lowest thymic weight.
Increasing the body weight may suppress the immune system [14,18], leading to accelerated involution and a decline in T-cell output [32,33,34]. We observed that subjects with a higher BMI had higher means of thymic size parameters than the lower BMI group. Although this difference was not significant, it was consistent with prior reports [18]. Also, the thymic weight in our elderly cohort was significantly smaller in subjects with a lower BMI, which contrasts with reports by Kendall et al., who showed that thymic weight was not associated with the subject’s weight [20]. Interestingly, another research group found that subjects with an elevated BMI had a higher thymic function than those with a lower BMI [8]. Based on our data, we suggest that factors such as BMI may contribute more to the appearance of the thymus, particularly thymic weight, in the elderly than in the younger subjects.

4. Materials and Methods

4.1. The KYCOM Cohort Characteristics

The KYCOM cohort consisted of body donors used for gross anatomy training at the Kentucky College of Osteopathic Medicine (KYCOM). The cadavers were obtained from the Anatomical Gift Program in Dayton, OH, USA. Each cadaver was listed with a primary cause of death, height, weight, age, race, and place of death. The total number of subjects included in the analysis of the thymic parameters was n = 63. One subject in our cohort was noted to have no appreciated left lobe of the thymus, and three subjects were noted to have no appreciated right lobe of the thymus. Thirty-five subjects were noted to have an intact thymus capsule at the time of organ removal.

4.2. Organ Retrieval

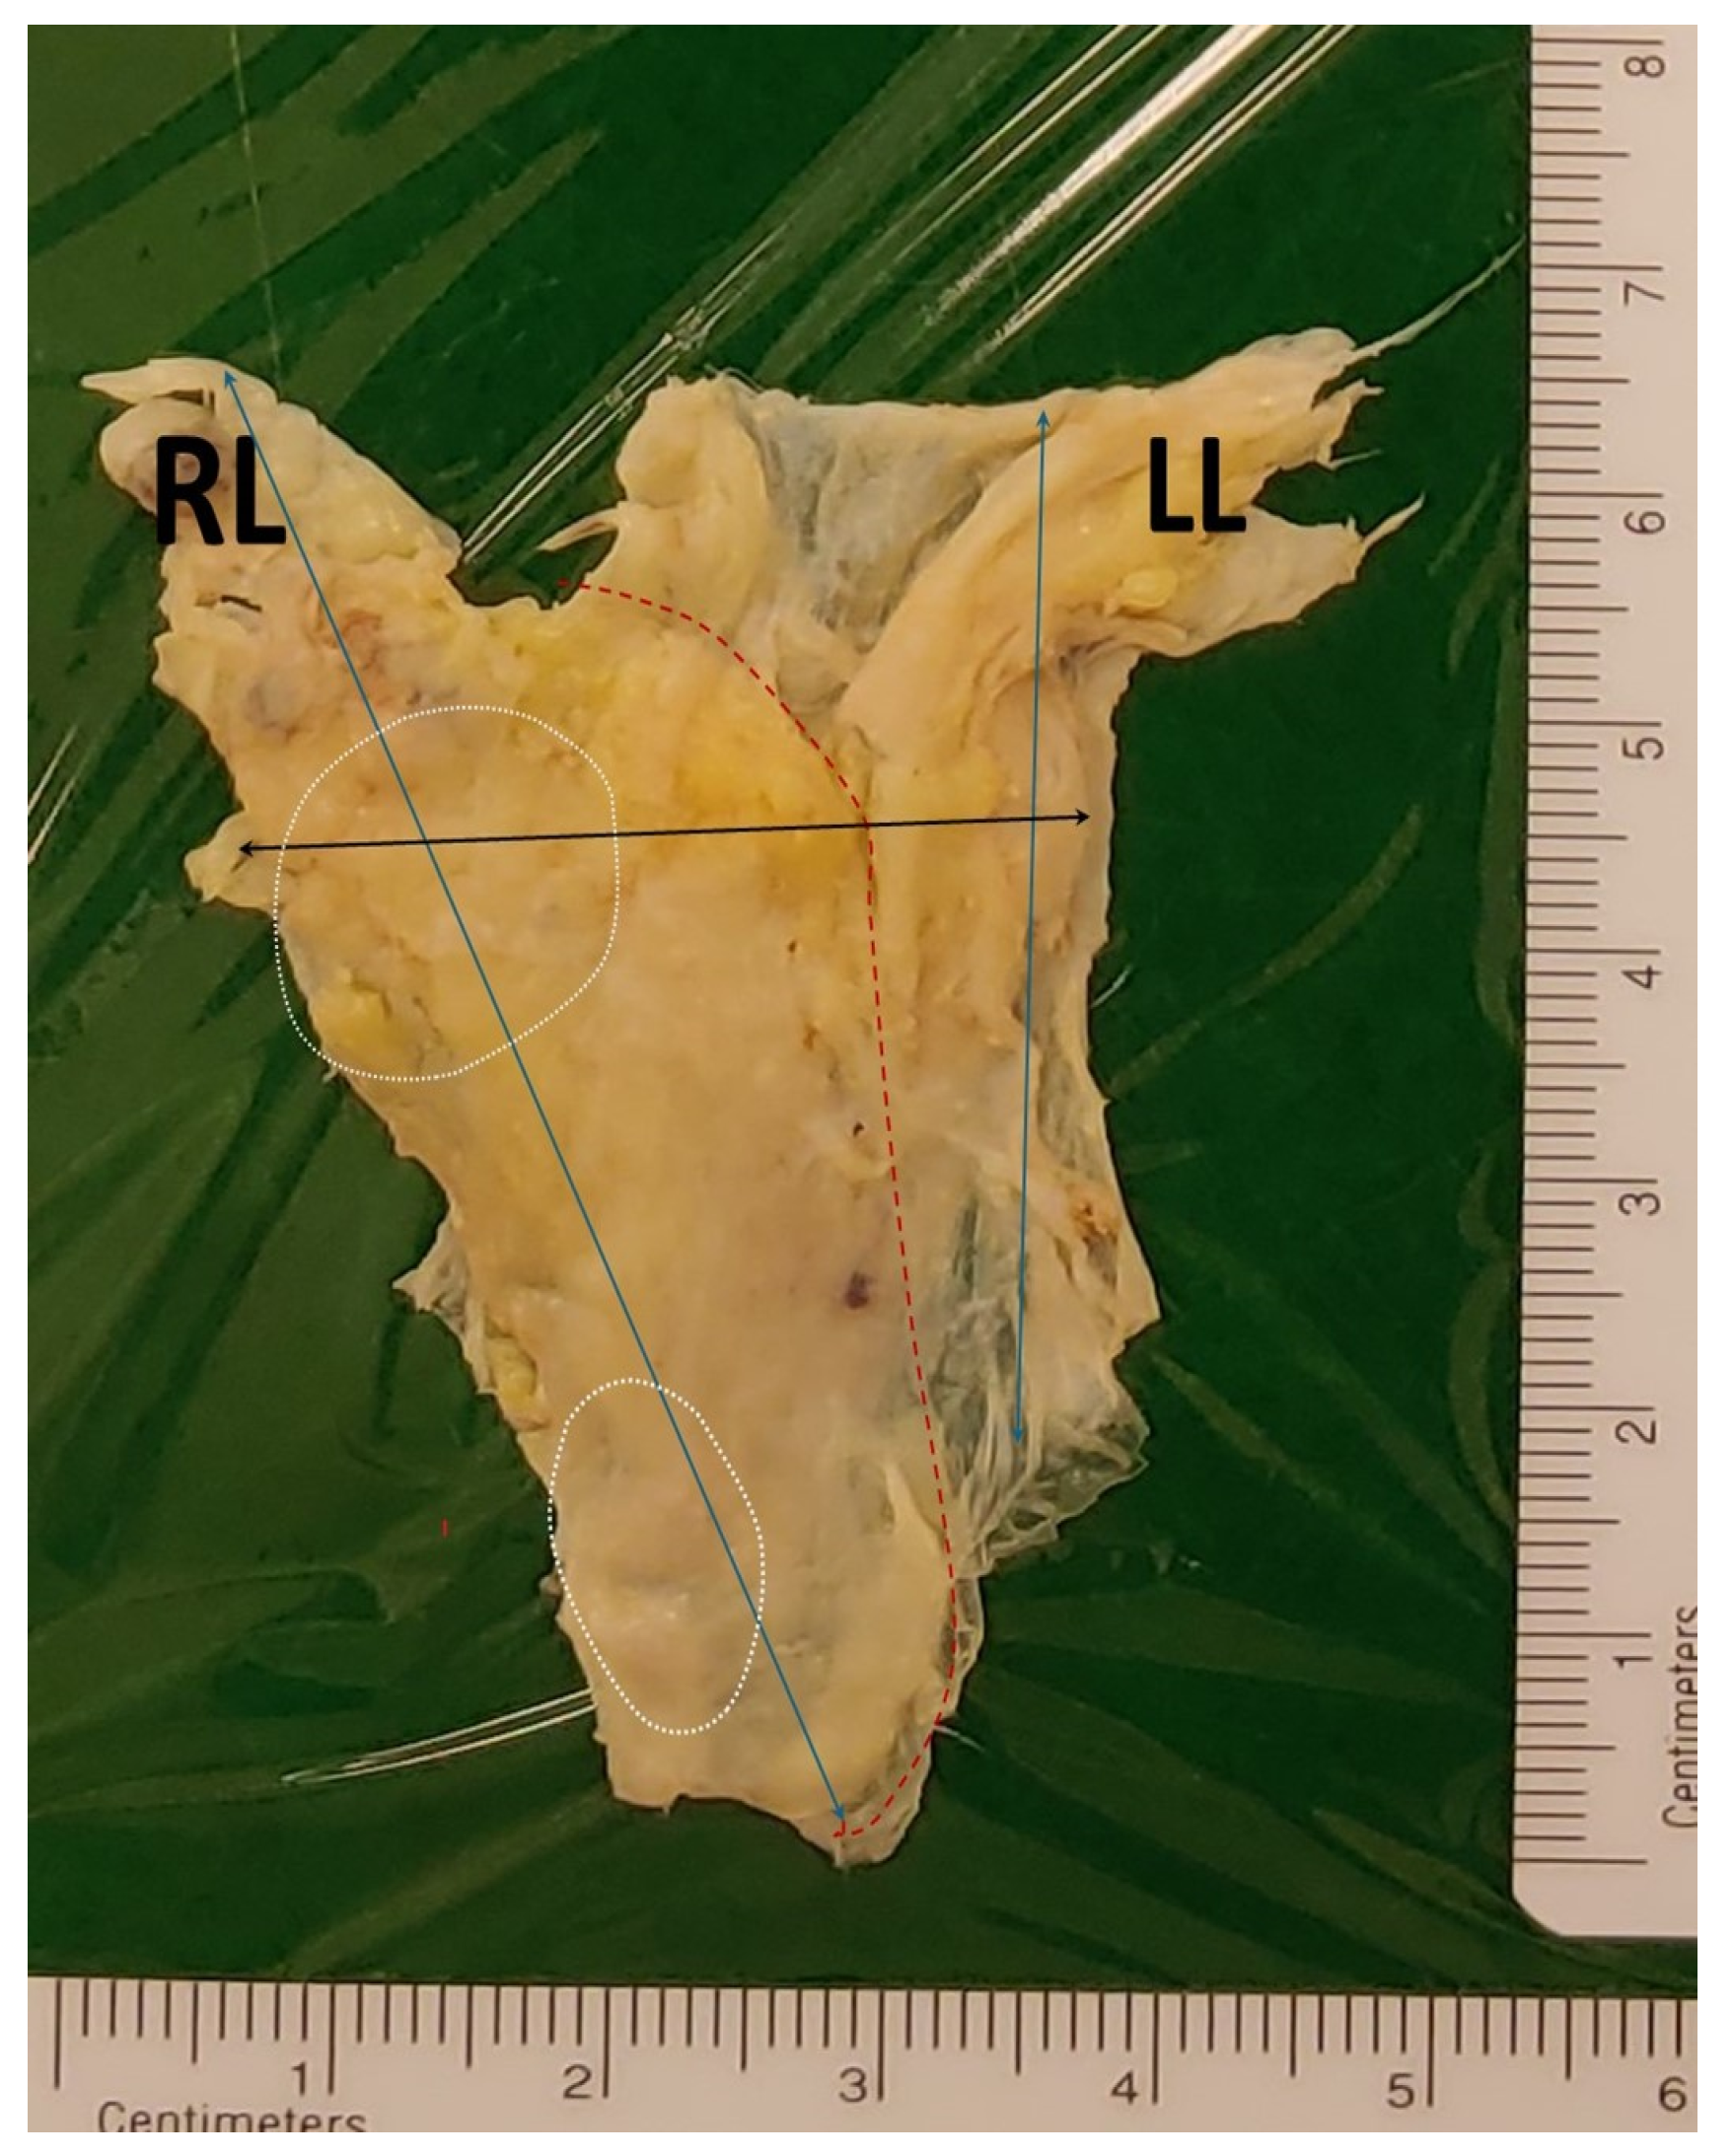
Prior to delivery to KYCOM, the cadavers were embalmed within 24 h of death in a formalin-based fixative solution. Thymi were excised from the body using surgical instruments, including 4.5” surgical Sharp-Sharp scissors and thumb forceps (Nasco, Fort Atkinson, WI, USA), as described previously [16]. Immediately after excision from the donor body, thymi were photographed in an anatomical position (Figure 5); then each thymus was measured for the weight, length of each lobe, and transverse diameter applying the protocol published by Araki [18]. We also observed whether the thymus had an intact capsule. The excised thymi were placed in 10% buffered formalin (Fisher Scientific, Waltham, MA, USA) and refrigerated in the research laboratory.

4.3. Determination of the BMI

Using the subjects’ height (cm) and weight (kg) at the time of death, the body mass index (BMI) was determined using the calculator provided by the National Institute of Health [55]. Based on this calculation, all subjects were classified into one of two BMI groups for our analysis: low or normal BMI (BMI ≤ 24.9) or elevated BMI (BMI ≥ 25.0).

4.4. Thymic Measurements

To ensure the reliability of thymic measurements, the size but not the weight of thymi were assessed by two independent examiners. The first measurement was taken at the gross anatomy laboratory immediately after the organ’s removal, and the second was taken in the research laboratory after the organ was stored in the 10% buffered formalin. The thymic weight was assessed only once after the organ’s removal from the donor’s body. The inter-observer reliability was assured by taking two consecutive weight measurements.

4.5. Statistical Analyses

Statistical analyses were performed using GraphPad Prism for Windows (version 10.1.2). Categorical variables were summarized using frequencies and percentages, whereas continuous variables were summarized by the descriptive statistics of observations such as the number of observations (n), minimum (min), median (md), mean (M), standard deviation (SD), and maximum (max). All p values were rounded to four decimal places, and the p values less than 0.0001 were presented as <0.0001. To reduce the risk of reporting that our findings were significant when in fact they occurred by chance (Type I error), p < 0.05 was considered statistically significant. The essential details of our statistical protocols were published before [56,57,58].
One-way analysis of variance (ANOVA) was used to test the total variability among categorical characteristics such as left and right lobes’ lengths, transverse diameter, thymic weight, and variations between subcategories such as COD, age, and BMI. We tested the ANOVA hypotheses: (1) Ho—all group means were statistically equal, and (2) Ha—at least one group was different.
A one-sample t-test was performed to determine how the means of the thymic parameters are different from the hypothetical means derived from the general population (including both males and females) aged between ≤39 and >80 years old, and separately for females and males. The hypothetical means for thymic parameters were calculated from the available data of over 600 subjects ranging in age from ≤39 to >80 years old, published by Araki et al. [18]. Based on these resources, we established the hypothetical means for females as the length of the left lobe (LL) is 2.74 cm, the length of the right lobe (RL) is 1.72 cm, and the size of the transverse diameter (TD) is 2.82 cm. The hypothetical mean lengths for males for LL, RL, and TD were 3.71 cm, 2.43 cm, and 3.87 cm, respectively. The hypothetical mean values for LL, RL, and TD in males and females combined were 3.23 cm, 2.01 cm, and 3.30 cm, respectively. A hypothetical mean for thymic weight was established to be 17.1 g, adapted from the mean values of over 400 adult cadavers that are older than 40 at the time of death, as published by Kendall et al. [20].
An unpaired t-test was applied to compare the means of thymic weight in two BMI groups.

5. Conclusions

The thymic size but not thymic weight in older people differs significantly from the general population, which includes younger individuals. There are noticeable differences between the thymic anatomy in sex and age groups, but these differences are not as significantly pronounced as they may be in the younger population. Thymic anatomy was not associated with developing certain diseases in the elderly. Still, the asymmetrical aging of the thymus in different COD categories may have resulted from the lopsided infiltration of adipose tissue into the thymic lobes under diverse characteristics of the ongoing disease processes. We found that body weight may have significantly affected the thymus in this age group, as elevated BMI correlated with increased thymic weight. Thus, our observations suggest that obesity may have important clinical implications for developing inflammatory processes and escalating the aging of the immune system.
This study aimed to offer a better understanding of the anatomy of the thymus in the elderly population, and further research prompts the investigation of the microanatomy and function of the thymus in this population.

Author Contributions

R.D., I.C., C.J. and S.A. assisted with the organ removal and performed thymic measurements. J.L. performed thymic measurements, photographed, and catalogued the data. J.H.S. supervised organ removal. R.D. performed statistical analyses and wrote the manuscript. M.S. acquired funding, supervised experiments, administered the research, and critically edited the manuscript. All authors have read and agreed to the published version of the manuscript.

Funding

This work was supported by an intramural grant to M.S. [KYCOM210001] from the University of Pikeville, Kentucky College of Osteopathic Medicine. Medical students R.D., I.C., C.J., and S.A. were supported by the Summer Research Fellowship program at UPIKE-KYCOM.

Institutional Review Board Statement

The ethical review and IRB approval were waived for this study.

Informed Consent Statement

Not applicable.

Data Availability Statement

The authors confirm that the data supporting the findings of this study are available within the article.

Acknowledgments

We thank Pranuthi Kanneganti for technical assistance with this project.

Conflicts of Interest

The authors declare no conflicts of interest.

References

  1. Nikolich-Zugich, J. The twilight of immunity: Emerging concepts in aging of the immune system. Nat. Immunol. 2018, 19, 10–19. [Google Scholar] [CrossRef] [PubMed]
  2. Weyand, C.M.; Goronzy, J.J. Aging of the Immune System. Mechanisms and Therapeutic Targets. Ann. Am. Thorac. Soc. 2016, 13 (Suppl. 5), S422–S428. [Google Scholar] [CrossRef] [PubMed]
  3. Miller, J.F.; Osoba, D. Current concepts of the immunological function of the thymus. Physiol. Rev. 1967, 47, 437–520. [Google Scholar] [CrossRef] [PubMed]
  4. Cowan, J.E.; Takahama, Y.; Bhandoola, A.; Ohigashi, I. Postnatal Involution and Counter-Involution of the Thymus. Front. Immunol. 2020, 11, 897. [Google Scholar] [CrossRef] [PubMed]
  5. Caramalho, I.; Nunes-Cabaço, H.; Foxall, R.B.; Sousa, A.E. Regulatory T-Cell Development in the Human Thymus. Front. Immunol. 2015, 6, 395. [Google Scholar] [CrossRef] [PubMed]
  6. Corbeaux, T.; Hess, I.; Swann, J.B.; Kanzler, B.; Haas-Assenbaum, A.; Boehm, T. Thymopoiesis in mice depends on a Foxn1-positive thymic epithelial cell lineage. Proc. Natl. Acad. Sci. USA 2010, 107, 16613–16618. [Google Scholar] [CrossRef] [PubMed]
  7. Douek, D.C.; McFarland, R.D.; Keiser, P.H.; Gage, E.A.; Massey, J.M.; Haynes, B.F.; Polis, M.A.; Haase, A.T.; Feinberg, M.B.; Sullivan, J.L.; et al. Changes in thymic function with age and during the treatment of HIV infection. Nature 1998, 396, 690–695. [Google Scholar] [CrossRef] [PubMed]
  8. Feinstein, L.; Ferrando-Martínez, S.; Leal, M.; Zhou, X.; Sempowski, G.D.; Wildman, D.E.; Uddin, M.; Aiello, A.E. Population Distributions of Thymic Function in Adults: Variation by Sociodemographic Characteristics and Health Status. Biodemography Soc. Biol. 2016, 62, 208–221. [Google Scholar] [CrossRef] [PubMed]
  9. Haynes, B.F.; Heinly, C.S. Early human T cell development: Analysis of the human thymus at the time of initial entry of hematopoietic stem cells into the fetal thymic microenvironment. J. Exp. Med. 1995, 181, 1445–1458. [Google Scholar] [CrossRef]
  10. Jamieson, B.D.; Douek, D.C.; Killian, S.; Hultin, L.E.; Scripture-Adams, D.D.; Giorgi, J.V.; Marelli, D.; Koup, R.A.; Zack, J.A. Generation of functional thymocytes in the human adult. Immunity 1999, 10, 569–575. [Google Scholar] [CrossRef]
  11. Thapa, P.; Farber, D.L. The Role of the Thymus in the Immune Response. Thorac. Surg. Clin. 2019, 29, 123–131. [Google Scholar] [CrossRef] [PubMed]
  12. Haynes, B.F.; Markert, M.L.; Sempowski, G.D.; Patel, D.D.; Hale, L.P. The role of the thymus in immune reconstitution in aging, bone marrow transplantation, and HIV-1 infection. Annu. Rev. Immunol. 2000, 18, 529–560. [Google Scholar] [CrossRef] [PubMed]
  13. Haynes, B.F.; Sempowski, G.D.; Wells, A.F.; Hale, L.P. The human thymus during aging. Immunol. Res. 2000, 22, 253–262. [Google Scholar] [CrossRef] [PubMed]
  14. Rezzani, R.; Nardo, L.; Favero, G.; Peroni, M.; Rodella, L.F. Thymus and aging: Morphological, radiological, and functional overview. Age 2014, 36, 313–351. [Google Scholar] [CrossRef] [PubMed]
  15. Thome, J.J.C.; Grinshpun, B.; Kumar, B.V.; Kubota, M.; Ohmura, Y.; Lerner, H.; Sempowski, G.D.; Shen, Y.; Farber, D.L. Long-term maintenance of human naïve T cells through in situ homeostasis in lymphoid tissue sites. Sci. Immunol. 2016, 1, eaah6506. [Google Scholar] [CrossRef] [PubMed]
  16. Kanneganti, P.; Lyle, J.; Smith, J.H.; McGuire, H.; Denlinger, R.; Simm, M. The unilateral involution in the thymus of a 96-year-old male leads to the preservation of structural integrity in one thymic lobe, as assessed by the expression of medullar and cortical antigens and the presence of CD3+ cells. Heliyon 2022, 8, e11734. [Google Scholar] [CrossRef] [PubMed]
  17. Simanovsky, N.; Hiller, N.; Loubashevsky, N.; Rozovsky, K. Normal CT characteristics of the thymus in adults. Eur. J. Radiol. 2012, 81, 3581–3586. [Google Scholar] [CrossRef] [PubMed]
  18. Araki, T.; Nishino, M.; Gao, W.; Dupuis, J.; Hunninghake, G.M.; Murakami, T.; Washko, G.R.; O’connor, G.T.; Hatabu, H. Normal thymus in adults: Appearance on CT and associations with age, sex, BMI and smoking. Eur. Radiol. 2016, 26, 15–24. [Google Scholar] [CrossRef]
  19. Gui, J.; Mustachio, L.M.; Su, D.-M.; Craig, R.W. Thymus Size and Age-related Thymic Involution: Early Programming, Sexual Dimorphism, Progenitors and Stroma. Aging Dis. 2012, 3, 280–290. [Google Scholar]
  20. Kendall, M.D.; Johnson, H.R.; Singh, J. The weight of the human thymus gland at necropsy. J. Anat. 1980, 131, 483–497. [Google Scholar]
  21. Zdrojewicz, Z.; Pachura, E.; Pachura, P. The Thymus: A Forgotten, But Very Important Organ. Adv. Clin. Exp. Med. 2016, 25, 369–375. [Google Scholar] [CrossRef] [PubMed]
  22. Ackman, J.B.; Kovacina, B.; Carter, B.W.; Wu, C.C.; Sharma, A.; Shepard, J.-A.O.; Halpern, E.F. Sex difference in normal thymic appearance in adults 20–30 years of age. Radiology 2013, 268, 245–253. [Google Scholar] [CrossRef] [PubMed]
  23. Brelińska, R. Thymic epithelial cells in age-dependent involution. Microsc. Res. Tech. 2003, 62, 488–500. [Google Scholar] [CrossRef]
  24. Chen, Y.; Qiao, S.; Tuckermann, J.; Okret, S.; Jondal, M. Thymus-derived glucocorticoids mediate androgen effects on thymocyte homeostasis. FASEB J. 2010, 24, 5043–5051. [Google Scholar]
  25. Ribatti, D.; Crivellato, E.; Vacca, A. Miller’s seminal studies on the role of thymus in immunity. Clin. Exp. Immunol. 2006, 144, 371–375. [Google Scholar] [CrossRef]
  26. Chinn, I.K.; Blackburn, C.C.; Manley, N.R.; Sempowski, G.D. Changes in primary lymphoid organs with aging. Semin. Immunol. 2012, 24, 309–320. [Google Scholar] [CrossRef] [PubMed]
  27. George, A.J.; Ritter, M.A. Thymic involution with ageing: Obsolescence or good housekeeping? Immunol. Today 1996, 17, 267–272. [Google Scholar] [CrossRef]
  28. Vick, L.V.; Collins, C.P.; Khuat, L.T.; Wang, Z.; Dunai, C.; Aguilar, E.G.; Stoffel, K.; Yendamuri, S.; Smith, R.; Mukherjee, S.; et al. Aging augments obesity-induced thymic involution and peripheral T cell exhaustion altering the “obesity paradox”. Front. Immunol. 2022, 13, 1012016. [Google Scholar] [CrossRef] [PubMed]
  29. Chung, H.Y.; Cesari, M.; Anton, S.; Marzetti, E.; Giovannini, S.; Seo, A.Y.; Carter, C.; Yu, B.P.; Leeuwenburgh, C. Molecular inflammation: Underpinnings of aging and age-related diseases. Ageing Res. Rev. 2009, 8, 18–30. [Google Scholar] [CrossRef]
  30. Flegal, K.M.; Graubard, B.I.; Williamson, D.F.; Gail, M.H. Weight-Associated Deaths in the United States. J. Women’s Health 2007, 16, 1368–1370. [Google Scholar] [CrossRef]
  31. Haslam, S.Z. Experimental mouse model of hormonal therapy effects on the postmenopausal mammary gland. Breast Dis. 2006, 24, 71–78. [Google Scholar] [CrossRef] [PubMed]
  32. Gulvady, A.A.; Ciolino, H.P.; Cabrera, R.M.; Jolly, C.A. Resveratrol inhibits the deleterious effects of diet-induced obesity on thymic function. J. Nutr. Biochem. 2013, 24, 1625–1633. [Google Scholar] [CrossRef] [PubMed]
  33. Yang, H.; Youm, Y.-H.; Sun, Y.; Rim, J.-S.; Galbán, C.J.; Vandanmagsar, B.; Dixit, V.D. Axin expression in thymic stromal cells contributes to an age-related increase in thymic adiposity and is associated with reduced thymopoiesis independently of ghrelin signaling. J. Leukoc. Biol. 2009, 85, 928–938. [Google Scholar] [CrossRef] [PubMed]
  34. Yoshida, K.; Nakashima, E.; Kubo, Y.; Yamaoka, M.; Kajimura, J.; Kyoizumi, S.; Hayashi, T.; Ohishi, W.; Kusunoki, Y. Inverse associations between obesity indicators and thymic T-cell production levels in aging atomic-bomb survivors. PLoS ONE 2014, 9, e91985. [Google Scholar] [CrossRef] [PubMed]
  35. Pawelec, G. Age and immunity: What is “immunosenescence”? Exp. Gerontol. 2018, 105, 4–9. [Google Scholar] [CrossRef] [PubMed]
  36. Curtin, S.C.; Tejada-Vera, B.; Bastian, B.A. Deaths: Leading Causes for 2020. Natl Vital Stat Rep. 2023, 72, 1–115. [Google Scholar] [PubMed]
  37. Baron, R.L.; Levitt, R.G.; Sagel, S.S.; White, M.J.; Roper, C.L.; Marbarger, J.P. Computed tomography in the preoperative evaluation of bronchogenic carcinoma. Radiology 1982, 145, 727–732. [Google Scholar] [CrossRef] [PubMed]
  38. Bertho, J.-M.; Demarquay, C.; Moulian, N.; Van Der Meeren, A.; Berrih-Aknin, S.; Gourmelon, P. Phenotypic and immunohistological analyses of the human adult thymus: Evidence for an active thymus during adult life. Cell. Immunol. 1997, 179, 30–40. [Google Scholar] [CrossRef] [PubMed]
  39. Francis, I.; Glazer, G.; Bookstein, F.; Gross, B.; Francis, G.G.I.; Heiberg, E.; Wolverson, M.; Sundaram, M.; Nouri, S.; Ackman, J.B.; et al. The thymus: Reexamination of age-related changes in size and shape. Am. J. Roentgenol. 1985, 145, 249–254. [Google Scholar] [CrossRef]
  40. Paparazzo, E.; Geracitano, S.; Lagani, V.; Citrigno, L.; Bartolomeo, D.; Aceto, M.A.; Bruno, F.; Maletta, R.; Passarino, G.; Montesanto, A. Thymic function and survival at advance ages in nursing home residents from Southern Italy. Immun. Ageing 2023, 20, 1–8. [Google Scholar] [CrossRef]
  41. Kulesh, V.; Peskov, K.; Helmlinger, G.; Bocharov, G. An integrative mechanistic model of thymocyte dynamics. Front. Immunol. 2024, 15, 1321309. [Google Scholar] [CrossRef]
  42. Olsen, N.J.; Olson, G.; Viselli, S.M.; Gu, X.; Kovacs, W.J. Androgen receptors in thymic epithelium modulate thymus size and thymocyte development. Endocrinology 2001, 142, 1278–1283. [Google Scholar] [CrossRef]
  43. Dragin, N.; Bismuth, J.; Cizeron-Clairac, G.; Biferi, M.G.; Berthault, C.; Serraf, A.; Nottin, R.; Klatzmann, D.; Cumano, A.; Barkats, M.; et al. Estrogen-mediated downregulation of AIRE influences sexual dimorphism in autoimmune diseases. J. Clin. Investig. 2016, 126, 1525–1537. [Google Scholar] [CrossRef] [PubMed]
  44. Nunes-Alves, C.; Nobrega, C.; Behar, S.M.; Correia-Neves, M. Tolerance has its limits: How the thymus copes with infection. Trends Immunol. 2013, 34, 502–510. [Google Scholar] [CrossRef]
  45. Wang, J.; Zhuo, Y.; Yin, L.; Wang, H.; Jiang, Y.; Liu, X.; Zhang, M.; Du, F.; Xia, S.; Shao, Q. Doxycycline Protects Thymic Epithelial Cells from Mitomycin C-Mediated Apoptosis In Vitro via Trx2-NF-kappaB-Bcl-2/Bax Axis. Cell Physiol Biochem. 2016, 38, 449–460. [Google Scholar] [CrossRef] [PubMed]
  46. Yan, F.; Mo, X.; Liu, J.; Ye, S.; Zeng, X.; Chen, D. Thymic function in the regulation of T cells, and molecular mechanisms underlying the modulation of cytokines and stress signaling (Review). Mol. Med. Rep. 2017, 16, 7175–7184. [Google Scholar] [CrossRef] [PubMed]
  47. Suster, S.; Rosai, J. Histology of the Normal Thymus. Am. J. Surg. Pathol. 1990, 14, 284–303. [Google Scholar] [CrossRef] [PubMed]
  48. Youm, Y.H.; Yang, H.; Amin, R.; Smith, S.R.; Leff, T.; Dixit, V.D. Thiazolidinedione treatment and constitutive-PPARgamma activation induces ectopic adipogenesis and promotes age-related thymic involution. Aging Cell 2010, 9, 478–489. [Google Scholar] [CrossRef] [PubMed]
  49. Youm, Y.-H.; Yang, H.; Sun, Y.; Smith, R.G.; Manley, N.R.; Vandanmagsar, B.; Dixit, V.D. Deficient ghrelin receptor-mediated signaling compromises thymic stromal cell microenvironment by accelerating thymic adiposity. J. Biol. Chem. 2009, 284, 7068–7077. [Google Scholar] [CrossRef]
  50. Bauer, M.E.D.; Lorenz, R.P.; Bauer, S.T.; Rao, K.; Anderson, F.W. Maternal Deaths Due to Sepsis in the State of Michigan, 1999–2006. Obstet. Gynecol. 2015, 126, 747–752. [Google Scholar] [CrossRef]
  51. Castle, S.C. Impact of age-related immune dysfunction on risk of infections. Z. Gerontol. Geriatr. 2000, 33, 341–349. [Google Scholar] [CrossRef] [PubMed]
  52. Simon, A.K.; Hollander, G.A.; McMichael, A. Evolution of the immune system in humans from infancy to old age. Proc. R. Soc. B Biol. Sci. 2015, 282, 20143085. [Google Scholar] [CrossRef]
  53. Yan, S.-X.; Wei, W. Castration reverses immunosenescence in aged mice. Acta Pharmacol. Sin. 2011, 32, 1085–1086. [Google Scholar] [CrossRef] [PubMed]
  54. Franceschi, C.; Bonafè, M. Centenarians as a model for healthy aging. Biochem. Soc. Trans. 2003, 31, 457–461. [Google Scholar] [CrossRef] [PubMed]
  55. Diseases NIoDaDaK. Body Weight Planner. Available online: https://www.niddk.nih.gov/bwp (accessed on 10 January 2024).
  56. Kartvelishvili, A.; Lesner, A.; Szponar, M.; Simm, M. Microarray analysis of differentially expressed genes in cells resistant to HIV-1. Immunol. Lett. 2004, 93, 79–86. [Google Scholar] [CrossRef] [PubMed]
  57. Sachdeva, R.; Shilpi, R.Y.; Simm, M. The interplay between the X-DING-CD4, IFN-alpha and IL-8 gene activity in quiescent and mitogen- or HIV-1-exposed PBMCs from HIV-1 elite controllers, AIDS progressors and HIV-negative controls. Innate Immun. 2014, 20, 173–183. [Google Scholar] [CrossRef]
  58. Shilpi, R.Y.; Sachdeva, R.; Simm, M. Cellular resistance to HIV-1 infection in target cells coincides with a rapid induction of X-DING-CD4 mRNA: Indication of the unique host innate response to virus regulated through function of the X-DING-CD4 gene. J. Endotoxin Res. 2012, 18, 563–570. [Google Scholar] [CrossRef]
Figure 1. The leading causes of death in the KYCOM cohort’s four age groups.
Lymphatics 02 00007 g001
Figure 2. The associations between thymic parameters and age. A one-sample t-test was used to test how the means of the thymic parameters in the KYCOM cohort (males and females) differ from the hypothetical means derived from the general population (males and females). One-way ANOVA was used to test the total variability among categorical characteristics such as (A) left and right lobes’ lengths, transverse diameter and (B) thymic weight, and variations between age groups. We tested the ANOVA hypotheses: (1) Ho—all age group means in the KYCOM cohort were statistically equal; and (2) Ha—at least one age group in the KYCOM cohort was different. Symbols Lymphatics 02 00007 i001, Lymphatics 02 00007 i002, Lymphatics 02 00007 i003 and Lymphatics 02 00007 i004 in (B) indicate thymic weight values in four age groups.
Lymphatics 02 00007 g002
Figure 3. The associations between thymic parameters and the cause of death. A one-sample t-test was used to test how the means of the thymic parameters in the KYCOM cohort (males and females) arranged according to the COD are different from hypothetical means derived from the general population (males and females). One-way ANOVA was used to test the total variability among categorical characteristics such as (A) left and right lobes’ lengths, transverse diameter, and (B) thymic weight, and variations between groups arranged according to the COD. We tested the ANOVA hypotheses: (1) Ho—all COD group means in the KYCOM cohort were statistically equal, and (2) Ha—at least one COD group in the KYCOM cohort was different. Symbols Lymphatics 02 00007 i001, Lymphatics 02 00007 i002, Lymphatics 02 00007 i003, Lymphatics 02 00007 i004 and Lymphatics 02 00007 i005 in (B) indicate thymic weight values in different COD groups.
Lymphatics 02 00007 g003
Figure 4. The associations between thymic parameters and the BMI. A one-sample t-test was used to test how the means of the thymic parameters in the KYCOM cohort (males and females) arranged according to the BMI are different from hypothetical means derived from the general population (males and females). (A) One-way ANOVA was used to test the total variability among categorical characteristics such as left and right lobes’ lengths, transverse diameter, and variations between two BMI groups. We tested the ANOVA hypotheses: (1) Ho—all BMI group means in the KYCOM cohort were statistically equal, and (2) Ha—at least one BMI group in the KYCOM cohort was different. (B) An unpaired t-test was used to compare the means of thymic weight in two BMI groups. Symbols Lymphatics 02 00007 i001 and Lymphatics 02 00007 i006 in (B) indicate thymic weight values in two BMI groups.
Lymphatics 02 00007 g004
Figure 5. The gross anatomy of the thymic gland. The thymus was excised from a 103-year-old individual and photographed in an anatomical position. (L.L.) and (R.L.) denote the left and right thymic lobes demarcated by the red-dotted line. The individual thymic lobules are visible across the right thymic lobe (white circles). Blue and black arrows show the measurements of the lobes and transverse diameter lengths.
Lymphatics 02 00007 g005
Table 1. Characteristics of KYCOM cohort.
Cohort Characteristics
SexFemale (n = 38)
Male (n = 25)
Age55–75 (n = 15)
78–85 (n = 16)
86–95 (n = 26)
96+ (n = 6)
RaceWhite (n = 59)
Black (n = 4)
Cause of DeathInfection (n = 6)
Cancer (n = 12)
Organ Failure (n = 36)
Cognitive (n = 6)
Trauma (n = 3)
BMILow/Normal BMI (n = 36)
Elevated BMI (n = 27)
Table 2. Summary of thymic measurements and one-sample t-test analysis of thymic parameters in females or males in respective age groups. The thymic size measurements in cm and weight in grams are presented as mean ± standard deviation. One-sample t-test was used to analyze how the means of the thymic parameters in the KYCOM cohort (males or females) are different from the hypothetical means derived from the general population (males or females) and presented in the table as p values for each age/sex category.
Female
Age GroupThymic Anatomy Mean Data
LL Length (cm)RL Length (cm)TD Length (cm)Thymic Weight (g)Capsule Present
55–75 (n = 9)7.600 ± 2.031 p < 0.0001 6.456 ± 1.864 p < 0.00017.611 ± 3.334 p = 0.002615.90 ± 14.31 p = 0.8072n = 6 (66%)
76–85 (n = 8)7.888 ± 2.951 p = 0.00176.733 ± 4.879 p = 0.05345.050 ± 3.026 p = 0.07567.314 ± 6.212 p = 0.0029n = 4 (50%)
86–95 (n = 17)7.012 ± 3.580 p = 0.00026.659 ± 3.104 p < 0.00016.953 ± 3.446 p = 0.000113.75 ± 13.40 p = 0.3183n = 10 (59%)
96+6.775 ± 2.392 p = 0.04337.575 ± 2.123 p = 0.01176.825 ± 2.424 p = 0.045617.52 ± 4.158 p = 0.8545n = 1 (25%)
Male
Age GroupThymic Anatomy Mean Data
LL Length (cm)RL Length (cm)TD Length (cm)Thymic Weight (g)Capsule Present
55–75 (n = 6)8.750 ± 4.127 p = 0.03409.500 ± 4.460 p = 0.02399.117 ± 4.378 p = 0.032421.25 ± 21.23 p = 0.6523n = 5 (83%)
76-85 (n = 8)9.163 ± 2.197 p = 0.00028.725 ± 2.597 p = 0.00028.275 ± 4.020 p = 0.017322.69 ± 18.93 p = 0.4312n = 5 (63%)
86–95 (n = 9)8.413 ± 2.579 p = 0.00137.656 ± 3.940 p = 0.00417.789 ± 4.249 p = 0.024418.00 ± 18.44 p = 0.8866n = 4 (44%)
96+ (n = 2)7.050 ± 1.909 p = 0.24454.000 ± 1.414 p = 0.36115.800 ± 2.546 p = 0.47786.885 ± 4.038 p = 0.1735n = 0 (0%)
Disclaimer/Publisher’s Note: The statements, opinions and data contained in all publications are solely those of the individual author(s) and contributor(s) and not of MDPI and/or the editor(s). MDPI and/or the editor(s) disclaim responsibility for any injury to people or property resulting from any ideas, methods, instructions or products referred to in the content.