Article

Health Locus of Control and Its Relationship with Quality of Life and Functioning in Multiple Sclerosis: Exploring the Mediating Role of Self-Efficacy

by
Isaac Rothman
1,*,
Alan Tennant
2,
Roger Mills
3,4 and
Carolyn Young
3,4
1
Guy’s and St Thomas’ Hospitals NHS Trust, London SE1 7EH, UK
2
Leeds Institute of Rheumatic and Musculoskeletal Medicine, University of Leeds, Leeds LS7 4SA, UK
3
Institute of Systems, Molecular and Integrative Biology, University of Liverpool, Liverpool L69 7BE, UK
4
Walton Centre NHS Foundation Trust, Lower Lane, Liverpool L9 7LJ, UK
*
Author to whom correspondence should be addressed.
Sclerosis 2025, 3(2), 10; https://doi.org/10.3390/sclerosis3020010
Submission received: 12 January 2025 / Revised: 14 March 2025 / Accepted: 24 March 2025 / Published: 29 March 2025

Abstract

:
Background/Objectives: Health locus of control (LOC) refers to one’s perceptions of who or what controls one’s health. Recent evidence has found that chance LOC (CLOC) is associated with improved quality of life (QoL) in multiple sclerosis (MS). The purpose of the current study was to identify mediators and moderators of the LOC-QoL relationship in MS. Methods: For this study, 5266 participants with MS completed a questionnaire pack that included the Multidimensional Health Locus of Control Scale, the Unidimensional Self-Efficacy Scale for MS (USE-MS), and the World Health Organization Quality of Life Scale—BREF (WHOQoL-BREF). The relationship between LOC and QoL was examined within a structural equation model (SEM). Results: In the total sample, self-efficacy was found to fully mediate the relationship between LOC and QoL for both internal (ILOC) and CLOC orientations. Powerful others LOC (PLOC) had no association with QoL. The same results were found for the relationship of LOC to functioning. In the secondary progressive MS subgroup, the relationship between CLOC and QoL was only partially mediated by self-efficacy. Conclusions: LOC influences QoL through its impact on self-efficacy, one of several potentially mediating factors between LOC and QoL in MS. Disability did not moderate the associations of LOC, but moderation of the CLOC-QoL relationship by disease subtype was found. Psychological training to improve self-efficacy in MS may be particularly useful in those subgroups where LOC-QoL is largely mediated by self-efficacy.

1. Introduction

Multiple sclerosis (MS) is an immune-driven neurological disease that has a profound impact on patients’ quality of life (QoL). It has been reported that MS affects approximately 2.3 million people worldwide, and its prevalence is remarkably heterogeneous, varying from 50 to 300 patients per 100,000 inhabitants [1].
Health locus of control (LOC) refers to the individual’s beliefs regarding control over health outcomes [2]. The construct is a mix of internal LOC (ILOC), external—powerful others LOC (PLOC), and external—chance LOC (CLOC) [3].
Early studies in MS [4] and other diseases [5,6] reported that an ILOC orientation, rather than PLOC or CLOC, was associated with improved QoL. However, a recent study conducted in a large sample of patients with MS showed that CLOC was associated with improved QoL compared with other LOC orientations [7]. The authors postulated the following two reasons for this:
(1)
The study controlled for level of disability as a confounding factor, thereby accounting for the fact that those with ILOC orientation had lower disability and short duration of disease;
(2)
In conditions with heterogenous course and no cure, those who believe that their outcome is controlled by their own actions (ILOC) may engage in self-blame (“I must not be trying hard enough”); if they believe healthcare professionals determine the outcome (PLOC), they may feel resentful (“If they had only found the right drug for me…”); and belief in chance (CLOC) may lead to less psychological distress (“Everybody did their best but...”). Studies in cancer [8] and end-stage renal disease [9] have also found worse psychological outcomes related to ILOC. Another recent study found that in individuals with MS whose disability was comparatively more severe, higher CLOC beliefs correlated with improved QoL [10].
A systematic review of the relationship between LOC and MS concluded that this subject had been poorly explored; only one of the nine studies used a rigorous scientific method, and in general, sample sizes were small [11]. The author concluded that future studies should follow a randomized protocol, recruit large samples according to clearly defined inclusion/exclusion criteria, establish control groups, and use a solid conceptual framework.
The Wilson and Cleary model linking clinical variables with health-related QoL provides such a comprehensive framework [12]. This model defines health-related QoL as a product of four other clinical and biological health concepts; QoL is different to any preceding domain and is concerned with aspects of life satisfaction and wellbeing. In full, the model postulates a pathway from ‘biological and physiological variables’ → ‘symptom status’ → ‘functional status’ → ‘perceived health’ → ‘health-related quality of life’. It has been shown that the characteristics of an individual, such as LOC and self-efficacy, can potentially influence QoL and its predictor variables. The Wilson and Cleary model also incorporates the later conceptual model represented by the International Classification of Functioning, Disability and Health (ICF) provided by the World Health Organisation [13].
There are many potential mediators in the LOC-QoL relationship in MS. A recent study in patients with acquired mobility impairment found that self-efficacy, which relates to a person’s confidence in their ability to master a situation, fully mediated the relationship between LOC and life satisfaction [14]. Interestingly, the researchers found that ‘movement disability’ moderated the relationships between external LOC orientations and self-efficacy, in such a way that PLOC for low-disability patients was associated with reduced self-efficacy and PLOC increased self-efficacy in patients with more severe disability. The research group reasoned that in cases of disability, there was a necessity to rely on powerful others. While there is evidence that higher self-efficacy is associated with better QoL in MS [15,16], the role of self-efficacy has not been explored in the context of beliefs about locus of control.
Using a Wilson and Cleary model framework, the current study explores the potential moderating and mediating relationships between LOC, self-efficacy, disability, and QoL according to data from a large-scale study of individuals with MS. Based on the current literature, we hypothesized the following:
(1)
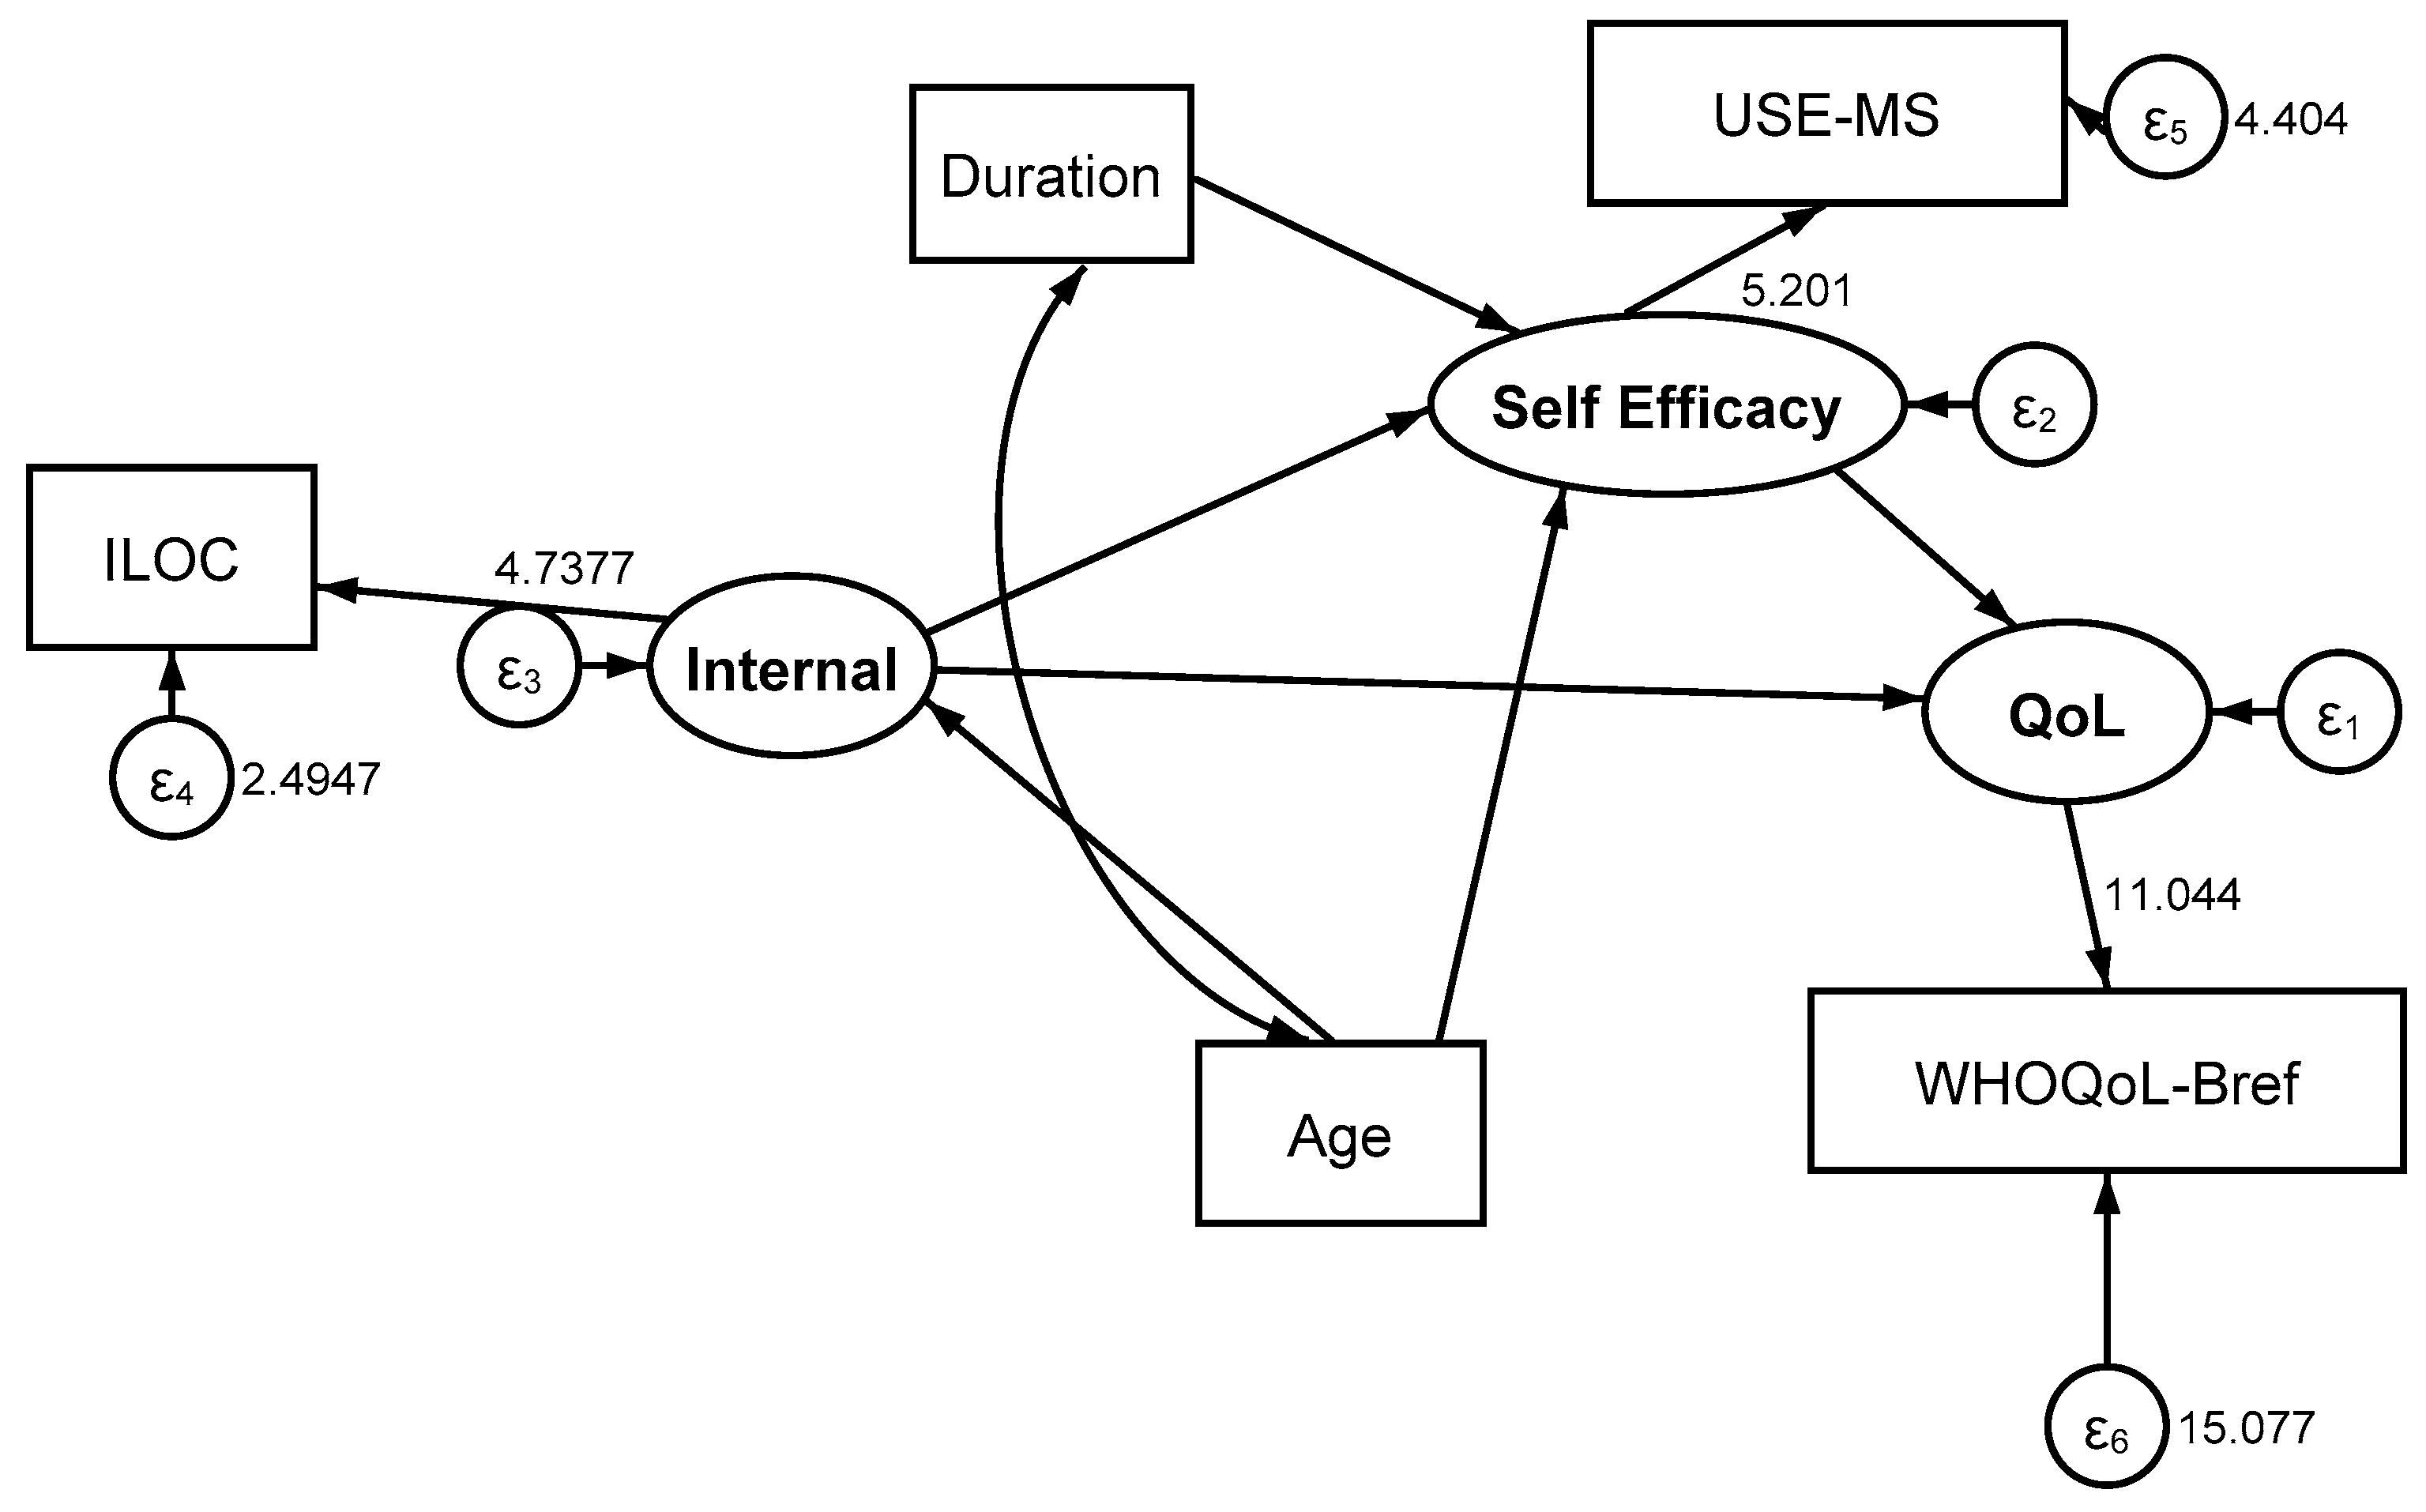
self-efficacy mediates the relationship between LOC and QoL and also the relationship between LOC and functioning (disability);
(2)
the relationship between LOC and QoL is moderated by level of disability and MS subtype, in such a way that the level of disability or MS subtype changes the emphasis of LOC in relation to self-efficacy.

2. Materials and Methods

2.1. Sample

Participants were recruited into the Trajectories of Outcome in Neurological Conditions-MS (TONiC-MS) study. Eligibility criteria included adults with physician-verified MS (by McDonald criteria [17]) of any disease subtype and level of disability, providing they could give informed consent and complete the questionnaire packs (with the help of a scribe if necessary).
Data on disease subtype at the time of study entry were provided by clinicians involved in the patients’ care and classified as relapsing-remitting (RRMS), primary progressive (PPMS), or secondary progressive (SPMS). Duration since diagnosis and Expanded Disability Status Scale (EDSS) band were obtained from medical records; higher bands indicated worse disability. Informed consent was obtained from all participants prior to enrolment.
Participants completed a baseline questionnaire pack including several patient-reported outcome measures (PROMs). The full data were further randomized into ‘training’ and ‘validation’ samples. Ethical approval was granted from the relevant research committees (reference 11/NW/0743).

2.2. Patient Reported Outcome Measures

  • World Health Organization Quality of Life Scale—BREF (WHOQoL-BREF), including 24 items covering 4 domains (physical, psychological, social relationships, and environment); a higher total score indicates higher QoL. Two stand-alone questions on QoL and satisfaction with health were not included. The total score from the 24 items, obtained via a bi-factor solution, was used in the current analysis [18,19];
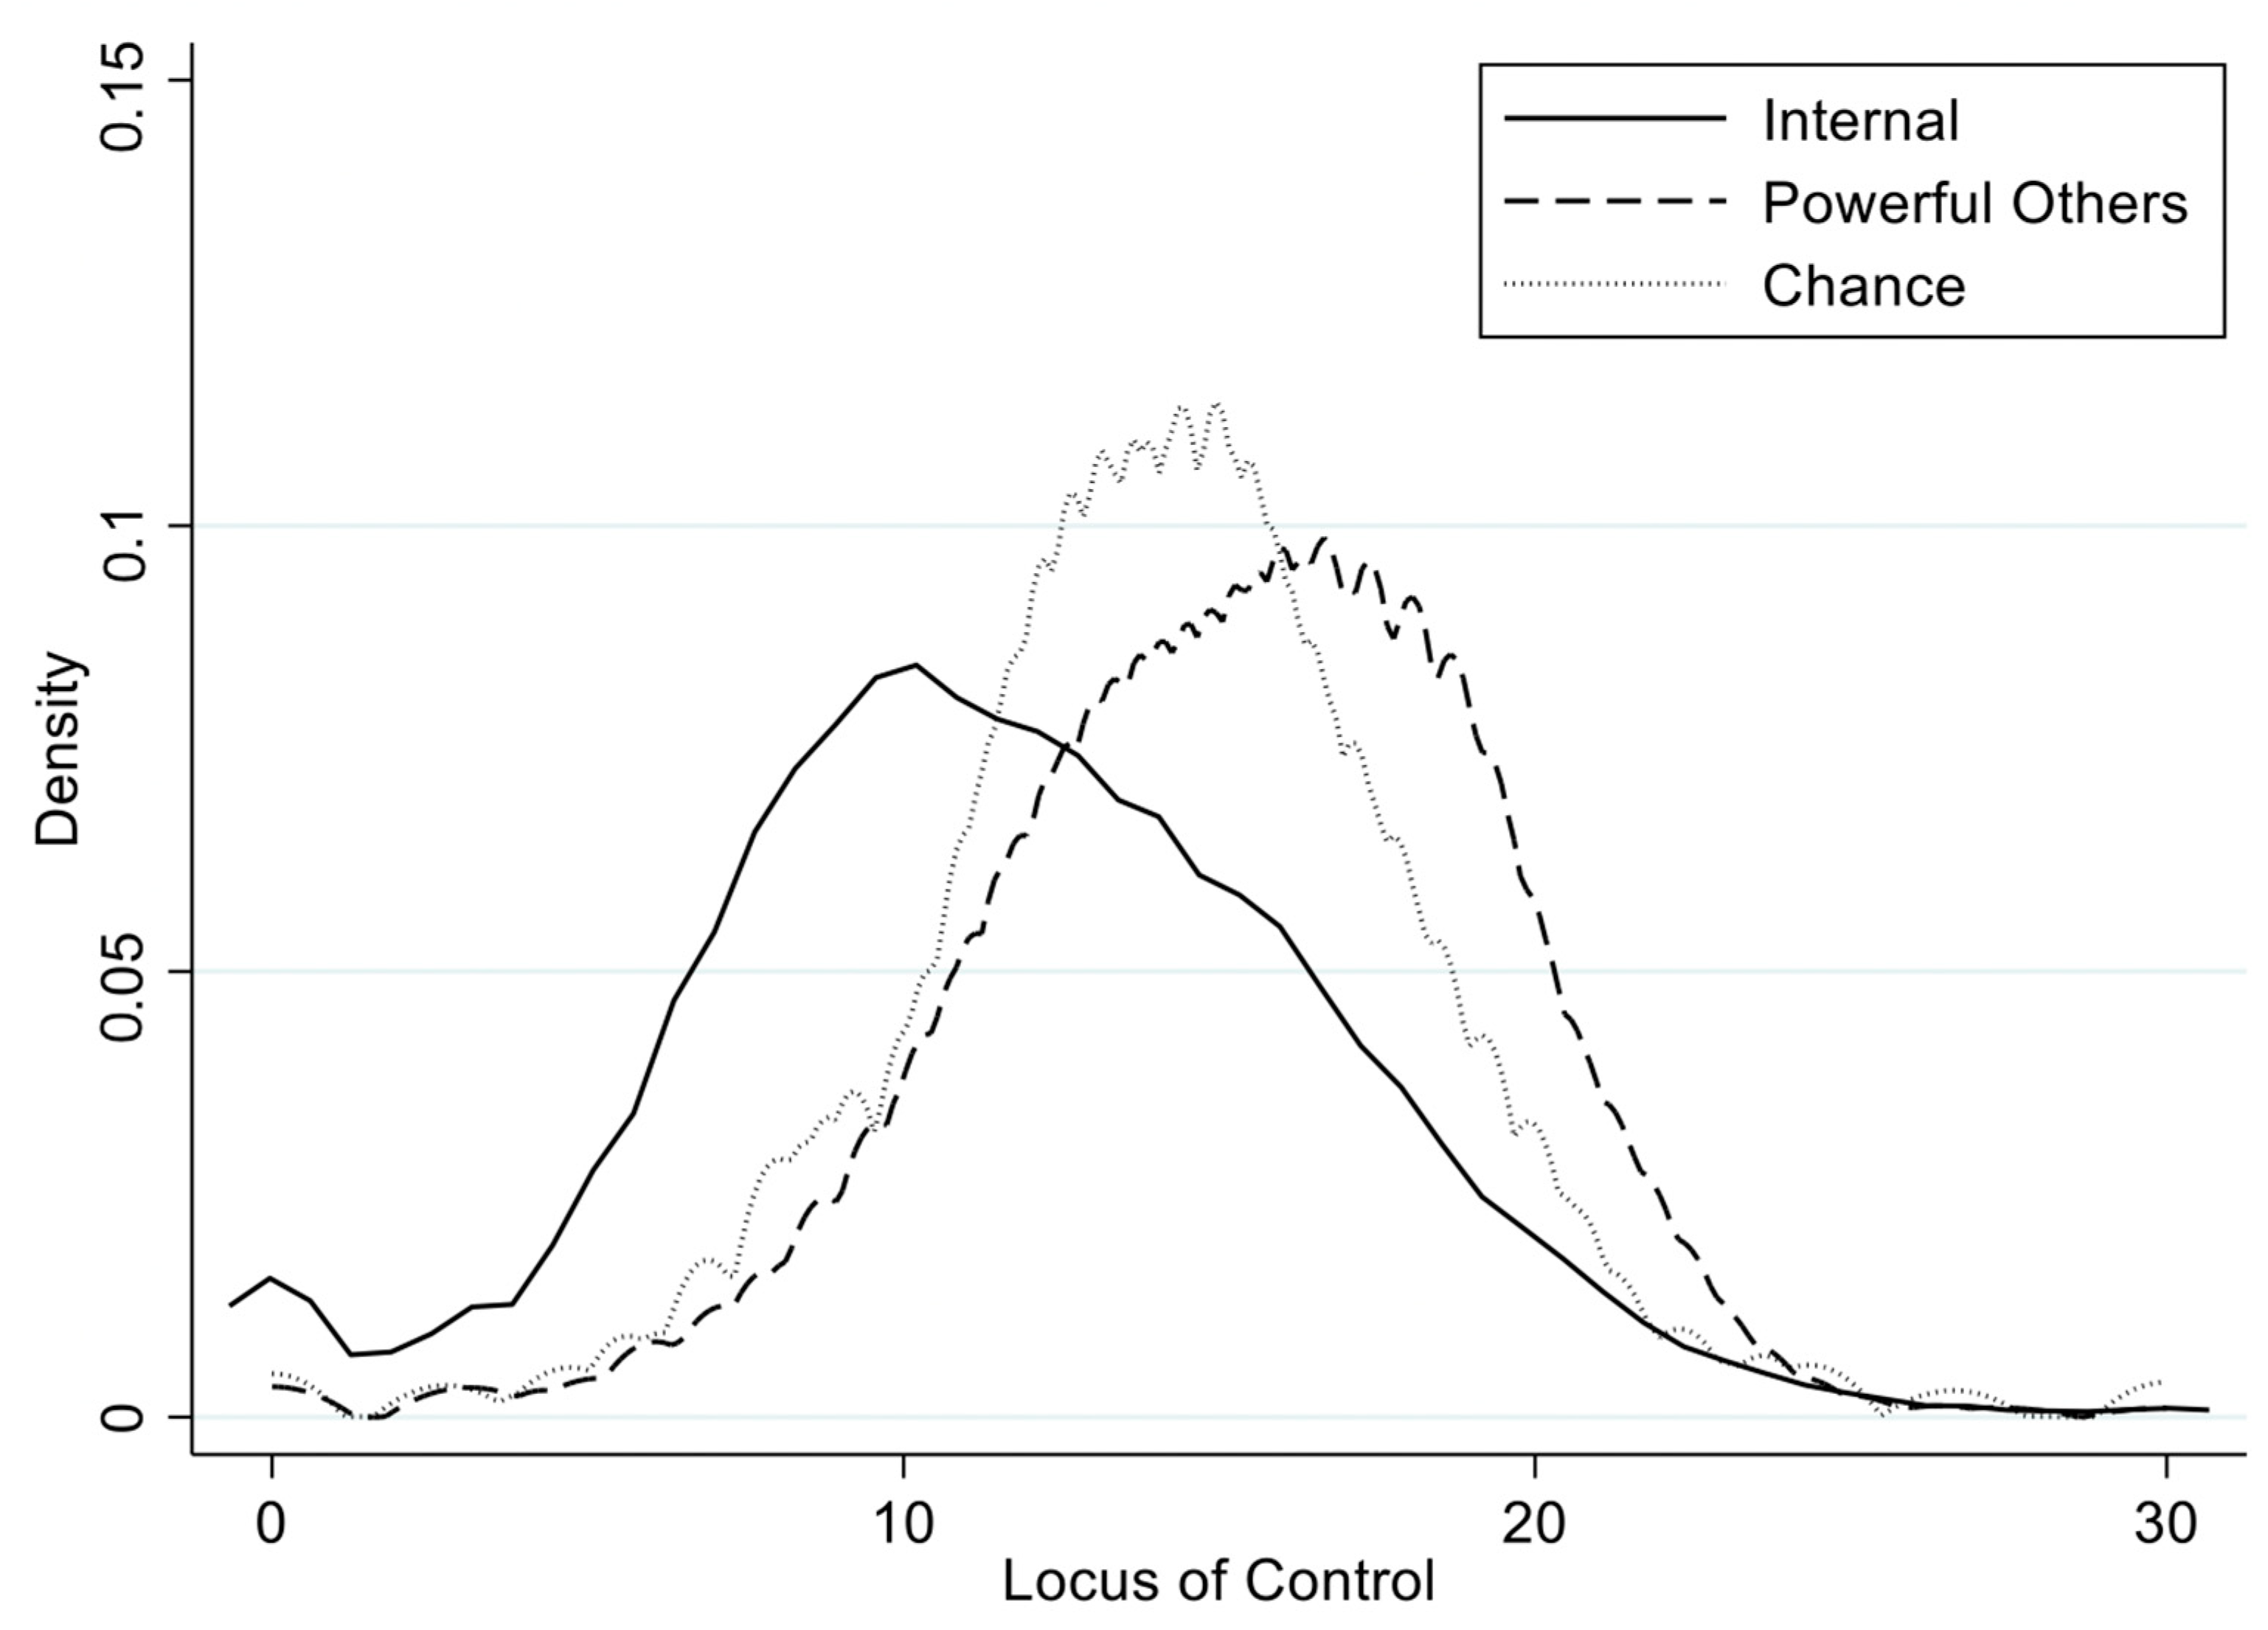
  • Multidimensional Locus of Control Scale (MHLC) Form C, consisting of four domains representing internal (ILOC), powerful others—split into ‘others’ and ‘doctors’ but merged together in the current study (PLOC)—and chance (CLOC) [20]. Thus, each domain consisted of six items scored 1–6 (changed to 0–5), giving a domain score of 0–30, with a high score indicating greater emphasis on that domain;
  • Unidimensional Self-Efficacy Scale for MS (USE-MS), derived from a qualitative investigation of how patients with MS understand and express their self-efficacy though statements such as ‘Despite my MS, I can do anything I set my mind to’, containing 12 items scored 0–3, reflecting the patient’s confidence in completing tasks and producing the desired outcomes [21];
  • World Health Organization Disability Assessment Schedule 2.0 (WHODAS-2.0) 32-item version, used in this analysis to report levels of functioning, omitting four items related to work. Higher scores indicate worse disability. This scale has been validated for MS [22,23].
All scales were transformed via Rasch analysis into interval level scales, through the use of previously published nomograms [7,19,21,23,24].

2.3. Analysis

After obtaining the appropriate descriptive statistics, the effect of LOC was examined within a structural equation model (SEM) framework, where it was considered as a variable on the causal paths to both QoL and functioning, mediated by self-efficacy. The results were consistent with the Wilson and Cleary model, with the characteristics of individuals being found to influence both functioning and QoL. Age and duration were also considered in the models. Various scales were included in the model as single-indicator latent variables, based on Rasch-transformed latent estimates [7,25]. Full details of the Rasch methodology applied are given in Appendix A.
The SEM was applied to the training samples and then, if appropriate, to a validation sample. Given the three latent and three exogenous variables, the minimum sample size for the models was 1258, with 0.8 power and 0.05 significance, together with an expected effect size of 0.1 [26]. Interpretation of path coefficients indicates that to be meaningful, a coefficient must be significant and have a value of at least 0.1 [27]. This latter requirement is particularly relevant to the current study, where each sample size exceeded 2500, giving sufficient power to detect very small effects. The various models were tested for moderation across disability and MS subtype. The significance level for the Wald test for invariance was set at 0.01.

3. Results

3.1. Descriptive

By the beginning of 2020, 5239 people with MS had returned baseline questionnaire responses, including responses to the MHLC questionnaire. Their mean age was 49.8 years (SD 11.9) and the mean duration of disease was 11.0 years (SD 9.6). Almost three-quarters (73.5%) were female. In total, 11.1% had primary progressive MS (PPMS), 66.9% had relapsing-remitting MS (RRMS), and 22.0% had secondary progressive MS (SPMS). Just over half (52.4%) had an EDDS score between 0 and 4, 36.5% had a score between 4.5 and 6.5, 6.4% between 7 and 7.5, and 4.7% between 8.0 and 9.5.
The mean Rasch-based estimate for ILOC was 11.8 (SD 5.0), PLOC 15.4 (SD 4.1), and CLOC 14.3 (SD 4.1). The kernel density estimates for each are shown in Figure 1. On each scale, indicators of LOC domain focus were defined by score above 15; their pattern is shown in Figure 2. Very few individuals with ILOC had only that focus, whereas almost a quarter (22%) of those with PLOC maintained a single focus.
Randomizing the sample into ‘training’ and ‘validation’ groups revealed no significant differences between groups in terms of age, disease duration, gender, or disease subtype. There was no significant difference between groups in levels of ILOC or PLOC. CLOC was associated with a small significant difference (t-test 2.6033 (df 5237); p = 0.009), but with an effect size of 0.072, this difference was considered trivial.

3.2. Structural Equation Models

The following set of models was used to test Hypotheses 1 and 2.

3.2.1. Self-Efficacy as a Mediator Between LOC and QoL, and Between LOC and Functioning (Disability)

This model is illustrated in Figure 3, with ILOC → QoL as the focal relationship and including partial mediation by self-efficacy. This model (SEM1) performed adequately with the training sample and this level of performance was replicated (SEM2) in the validation sample (Table 1). All paths in both samples were found to be significant, but the coefficient of the direct path from ILOC to QoL was below 0.1 in both the training and validation samples. The direct, indirect, and total effects determined from the SEM2 validation sample are shown in Table 2. The total effect of ILOC upon QoL was largely driven by the indirect effect, supporting the suggestion that ILOC → QoL is fully mediated by self-efficacy. The total effect of self-efficacy upon QoL was calculated to be 6.7 times larger than that of ILOC.
Regarding PLOC → QoL, there was adequate fit in the training sample, with an extra relationship specified between disease duration and QoL. It was necessary to add additional paths from age and disease duration to QoL to achieve fit in the validation sample. However, both the direct and indirect paths for PLOC were non-significant (Table 2—SEM3).
Considering CLOC → QoL, both the training and validation samples used in the model were adequate. While the path from CLOC to self-efficacy was significant in the training sample, the magnitude was marginally below 0.1 [0.094] (SEM4). This was repeated in the validation sample, where the coefficients were smaller. It can thus be concluded that that there is only weak evidence to suggest that CLOC → QoL is mediated by self-efficacy. For SEM4, the direct, indirect, and total effects calculated using the training sample are shown in Table 2, revealing that the total effect of CLOC was some nine times smaller than that of self-efficacy.
The model was re-specified with the focal relationship as ILOC → Functioning. Two additional paths were added, from age to functioning and from disease duration to functioning. The model was deemed to be adequate according to the training sample (SEM6), where ILOC → Functioning was fully mediated by self-efficacy, discounting a significant but non-meaningful direct pathway. The full mediation described by this model was confirmed in the validation sample, which revealed that the direct pathway was not significant. The direct, indirect, and total effects according to the validation sample are described in Table 2—SEM7.
Turning our attention to PLOC → Functioning, the model showed adequate fit in the training sample, but both PLOC paths were non-significant (SEM8). For CLOC → Functioning, the fit with the training sample (SEM9) was once again adequate. The pathway from CLOC to self-efficacy was significant, but that to functioning was not, indicating a fully mediated effect. These findings were supported by the validation sample; the direct and indirect effects are reported in Table 2—SEM10.
In summary, both ILOC and CLOC were found to have fully mediated effects upon QoL, albeit with a low coefficient for the latter. Regarding functioning, ILOC and CLOC were again associated with full mediation. PLOC had no significant paths to either QoL or functioning.

3.2.2. The Moderating Effect of Disability upon the LOC–Self-Efficacy–QoL Relationship

Disability, divided into EDSS 0–4 and ≥4.5, was added to the ILOC → QoL model as a moderator. For the training sample, the group-based model was found to be adequate (SEM11). ILOC was associated with full mediation at both levels of disability, and this effect was invariant, with no statistical differences in the estimated pathways across the levels of disability. The validation sample had a weak fit, although full mediation was retained at both levels of disability and the effect was once again invariant across the groups (SEM12). The direct, indirect, and total effects associated with EDSS 0–4 and EDSS ≥ 4.5 according to the training sample are shown in Appendix A, Table A1—SEM11a and SEM11b, respectively.
In the PLOC → QoL model, no significant path to self-efficacy or QoL was observed in either the training or validation samples, with only the former having marginal fit (SEM13). Additional paths were required to obtain a valid solution.
For CLOC → QoL, the training sample had adequate fit but the pathway from CLOC to self-efficacy in the EDSS 0–4 group was only marginally meaningful (0.094) (SEM14). These weak paths were invariant to group membership. The validation sample had less than adequate fit (SEM15) and the same weaknesses in path coefficients, including a non-significant pathway between CLOC and self-efficacy. The results revealed no variation associated with group membership. The direct, indirect, and total effects revealed through analysis of the training sample are shown in Appendix A, Table A1—SEM14a, SEM14b.

3.2.3. The Moderating Effect of Disease Subtype on the LOC–Self-Efficacy–QoL Relationship

With disease subtypes defined as PPMS, RRMS, and SPMS, the model fit in the ILOC → QoL training sample was adequate (SEM16). The effect of ILOC was fully mediated and invariant across all three groups. The fit of the validation sample, with only weak replication, indicated that the influence of ILOC on QoL was fully mediated by self-efficacy in PPMS and RRMS but partially mediated in SPMS (SEM17). The direct, indirect, and total effects according to the training sample are shown in Appendix A, Table A1—SEM16a–16c.
Regarding PLOC → QoL, an adequate fit was achieved in the training sample (SEM18). The path from PLOC to self-efficacy was not significant for PPMS or RRMS, while it was significant for SPMS. However, this could not be validated.
In the analysis of CLOC → QoL, the training sample provided an adequate fit (SEM19). CLOC was partially mediated in both PPMS and RRMS, while in the SPMS subtype CLOC had only a direct but not significant effect. This model also showed variability in their paths to self-efficacy that was associated with both age and duration of disease; for example, neither of the progressive subtypes showed a significant relationship between disease duration and self-efficacy, but RRMS did. There was only weak support from the validation sample (SEM20). The direct and indirect effects of CLOC across disease subtype (according to the training sample) are shown in Appendix A, Table A1—SEM19a–19c.
In summary, the influence of LOC on QoL was largely mediated through self-efficacy. Where a satisfactory model was achieved, the pathways from ILOC and CLOC to QoL were not affected by the level of disability, but both ILOC and CLOC were associated with differences in the moderating effect of disease subtype, notably for SPMS. PLOC was associated with no significant effects across any of the models.
Regarding Hypotheses 1 and 2, the following conclusions can be stated:
(1)
‘Self-efficacy mediates the relationship between LOC and QoL, and between LOC and functioning (disability)’—this hypothesis is supported for both ILOC and CLOC, but not for PLOC.
(2)
‘The above mediating relationship between and QoL is moderated by the level of disability and the MS subtype, in such a way that the level of disability or the MS subtype can change the emphasis of the LOC in relation to self-efficacy’—All models showed invariance with regard to disability; however, in relation to the disease subtype, the results for ILOC and CLOC varied and were influenced by variable pathways in SPMS. As such, this hypothesis is supported for the MS subtype but not for disability.

4. Discussion

Variable levels of LOC were found in the data, with ILOC showing a lower median than either PLOC or CLOC. ILOC also had a lower sole focus than the others, mostly sharing its focus with other LOC domains. The SEM results acquired in the current study support the hypothesis that the effects of ILOC and CLOC upon QoL are (fully) mediated by self-efficacy. Likewise, a full-mediation model was found to apply for both ILOC and CLOC with regard to functioning. No evidence was found to support either the direct or indirect effects of PLOC upon self-efficacy, QoL, or functioning. Therefore, this study provided no evidence to support the suggestion that PLOC increased self-efficacy in MS patients with higher levels of disability, as was found in relation to movement disabilities [14].
In general, the models used in the current study did not indicate a moderating influence on the examined pathways, except for the influence of disease subtype on ILOC and CLOC in relation to QoL. Specifically, the mediating effect of self-efficacy between LOC and QoL was weaker in SPMS compared with the other subtypes. In the current study, progressive subtypes, particularly SPMS, were associated with lower self-efficacy. This may have been reflected in the strength of its ability to mediate, leaving room for a direct effect of ILOC. Also, in this subpopulation, it is likely that other personal factors play a greater mediating role.
The differences found in the current study compared with previous studies [10] may be a function of the measures used to assess QoL. The Wilson and Cleary model separates QoL from functioning, the latter being only one influence upon QoL. The MSQoL-54 used in previous work is predominately a measure of symptoms (impairments) and functioning (activity limitation and participation) [28]. In this respect, the findings from the current study on LOC → Functioning may allow closer comparison.
An earlier taxonomy of personality suggested that self-esteem, LOC, generalized self-efficacy, and neuroticism contribute to a broad personality trait termed ‘core self-evaluation’ [29]. The authors hypothesized that this broad trait relates to motivation and performance, and this was supported by three separate studies. Furthermore, when the core traits were considered as one nomological network, they proved to be more consistent predictors of behavior than when used in isolation. This provides an important context to the current study findings, as it may be that self-efficacy downregulates the effects of LOC upon QoL.
Other mediators have been observed with respect to QoL in MS. One study that used a disease-specific QoL measure to examine risk factors and protective factors relating to QoL in MS found that resilience increased QoL [30]. In another study, depression accounted for the majority of a fatigue–QoL relationship when modelled as a mediator [31].
Coping strategies and self-blame are two other important factors to consider. One study that investigated coping as a moderator reported that self-blame predicted worse mental health-related QoL (HRQoL) [32]. As suggested in a previous study, higher levels of QoL seen in those with MS and a CLOC preference may be partly due to reduced self-blame in these individuals compared with others who rely more on internal forces or other people to control their health outcomes [7].
This study highlights the importance of self-efficacy as a mediator between LOC and QoL in MS. Self-efficacy can be improved with certain psychological techniques, both in general and specifically in cases of MS. For example, self-care training provided by nurses has been shown to improve self-efficacy in MS [33]. Based on the findings of the current study, such techniques would be useful for those who believe that internal forces or fate control their health outcomes, but they may be less useful for those who consider such outcomes to rely on other people. For the latter group, other mediators in the LOC-QoL relationship (such as resilience, depression, coping, and self-blame) should be explored so that psychological interventions can be deployed in an individualized manner.

4.1. Limitations and Strengths

There are many ways in which LOC can be operationalized in this type of analysis, and the presented results therefore reflect the operationalization of the current study. The use of the Wilson and Cleary model predicates the separation of functioning to QoL, and comparison with other studies that have used the former as an endpoint may thus be difficult. Furthermore, the adopted model included a simplification of the pathway, while it did not include the wide range of symptoms such as fatigue or cognitive effects that may play an important role in the pathway. The interpretation of the fit of the SEM may be considered by some to be strict. Nevertheless, we relied on a non-significant χ2 as the primary indicator of whether or not the covariance matrix implied by the model was sufficiently close to the sample covariance matrix for the differences reasonably to be considered as having been due to sampling error [34]. Acknowledging that the sample sizes in the current study were relatively large, the ancillary fit statistics are also reported; in all cases, these were acceptable. The model LOC → Functioning is relatively weak, relying as it does on a single degree of freedom.
The current study’s approach also has several strengths. These include the model’s consistency with the theoretical Wilson and Cleary framework, the large sample size, and the use of Rasch analysis to deliver estimates of interval levels for the SEM. Finally, the training and validation samples strengthened the results through cross-validation.

4.2. Future Work

A myriad of potential mediators may affect the LOC-QoL relationship in MS, and some of these are discussed above. Any model specifying these mediators should measure them within a clear conceptual framework in order to facilitate comparisons between studies. The concept of self-efficacy as part of a broad personality trait (‘core self-evaluation’) might be a fruitful area to explore. Such an approach might also consider the concept of self-management [35].

5. Conclusions

In conclusion, the relationships between ILOC/CLOC and QoL were shown to be fully mediated by self-efficacy, while no such relationship was found for PLOC. There is no evidence to support moderation of LOC → QoL pathways according to the patient’s level of disability, but MS subtype did moderate the relationships between ILOC/CLOC, self-efficacy, and QoL, indicating that mediators other than self-efficacy play a more important role in SPMS.

Author Contributions

The authors contributed to this work in the following ways: conceptualization, C.Y., A.T. and R.M.; methodology, I.R. and A.T.; formal analysis, I.R. and A.T.; data curation, A.T.; writing—original draft preparation, I.R. and A.T.; writing—review and editing, C.Y.; funding acquisition, C.Y. All authors have read and agreed to the published version of the manuscript.

Funding

This research was funded by unrestricted grants from Biogen, Merck, Novartis, Roche, Sanofi Genzyme, Teva, and Neurological Disability Fund 4530.

Institutional Review Board Statement

The study was conducted in accordance with the Declaration of Helsinki and approved by the Institutional Review Board Ethics Committee of the North West—Greater Manchester West Research Ethics Committee (reference 11/NW/0743, 14 March 2016).

Informed Consent Statement

Informed consent was obtained from all subjects involved in this study.

Data Availability Statement

The datasets presented in this article are not readily available due to reasons of confidentiality and because the study is ongoing. Requests to access the datasets should be directed to Carolyn Young.

Acknowledgments

We thank participants and their families for their invaluable contributions, and we are indebted to the TONiC study network of collaborators and their clinical teams for identifying and caring for the patients in this study, and also to the staff in the TONiC office for their hard work and commitment.

Conflicts of Interest

The authors declare no conflicts of interest. The funders had no role in the design of the study; in the collection, analyses, or interpretation of data; in the writing of the manuscript; or in the decision to publish the results.

Appendix A

Methods of Rasch Analysis

Data from each (sub)scale were tested against the requirements of the Rasch measurement model [24]. Briefly, these requirements included (i) unidimensionality, (ii) monotonicity, (iii) homogeneity, (iv) local independence, and (v) group invariance [36,37]. Whichever set of items are added together to provide the score, they should satisfy all of the requirements, as follows: (i) they should measure one thing (domain/construct/trait); (ii) the probability of a positive response to an item (or in the case of polytomous items, the transition from one response category to the next) should increase along with the underlying trait, as should the total score [38]; (iii) the same hierarchical ordering of items should hold for each level (or grouping) of the score [39]; (iv) items should be conditionally independent of one another [40]; and (v) the response to items across different groups such as age or gender should be the same, conditional on the total score—this is referred to as (the absence of) differential item functioning (DIF) [37].
Each requirement was tested. A t-test was used to determine whether two separate groups of items would deliver significantly different estimates, following the procedure described by Smith [41]. The hierarchical ordering of items across the scale was determined through a Chi-square test of fit based on grouped scores. Monotonicity was evaluated through inspecting the ordering of item categories. Conditional item dependence was determined though the correlation of residuals; pairwise correlations should not exceed 0.2 above the average residual [42]. Where clusters of locally dependent items were found, consideration was given to grouping these into ‘super items’ or testlets (simply adding them together to make one larger item, the latter based on a priori defined groups) to absorb the local dependency [43]. RUMM2030 software provided a bi-factor equivalent solution retaining a specified proportion of the variance. In the reporting of this “explained common variance (ECV)” a value less than 0.7 is indicative of requiring a multidimensional model, a value above 0.9 requires a unidimensional model, and the grey area in between is undetermined, requiring further evidence [44]. Consequently, an ECV value of 0.9 or above was considered acceptable in the current analysis. Where possible, when two parallel forms are created from either a subscale structure if this is present, or from the pattern of local dependency in the item set, a latent correlation ≥ 0.9 is required. This is consistent with the reliability required for individual use [45]. Consequently, valid parallel forms require both their latent correlation to be ≥0.9 and their ECV to be ≥0.9.
Group invariance (DIF) was tested through ANOVA of residuals for age, gender, duration since diagnosis, education level, whether or not the patient was self-employed or employed, and whether they worked full-time or part-time. Where DIF was identified it was tested through comparison of individual estimates from split and unsplit solutions, to identify whether it was ‘substantive’ [46]. Where the differences were significant (according to the paired t-test), the results are reported as an effect size where a value higher than 0.1 is considered to represent substantive DIF. In such cases, the scale works in different ways according to the contextual factor under consideration, and these results are reported separately.
A hierarchical approach was adopted to determine the fit of the data to the model’s existing scales, with level 1 as the priority (Table A2). All the aspects listed above had to be met. Where a level 5 solution was unavailable, item deletion was considered (level 6). If this failed, level 7 was utilized to test whether the scale satisfied ordinal scaling; if not, level 8 indicated failure.
Table A1. Moderated models: Direct, Indirect, and Total Effects.
ModelDependent Variable/ModeratorSample and VariablesDirect EffectIndirect EffectTotal Effect% Variance Explained (R2)
SEM11aQoL
EDSS 0–4Self-efficacy0.953 0.95385.1
ILOC−0.0570.1240.067
Duration −0.005−0.005
Age −0.005−0.005
SEM11bQoL
EDSS 4.5+Self-efficacy0.888-0.88883.6
ILOC−0.0900.1520.063
Duration-0.0010.001
Age-0.0100.010
SEM14aQoL
EDSS 0–4Self-efficacy0.945-0.94585.0
CLOC0.0030.0890.092
Duration-−0.005−0.005
Age-−0.005−0.005
SEM14bQoL
EDSS 4.5+Self-efficacy0.858-0.85882.0
CLOC0.0340.0320.066
Duration-0.001−0.002
Age-0.0090.009
SEM16aQoL
PPMSSelf-efficacy0.975-0.97588.4
ILOC−0.0800.1520.073
Age-0.0090.009
Duration-−0.000−0.000
SEM16bQoL
RRMSSelf-efficacy0.955 0.95587.0
ILOC−0.0710.1620.090
Age-−0.004−0.004
Duration-−0.011−0.011
SEM16cQoL
SPMSSelf-efficacy0.817-0.81781.1
ILOC−0.0640.1640.099
Age-0.0070.007
Duration-0.0020.002
SEM19aQoL
PPMSSelf-efficacy0.952-0.95287.1
CLOC−0.0170.1210.104
Age-0.0090.009
Duration-−0.000−0.000
SEM19bQoL
RRMSSelf-efficacy0.944-0.94486.6
CLOC0.0080.0880.096
Age-−0.004−0.004
Duration-−0.011−0.011
SEM19cQoL
SPMSSelf-efficacy0.791-0.79181.4
CLOC0.0700.0360.107
Age-0.0070.007
Duration-0.0020.002
SEM = structural equation model; EDSS = expanded disability status scale; PPMS = primary progressive multiple sclerosis (MS); RRMS = relapsing-remitting MS; SPMS = secondary progressive MS; ILOC = predominantly internal locus of control (LOC); CLOC = predominantly chance LOC; QoL = quality of life.
Table A2. Strategies to determine the fit of the data to the model.
LevelNatureAdjustmentsReporting
Chi-SquareECV
≥0.9
Latent
Correlation
≥0.9
1Item-basedNoneInteractionNoNo
2Item-basedClusters for local item dependencyInteractionYesNo
3Domain-basedOn existing sub-scales > 2InteractionYesNo
4Parallel formOn existing sub-scales ≤ 2 or
2 local dependency patterns or conceptual groups
ConditionalYesYes
5Parallel formOn alternative itemsConditionalYesYes
6Item deletionOn all original items
Repeat Levels 1–5
InteractionNoNo
7Mokken scalingon items if unidimensional. Loevinger’s coefficient H ≥ 0.4—moderateNoNoNo
8FailNo valid ordinal scaleNoNoNo

References

  1. Thompson, A.J.; Baranzini, S.E.; Geurts, J.; Hemmer, B.; Ciccarelli, O. Multiple sclerosis. Lancet 2018, 6736, 1622–1636. [Google Scholar] [CrossRef] [PubMed]
  2. Wallston, K.A.; Wallston, B.S. Who is responsible for your health: The construct of health locus of control. In Social Psychology of Health and Illness, 1st ed.; Sanders, G.S., Suls, J., Eds.; Psychology Press: London, UK, 1982. [Google Scholar]
  3. Wallston, K.A.; Wallston, B.S.; DeVellis, R. Development of the Multidimensional Health Locus of Control (MHLC) Scales. Health Educ. Monogr. 1978, 6, 160–170. [Google Scholar]
  4. Wassem, R. A test of the relationship between health locus of control and the course of multiple sclerosis. Rehabil. Nurs. 1991, 16, 189–193. [Google Scholar] [PubMed]
  5. Grinberg, A.S.; Seng, E.K. Headache-Specific Locus of Control and Migraine-Related Quality of Life: Understanding the Role of Anxiety. Int. J. Behav. Med. 2017, 24, 136–143. [Google Scholar] [CrossRef]
  6. van Mierlo, M.L.; Schröder, C.; van Heugten, C.M.; Post, M.W.; de Kort, P.L.; Visser-Meily, J.M. The influence of psychological factors on health-related quality of life after stroke: A systematic review. Int. J. Stroke 2014, 9, 341–348. [Google Scholar] [CrossRef] [PubMed]
  7. Rothman, I.; Tennant, A.; Mills, R.J.; Young, C.A. The Association of Health Locus of Control with Clinical and Psychosocial Aspects of Living with Multiple Sclerosis. J. Clin. Psychol. Med. Settings 2023, 30, 821–835. [Google Scholar]
  8. Burish, T.G.; Carey, M.P.; Wallston, K.A.; Stein, M.J.; Jamison, R.N.; Lyles, J.N. Health Locus of Control and Chronic Disease: An External Orientation May Be Advantageous. J. Soc. Clin. Psychol. 1984, 2, 326–332. [Google Scholar]
  9. Christensen, A.J.; Wiebe, J.S.; Benotsch, E.G.; Lawton, W.J. Perceived health competence, health locus of control, and patient adherence in renal dialysis. Cogn. Ther. Res. 1996, 20, 411–421. [Google Scholar]
  10. Leist, J.B.; Leist, T.P. Multiple sclerosis: Relationship between locus of control and quality of life in persons with low versus high disability. Health Psychol. Behav. Med. 2022, 10, 316–334. [Google Scholar] [CrossRef]
  11. Bragazzi, N.L. The Gap in the Current Research on the Link between Health Locus of Control and Multiple Sclerosis: Lessons and Insights from a Systematic Review. Mult. Scler. Int. 2013, 2013, 972471. [Google Scholar]
  12. Wilson, I.B.; Cleary, P.D. Linking clinical variables with health-related quality of life. A conceptual model of patient outcomes. JAMA 1995, 273, 59–65. [Google Scholar] [PubMed]
  13. World Health Organization. ICF: International Classification of Functioning, Disability, and Health; World Health Organization: Geneva, Switzerland, 2001. [Google Scholar]
  14. Rogowska, A.M.; Zmaczynska-Witek, B.; Mazurkiewicz, M.; Kardasz, Z. The mediating effect of self-efficacy on the relationship between health locus of control and life satisfaction: A moderator role of movement disability. Disabil. Health J. 2020, 13, 100923. [Google Scholar] [PubMed]
  15. Tahim, A.S.; Bryant, C.; Greaney, L.; Rashid, A.; Fan, K. Quality of life in adults with multiple sclerosis: A systematic review. BMJ Open 2020, 10, e041249. [Google Scholar] [CrossRef]
  16. Dymecka, J.; Gerymski, R.; Tataruch, R.; Bidzan, M. Fatigue, Physical Disability and Self-Efficacy as Predictors of the Acceptance of Illness and Health-Related Quality of Life in Patients with Multiple Sclerosis. Int. J. Environ. Res. Public. Health 2021, 18, 13237. [Google Scholar] [CrossRef]
  17. Thompson, A.J.; Banwell, B.L.; Barkhof, F.; Carroll, W.M.; Coetzee, T.; Comi, G.; Correale, J.; Fazekas, F.; Filippi, M.; Freedman, M.S.; et al. Diagnosis of multiple sclerosis: 2017 revisions of the McDonald criteria. Lancet Neurol. 2018, 17, 162–173. [Google Scholar] [CrossRef] [PubMed]
  18. WHOQOL Group. Development of the World Health Organization WHOQOL-BREF quality of life assessment. Psychol. Med. 1998, 28, 551–558. [Google Scholar]
  19. Pomeroy, I.M.; Tennant, A.; Mills, R.J.; Young, C.A. The WHOQOL-BREF: A modern psychometric evaluation of its internal construct validity in people with multiple sclerosis. Qual. Life Res. 2020, 29, 1961–1972. [Google Scholar] [CrossRef]
  20. Wallston, K.A.; Stein, M.J.; Smith, C.A. Form C of the MHLC scales: A condition-specific measure of locus of control. J. Pers. Assess. 1994, 63, 534–553. [Google Scholar] [CrossRef]
  21. Young, C.A.; Mills, R.J.; Woolmore, J.; Hawkins, C.P.; Tennant, A. The unidimensional self-efficacy scale for MS (USE-MS): Developing a patient based and patient reported outcome. Mult. Scler. 2012, 18, 1326–1333. [Google Scholar] [CrossRef]
  22. Magistrale, G.; Pisani, V.; Argento, O.; Incerti, C.C.; Bozzali, M.; Cadavid, D.; Caltagirone, C.; Medori, R.; DeLuca, J.; Nocentini, U. Validation of the World Health Organization Disability Assessment Schedule II (WHODAS-II) in patients with multiple sclerosis. Mult. Scler. 2015, 21, 448–456. [Google Scholar] [CrossRef]
  23. Young, C.A.; Rog, D.; Sharrack, B.; Majeed, T.; Constantinescu, C.; Kalra, S.; Footit, D.; Harrower, T.; Langdon, D.; Tennant, A.; et al. Measuring Disability in Multiple Sclerosis: The WHODAS 2.0. Quality of Life Research 2023. Qual. Life Res. 2023, 32, 3235–3246. [Google Scholar] [CrossRef]
  24. Rasch, G. Probabilistic Models for Some Intelligence and Attainment Tests; University of Chicago Press: Chicago, IL, USA, 1960. [Google Scholar]
  25. Hayduk, L.A.; Littvay, L. Should researchers use single indicators, best indicators, or multiple indicators in structural equation models? BMC Med. Res. Methodol. 2012, 12, 159. [Google Scholar] [CrossRef]
  26. Soper, D.S. A-Priori Sample Size Calculator for Structural Equation Models [Software]. 2023. Available online: https://www.danielsoper.com/statcalc (accessed on 5 October 2024).
  27. Huber, F.; Herrmann, A.; Meyer, F.; Vogel, J.; Wollhardt, K. Kausalmodellierung Mit Partial Least Squares–Eine anwendungsorientierte Einführung; Springer: Gabler, Wiesbaden, 2007. [Google Scholar]
  28. Vickrey, B.G.; Hays, R.D.; Harooni, R.; Myers, L.W.; Ellison, G.W. A health-related quality of life measure for multiple sclerosis. Qual. Life Res. 1995, 4, 187–206. [Google Scholar] [CrossRef] [PubMed]
  29. Erez, A.; Judge, T.A. Relationship of core self-evaluations to goal setting, motivation, and performance. J. Appl. Psychol. 2001, 86, 1270–1279. [Google Scholar]
  30. Kasser, S.L.; Zia, A. Mediating Role of Resilience on Quality of Life in Individuals with Multiple Sclerosis: A Structural Equation Modeling Approach. Arch. Phys. Med. Rehabil. 2020, 101, 1152–1161. [Google Scholar] [CrossRef] [PubMed]
  31. Fidao, A.; De Livera, A.; Nag, N.; Neate, S.; Jelinek, G.T.A.; Simpson-Yap, S. Depression mediates the relationship between fatigue and mental health-related quality of life in multiple sclerosis. Mult. Scler. Relat. Disord. 2021, 47, 102620. [Google Scholar] [CrossRef]
  32. Gil-González, I.; Martín-Rodríguez, A.; Conrad, R.; Pérez-San-Gregorio, M.A. Coping with multiple sclerosis: Reconciling significant aspects of health-related quality of life. Psychol. Health Med. 2022, 16, 1167–1180. [Google Scholar] [CrossRef]
  33. Rooddehghan, Z.; Sholehvar, M.S.; Nejati, S.; Haghani, S.; Karimi, R. Effect of self-care education on self-efficacy of patients with multiple sclerosis: A randomized clinical trial. BMC Psychol. 2024, 12, 764. [Google Scholar] [CrossRef] [PubMed] [PubMed Central]
  34. Kline, R.B. Principals and Practice of Structural Equation Modeling, 3rd ed.; Guilford Press: New York, NY, USA, 2011. [Google Scholar]
  35. Damanabi, S.; Salimzadeh, Z.; Kalankesh, L.R.; Shaafi, S.; Ferdousi, R. Exploring Self-management Needs of Persons with Multiple Sclerosis: A Qualitative Study for Mobile Application Development. Int. J. MS Care 2022, 24, 1–7. [Google Scholar] [CrossRef]
  36. Gustafsson, J. Testing and obtaining fit of data to the Rasch model. Br. J. Math. Stat. Psychol. 1980, 33, 205–233. [Google Scholar]
  37. Teresi, J.A.; Kleinman, M.; Ocepek-Welikson, K. Modern psychometric methods for detection of differential item functioning: Application to cognitive assessment measures. Stat. Med. 2000, 19, 1651–1683. [Google Scholar] [CrossRef]
  38. Kang, H.A.; Su, Y.H.; Chang, H.H. A note on monotonicity of item response functions for ordered polytomous item response theory models. Br. J. Math. Stat. Psychol. 2018, 71, 523–535. [Google Scholar] [CrossRef] [PubMed]
  39. Rost, J. An unconditional likelihood ratio for testing item homogeneity in the Rasch model. Educ. Res. J. 1982, 9, 7–17. [Google Scholar]
  40. Wilson, M. Detecting and Interpreting Local Item Dependence Using a Family of Rasch Models. Appl. Psychol. Meas. 1988, 12, 353–364. [Google Scholar] [CrossRef]
  41. Smith, E.V. Detecting and evaluating the impact of multidimensionality using item fit statistics and principal component analysis of residuals. J. Appl. Meas. 2002, 3, 205–231. [Google Scholar]
  42. Christensen, K.B.; Makransky, G.; Horton, M. Critical values for Yen's Q3: Identification of local dependence in the Rasch model using residual correlations. Appl. Psychol. Meas. 2017, 41, 178–194. [Google Scholar] [CrossRef]
  43. Wainer, H.; Kiely, G. Item clusters and computer adaptive testing: A case for testlets. J. Educ. Meas. 1987, 24, 185–202. [Google Scholar] [CrossRef]
  44. Quinn, H. Bifactor Models, Explained Common Variance (ECV), and the Usefulness of Scores from Unidimensional Item Response Theory Analyses. Ph.D. Thesis, The University of North Carolina, Chapel Hill, NC, USA, 2014. [Google Scholar]
  45. Bland, J.M.; Altman, D.G. Statistics notes: Cronbach's alpha. BMJ. 1997, 314, 572. [Google Scholar] [CrossRef]
  46. Hagquist, C.; Andrich, D. Recent advances in analysis of differential item functioning in health research using the Rasch model. Health Qual. Life Outcomes 2017, 15, 181. [Google Scholar] [CrossRef]
Figure 1. Kernel Density of Internal, Powerful Others, and Chance Locus of Control.
Sclerosis 03 00010 g001
Figure 2. Distribution of LOC Types.
Sclerosis 03 00010 g002
Figure 3. The relationship between internal locus of control and quality of life, partially mediated by self-efficacy; standardized effects. ILOC = predominantly internal locus of control; QoL = quality of life; WHOQoL-BREF = World Health Organization Quality of Life Scale—BREF; USE-MS = Unidimensional Self-Efficacy Scale for MS.
Sclerosis 03 00010 g003
Table 1. Statistical fitting for SEMs.
SEMFocusTypeχ2dfpRMSEACFI TLI
1ILOC → QoLTraining4.82030.1850.0150.9990.998
2ILOC → QoLValidation3.69030.2970.0091.0000.999
3PLOC → QoLTraining2.12310.1450.0211.000.996
4CLOC → QoLTraining6.48030.0900.0210.9980.996
5CLOC → QoLValidation0.08030.9940.0001.0001.000
6 ILOC → FunctioningTraining1.23810.2660.0321.000.999
7ILOC → FunctioningValidation3.60610.0580.0100.9990.990
8PLOC → FunctioningTraining2.11010.0460.0211.0000.996
9CLOC → FunctioningTraining0.10310.7490.0001.0001.000
10CLOC → FunctioningValidation0.02610.8730.0001.0001.000
11ILOC → QoLTraining13.4760.0360.0310.9970.991
12ILOC → QoLValidation23.0860.0010.0470.9920.997
13PLOC → QoLTraining5.32220.0700.0360.9980.983
14CLOC → QoLTraining13.0060.0430.0300.9970.991
15CLOC → QoLValidation24.9160.0000.0490.9910.974
16ILOC → QoLTraining11.1290.2680.0160.9990.998
17ILOC → QoLValidation28.7490.0010.0500.9920.976
18PLOC → QoLTraining5.69360.4980.0001.0001.000
19CLOC → QoLTraining12.9390.1660.0220.9980.995
20CLOC → QoLValidation27.490.0010.0490.9920.977
SEM = structural equation model; RMSEA = root mean square error of approximation; CFI = comparative fit index; TLI = Tucker–Lewis index; ILOC = predominantly internal locus of control (LOC); PLOC = predominantly powerful others LOC; CLOC = predominantly chance LOC; QoL = quality of life.
Table 2. Direct, Indirect, and Total effects in basic SEM models.
SEMDependent VariableSample and VariablesDirect EffectIndirect EffectTotal Effect% Variance Explained (R2)
QoL
2 Self-efficacy0.938-0.93885.4
ILOC−0.0690.2130.140
Duration-−0.088−0.088
Age-−0.068−0.068
3 Self-efficacy0.992-0.92285.0
Duration-−0.094−0.094
Age-−0.068−0.068
PLOC−0.0110.0180.008
4 Self-efficacy0.920-0.92085.1
Duration-−0.008−0.008
CLOC0.0190.0860.106
Age-−0.011−0.011
Functioning
7 Self-efficacy−0.813 −0.81371.4
Duration0.0980.0750.173
ILOC0.021−0.186−0.165
Age0.0840.0610.145
10 Self-efficacy−0.821-−0.82171.6
Duration0.0100.0080.019
Age0.0070.0050.012
CLOC−0.039−0.044−0.083
SEM = structural equation model; ILOC = predominantly internal locus of control (LOC); PLOC = predominantly powerful others LOC; CLOC = predominantly chance LOC; QoL = quality of life.
Disclaimer/Publisher’s Note: The statements, opinions and data contained in all publications are solely those of the individual author(s) and contributor(s) and not of MDPI and/or the editor(s). MDPI and/or the editor(s) disclaim responsibility for any injury to people or property resulting from any ideas, methods, instructions or products referred to in the content.

