
Biomarker Identification in Patients with Multiple Sclerosis Treated with Autologous Hematopoietic Stem Cell Transplantation

 ,
,
Abstract
1. Introduction
2. Materials and Methods
2.1. Patients and Sample Collection
2.2. miRNAs
2.3. DRB1*15
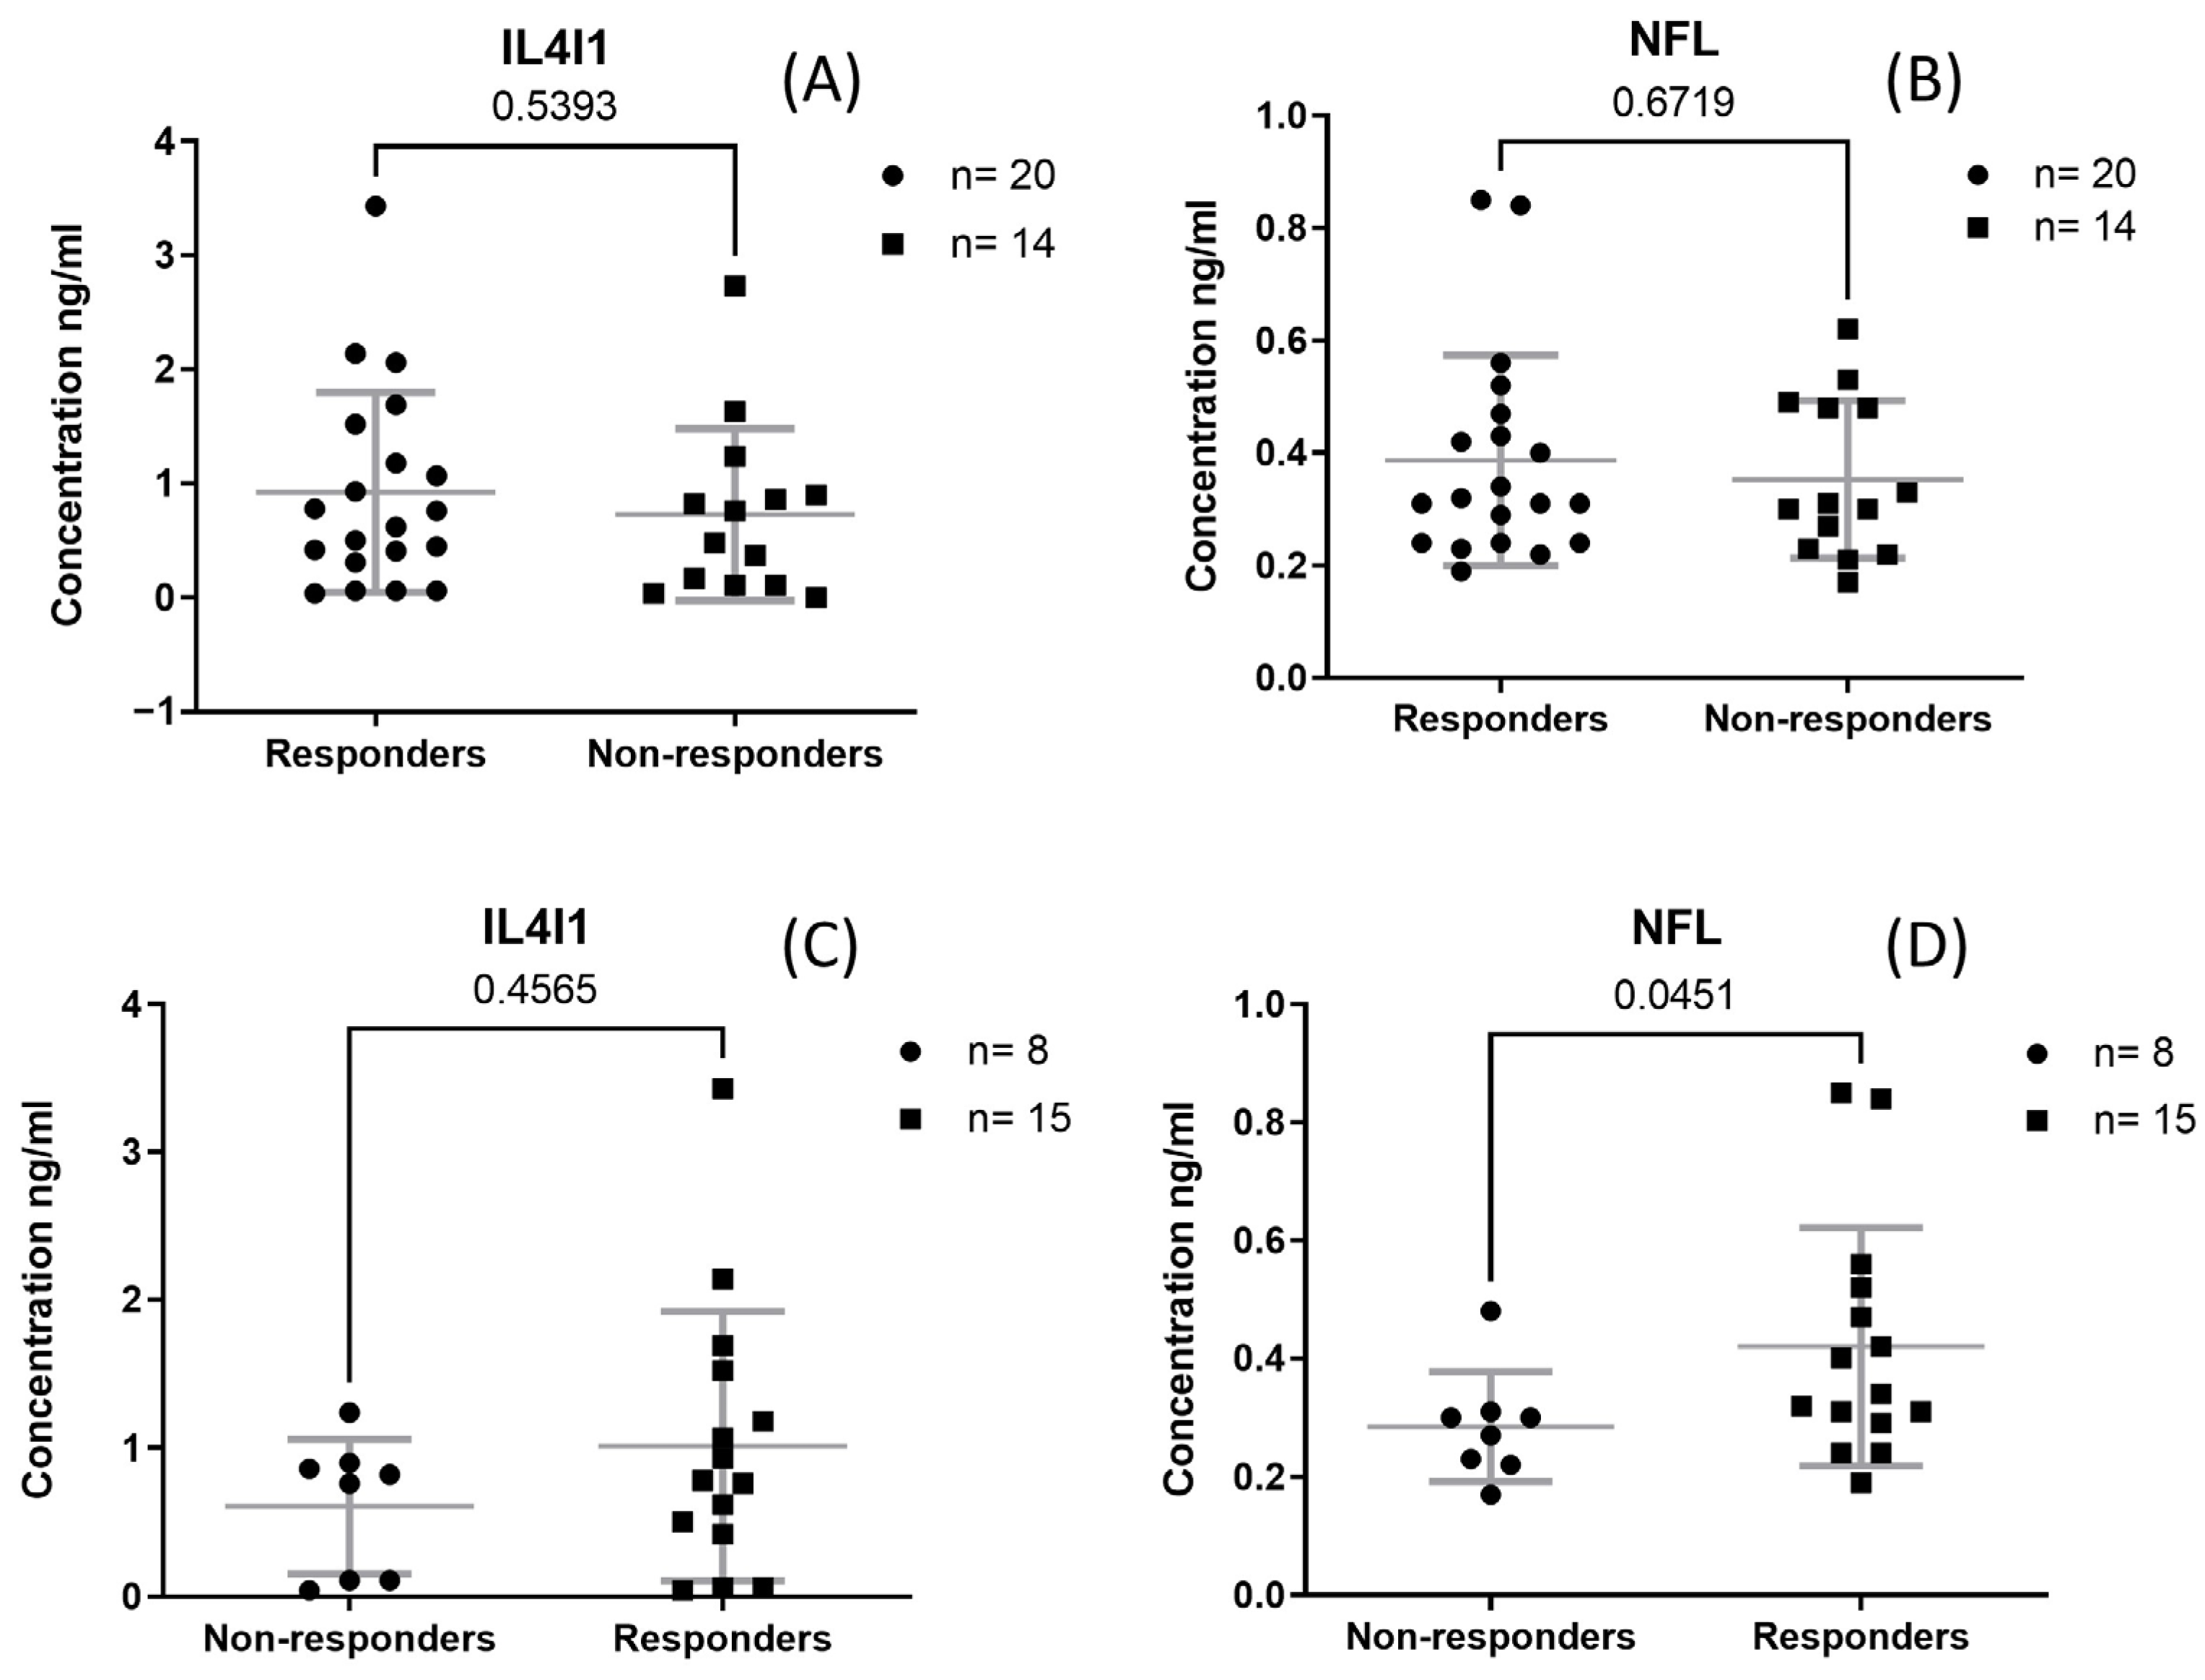
2.4. NFL and IL4I1
2.5. Data Analysis
3. Results
3.1. Clinical Characteristics and Blood Work Results
3.2. DRB1*15
3.3. NFL and IL4I1
3.4. miRNAs
4. Discussion
5. Conclusions
Author Contributions
Funding
Institutional Review Board Statement
Informed Consent Statement
Data Availability Statement
Conflicts of Interest
References
- Thompson, A.J.; Baranzini, S.E.; Geurts, J.; Hemmer, B.; Ciccarelli, O. Multiple sclerosis. Lancet 2018, 391, 1622–1636. [Google Scholar] [CrossRef]
- Dendrou, C.A.; Fugger, L.; Friese, M.A. Immunopathology of multiple sclerosis. Nat. Rev. Immunol. 2015, 15, 545–558. [Google Scholar] [CrossRef] [PubMed]
- Rush, C.A.; Atkins, H.L.; Freedman, M.S. Autologous Hematopoietic Stem Cell Transplantation in the Treatment of Multiple Sclerosis. Cold Spring Harb. Perspect. Med. 2019, 9, a029082. [Google Scholar] [CrossRef] [PubMed]
- Scolding, N.J.; Pasquini, M.; Reingold, S.C.; A Cohen, J. Cell-based therapeutic strategies for multiple sclerosis. Brain 2017, 140, 2776–2796. [Google Scholar]
- Arruda, L.C.M.; Clave, E.; Moins-teisserenc, H.; Douay, C.; Farge, D.; Toubert, A. Resetting the immune response after autologous hematopoietic stem cell transplantation for autoimmune diseases. Curr. Res. Transl. Med. 2016, 64, 107–113. [Google Scholar] [PubMed]
- Muraro, P.A.; Douek, D.C.; Packer, A.; Chung, K.; Guenaga, F.J.; Cassiani-Ingoni, R.; Campbell, C.; Memon, S.; Nagle, J.W.; Hakim, F.T.; et al. Thymic output generates a new and diverse TCR repertoire after autologous stem cell transplantation in multiple sclerosis patients. J. Exp. Med. 2005, 201, 805–816. [Google Scholar]
- Ruiz-Argüelles, G.J.; León-Peña, A.A.; León-González, M.; Nuñez-Cortes, A.K.; Olivares-Gazca, J.C.; Murrieta-Alvarez, I.; Vargas-Espinosa, J.; Medina-Ceballos, E.; Cantero-Fortiz, Y.; Ruiz-Argüelles, A.; et al. A Feasibility Study of the Full Outpatient Conduction of Hematopoietic Transplants in Persons with Multiple Sclerosis Employing Autologous Non-Cryopreserved Peripheral Blood Stem Cells. Acta Haematol. 2017, 137, 214–219. [Google Scholar] [CrossRef]
- Gale, R.P.; Gómez-Cruz, G.B.; Olivares-Gazca, J.C.; León-Peña, A.A.; Gómez-Almaguer, D.; Gómez-De-León, A.; González-López, E.E.; Ruiz-Argüelles, A.; Soto-Vega, E.; Muñoz-Pérez, M.J.; et al. Determine safety of outpatient chemotherapy and autotransplants using refrigerated, non-frozen grafts in persons with multiple sclerosis. Clin. Transplant. 2019, 33, 33–36. [Google Scholar] [CrossRef]
- Ruiz-Argüelles, G.J.; Olivares-Gazca, J.C.; Olivares-Gazca, M.; Leon-Peña, A.A.; Murrieta-Alvarez, I.; Cantero-Fortiz, Y.; Gomez-Cruz, G.B.; Ruiz-Argüelles, A.; Priesca-Marin, M.; Ruiz-Delgado, G.J. Self-reported changes in the expanded disability status scale (EDSS) score in patients with multiple sclerosis after autologous stem cell transplants: Real-world data from a single center. Clin. Exp. Immunol. 2019, 198, 351–358. [Google Scholar]
- Olivares-Gazca, J.C.; Sánchez-Bonilla, D.; Fernández-Gutiérrez, J.A.; Reyes-Cisneros, O.A.; Gallardo-Pérez, M.M.; Ruiz-Delgado, G.J.; Ruiz-Argüelles, G.J. Patient-Reported-Outcomes and Safety of Autologous Stem Cell Transplantation in Multiple Sclerosis: A Single Center Experience with the ‘Mexican Method’ in 1300 Persons. Blood 2022, 140, 1178–1179. [Google Scholar]
- Drayer, B.; Burger, P.; Darwin, R.; Riederer, S.; Herfkens, R.; Johnson, G.A. MRI of Brain Iron. Am. J. Roentgenol. 1986, 147, 103–110. [Google Scholar] [CrossRef]
- Hametner, S.; Wimmer, I.; Haider, L.; Pfeifenbring, S.; Brück, W.; Lassmann, H. Iron and Neurodegeneration in the Multiple Sclerosis Brain. Ann. Neurol. 2013, 74, 848–861. [Google Scholar] [CrossRef]
- Popescu, B.F.; Frischer, J.M.; Webb, S.M.; Tham, M.; Adiele, R.C.; Robinson, C.A.; Fitz-Gibbon, P.D.; Weigand, S.D.; Metz, I.; Nehzati, S.; et al. Pathogenic implications of distinct patterns of iron and zinc in chronic MS lesions. Acta Neuropathol. 2017, 134, 45–64. [Google Scholar] [PubMed]
- Cai, L.; Huang, J. Neurofilament light chain as a biological marker for multiple sclerosis: A meta-analysis study. Neuropsychiatr. Dis. Treat. 2018, 14, 2241–2254. [Google Scholar]
- Schmidt, H.; Williamson, D.; Ashley-Koch, A. HLA-DR15 haplotype and multiple sclerosis: A HuGE review. Am. J. Epidemiol. 2007, 165, 1097–1109. [Google Scholar]
- Hollenbach, J.A.; Oksenberg, J.R. The immunogenetics of multiple sclerosis: A comprehensive review. J. Autoimmun. 2015, 64, 13–25. [Google Scholar] [PubMed]
- Gross, R.; Healy, B.C.; Cepok, S.; Chitnis, T.; Khoury, S.J.; Hemmer, B.; Weiner, H.L.; Hafler, D.A.; De Jager, P.L. Population structure and HLA DRB1*1501 in the response of subjects with multiple sclerosis to first-line treatments. J. Neuroimmunol. 2011, 233, 168–174. [Google Scholar] [PubMed]
- Werneck, L.C.; Scola, R.H. Multiple sclerosis: Disease modifying therapy and the human leukocyte antigen. Arq. Neuropsiquiatr. 2018, 76, 697–704. [Google Scholar]
- Psachoulia, K.; Chamberlain, K.A.; Heo, D.; Davis, S.E.; Paskus, J.D.; Nanescu, S.E.; Dupree, J.L.; Wynn, T.A.; Huang, J.K. IL4I1 augments CNS remyelination and axonal protection by modulating T cell driven inflammation. Brain 2016, 139, 3121–3136. [Google Scholar]
- Bod, L.; Douguet, L.; Auffray, C.; Lengagne, R.; Bekkat, F.; Rondeau, E.; Molinier-Frenkel, V.; Castellano, F.; Richard, Y.; Prévost-Blondel, A. IL-4-Induced Gene 1: A Negative Immune Checkpoint Controlling B Cell Differentiation and Activation. J. Immunol. 2019, 200, 1027–1038. [Google Scholar]
- Castellano, F.; Prevost-blondel, A. What role for AHR activation in IL4I1-mediated immunosuppression? Oncoimmunology 2021, 10, 4–11. [Google Scholar] [CrossRef] [PubMed]
- Gaiottino, J.; Norgren, N.; Dobson, R.; Topping, J.; Nissim, A.; Malaspina, A.; Bestwick, J.P.; Monsch, A.U.; Regeniter, A.; Lindberg, R.L.; et al. Increased Neurofilament Light Chain Blood Levels in Neurodegenerative Neurological Diseases. PLoS ONE 2013, 8, e75091. [Google Scholar] [CrossRef] [PubMed]
- Mortazavi-jahromi, S.S.; Aslani, M.; Mirshafiey, A. A comprehensive review on miR-146a molecular mechanisms in a wide spectrum of immune and non-immune inflammatory diseases. Immunol. Lett. 2020, 227, 8–27. [Google Scholar] [PubMed]
- Pavlovic, I.; Axling, F.; Nazir, F.H.; Müller, M.; Wiberg, A.; Burman, J. Micro-RNA Signature in CSF Before and After Autologous Hematopoietic Stem Cell Transplantation for Multiple Sclerosis. Neurol. Neuroimmunol. Neuroinflamm. 2025, 12, e200345. [Google Scholar] [CrossRef]
- Vecchio, D.; Puricelli, C.; Malucchi, S.; Virgilio, E.; Martire, S.; Perga, S.; Passarelli, F.; Valentino, P.; Di Sapio, A.; Cantello, R.; et al. Serum and cerebrospinal fluid neurofilament light chains measured by SIMOA™, Ella™, and Lumipulse™ in multiple sclerosis naïve patients. Mult. Scler. Relat. Disord. 2024, 82, 105412. [Google Scholar] [CrossRef] [PubMed]


| Parameter | N = 34 Median (IQR) |
|---|---|
| Age | 47.5 (42–56) |
| Weight | 75.4 (66–88.5) |
| Height | 1.7 (1.62–1.75) |
| Years with disease | 8.5 (3–13) |
| EDSS | 4.5 (3–6) |
| Hemoglobin (g/dL) | 14.05 (13.1–15.1) |
| White blood cell (×103/μL) | 5.9 (4.7–6.8) |
| Platelet (×103/μL) | 259.5 (227–311) |
| Total protein (g/dL) | 6.75 (6.4–7.1) |
| Glucose (mg/dL) | 87.45 (84.1–92.9) |
| Uric acid (mg/dL) | 4.615 (3.5–5.81) |
| Cholesterol (mg/dL) | 213 (175–239) |
| Triglycerides (mg/dL) | 87.3 (62.8–127.9) |
| Iron (μg/dL) | 100 (71–124) |
| Transferrin saturation (%) | 27.72 (19.5–33.96) |
| Non-Responders (n = 14) | Responders (n = 20) | p Value | |
|---|---|---|---|
| Age | 48 (8) | 47.5 (17.5) | 0.986 |
| Weight | 72.5 (31.5) | 76.5 (18.55) | 0.691 |
| Height | 1.7 (0.15) | 1.7 (0.105) | 0.231 |
| Years of disease | 9 (9) | 6.5 (11) | 0.323 |
| EDSS | 3.5 (3) | 4.75 (2.5) | 0.129 |
| Hemoglobin (g/dL) | 14.9 (1.3) | 13.55 (1.6) | 0.036 * |
| White blood cell (×103/μL) | 5.2 (2.1) | 6.05 (1.65) | 0.112 |
| Platelets (×103/μL) | 229 (80) | 278.5 (81.5) | 0.043 * |
| Total protein (g/dL) | 6.95 (0.8) | 6.7 (0.5) | 0.743 |
| Glucose (mg/dL) | 87.3 (11.3) | 87.45 (7.8) | 0.931 |
| Uric acid (mg/dL) | 4.73 (2.69) | 4.575 (2.245) | 0.717 |
| Cholesterol (mg/dL) | 186 (39) | 225.5 (74) | 0.09 |
| Triglycerides (mg/dL) | 76 (42.7) | 105 (72.6) | 0.066 |
| CRP (mg/dL) | 0.76 (1.38) | 1.525 (2.745) | 0.18 |
| Iron (μg/dL) | 122.5 (42) | 97.5 (49) | 0.012 * |
| Iron binding capacity (mg/dL) | 340.5 (50) | 360.5 (47.5) | 0.12 |
| Transferrin saturation (%) | 33.945 (19.65) | 25.5 (12.705) | 0.005 * |
| Albumin (gr/dL) | 4.35 (0.54) | 4.25 (0.54) | 0.742 |
| PPMS | 3 | 3 | |
| RRMS | 7 | 12 | |
| SPMS | 4 | 5 |
Disclaimer/Publisher’s Note: The statements, opinions and data contained in all publications are solely those of the individual author(s) and contributor(s) and not of MDPI and/or the editor(s). MDPI and/or the editor(s) disclaim responsibility for any injury to people or property resulting from any ideas, methods, instructions or products referred to in the content. |
© 2025 by the authors. Licensee MDPI, Basel, Switzerland. This article is an open access article distributed under the terms and conditions of the Creative Commons Attribution (CC BY) license (https://creativecommons.org/licenses/by/4.0/).
Share and Cite
Gallardo-Pérez, M.M.; Ruiz-Argüelles, A.; Ruiz-Argüelles, G.J.; Reyes-Núñez, V.; Soto-Olvera, S.; Garcés-Eisele, S.J. Biomarker Identification in Patients with Multiple Sclerosis Treated with Autologous Hematopoietic Stem Cell Transplantation. Sclerosis 2025, 3, 9. https://doi.org/10.3390/sclerosis3020009
Gallardo-Pérez MM, Ruiz-Argüelles A, Ruiz-Argüelles GJ, Reyes-Núñez V, Soto-Olvera S, Garcés-Eisele SJ. Biomarker Identification in Patients with Multiple Sclerosis Treated with Autologous Hematopoietic Stem Cell Transplantation. Sclerosis. 2025; 3(2):9. https://doi.org/10.3390/sclerosis3020009
Chicago/Turabian StyleGallardo-Pérez, Moisés Manuel, Alejandro Ruiz-Argüelles, Guillermo José Ruiz-Argüelles, Virginia Reyes-Núñez, Silvia Soto-Olvera, and Solón Javier Garcés-Eisele. 2025. "Biomarker Identification in Patients with Multiple Sclerosis Treated with Autologous Hematopoietic Stem Cell Transplantation" Sclerosis 3, no. 2: 9. https://doi.org/10.3390/sclerosis3020009
APA StyleGallardo-Pérez, M. M., Ruiz-Argüelles, A., Ruiz-Argüelles, G. J., Reyes-Núñez, V., Soto-Olvera, S., & Garcés-Eisele, S. J. (2025). Biomarker Identification in Patients with Multiple Sclerosis Treated with Autologous Hematopoietic Stem Cell Transplantation. Sclerosis, 3(2), 9. https://doi.org/10.3390/sclerosis3020009