Abstract
Background: Malaria remains a significant global health burden, particularly in sub-Saharan Africa, accounting for high rates of illness and death. The growing resistance to frontline antimalarial therapies underscores the urgent need for novel drug targets and therapeutics. Bromodomain-containing proteins, which regulate gene expression through chromatin remodeling, have gained attention as potential targets. Plasmodium falciparum bromodomain protein 1 (PfBDP1), a 55 kDa nuclear protein, plays a key role in recognizing acetylated lysine residues and facilitating transcription during parasite development. Methods: This study investigated ex vivo PfBDP1 gene mutations and identified potential small molecule inhibitors using computational approaches. Malaria-positive blood samples were collected. Genomic DNA was extracted, assessed for quality, and amplified using PfBDP1-specific primers. DNA sequencing and alignment were performed to determine single-nucleotide polymorphism (SNP). Structural modeling used the PfBDP1 crystal structure (PDB ID: 7M97), and active site identification was conducted using CASTp 3.0. Virtual screening and pharmacophore modeling were performed using Pharmit and AutoDock Vina, followed by ADME/toxicity evaluations with SwissADME, OSIRIS, and Discovery Studio. GROMACS was used for 100 ns molecular dynamics simulations. Results: The malaria prevalence rate stood at 12.24%, and the sample size was 165. Sequencing results revealed conserved PfBDP1 gene sequences compared to the 3D7 reference strain. Virtual screening identified nine lead compounds with binding affinities ranging from −9.8 to −10.7 kcal/mol. Of these, CHEMBL2216838 had a binding affinity of −9.9 kcal/mol, with post-screening predictions of favorable drug-likeness (8.60), a high drug score (0.78), superior pharmacokinetics, and a low toxicity profile compared to chloroquine. Molecular dynamics simulations confirmed its stable interaction within the PfBDP1 active site. Conclusions: Overall, this study makes a significant contribution to the ongoing search for novel antimalarial drug targets by providing both molecular and computational evidence for PfBDP1 as a promising therapeutic target. The prediction of CHEMBL2216838 as a lead compound with favorable binding affinity, drug-likeness, and safety profile, surpassing those of existing drugs like chloroquine, sets the stage for preclinical validation and further structure-based drug design efforts. These findings are supported by prior experimental evidence showing significant parasite inhibition and gene suppression capability of predicted hits.
1. Introduction
Malaria continues to pose a major public health challenge, with approximately 249 million cases and over 600,000 deaths reported globally in 2023 [1]. Key interventions, including insecticide-treated mosquito nets (ITNs), indoor residual spraying (IRS), rapid diagnostic testing, and antimalarial drugs, have significantly contributed to malaria control efforts. Recently, the introduction of vaccines such as RTS, S/AS01, and R21/Matrix-M has provided additional tools for prevention [2]. Artemisinin-based combination therapies (ACTs) serve as the frontline treatment for malaria, offering rapid action and significantly reducing mortality and morbidity caused by Plasmodium falciparum (P. falciparum), the most virulent malaria parasite [1,2,3]. Despite these advances, the widespread emergence of drug-resistant Plasmodium falciparum strains, particularly those with resistance linked to mutations in the PfMDR1 and Kelch 13 (K13) genes, has compromised the effectiveness of artemisinin-based combination therapies (ACTs), the cornerstone of current treatment protocols. This resistance poses a significant threat to malaria control efforts in endemic regions [2].
To address this growing resistance, there is an urgent need to identify novel therapeutic targets within the P. falciparum life cycle [4]. One promising avenue lies in targeting the parasite’s tightly regulated gene expression machinery, particularly during its asexual blood stages [5]. These processes are largely governed by chromatin-based mechanisms [6]. Understanding how gene expression is regulated through chromatin modifications is crucial for developing new antimalarial treatments [7]. Chromatin remodeling plays a pivotal role in orchestrating stage-specific transcription, with bromodomain-containing proteins acting as central mediators through their ability to recognize acetylated lysine residues on histones [8]. Structurally, bromodomains feature an all-α protein fold, a left-handed four-helix bundle (αZ, αA, αB, and αC), each separated by loop regions of variable lengths with two loops linking the helices αZ and αA (ZA), and αB and αC (BC). These loops extend to one side of the bundle and combine to create a hydrophobic pocket that recognizes the acetyl-lysine residues of histone [9].
Among the bromodomain proteins in P. falciparum, bromodomain protein 1 (BDP1) is noteworthy [10]. This 55 kDa nuclear protein, distinguished by a single C-terminal bromodomain and an N-terminal ankyrin repeat domain, is one of five predicted bromodomain proteins with no orthologs out of the ten identified bromodomain proteins (i.e., bromodomain protein 1-8 (BDP1-8), spin echo T1 (SET1), and general control non-depressible protein 5 (GCN5)) in Plasmodium falciparum genome [11,12]. BDP1 and GCN5 have been functionally studied and observed to play critical roles in Plasmodium falciparum transcriptional regulation [13].
BDP1 is highly conserved across apicomplexans [14]. It acts as a co-regulator of the AP2-I transcription factor, facilitating the expression of genes involved in erythrocyte invasion [10]. AP2-I activates the expression of a subset of invasion-related genes and recruits BDP1 by binding to upstream regulatory regions of these genes [14,15]. This interaction is essential for the transcriptional regulation of multiple gene families required for P. falciparum red blood cell (RBC) invasion [14]. The overexpression of PfBDP1 correlates with the upregulation of invasion-associated genes, while its knockdown results in impaired parasite development and reduced red blood cell invasion. These observations underscore its functional importance in parasite survival and virulence [8].
PfBDP1 also forms a regulatory complex with PfBDP2 and acetylated histones such as H2A.Z, H2B.Z, H3, and H4, contributing to the chromatin-based control of gene expression [10,16,17]. This makes it an attractive target for small molecule inhibition. Although targeting protein–protein interactions is traditionally challenging, the druggability of bromodomains has been demonstrated in recent years through the successful development of selective inhibitors [7,18]. Structural studies, including co-crystallization of PfGCN5 with triazolophthalazine-based compounds, have provided valuable insights into the histone binding disruption modes [19].
RMM23 was reported as a selective inhibitor of PfBDP1, as demonstrated by in vitro assays and conditional knockdown experiments, which confirmed its effective binding to the target protein and subsequent inhibition of Plasmodium falciparum growth [20]. In Silico screening of a pharmacophore model derived from the crystal structure of PF3D7_0110500 (PDB ID: 4PY6), crystallized with the PLK1 kinase/BRD4 dual inhibitor BI-2536, has also been reported [21].
A molecular docking study using the crystal structures of PfGCN5 (PDB ID: 5TPX) and PfBDP1 (PDB ID: 3FKM) identified 42 molecules capable of interacting with conserved asparagine residues in their binding pockets [19]. However, limitations in the available PfBDP1 (PDB ID 3FKM) crystal structure, having a portion of the ZA loop (residues 362–366) absent, restricted its use [22]. This loop is a crucial component of the inhibitor-binding pocket of bromodomains [23]. To overcome this, the current study employed the more complete structure of PfBDP1 (PDB ID: 7M97), which includes the full ZA loop to improve the docking reliability.
In this study, we employed a combination of molecular and computational biology techniques to determine the mutation levels of the PfBDP1 gene and to identify its potential inhibitors. The findings from this study lay the groundwork for advancing antimalarial drug development, with the potential to deliver more precise, effective, and safe treatment options for high-risk populations [24,25].
2. Results
2.1. Ex Vivo Study
2.1.1. Malaria Prevalence and Sample Size Estimation
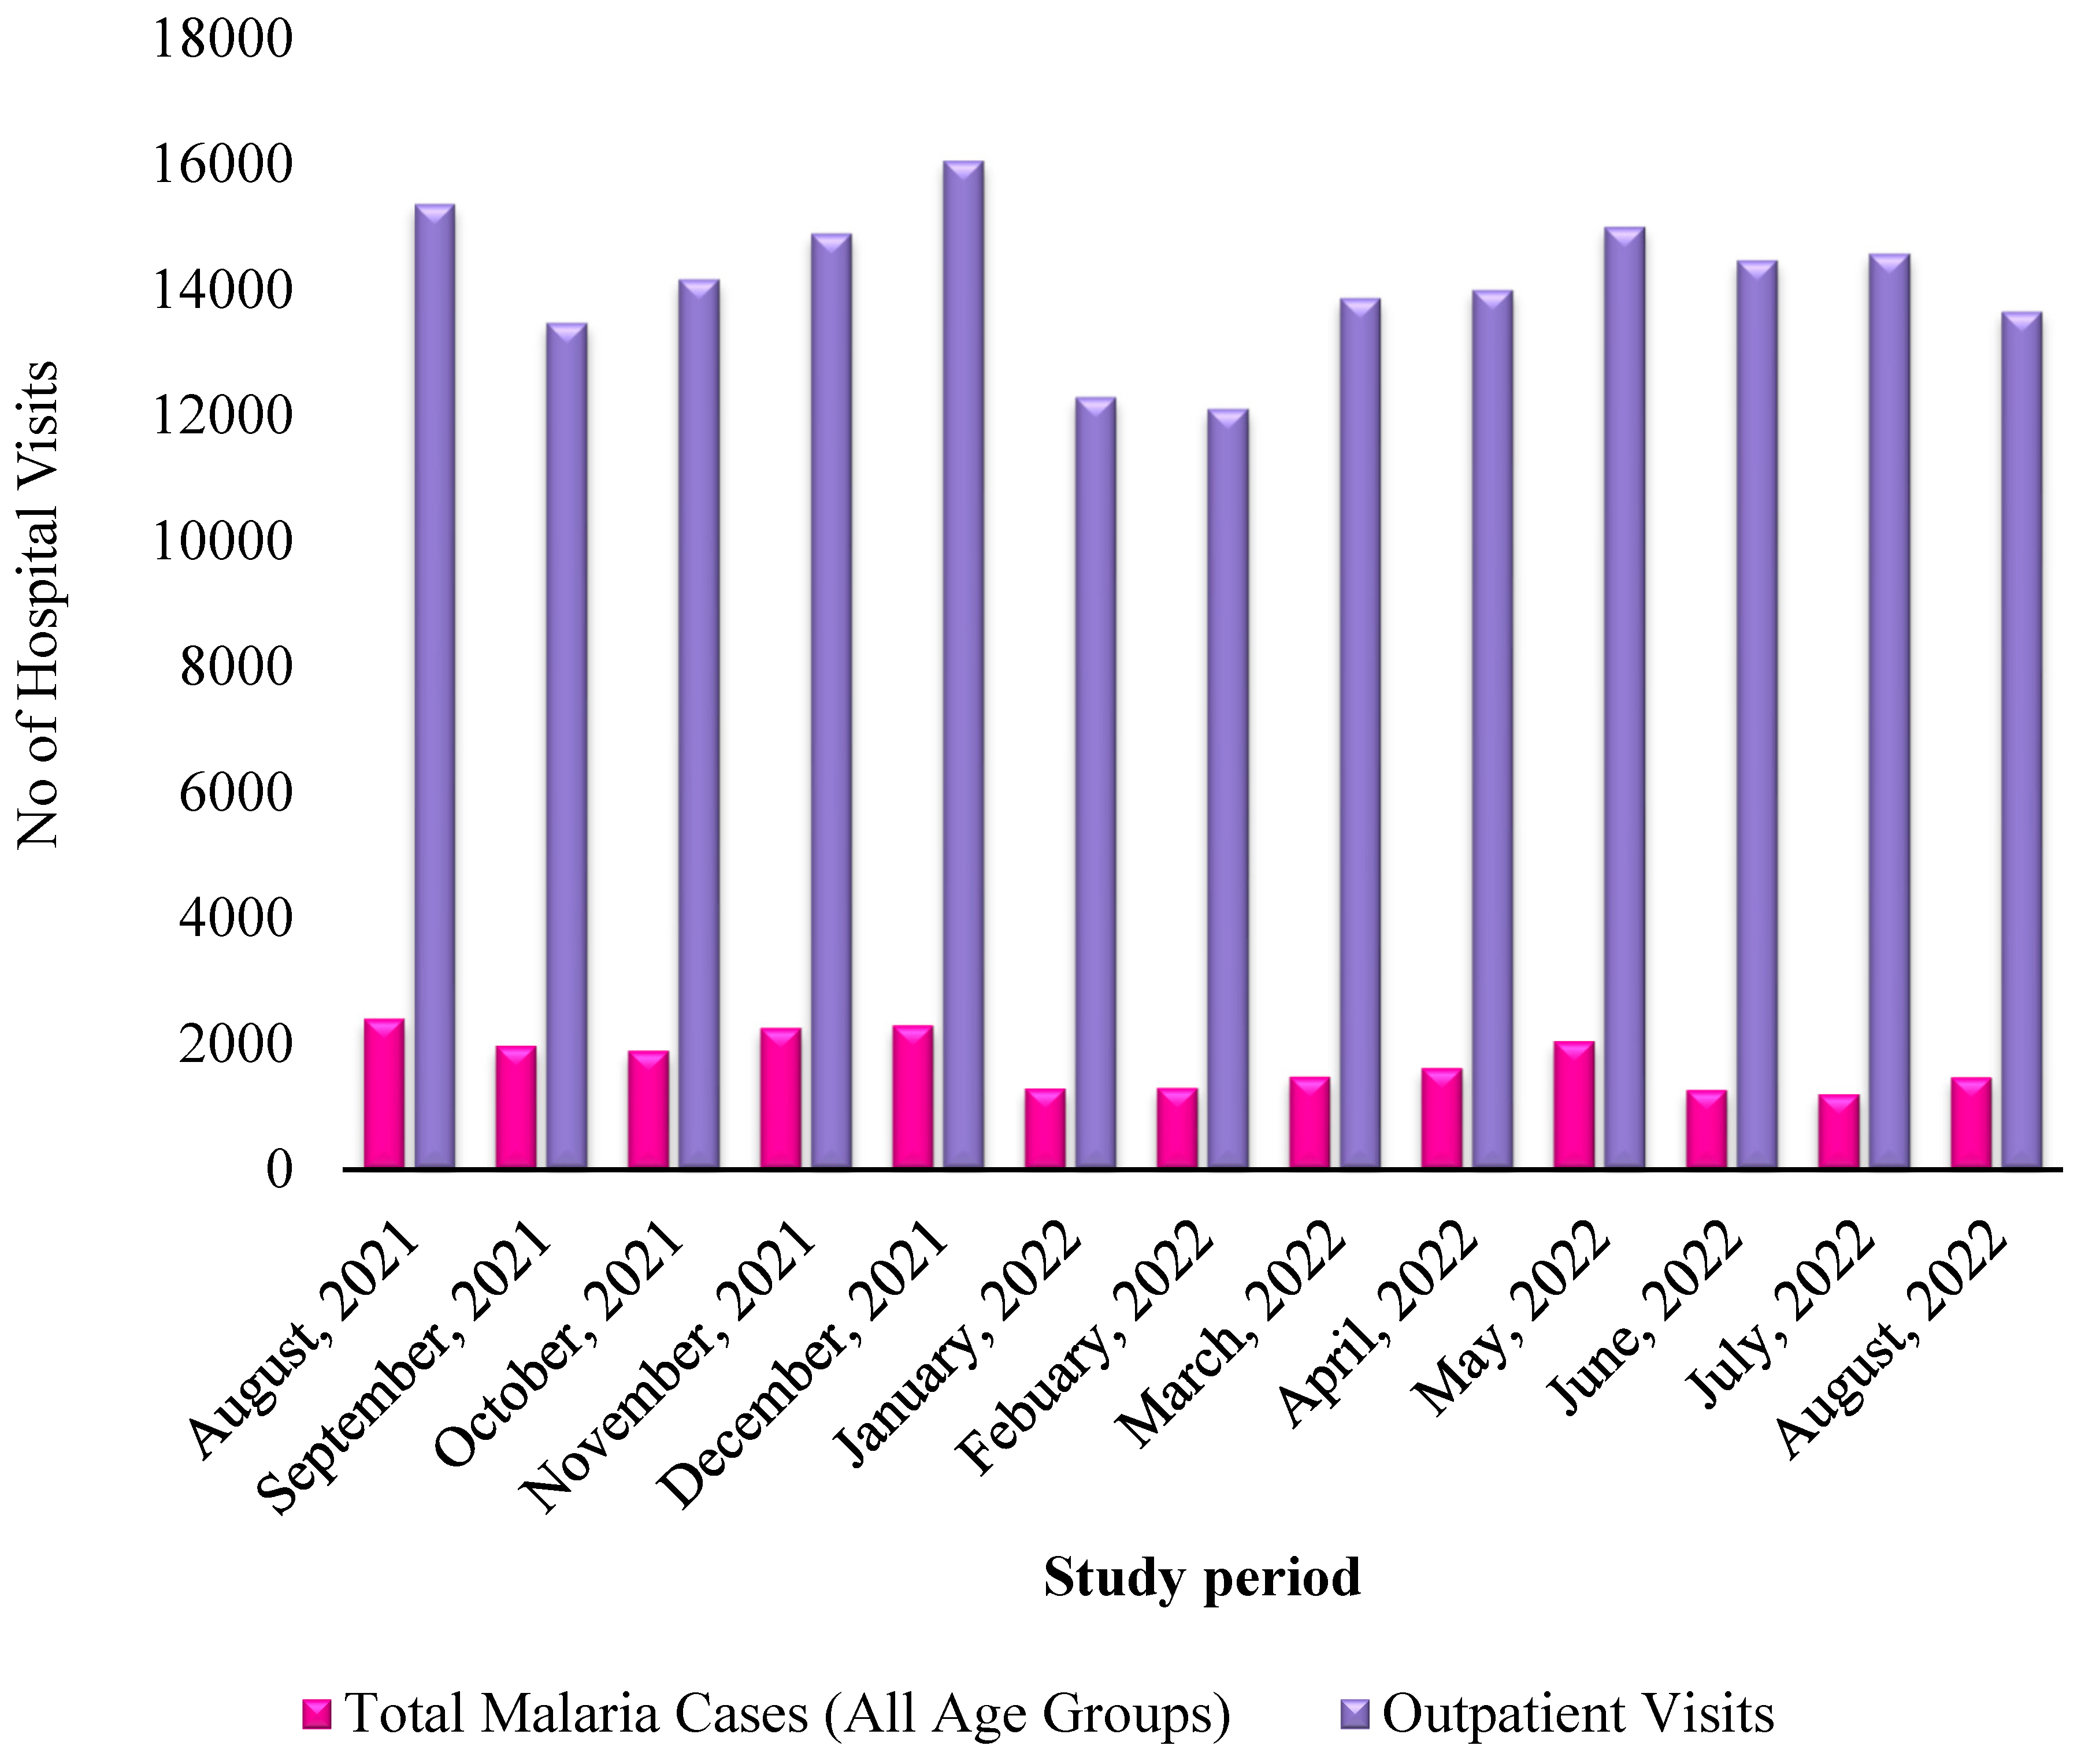
During the study period, a total of 22,513 malaria-positive cases were identified among 183,962 outpatient consultations, resulting in an overall malaria prevalence rate of 12.24%. Among the confirmed cases, 45.13% were male while 54.86% were female. The average age across all enrolled participants was 26 years, with patients spanning various age categories. The temporal distribution of malaria diagnoses in relation to outpatient visits over a year is presented in Figure 1.
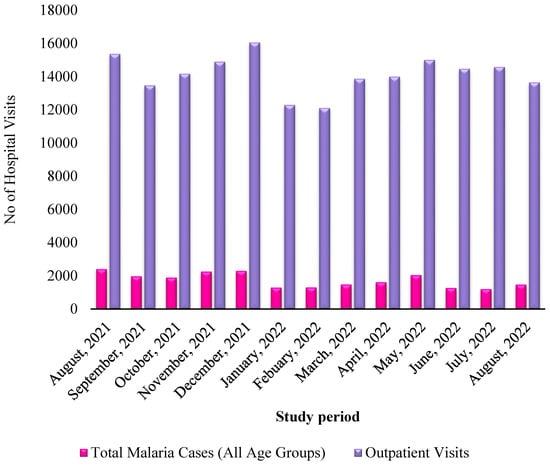
Figure 1.
Monthly distribution of malaria patients relative to outpatients within one year.
To determine the appropriate sample size, the following statistical formula was applied:
where
n = T2 × P (1 − P)/M2
- n = required sample size;
- T = Z-score for a 95% confidence level (1.96);
- P = prevalence rate (0.1224);
- M = margin of error (0.05);
n = 1.962 × 0.1224 (1 − 0.1224)/(0.05)2;
n = 3.8416 × 0.1074/0.0025;
n = 165.
Hence, the final estimated sample size was 165 participants.
2.1.2. PfBDP1 Gene Sequencing and Alignment
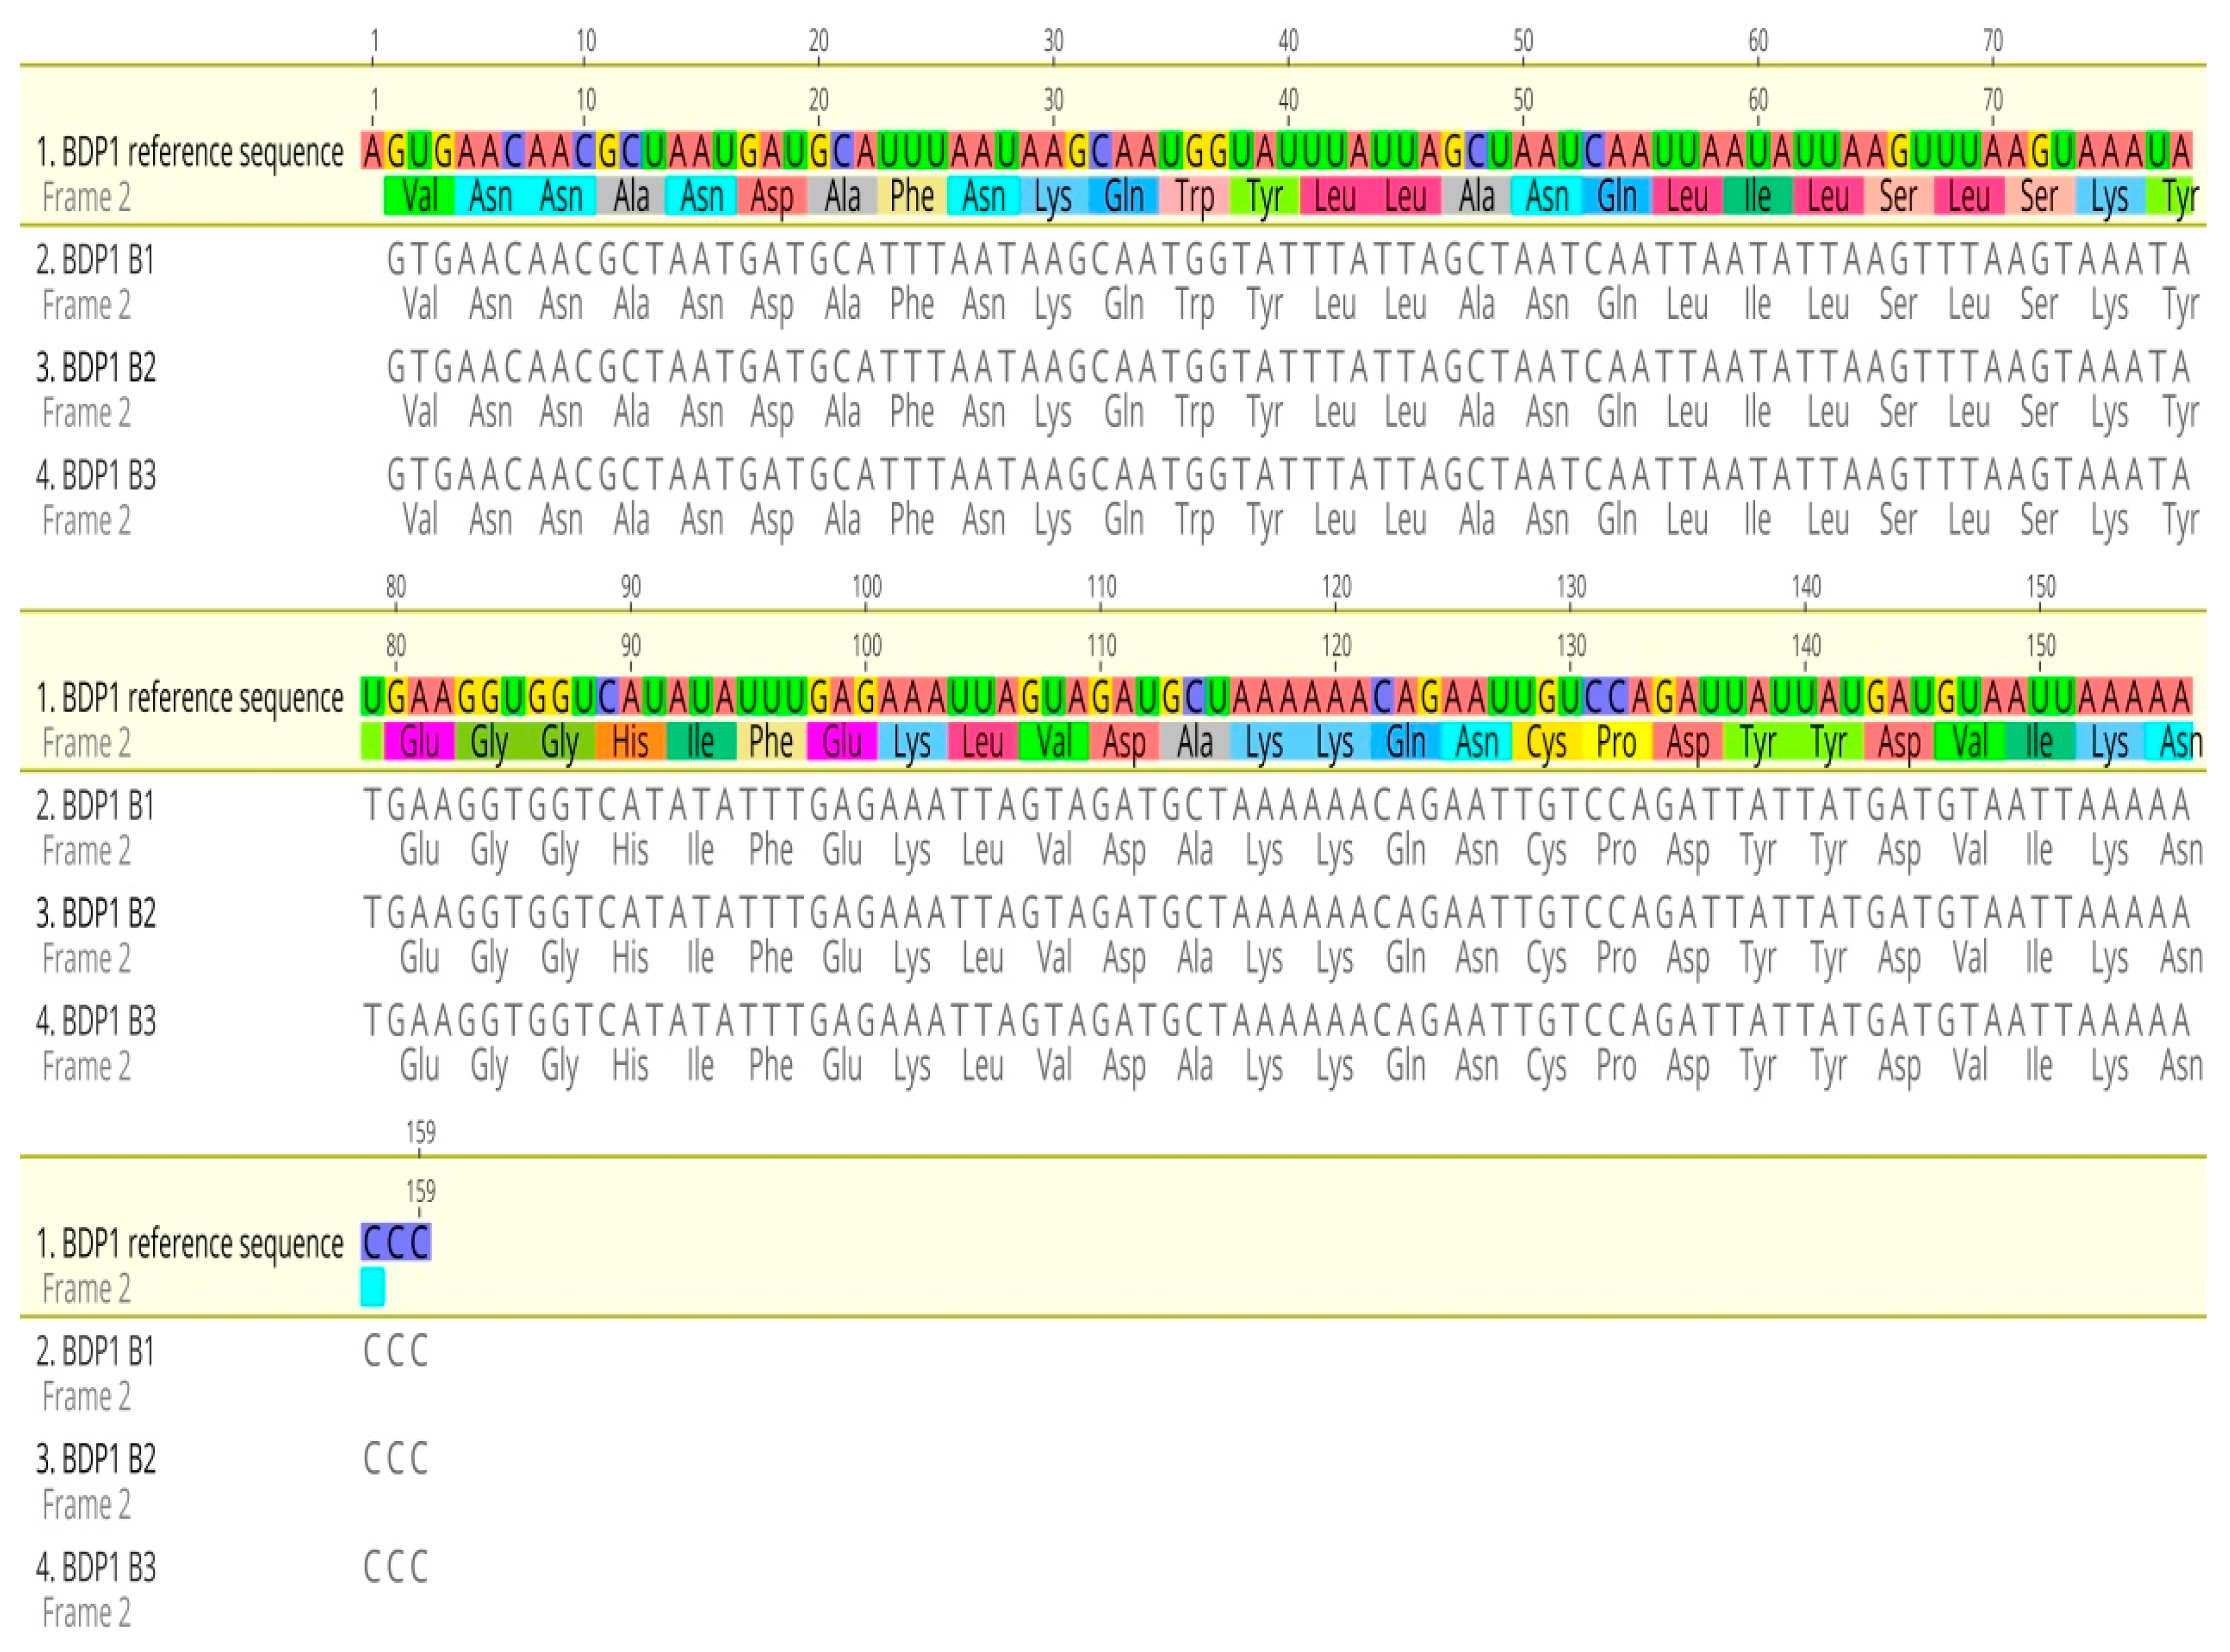
The sequence alignment result showed that no PfBDP1 gene mutations were detected in isolates from Ota, Ogun state, Nigeria (Figure 2). BLASTN search showed 100% sequence identity when compared with the GenBank database for all genes (Table 1).
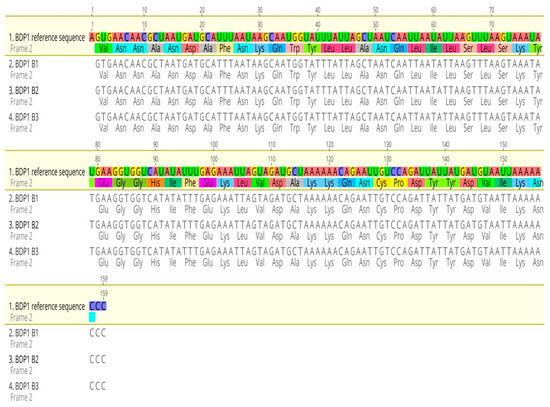
Figure 2.
Sequence alignment of the PfBDP1 gene compared with Plasmodium falciparum 3D7 chromosome 10 sequences.

Table 1.
PfBDP1 gene identity matrix compared with the 3D7 reference sequence.
2.2. In Silico Study
2.2.1. Protein Structure Retrieval and Alignment
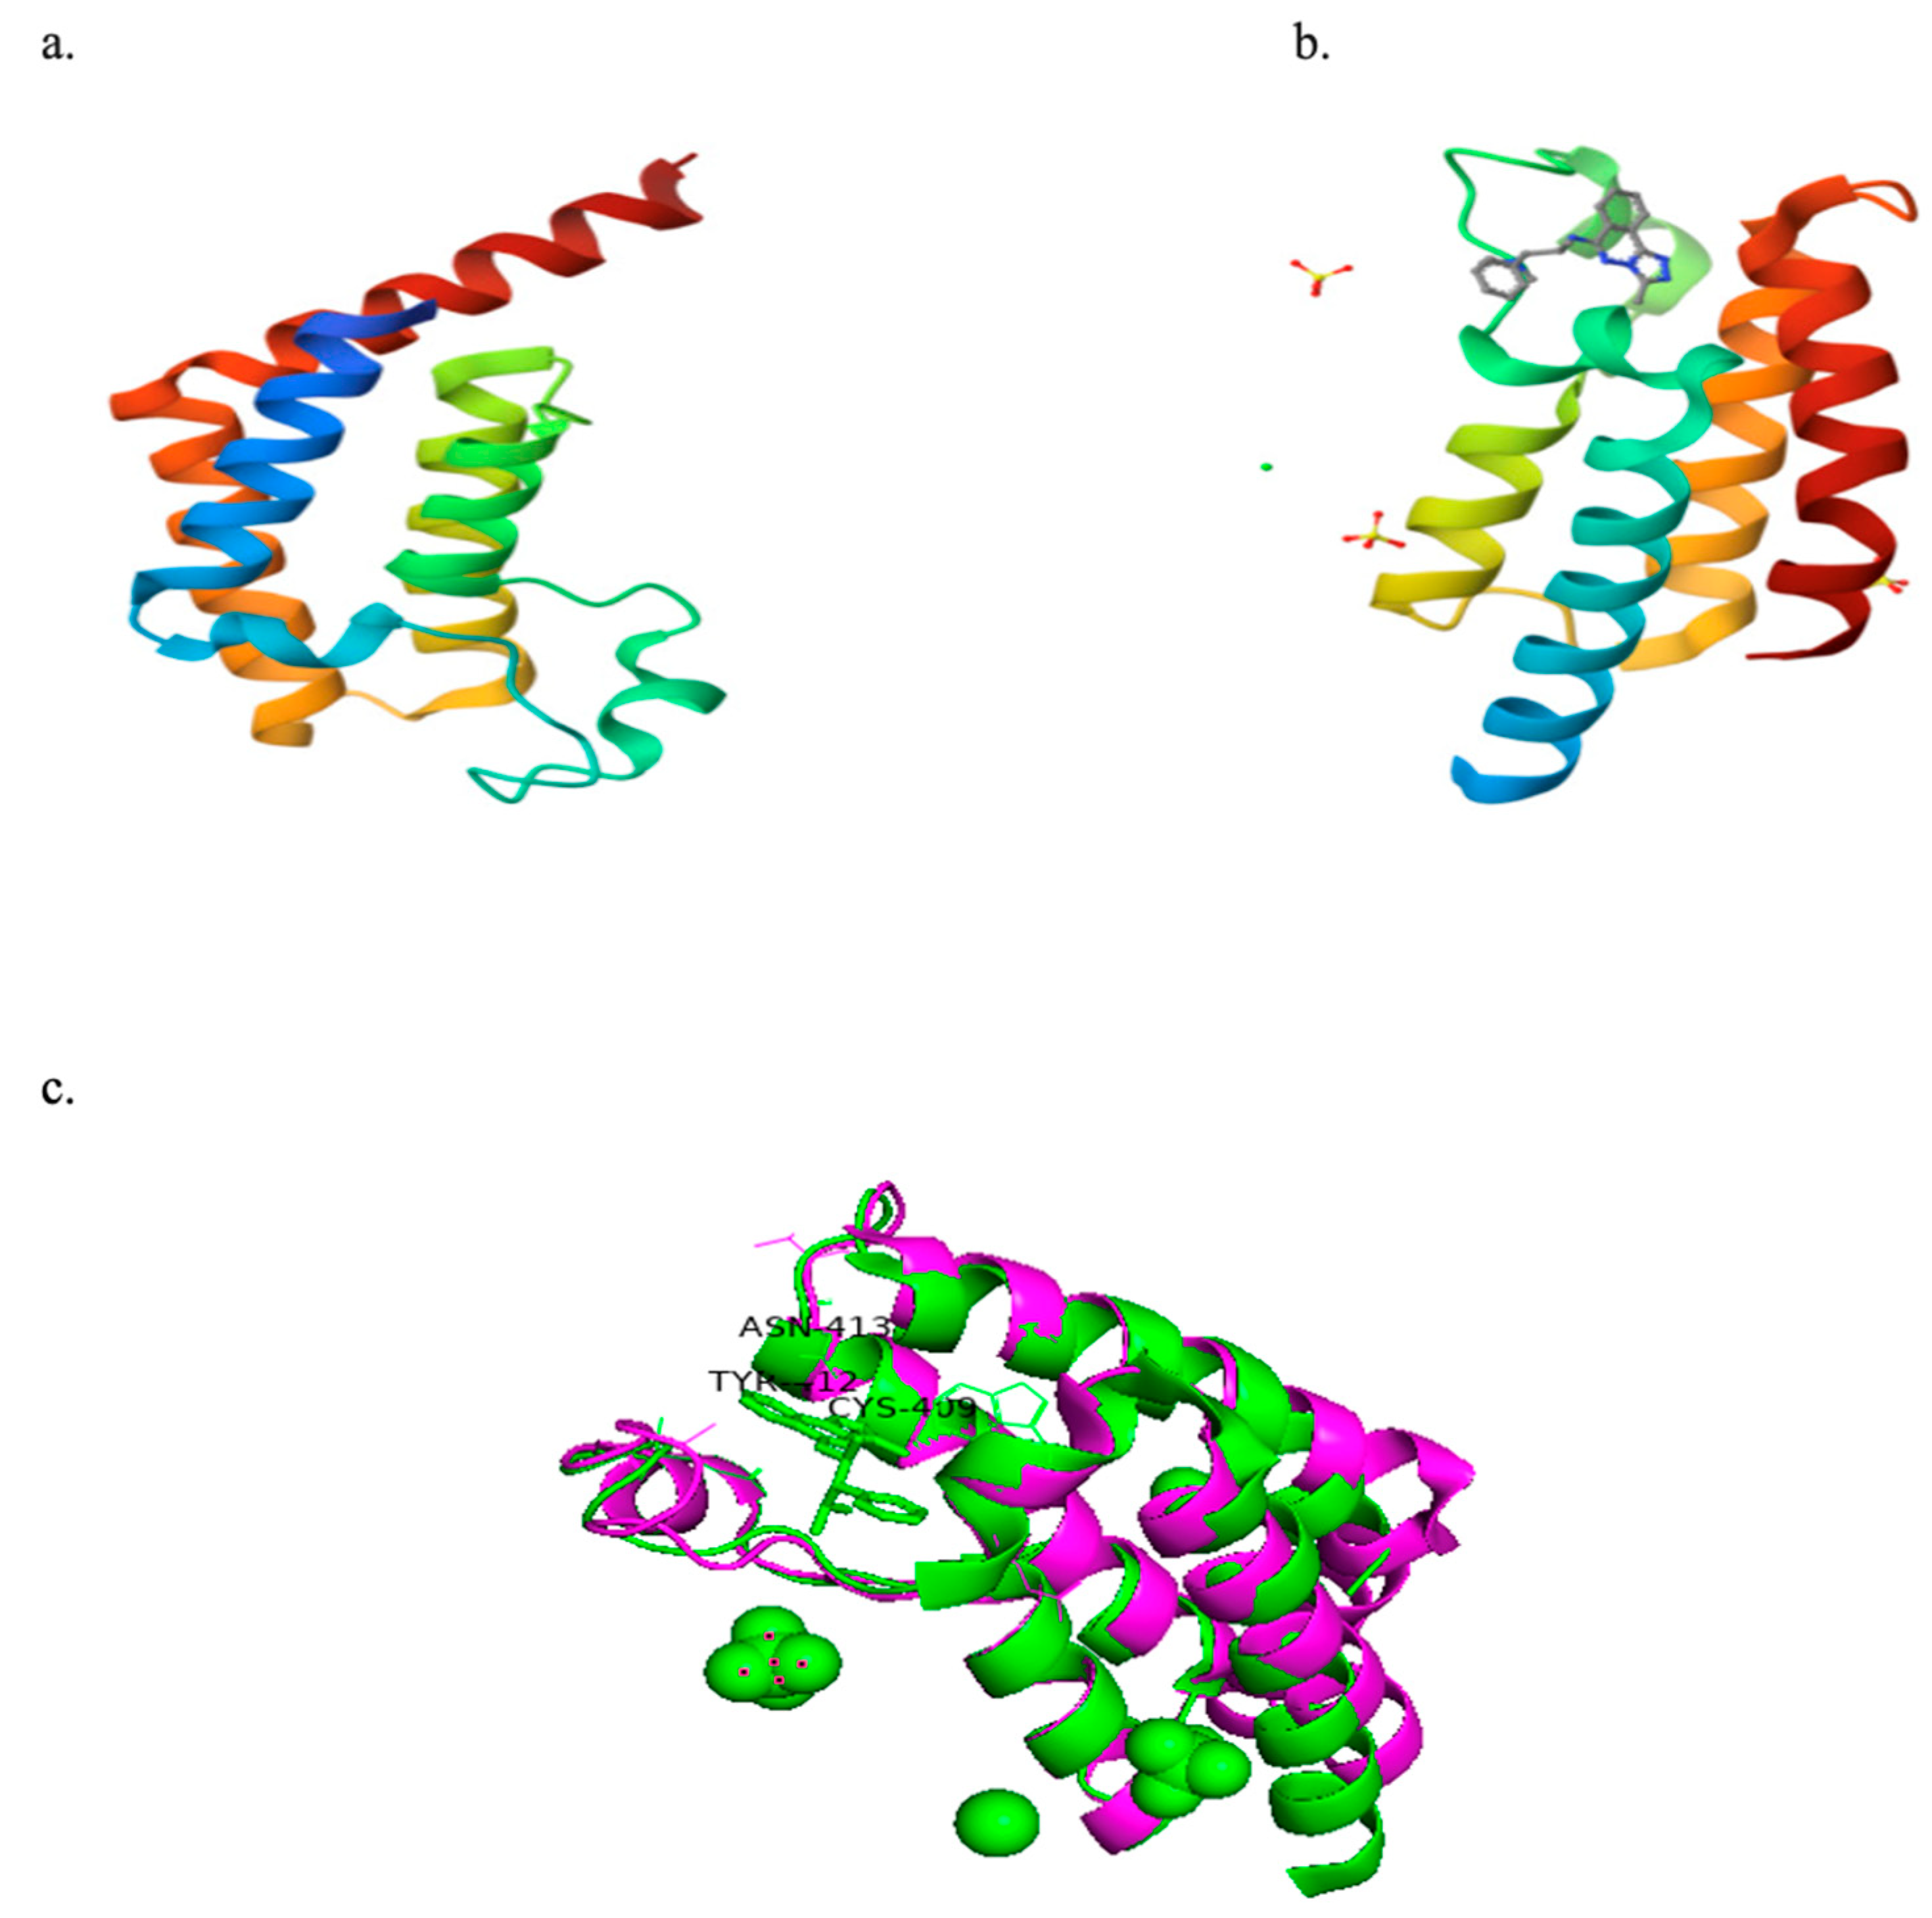
Figure 3a,b presents the crystal structures of PfBDP1 (PDB ID: 7M97) and PfGCN5 (PDB ID: 5TPX) complexed with a ligand (PubChem ID: 7H7). The structural alignment analysis between PfBDP1 and PfGCN5 yielded a root mean square deviation (RMSD) of 0.748 and a sequence identity of 25.69%. These findings suggest low sequence conservation between PfBDP1 and PfGCN5. Furthermore, among the eleven amino acid residues interacting at the PfGCN5 active site, only three (CYS409A, TYR412A, and ASN413A) were conserved in the active site of PfBDP1 (Figure 3c).
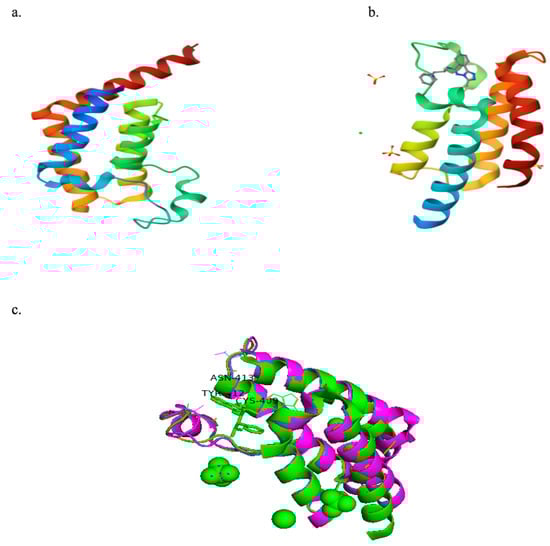
Figure 3.
(a) Crystal structure of PfBDP1 (PDB ID: 7M97). (b) Crystal structure of PfGCN5 (PDB ID: 5TPX) co-crystallized with a ligand (PubChem ID: 7H7). (c) Structural alignment of PfBDP1 (PDB ID: 7M97, magenta) and PfGCN5 (PDB ID: 5TPX, green), highlighting conserved amino acid residues at their active sites.
2.2.2. Active Site Determination of PfBDP1 Crystal Structure
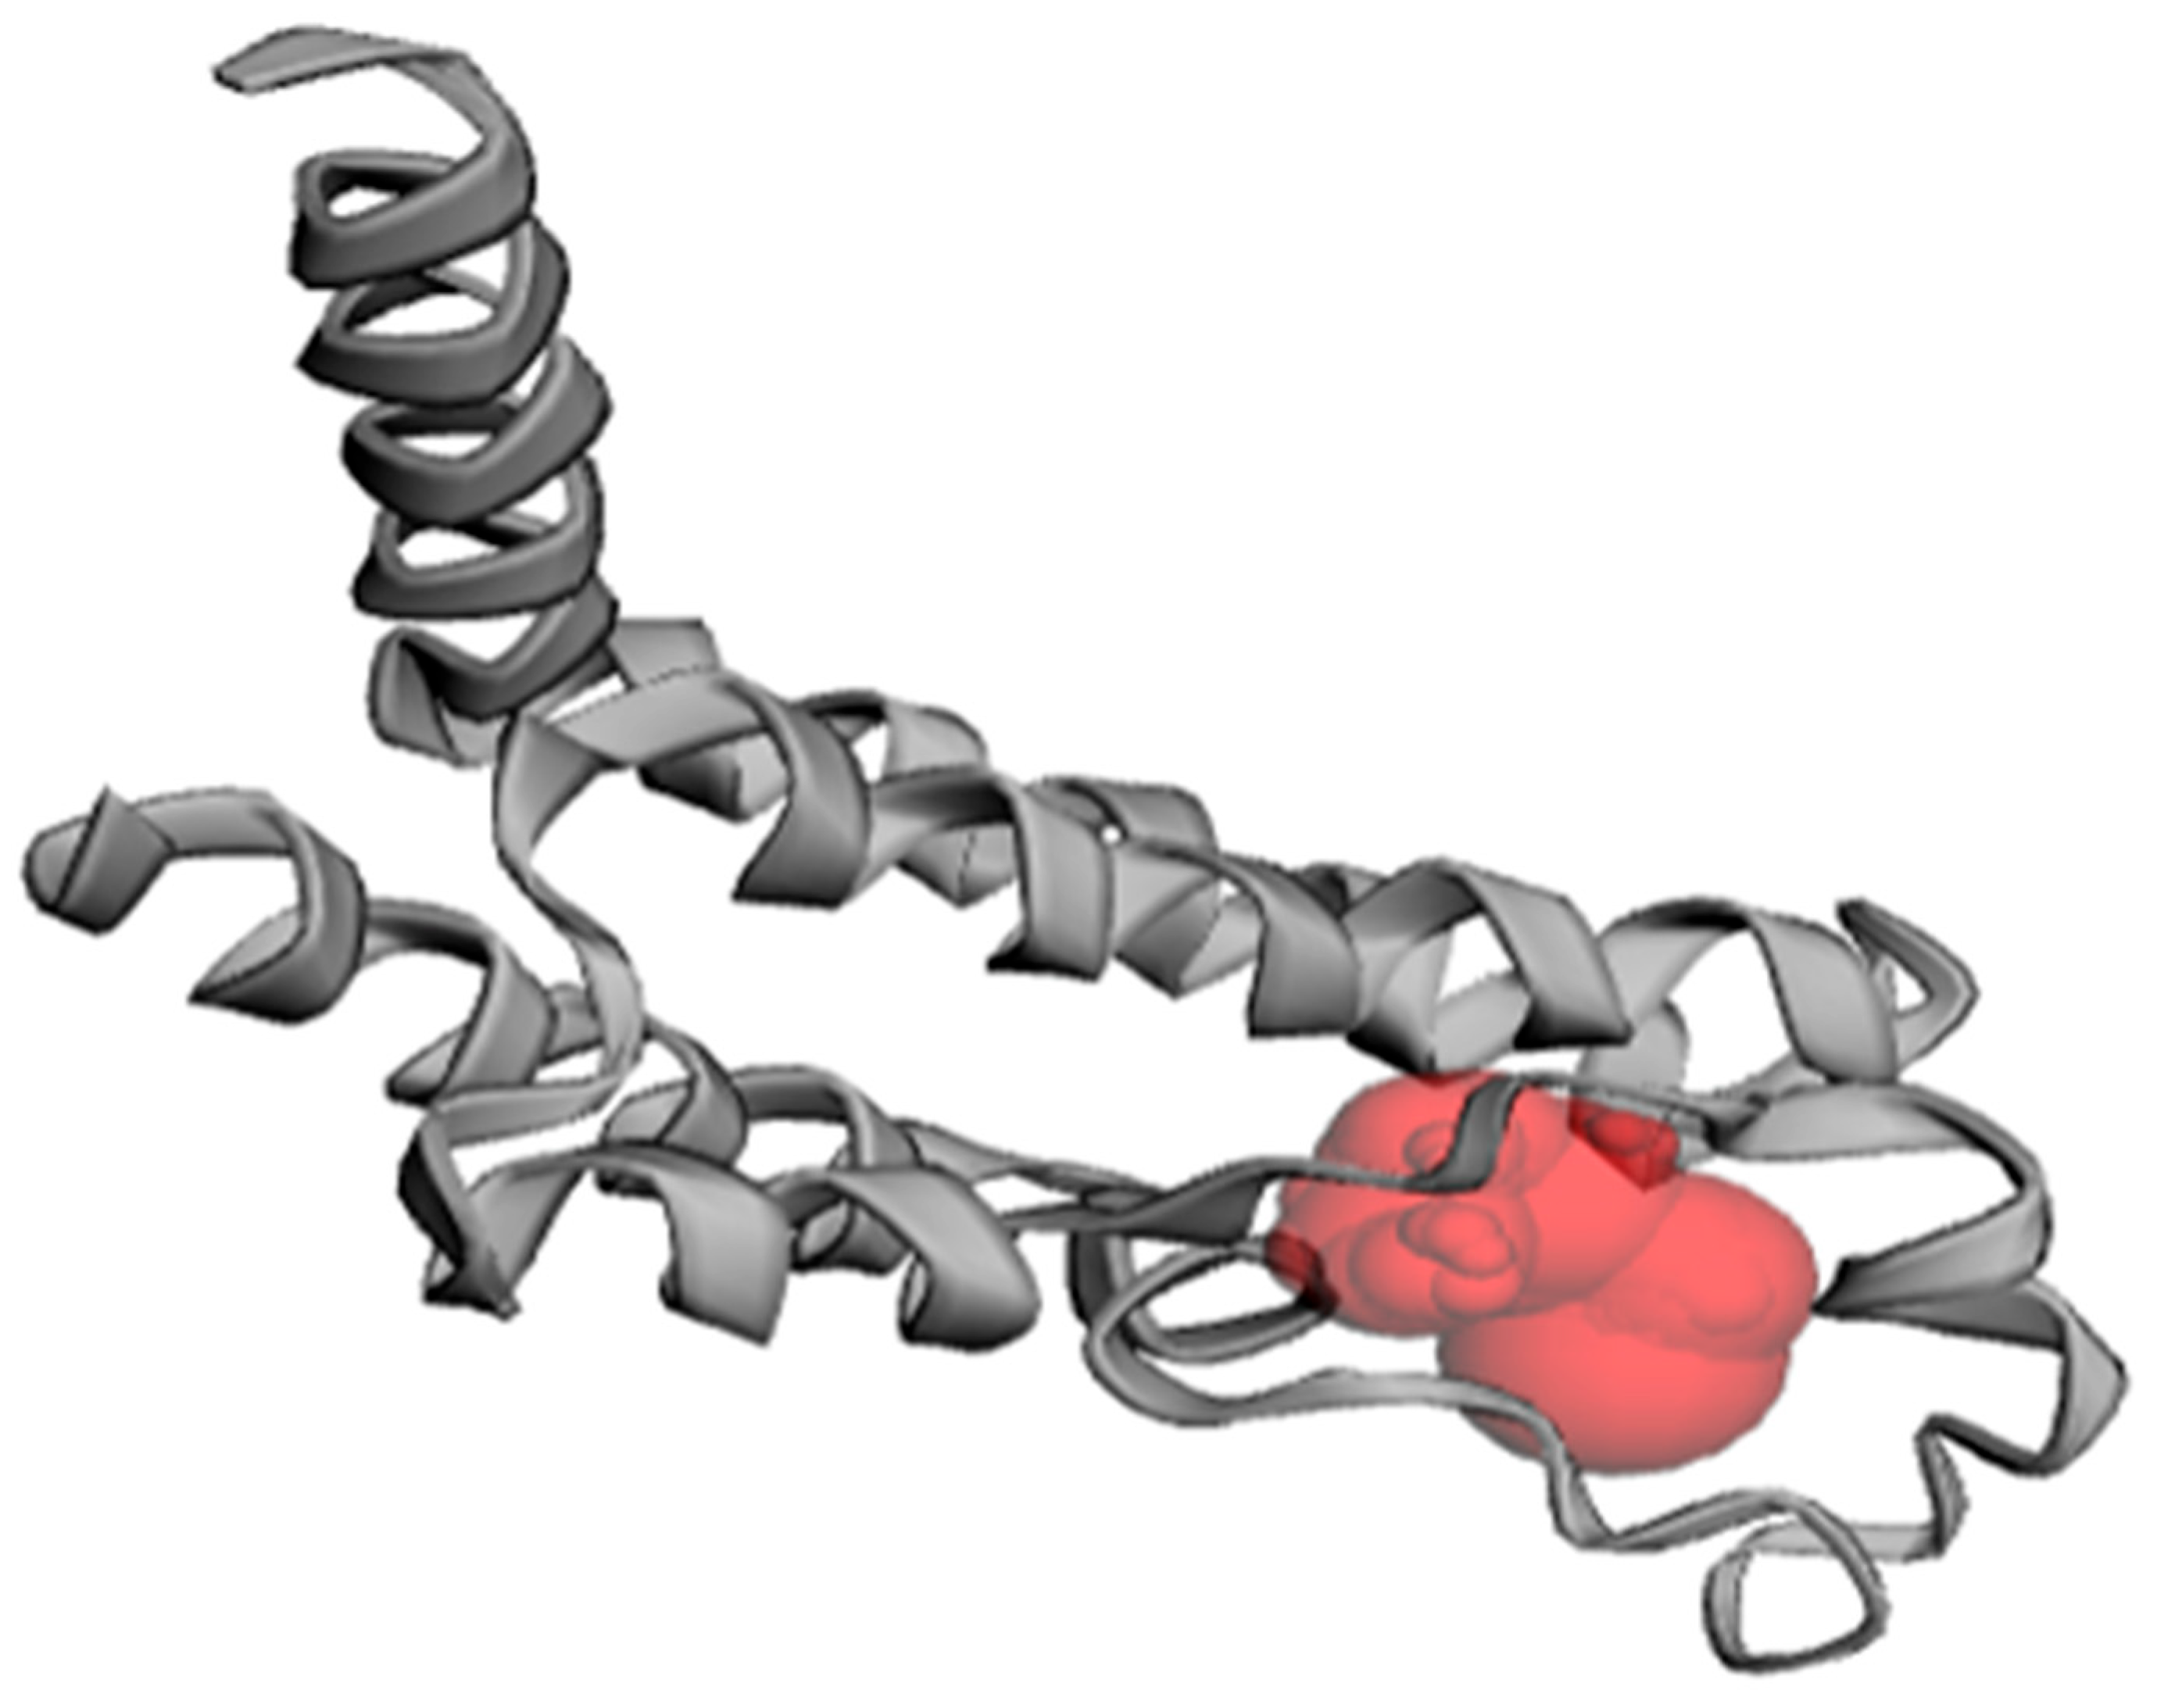
The active site prediction for PfBDP1 using CASTp 3.0 identified eleven potential binding pockets. Among these, pocket one contained the following amino acid residues: ILE355A, PHE356A, LYS358A, LEU359A, VAL360A, ASP361A, GLN365A, CYS367A, TYR370A, PRO377A, MET378A, SER379A, ILE405A, ASN408A, CYS409A, TYR412A, ASN413A, and VAL419A in Chain A (Figure 4).

Figure 4.
Predicted binding pocket of PfBDP1 (PDB ID: 7M97), as identified with CASTp 3.0.
The three conserved residues shared between the active sites of PfBDP1 (PDB ID: 7M97) and PfGCN5 (PDB ID: 5TPX), along with all binding pocket residues from the PfBDP1 apo structure, were found within pocket one. Therefore, pocket one was chosen as the preferred binding site for virtual screening.
Additionally, pocket one includes GLN365A, a key residue within the interhelical αZ-αA (ZA) loop. This highly flexible loop is a critical component of the bromodomain-inhibitor-binding pocket and is absent in the apo form of the PfBDP1 crystal structure.
2.2.3. Pharmacophore Modeling
The co-crystallized ligand of PfGCN5 (PubChem ID: 7H7) was not suitable for use as the control ligand in pharmacophore modeling due to the low percentage identity (25.69%) between the crystal structures of PfBDP1 (PDB ID: 7M97) and PfGCN5 (PDB ID: 5TPX). Instead, bromosporine was chosen as the control ligand for pharmacophore modeling. Bromosporine is a broad-spectrum bromodomain inhibitor that can interact with the conserved Asn413 of PfBDP1 through hydrogen bonds [22].
The pharmacophore model was developed based on the structure of bromosporine, incorporating five features: one aromatic group, two hydrogen bond donors, and two hydrophobic regions (Table 2). To identify the best potential inhibitors, the Pharmit filters were applied using Lipinski’s rule of five [26] and Veber’s rule [27] (Table 3), ensuring the selection of drug-like molecules. This process resulted in 1785 drug-like molecules from nine different databases on the Pharmit server, which were then used for virtual screening (Table 4).
Table 2.
The five features of the pharmacophore model.
Table 3.
Pharmacophore hit screen filters using Lipinski’s rule of five and Veber’s rule.
Table 4.
Number of hits from pharmacophore modeling using the Pharmit server.
2.2.4. Virtual Screening
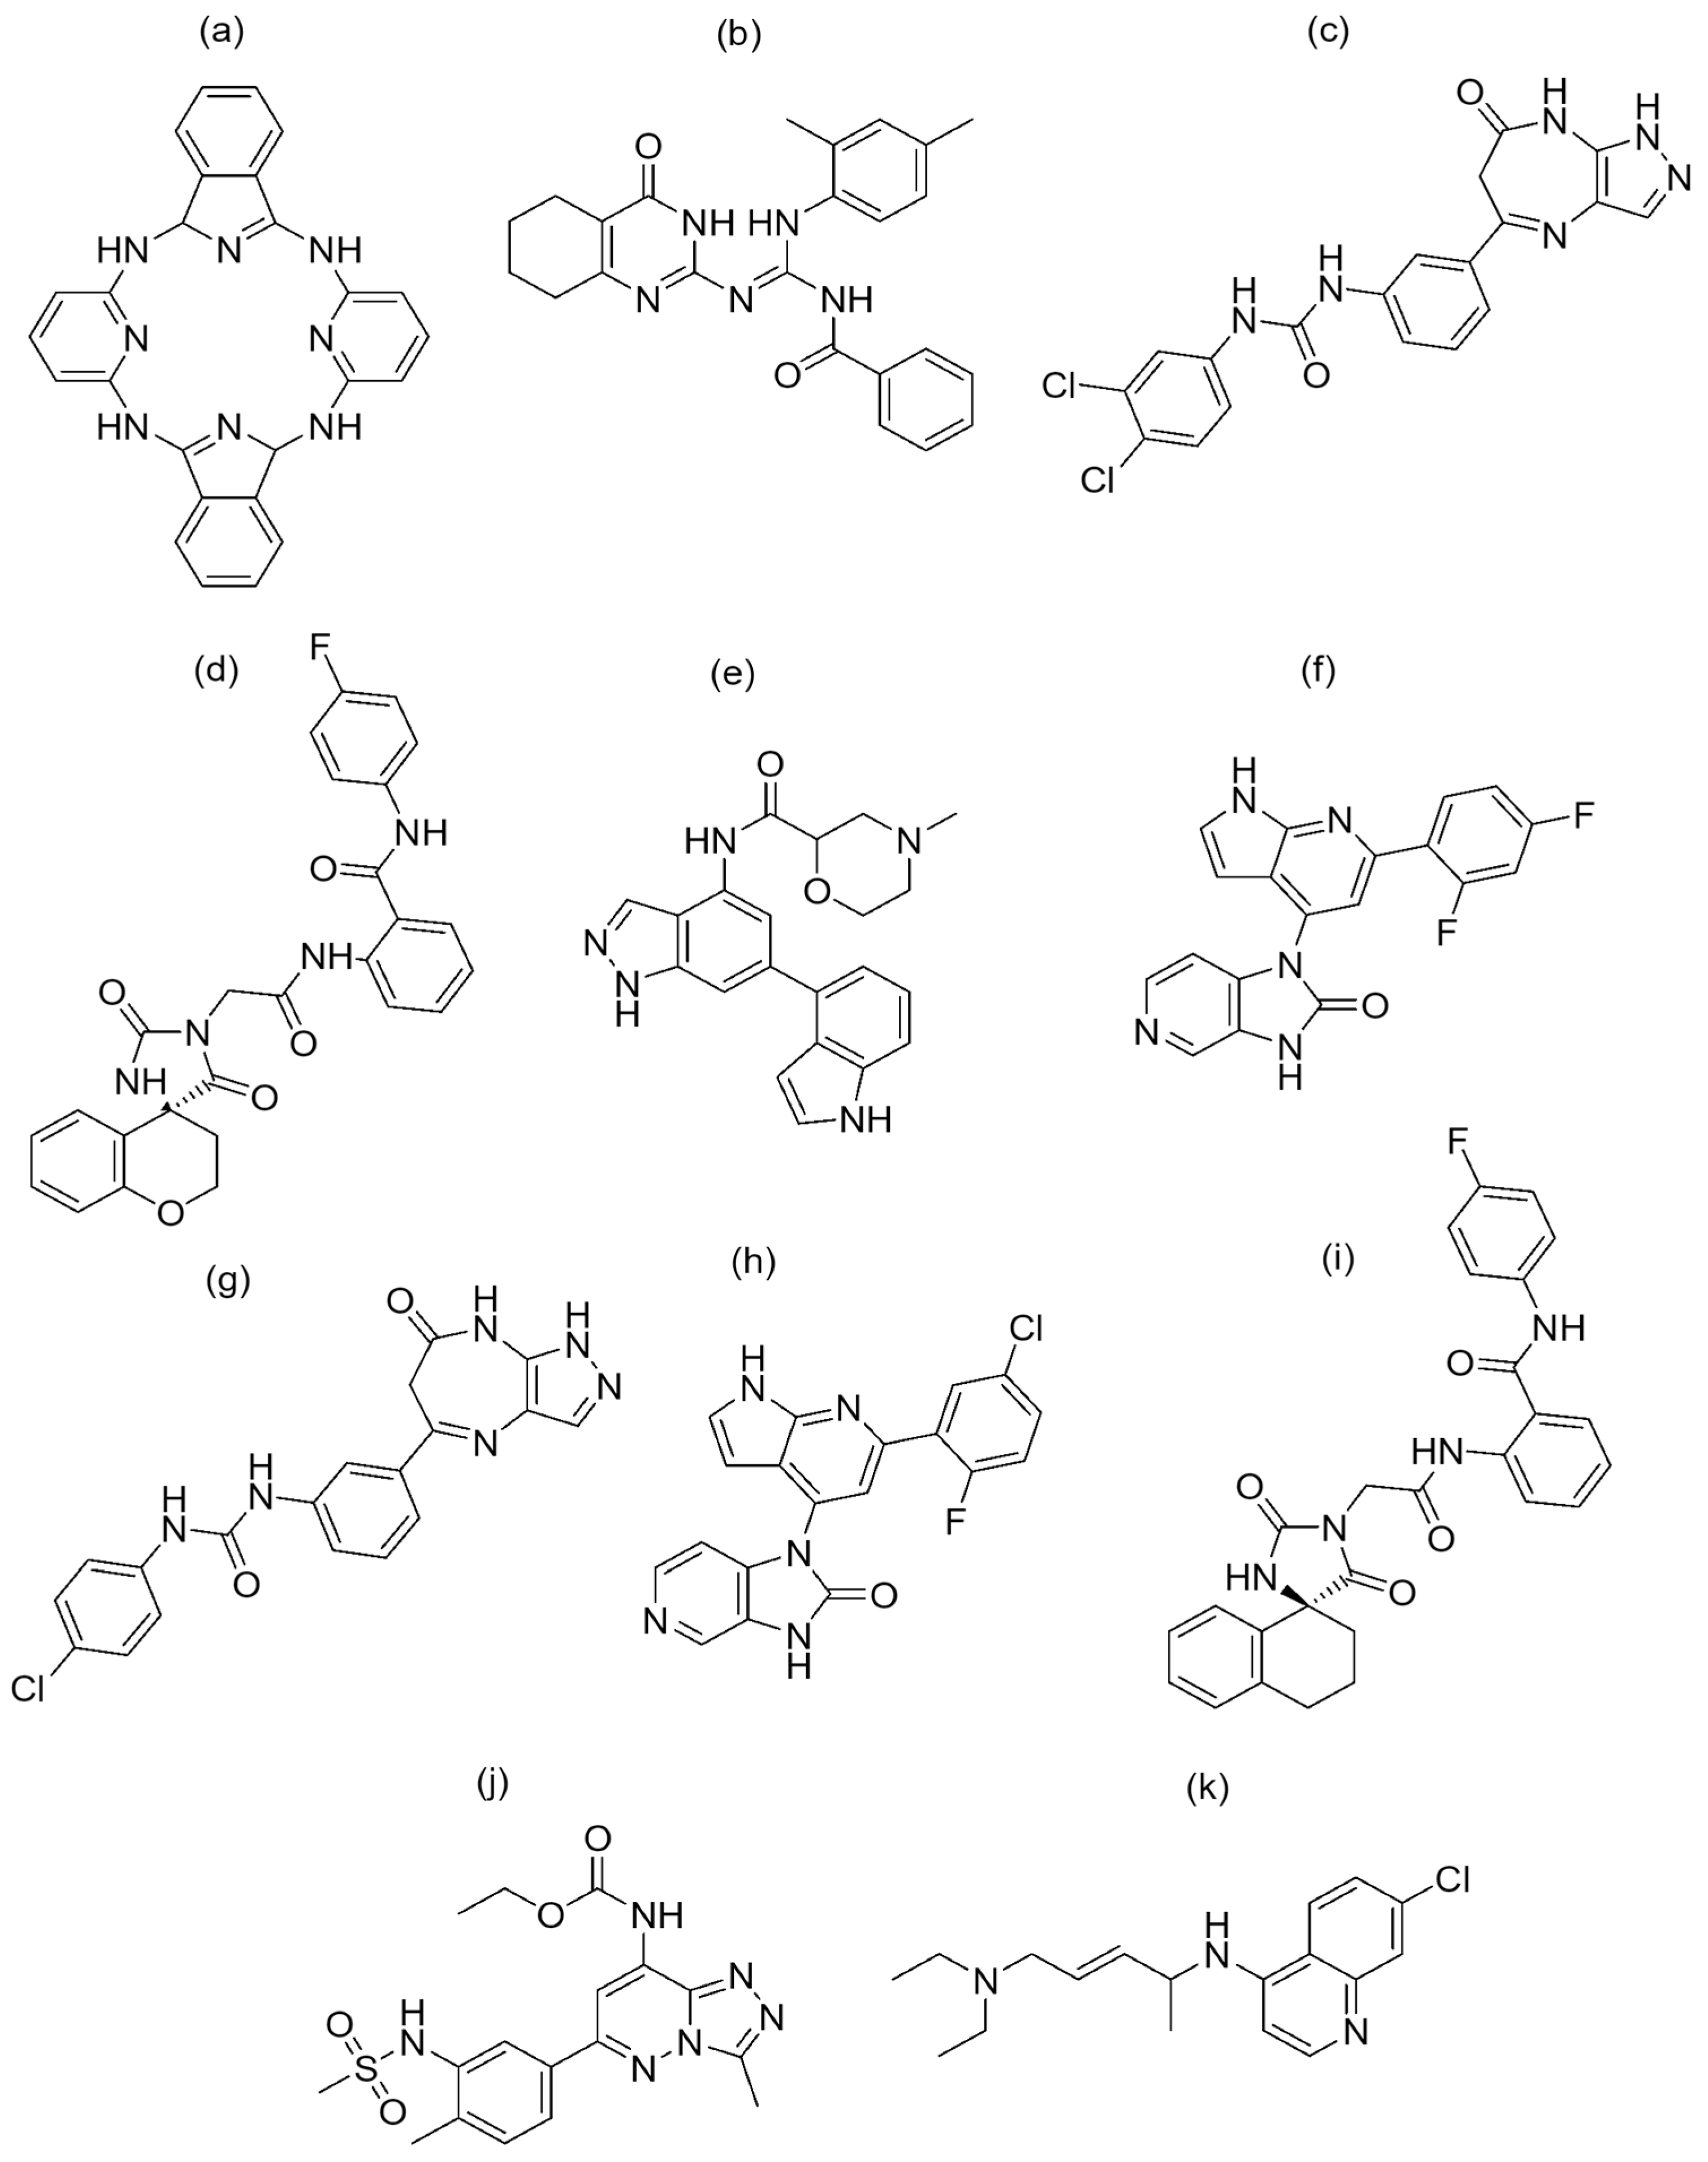
A total of 9 top hit molecules were selected from a pool of 1785 drug-like compounds based on their high binding affinities to the active site of PfBDP1, with values ranging from −9.8 to −10.7 kcal/mol (Table 5). These affinities were higher than those of bromosporine and chloroquine, which had binding affinities of −7.8 kcal/mol and −6.1 kcal/mol, respectively. Figure 5 displays the chemical structures of the nine selected top molecules, along with those of bromosporine and chloroquine.
Table 5.
The binding affinity of the top nine best-hit molecules, bromosporine, and chloroquine, against the PfBDP1 active site.

Figure 5.
Chemical structure of the nine best-hit molecules against PfBDP1 (PDB ID: 7M97), bromosporine, and chloroquine: (a) NSC173206, (b) LN00641055, (c) CHEMBL1917932, (d) ZINC8755777, (e) CHEMBL2216838, (f) CHEMBL4555703, (g) CHEMBL1917929, (h) CHEMBL4470706, (i) ZINC9217995, (j) bromosporine, and (k) chloroquine.
2.2.5. Post-Screening Analysis
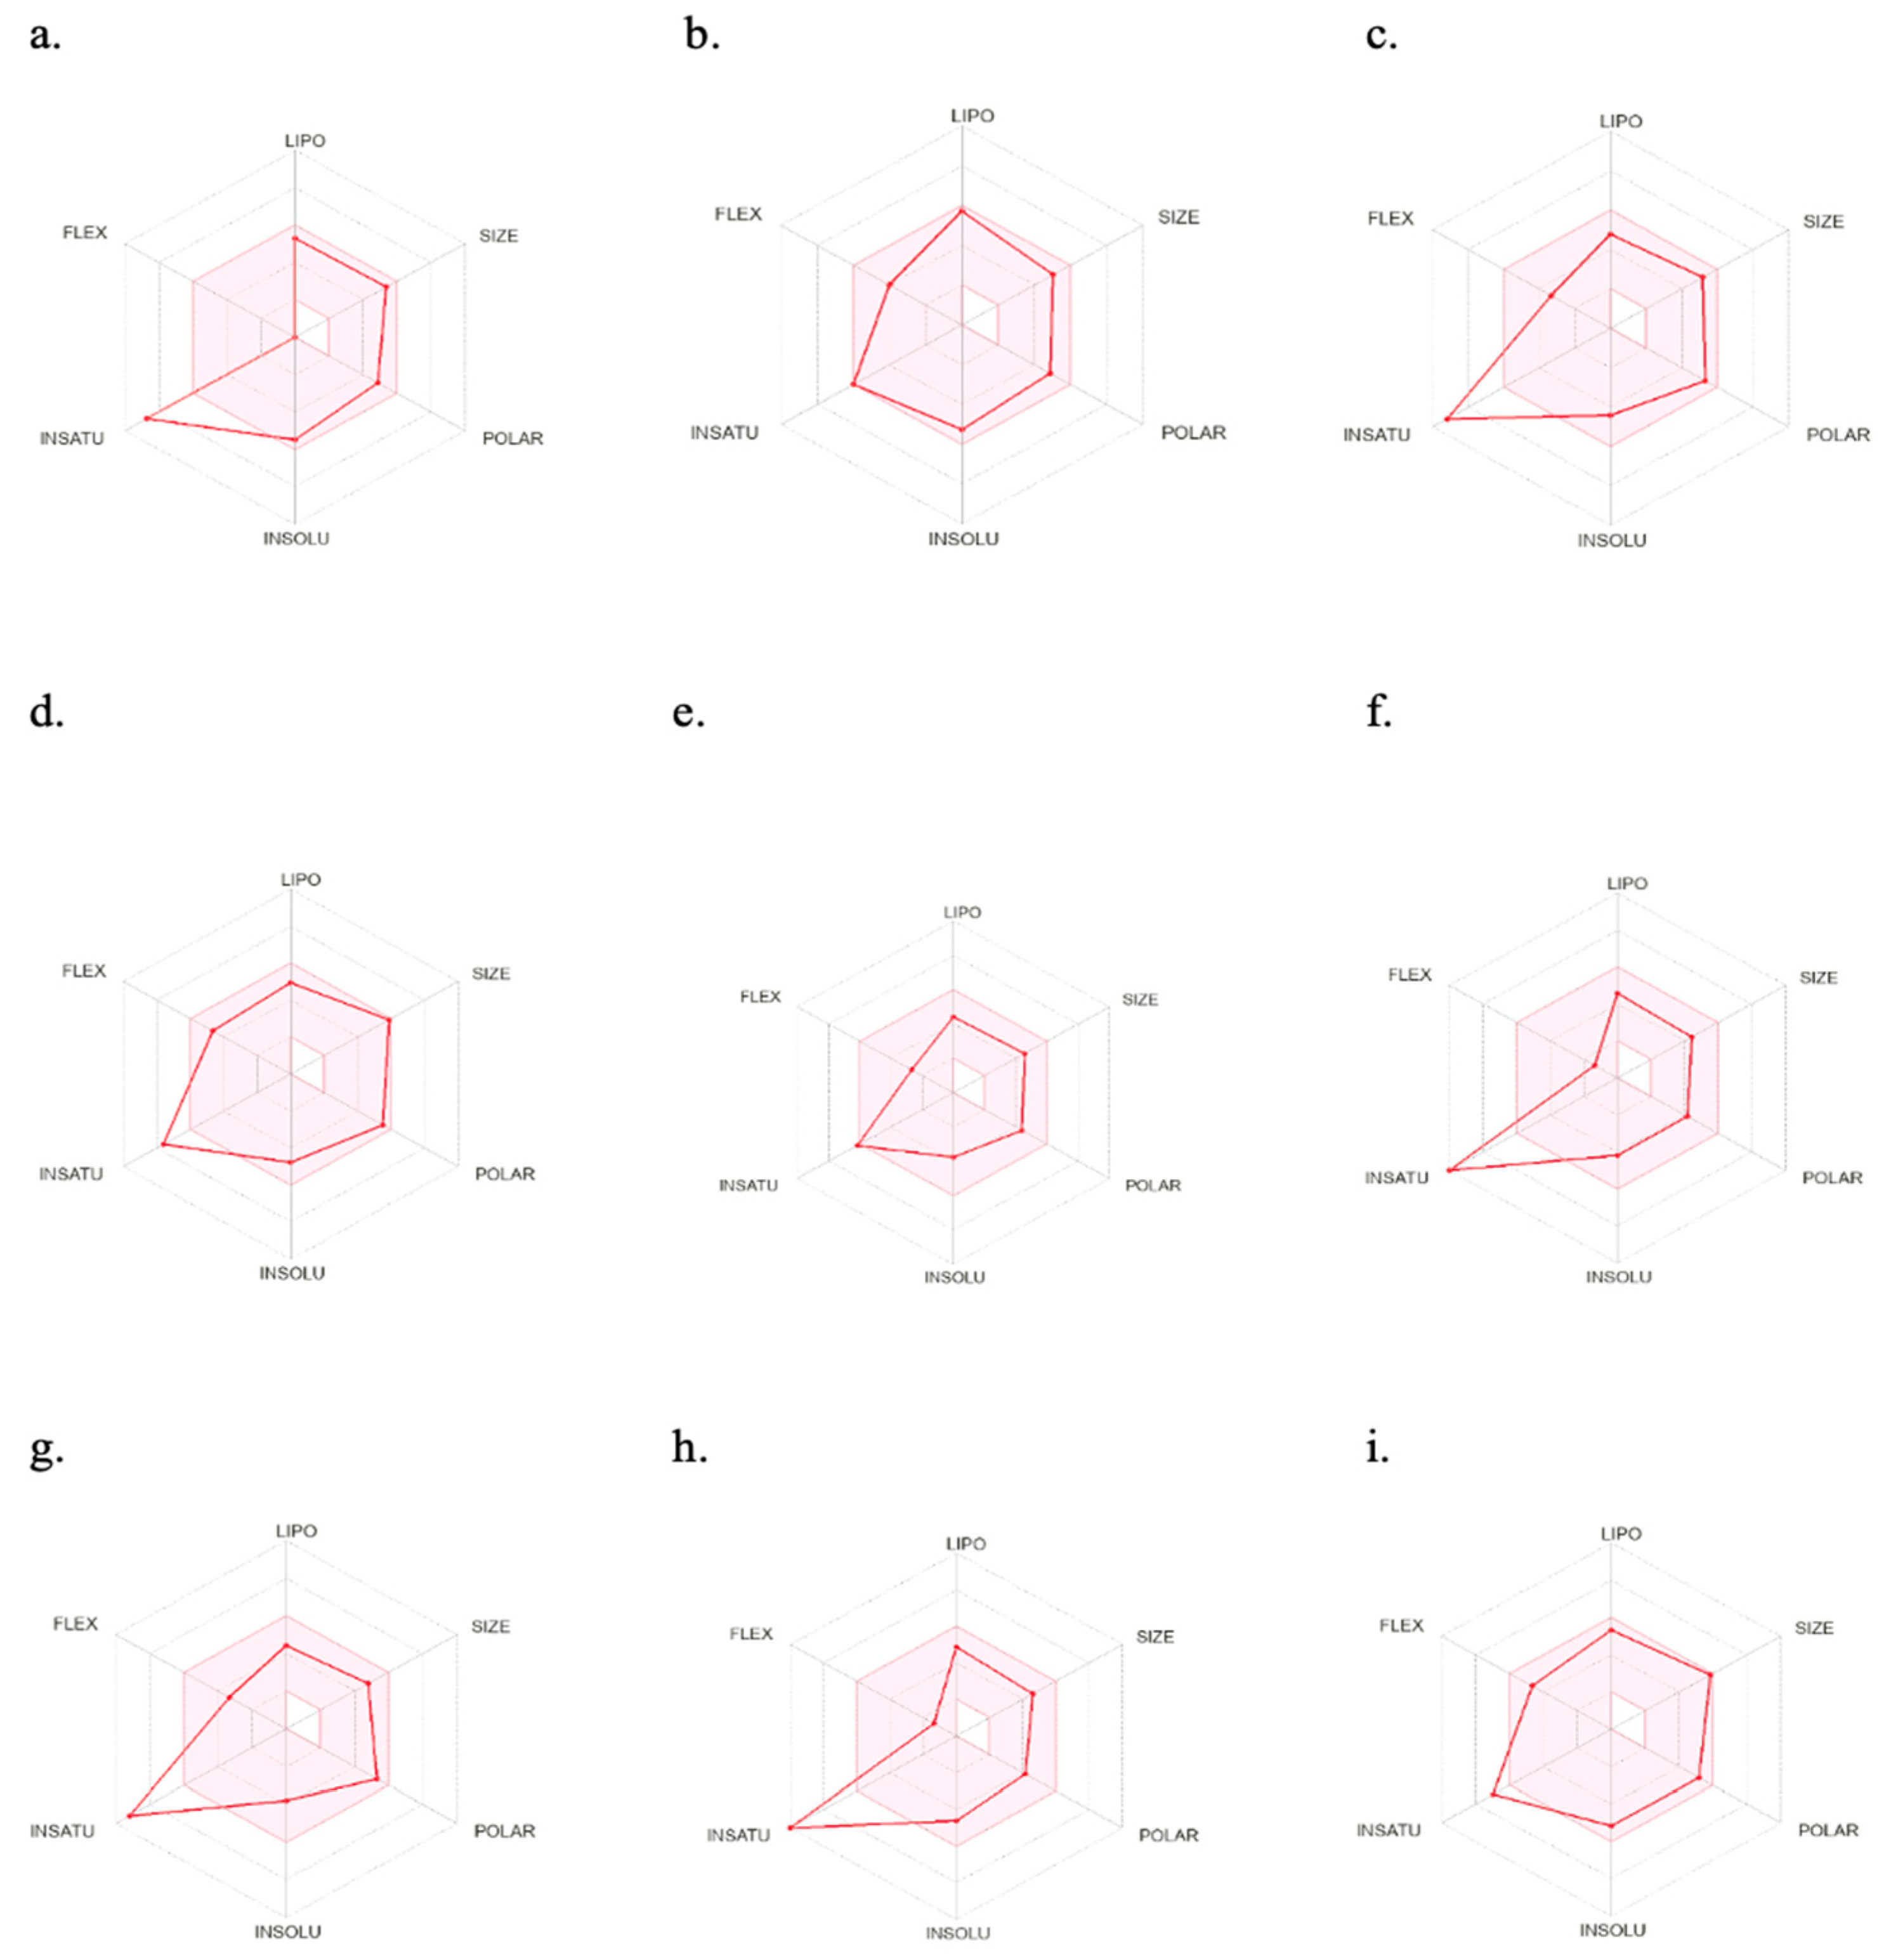
Figure 6 illustrates the oral bioavailability radar of the nine best-hit molecules, bromosporine, and chloroquine. The colored zone represents the suitable physicochemical space for oral bioavailability. Only two molecules (LN00641055 and CHEMBL2216838) fall within this space. However, all nine molecules have molecular weights of less than 500 g/mol and are within the permissible range for their physicochemical characteristics, which is important for their easy absorption and the ability to reach their site of action when administered as drugs.
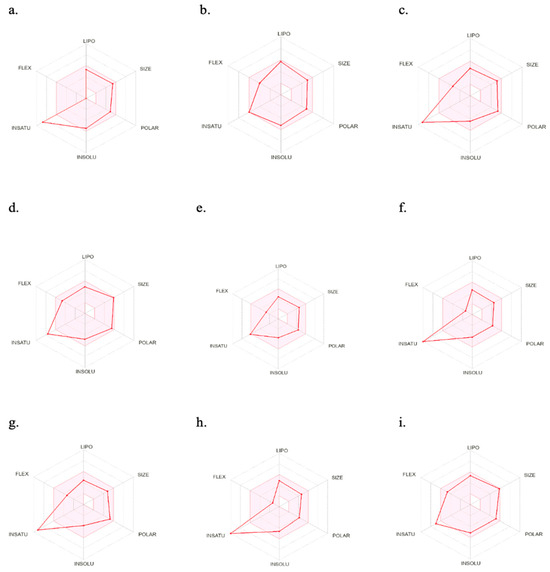
Figure 6.
SwissADME oral bioavailability radar of the nine best-hits, bromosporine, and chloroquine. (a) NSC173206, (b) LN00641055, (c) CHEMBL1917932, (d) ZINC8755777, (e) CHEMBL2216838, (f) CHEMBL4555703, (g) CHEMBL1917929, (h) CHEMBL4470706, (i) ZINC9217995. LIPO (lipophilicity): −0.7 < XLOGP3 < 5.0; SIZE: 150 g/mol < MV < 500 g/mol; POLAR (polarity): 20 Å2 < TPSA < 130 Å2; INSOLU (insolubility): −6 < Log S (ESOL) < 0; INSATU (insaturation): 0.25 < fraction Csp3 < 1; FLEX (flexibility): 0 < number of rotatable bonds < 9.
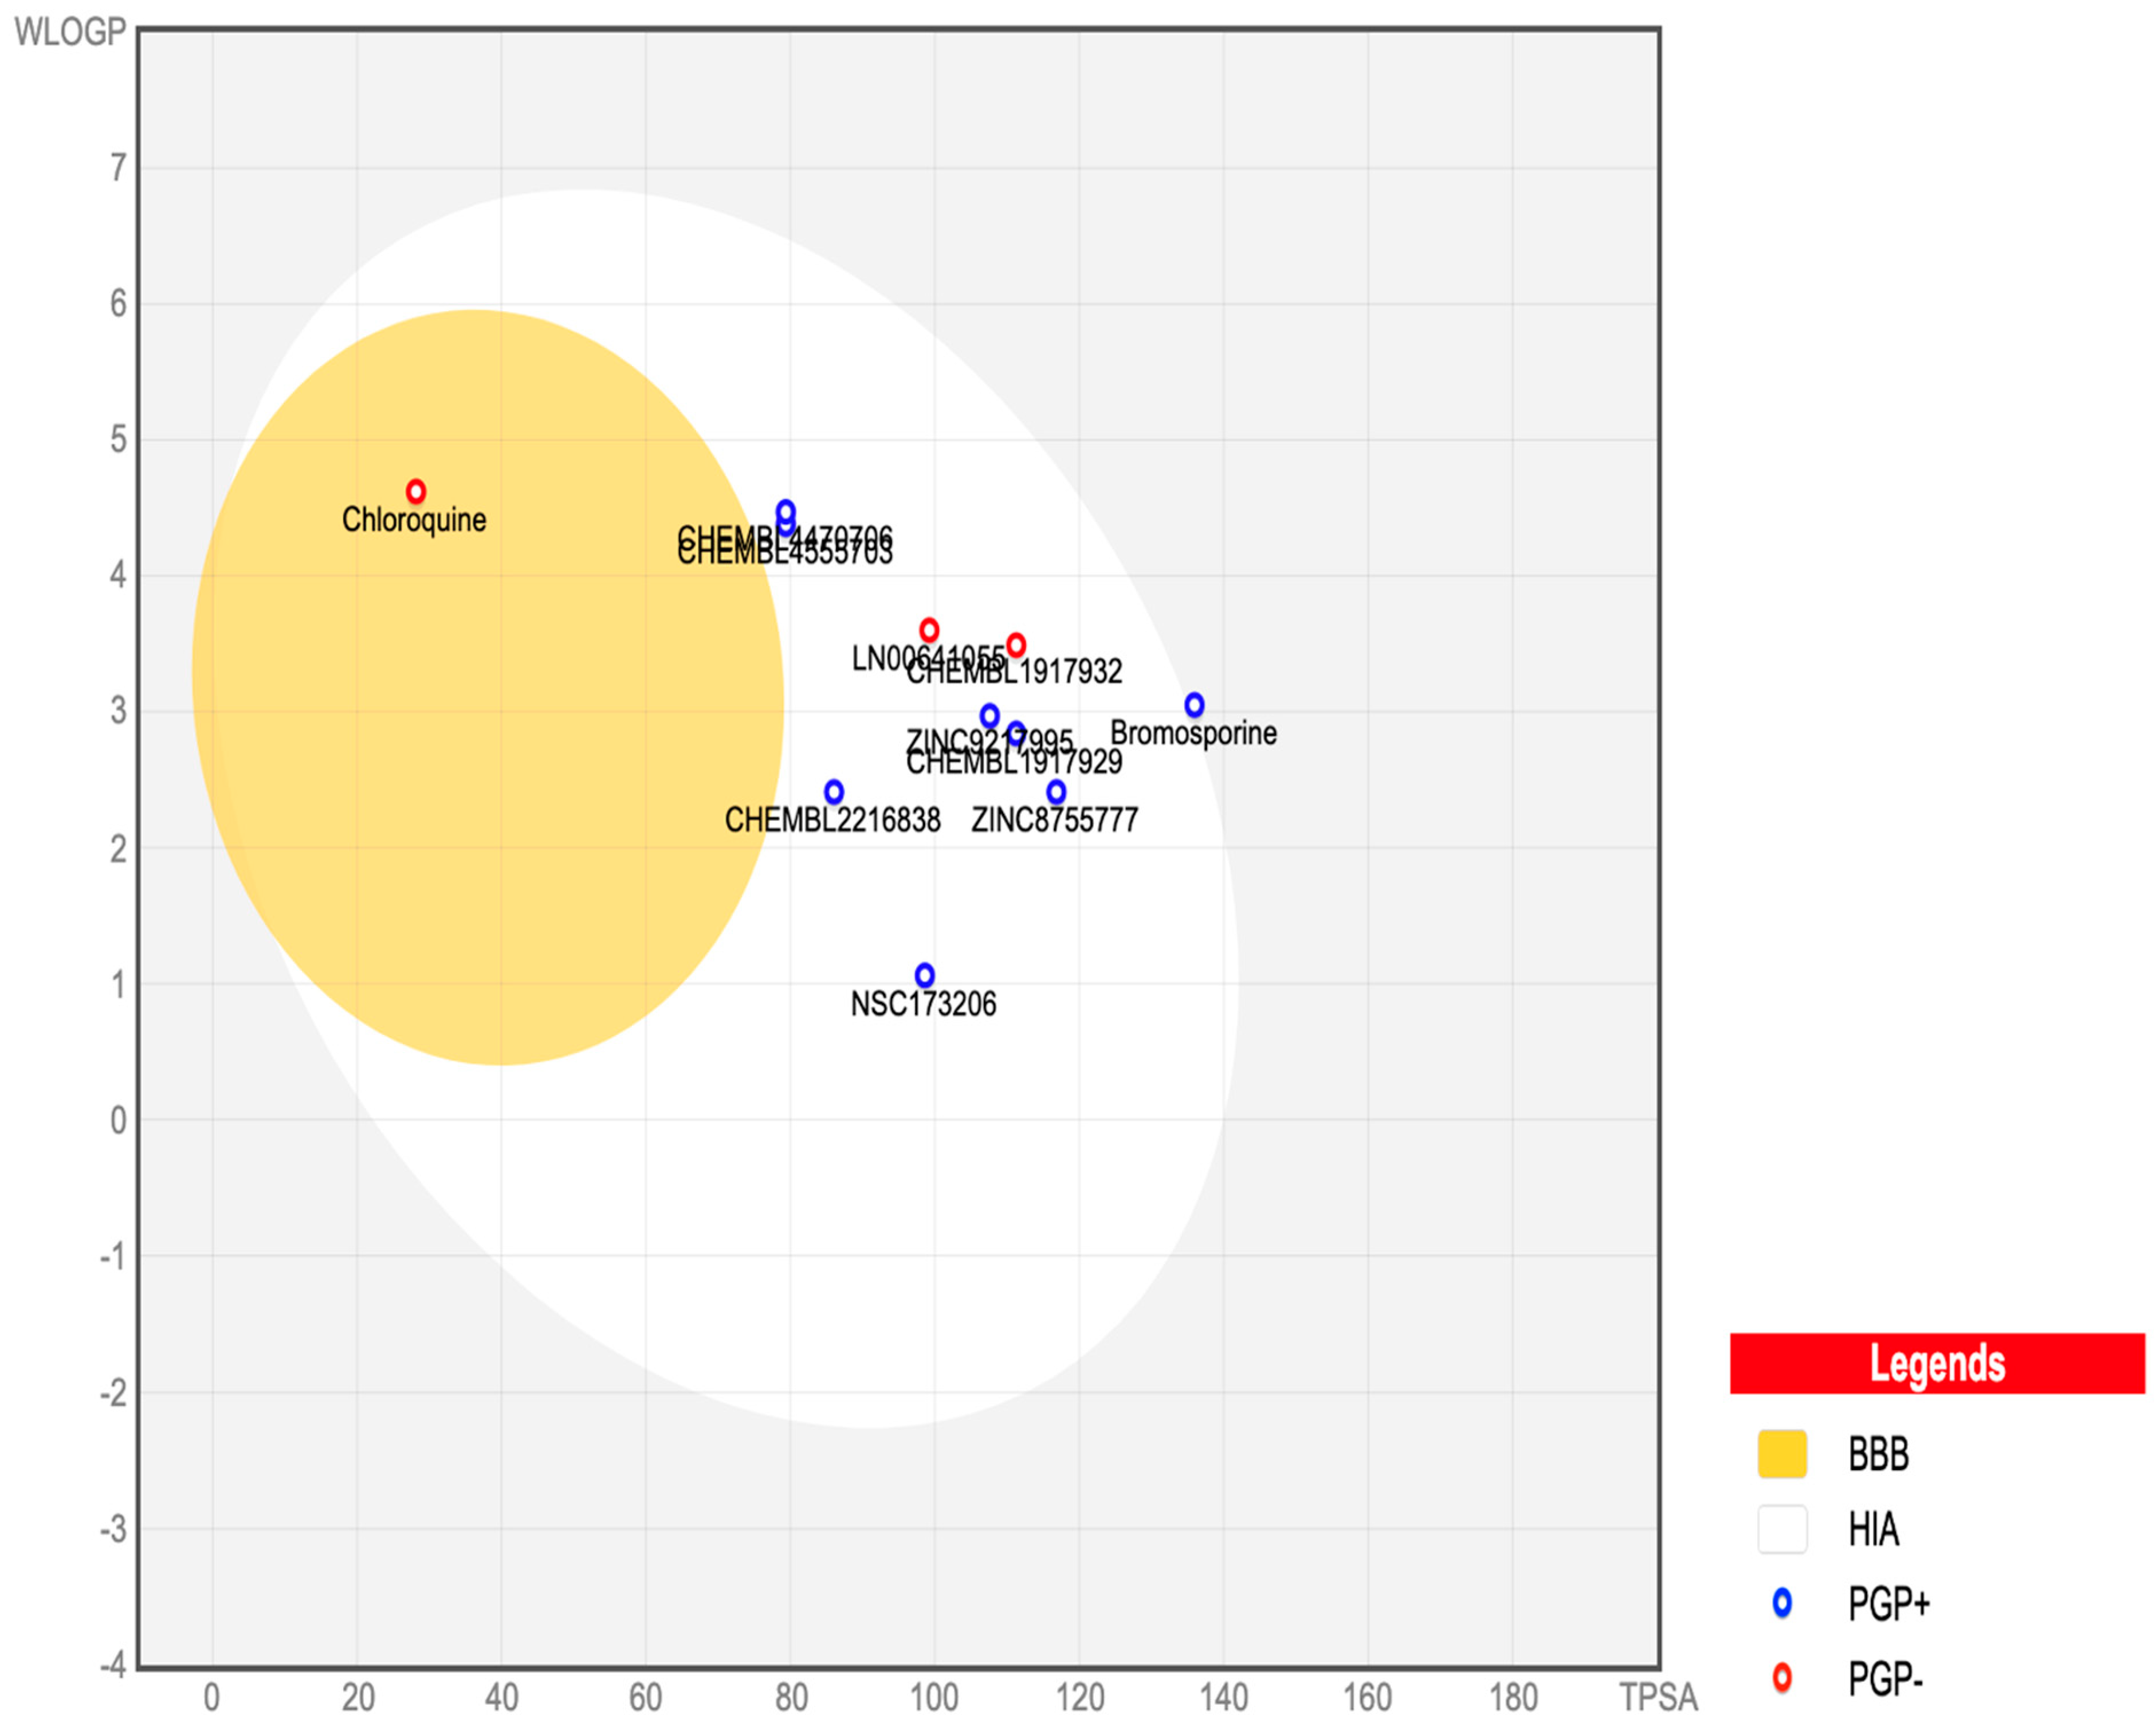
Figure 7 presents an egg plot of the nine best-hit molecules, bromosporine, and chloroquine. All the best-hit molecules are within the boiled egg’s white region, indicating their ability to be passively absorbed through the gastrointestinal tract. The molecules are represented as blue dots, showing that P-glycoprotein can efflux them from the central nervous system, except for LN00641055 and CHEMBL1917932, which are represented by red dots, indicating their inability to be effluxed by P-glycoprotein. P-glycoprotein is an ATP-dependent transmembrane protein that plays a key role in the efflux of compounds across the blood–brain barrier (BBB).
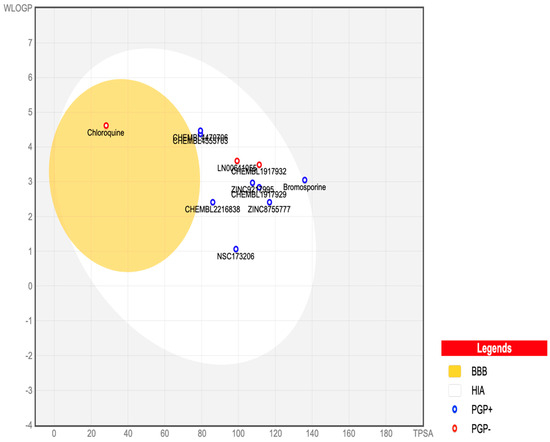
Figure 7.
SwissADME BOILED-Egg plot of the nine best-hits, bromosporine, and chloroquine. In this plot, points located in the boiled egg’s yolk indicate molecules predicted to permeate through the blood–brain barrier passively. Points located in the boiled egg’s white indicate molecules predicted to be passively absorbed through the gastrointestinal tract. Blue dots represent molecules predicted to be effluxed from the central nervous system by P-glycoprotein. Red dots represent molecules predicted not to be effluxed from the central nervous system by P-glycoprotein.
Table 6 summarizes the physicochemical and pharmacokinetic properties, drug-likeness, drug score, lipophilicity, water solubility, synthetic accessibility, and toxicity risks for the nine best-hit molecules, bromosporine, and chloroquine. Six of the nine best-hit molecules (CHEMBL1917932, ZINC8755777, CHEMBL2216838, CHEMBL4555703, CHEMBL1917929, and ZINC9217995) showed high drug scores and positive drug-likeness values. CHEMBL2216838 had a drug score of 0.78 and drug-likeness of 8.60, which are higher than those of chloroquine (drug score 0.25 and drug-likeness 7.39).
Table 6.
Physicochemical properties, drug-likeness, and toxicity risk prediction of the nine best-hit molecules, bromosporine, and chloroquine, using SwissADME and OSIRIS Property Explorer.
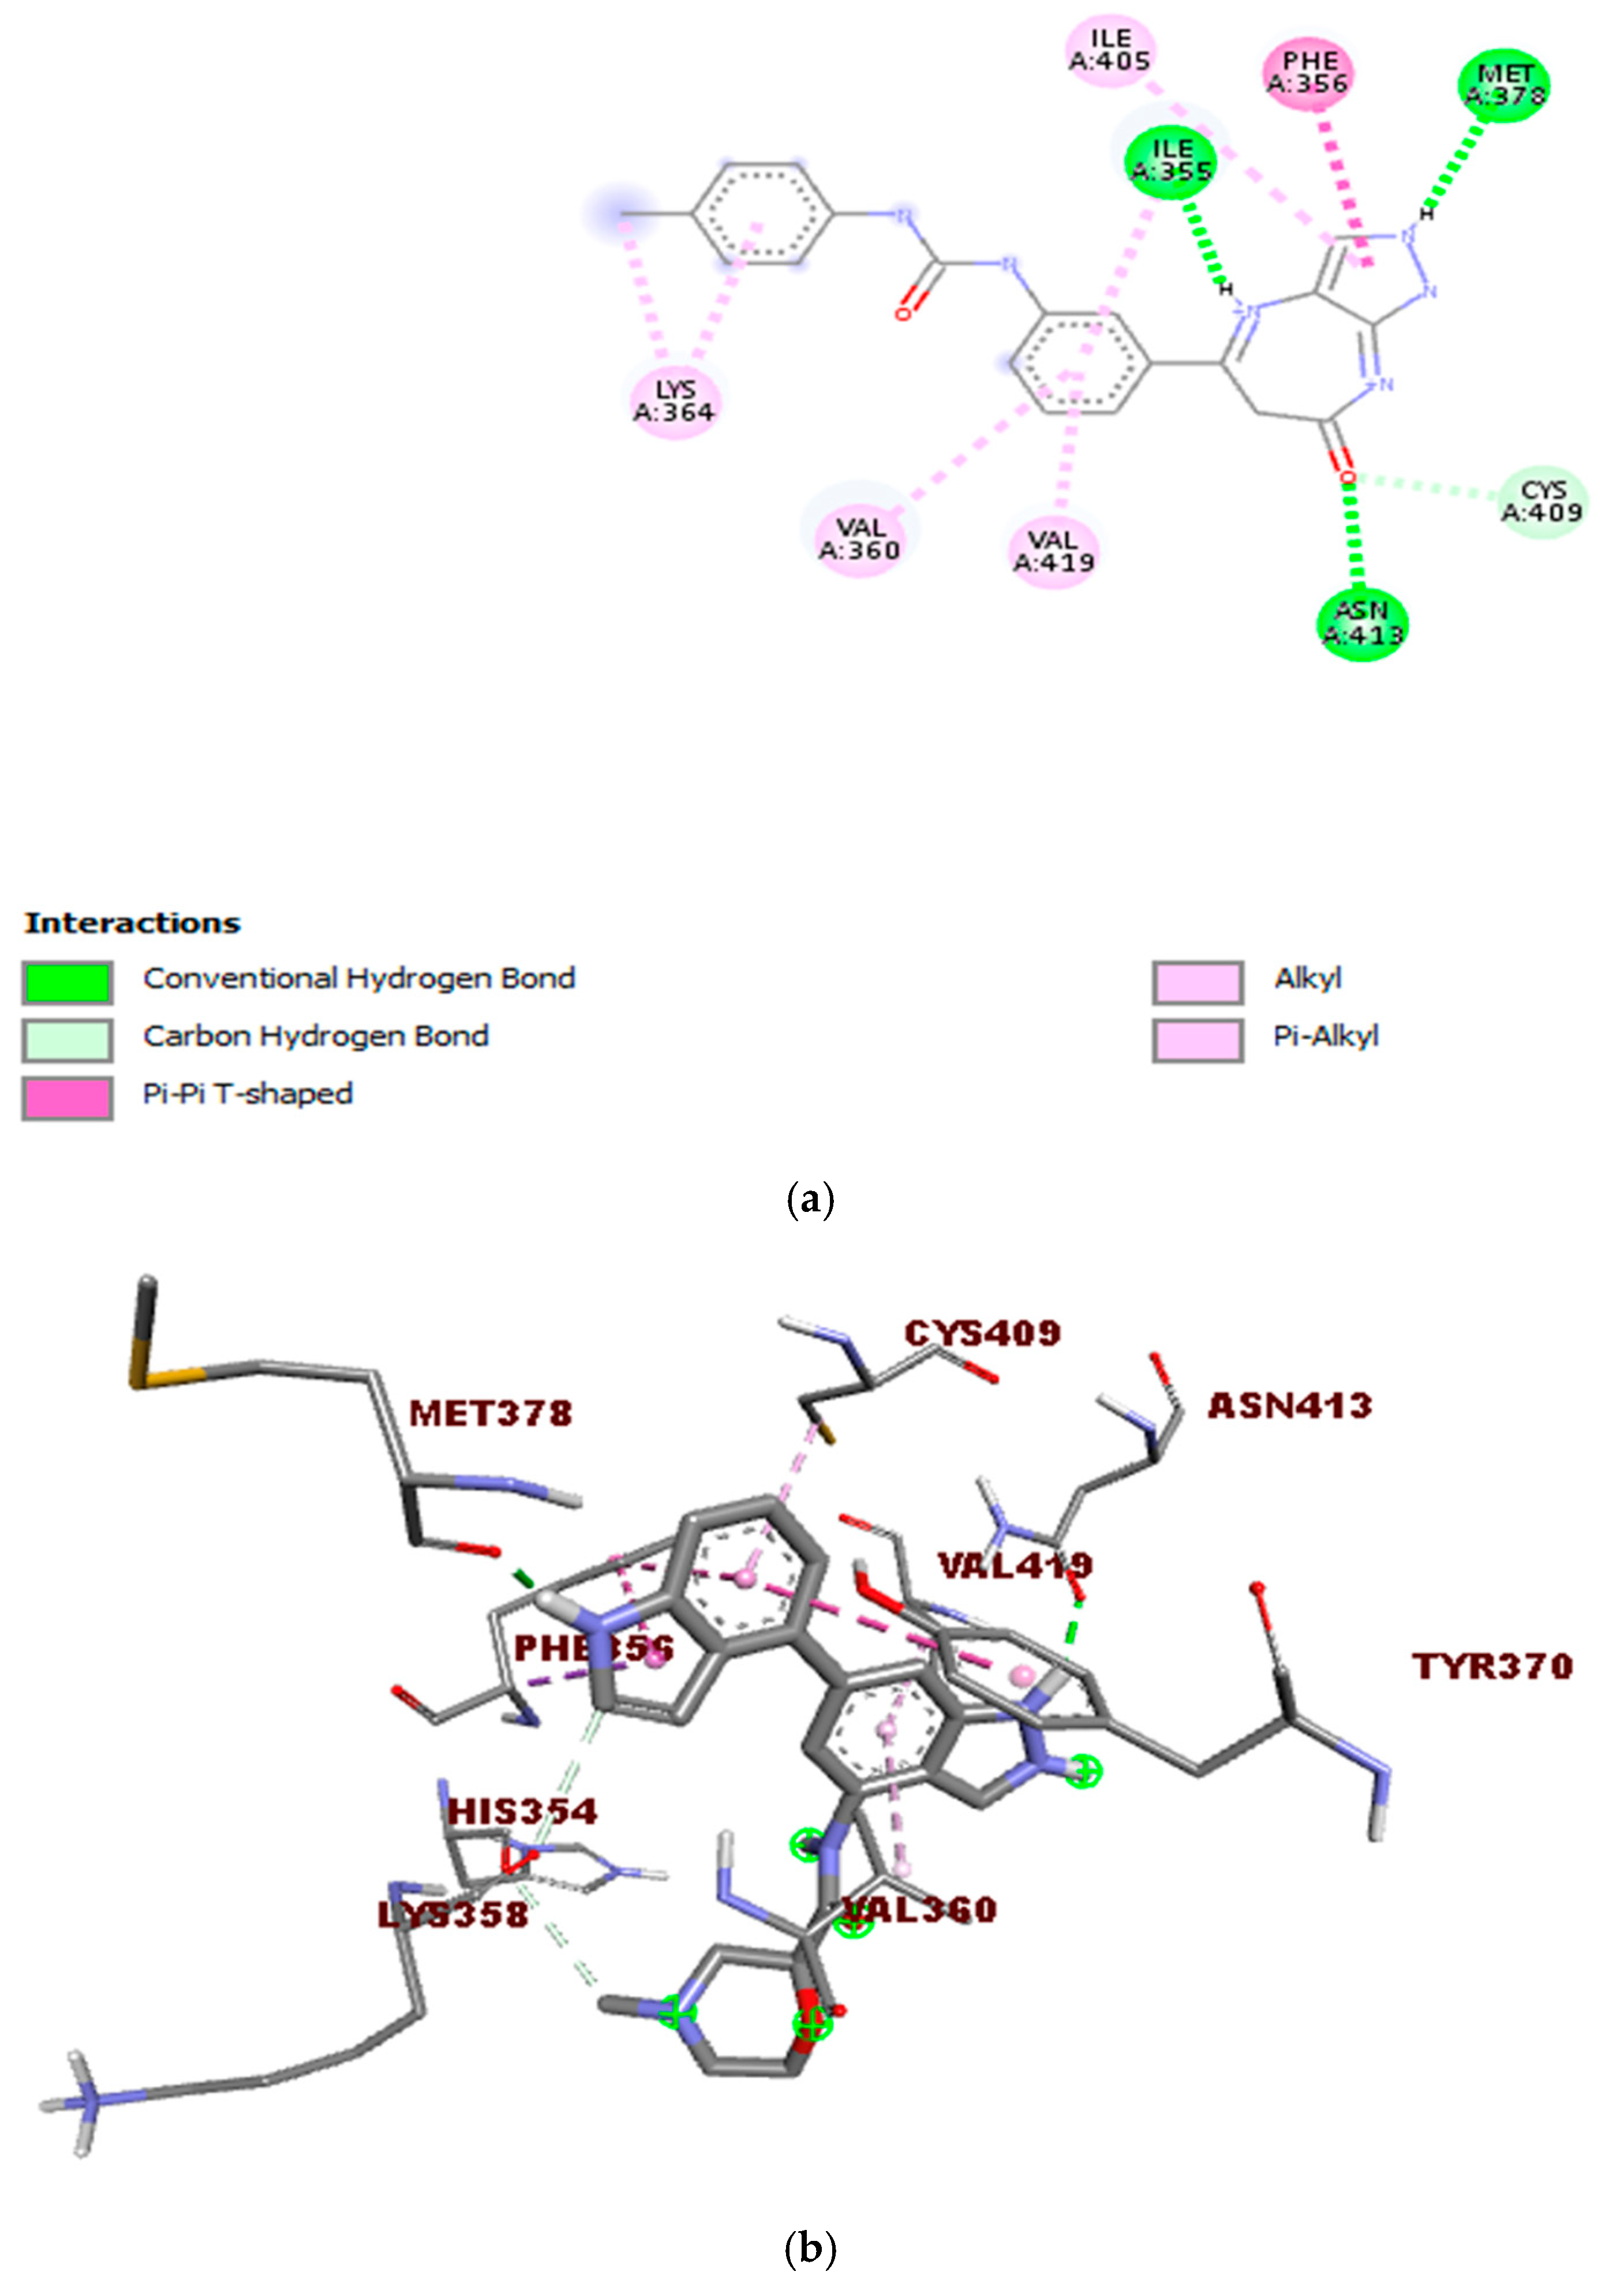
Figure 8 displays the 2D and 3D bond interactions between the lead molecule CHEMBL2216838 and the amino acid residues in the active site of PfBDP1. CHEMBL2216838 formed a conventional hydrogen bond interaction with Ile355, Met378, and Asn413, a carbon–hydrogen bond interaction with Cys409, a Pi T-shaped bond interaction with Phe356, and an alkyl and Pi alkyl bond interaction with Val360, Lys364, Ile405, and Val419.

Figure 8.
Interactions between the molecule CHEMBL2216838 and PfBDP1 (PDB ID: 7M97): (a) 2D representation of the interactions between CHEMBL2216838 and the amino acids in the active site of PfBDP1, and (b) 3D visualization of the binding interactions between CHEMBL2216838 and the amino acids in the active site of PfBDP1 (PDB ID: 7M97), highlighting the structural and binding details.
2.2.6. Molecular Dynamics Simulation of the Lead Molecule and PfBDP1 Complex
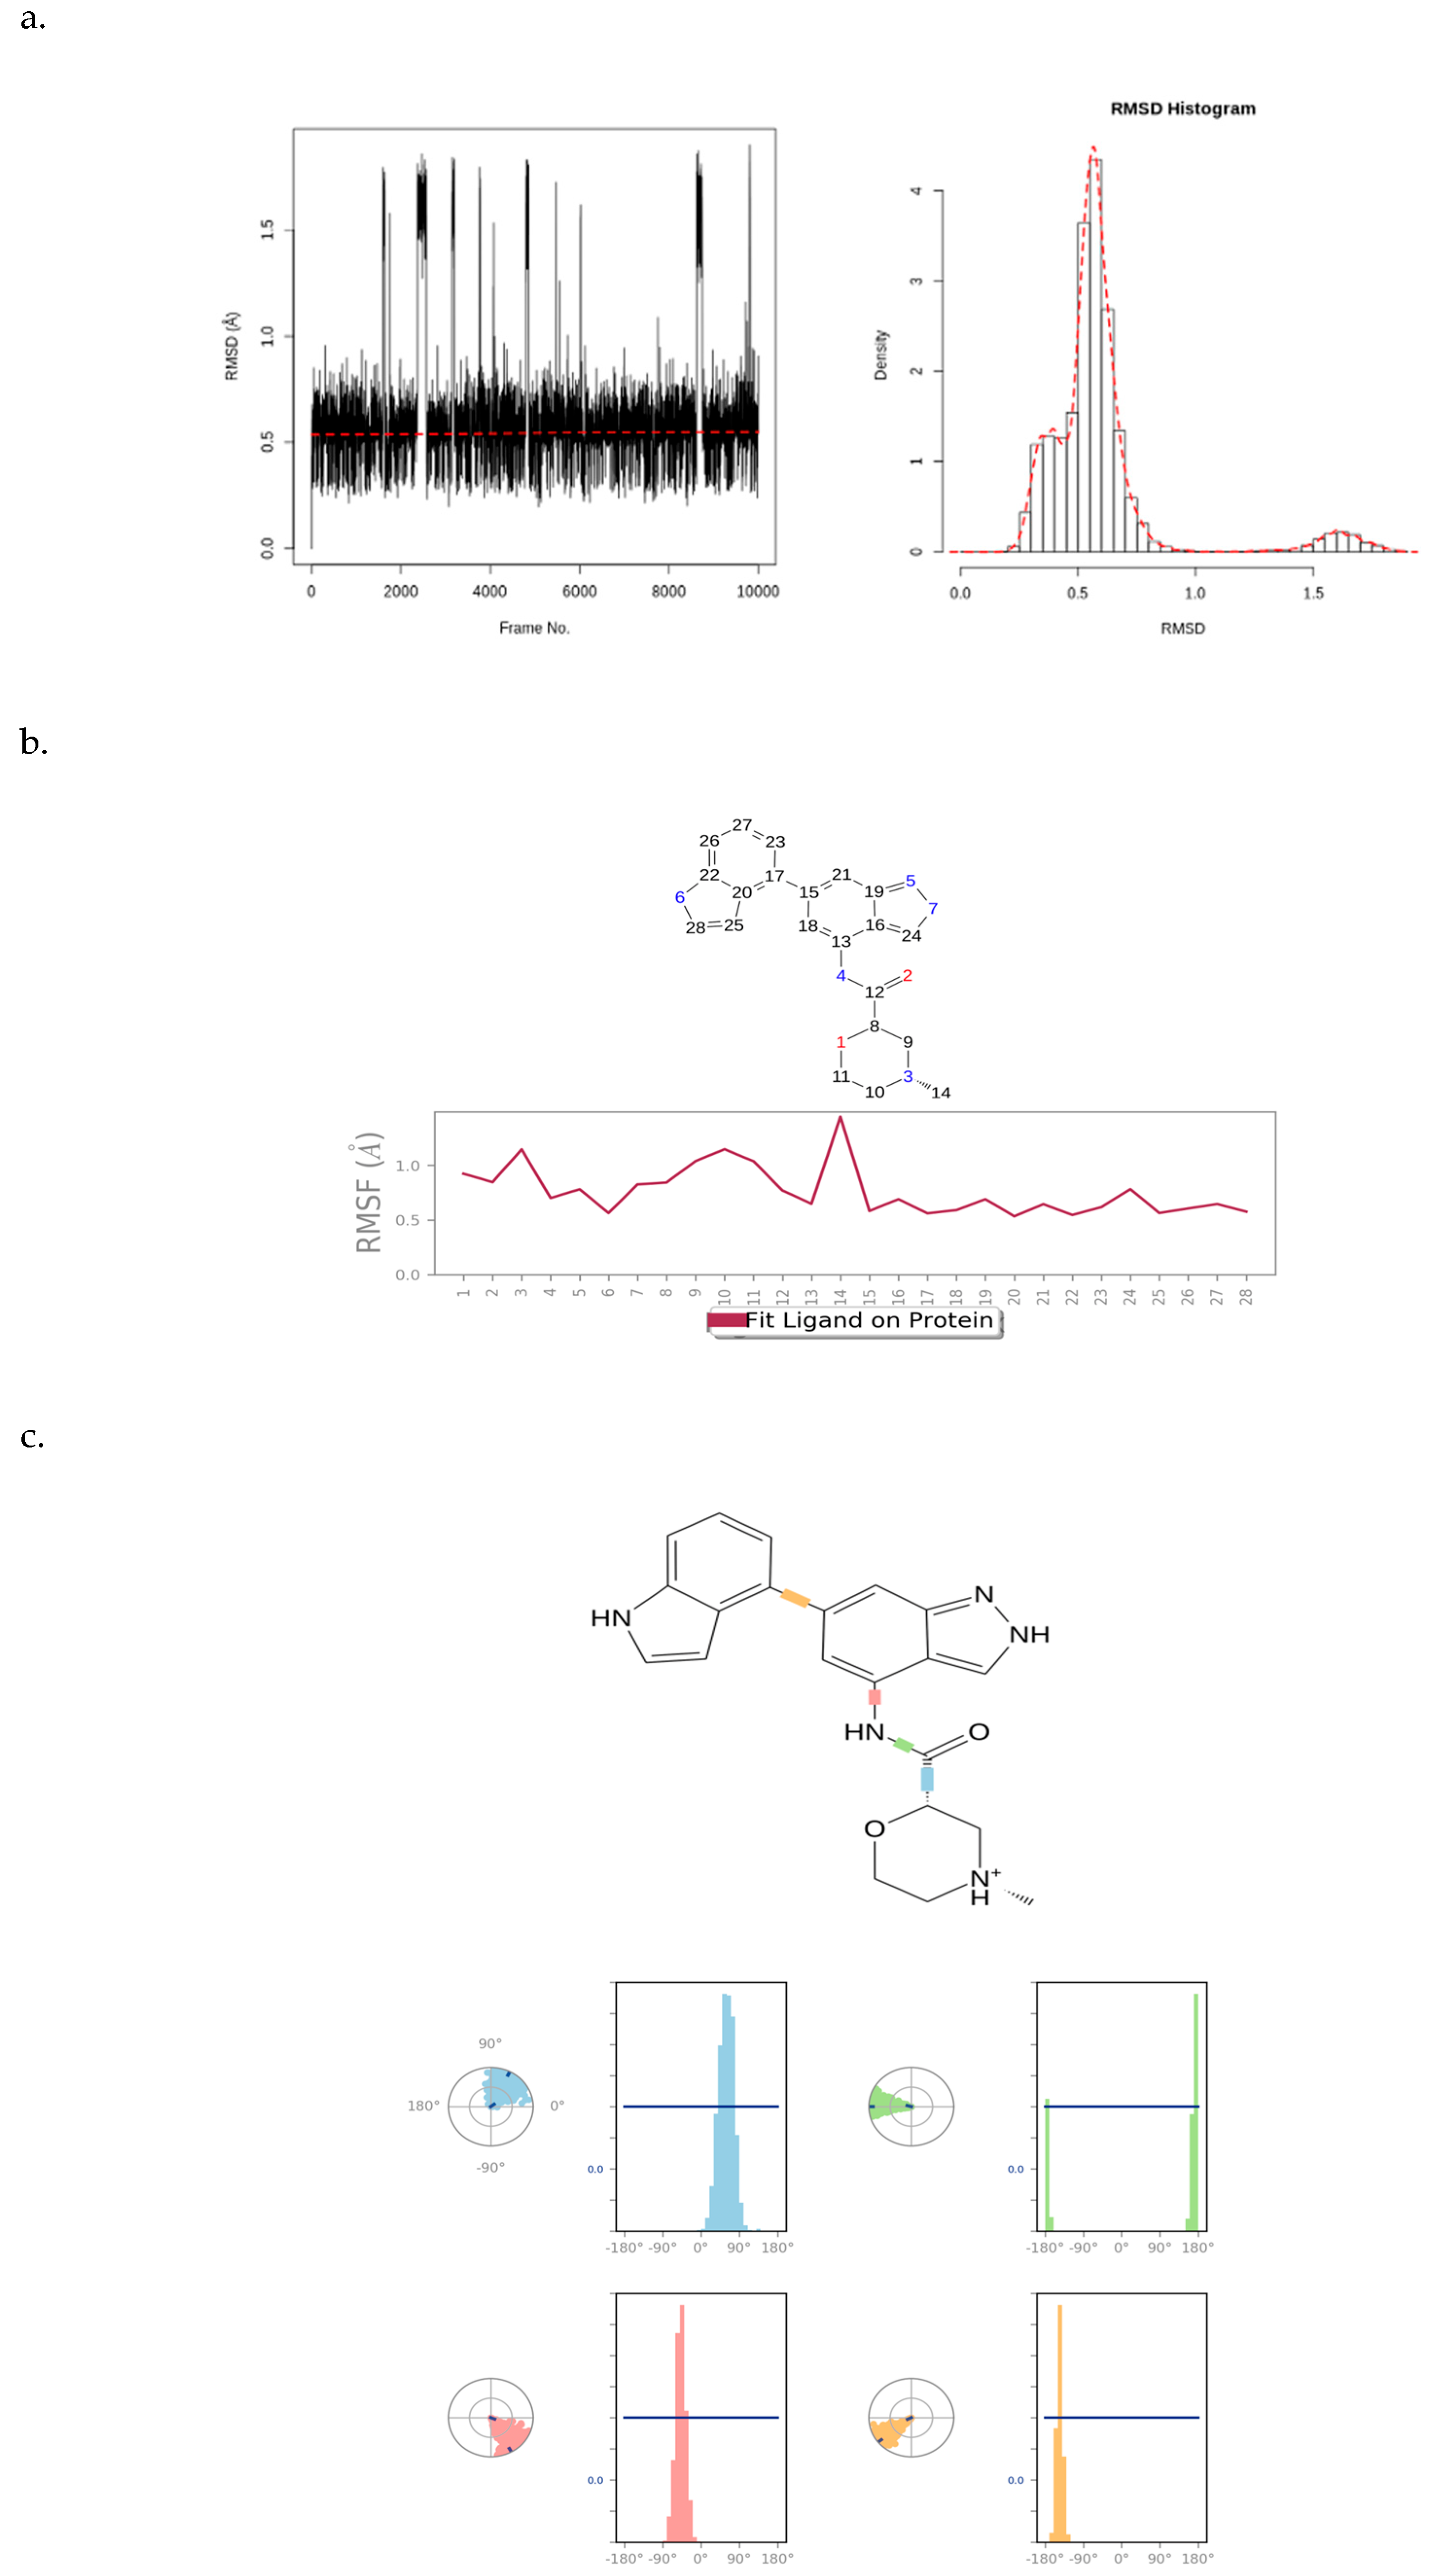
Figure 9 illustrates a PfBDP1 RMSD plot, histogram, and RMSF (Å) plot against the residue position. The PfBDP1 RMSD plot indicates that the RMSD fluctuates steadily between 0.8 and 4.0 Å after an initial rise from 0.00. This suggests that the complex undergoes an initial structural adjustment before stabilizing within this range (Figure 9a).
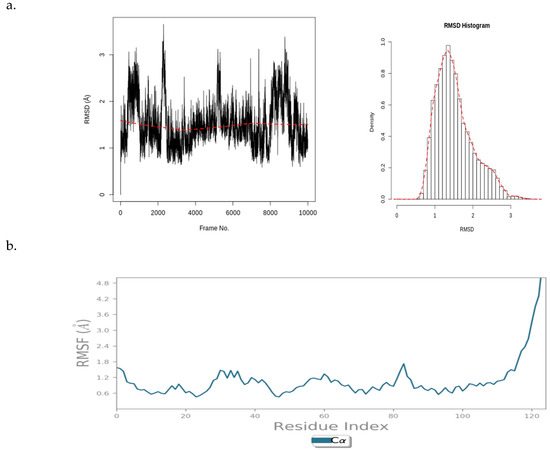
Figure 9.
(a) PfBDP1 root mean square deviations (RMSD) plot and corresponding histogram, and (b) PfBDP1 root mean square fluctuation (RMSF) (Å) plotted against the residue position.
The PfBDP1 RMSF plot shows a fluctuation of about 1.6 Å around the N-terminal (turn region), indicating higher flexibility in this area. Within the secondary structure elements (alpha-helices and beta-strands), the fluctuation remains stable between 0.6 and 1.8 Å. A notable rise to 4.8 Å is observed at the C-terminal (loop region), suggesting greater flexibility in the loop region compared to that of the structured regions. The secondary structure elements fluctuate less, indicating a more rigid conformation compared to that of the more flexible unstructured regions (turns and loops) (Figure 9b).
These data provide insights into the dynamic behavior of the PfBDP1 protein and its interaction with CHEMBL2216838, highlighting areas of flexibility and rigidity within the protein structure.
Figure 10 presents an RMSD plot, histogram, RMSF plot, and torsion profile of CHEMBL2216838. The CHEMBL2216838 RMSD plot shows values between 0.4 and 2.0 Å, which are significantly smaller than the RMSD of PfBDP1 (Figure 10a). This indicates that CHEMBL2216838 experiences relatively less fluctuation during the simulation, suggesting a stable binding to the protein.
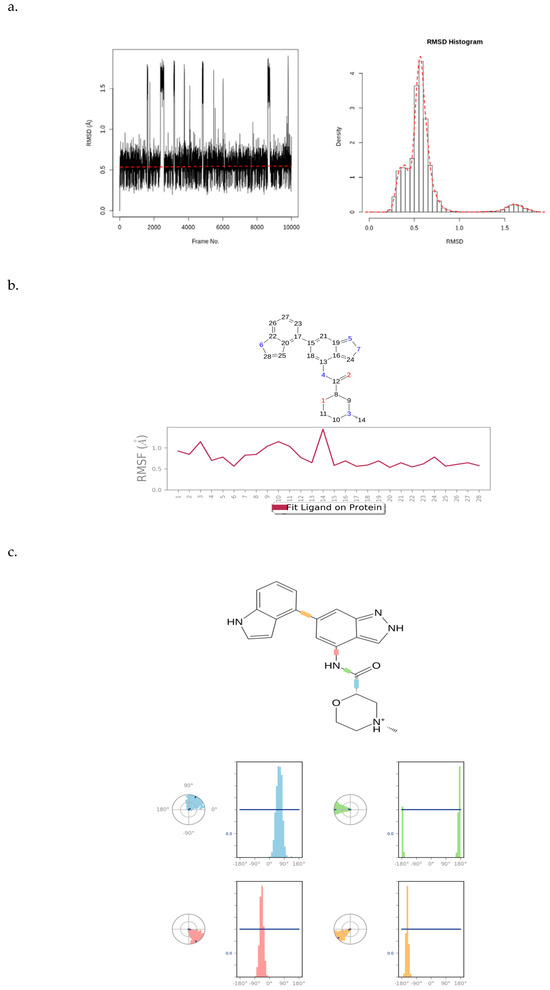
Figure 10.
(a) RMSD plot and histogram of CHEMBL2216838, (b) RMSF plot of CHEMBL2216838, and (c) torsion profile of CHEMBL2216838.
The atom-by-atom breakdown of the CHEMBL2216838 RMSF correlates with the 2D structure of the ligand, highlighting fluctuations at specific positions. The “Fit Ligand on Protein” line displays a stable ligand fluctuation between 0.5 and 1.5 Å, with a peak fluctuation observed at the carbon atom at position 14 (Figure 10b). This suggests that, while most of the ligand remains stable, this atom experiences greater mobility.
The ligand torsions plot shows a summary of the structural changes in every rotatable bond (RB) in CHEMBL2216838 during the simulation trajectory. The top panel shows the 2D schematic of CHEMBL2216838 with color-coded rotatable bonds. The dial plot (or radial chart) illustrates how each torsion angle changes throughout the simulation, starting from the center and evolving radially outward. The bar plots corresponding to each torsion angle show the probability density of the torsion values, offering a visual summary of how the ligand’s flexibility evolves during the simulation (Figure 10c). Together, these plots provide a detailed analysis of the stability, flexibility, and structural changes in CHEMBL2216838 during the MD simulation in the context of its interaction with PfBDP1.
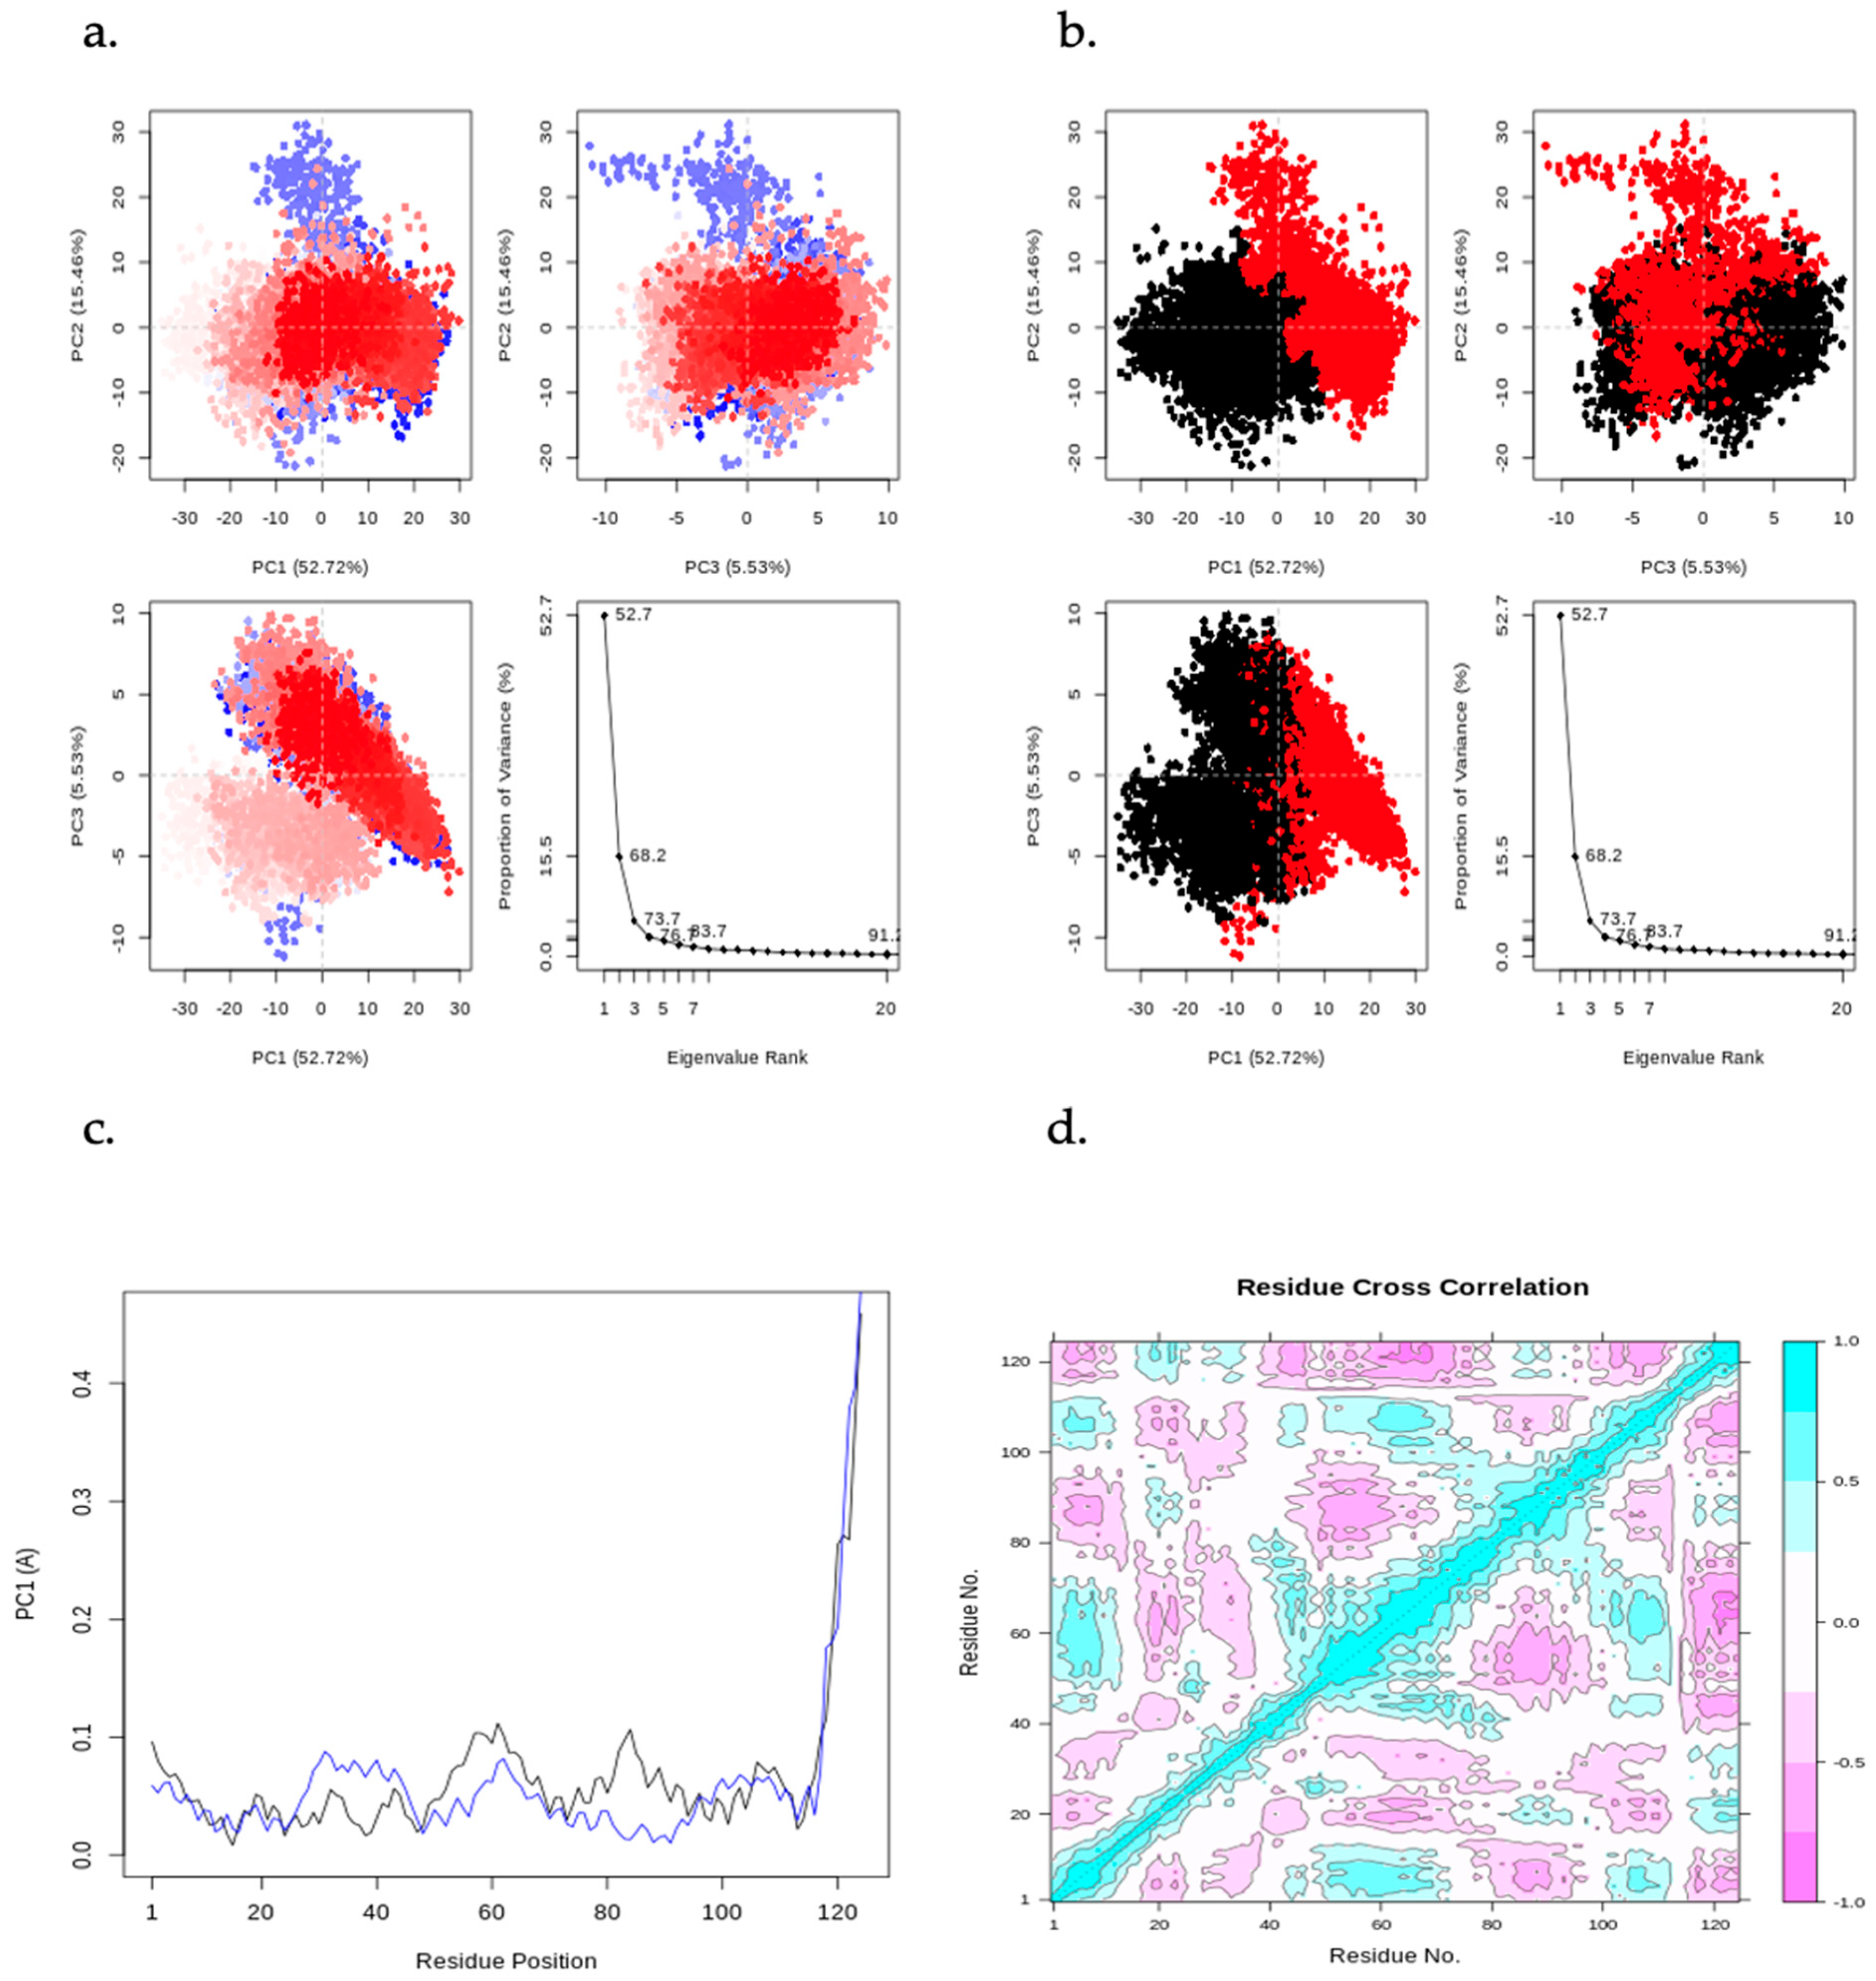
Figure 11 displays a PCA plot, PCA cluster plot, PC1 on RMSF, and the dynamic cross-correlation matrix (DCCM) analysis from the MD simulation of CHEMBL2216838 in complex with PfBDP1 (PDB ID: 7M97). By applying a correlation analysis, the motion of the protein was decomposed into independent principal components (PCs), revealing key patterns in conformational changes. The PC2 vs. PC1, PC2 vs. PC3, and PC3 vs. PC1 graphs visualize the dominant motions of the system, with an eigenvalue rank plot illustrating the cumulative variance explained by each PC. The first principal component (PC1) accounts for 52.72% of the total variance, while the combined first three principal components (PC1, PC2, and PC3) explain 73.71% of the variance. The PCA plots feature a gradient color scheme (blue → white → red), denoting the progression of the MD simulation. Clusters of trajectory snapshots were observed in black and red hues, representing different conformational states of the protein–ligand complex (Figure 11a,b). Blue represents the initial conformation, white indicates an intermediate state, and red signifies the final conformation.
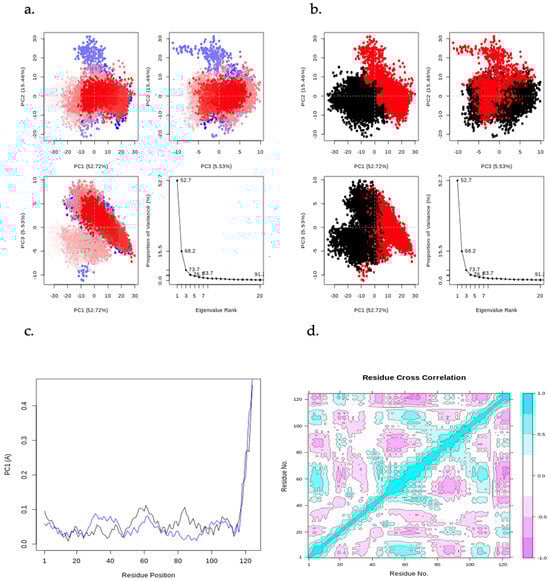
Figure 11.
Principal component analysis (PCA) results, including PC2 vs. PC1, PC2 vs. PC3, and PC3 vs. PC1 plots, along with an eigenvalue rank plot indicating cumulative variance at each data point. (a) PCA plots color-coded from blue to red based on simulation time, (b) PCA plots displaying two distinct clusters in black and red, (c) residue-wise loadings for PC1 (black) and PC2 (blue), and (d) dynamic cross-correlation matrix (DCCM) analysis.
The residue-wise loading results for PC1 (black) and PC2 (blue) show a 0.1Å fluctuation around the N-terminal (turn region), indicating higher flexibility. A stable fluctuation of 0.0–0.12 Å is observed within the secondary structure elements (alpha-helices and beta-strands), while a rise in fluctuation to 0.5 Å is seen at the C-terminal (loop region), signifying greater flexibility in the loop region (Figure 11c).
The DCCM analysis reveals patterns of correlated movements between residues. The DCCM diagram shows more persistent negative correlations than positive ones, indicating that many residues move in opposite directions throughout the simulation (Figure 11d). In contrast, positive correlations suggest that residues move in the same direction. This analysis provides insights into the coordinated movements of different regions of the protein during the simulation.
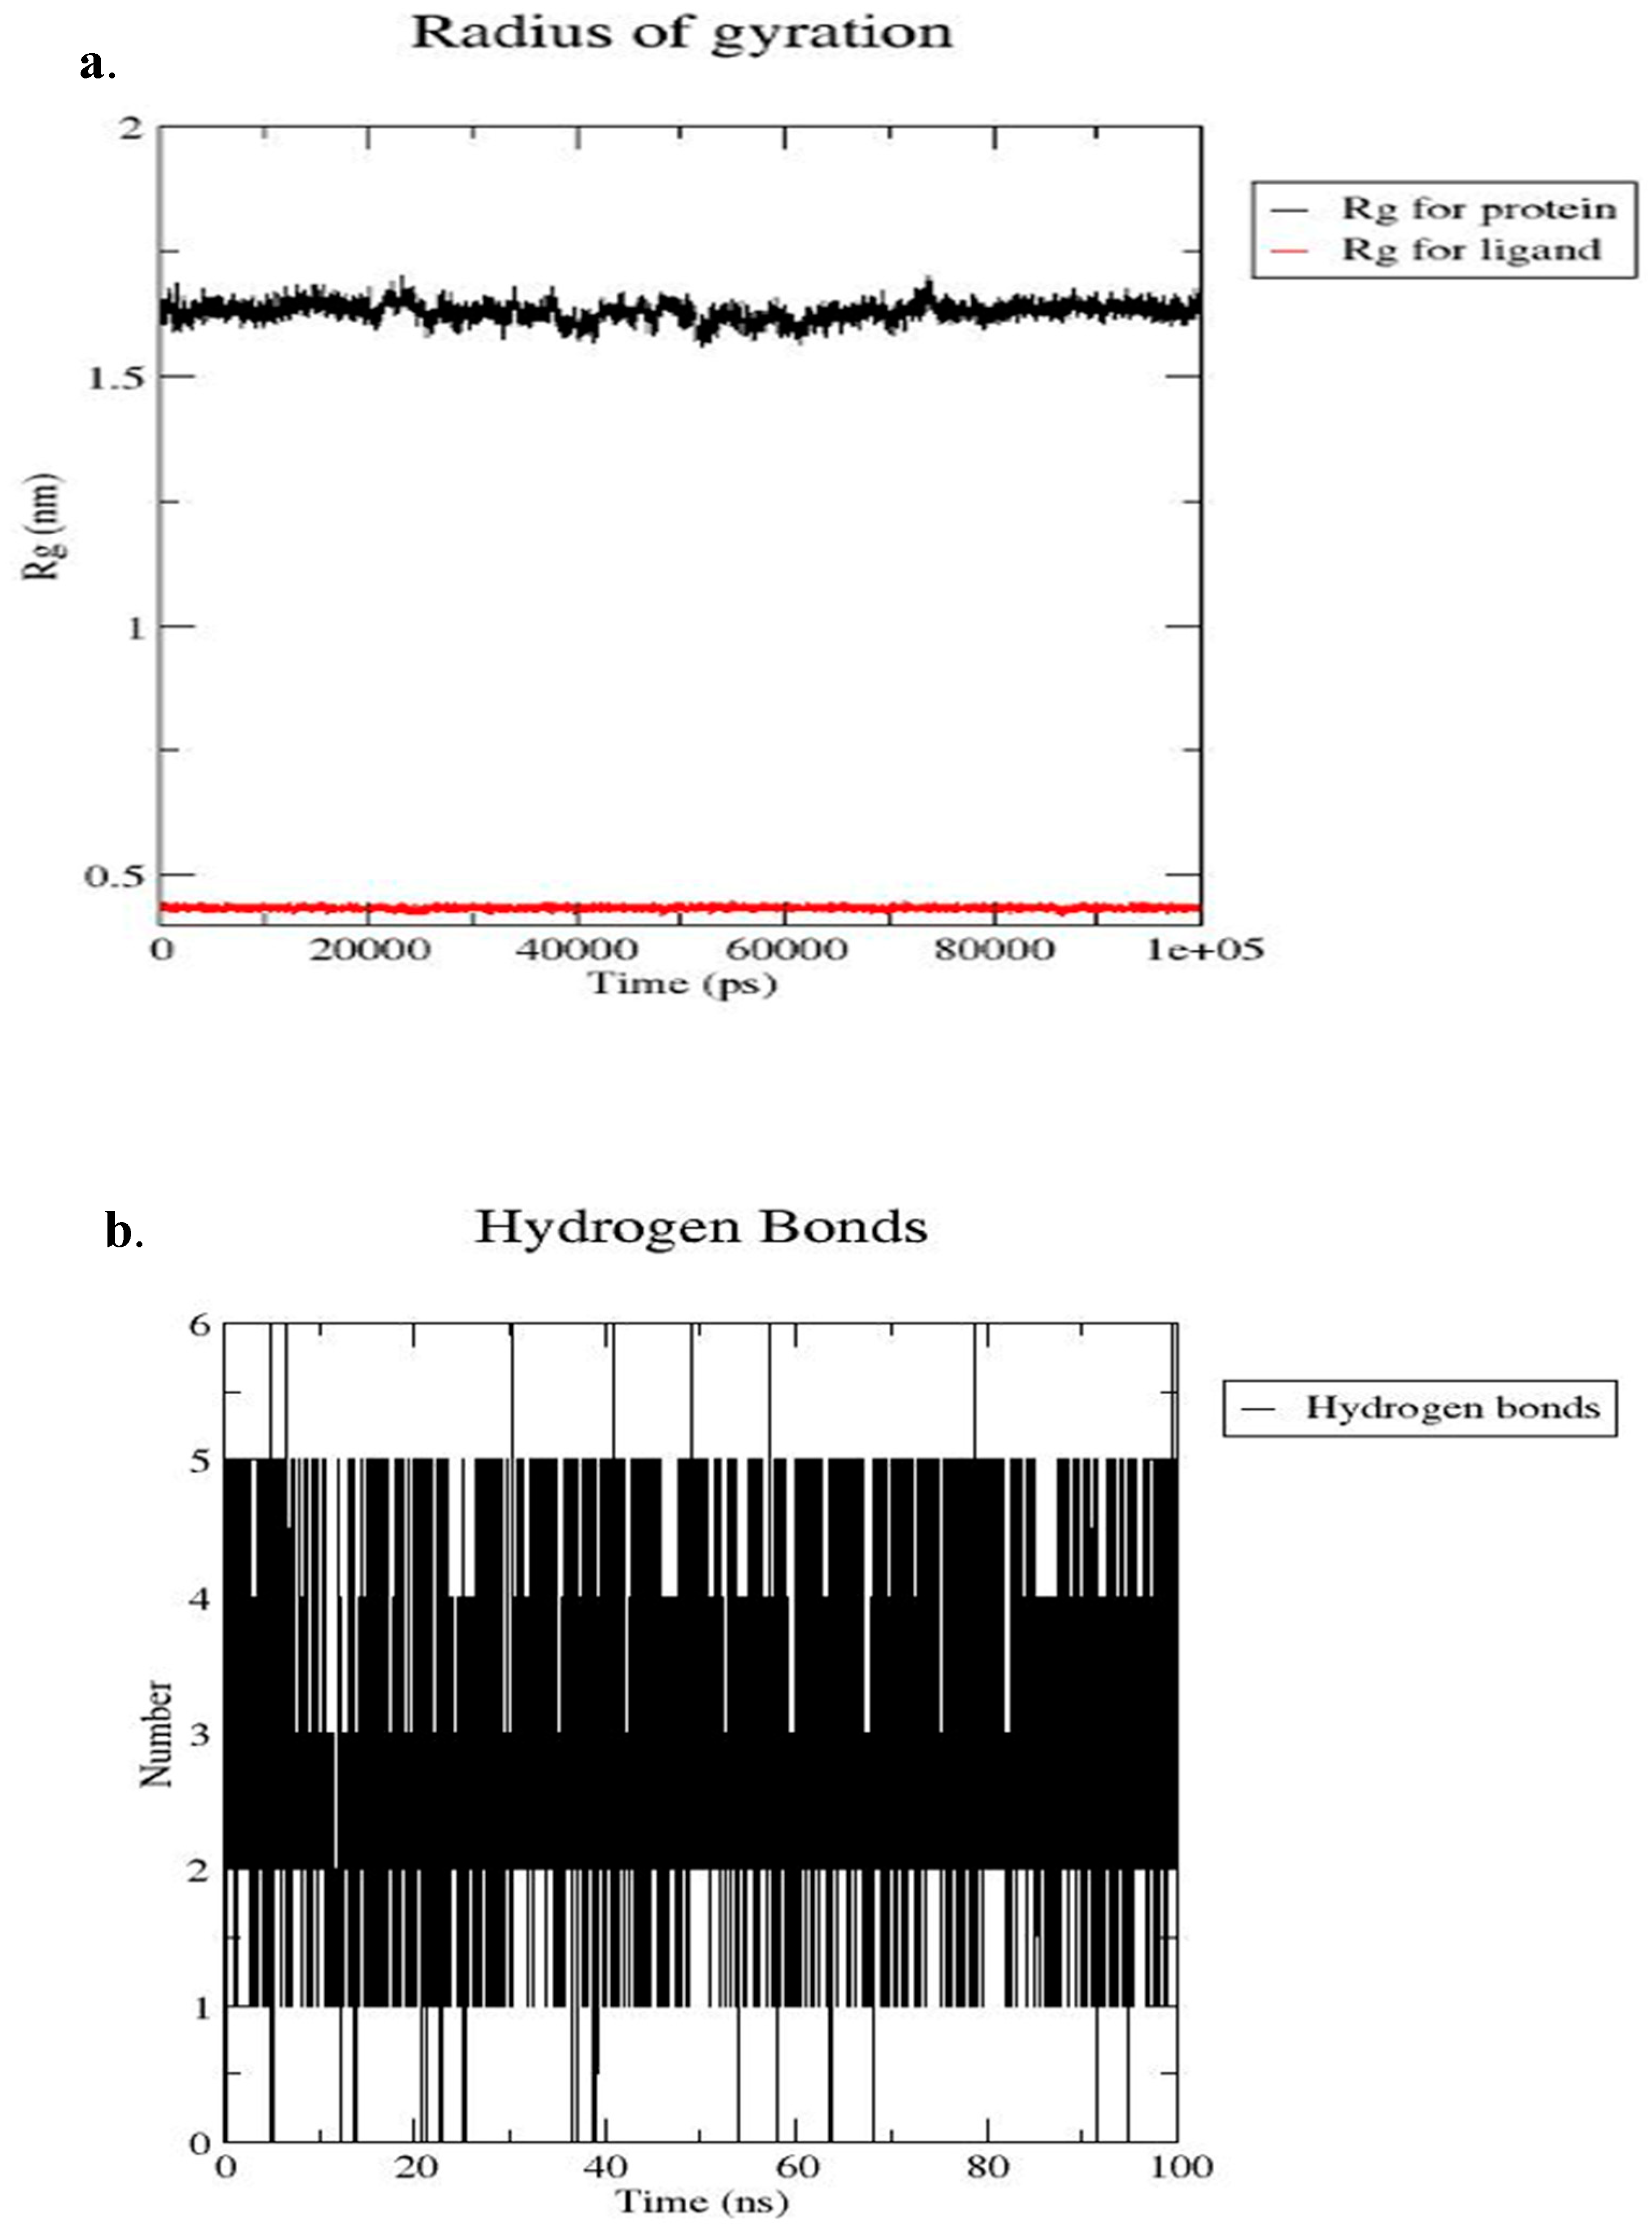
Figure 12 presents the radius of gyration and the number of hydrogen bond interactions between CHEMBL2216838 and the active site of PfBDP1 (PDB ID: 7M97). The Rg-time fluctuations for PfBDP1 remained within an acceptable range of 1.50 nm to 1.75 nm, indicating a relatively stable protein structure. In contrast, the Rg-time fluctuations for CHEMBL2216838 were observed between 0.00 nm and 0.50 nm (Figure 12a). A higher Rg value suggests a loosely packed protein conformation, often associated with decreased flexibility and increased stability.

Figure 12.
(a) Radius of gyration (Rg) of the PfBDP1–CHEMBL2216838 complex over the simulation period, and (b) number of hydrogen bonds formed between PfBDP1 and CHEMBL2216838 throughout the 100 ns simulation.
Conversely, a lower Rg value indicates a more compact structure, which can enhance stability while reducing flexibility [28]. The stability and specificity of ligand binding are significantly influenced by hydrogen bonds and hydrophobic interactions. Throughout the 100 ns MD simulation time, four hydrogen bond interactions were observed between CHEMBL2216838 and the active site residues of PfBDP1 (Figure 12b). These interactions include three conventional hydrogen bonds with ILE355, MET378, and ASN413, and one carbon–hydrogen bond interaction with CYS409.
These findings indicate that CHEMBL2216838 forms stable interactions with PfBDP1, contributing to its binding affinity and potential inhibitory activity against the protein.
2.3. Validation of MCL Through Biological Assays
2.3.1. Parasite-Inhibitory Activity
MCL was evaluated in an in vivo parasite-inhibitory assay. The results showed a significant reduction in parasitemia, with an EC50 of 37.32 µM on day 3 and 22.26 µM on day 7, confirming its dose-dependent antiplasmodial activity [29].
2.3.2. Combination Therapy
When administered in combination with artemisinin as a single oral dose over 3 days, MCL achieved a parasite clearance rate of 48%, outperforming both artemisinin alone (34.41%) and chloroquine alone (37.87%). This suggests potential synergistic or additive effects with established antimalarial agents [29].
2.3.3. Target Validation by Gene Expression Analysis
Quantitative RT-PCR analysis demonstrated that MCL significantly downregulated the expression of PfAP2-I and PfBDP1 by 8.08-fold and 79.07-fold, respectively, at a maximum tested concentration of 50 µM. This supports the computational prediction that these transcriptional regulators are plausible molecular targets of the compound [30].
2.3.4. Acute Toxicity
An acute oral toxicity study of MCL conducted over 14 days revealed only mild to moderate toxicity at all tested doses, suggesting an acceptable preliminary safety profile [29].
3. Discussion
Considering the declining effectiveness of current antimalarial therapies and the increasing incidence of drug-resistant Plasmodium strains [2,31], there is an urgent need to adopt novel strategies for drug discovery. These strategies include the repurposing and optimization of existing compounds, the identification of new molecular targets, and the development of innovative small molecule inhibitors [32].
This present study carried out a year-long epidemiological investigation (August 2021 to August 2022) among malaria-infected individuals in a high-transmission region of Nigeria. Although the overall transmission rate was relatively modest at 12.24%, seasonal variation was evident, with a substantial rise during the rainy season (59.17%). This seasonal pattern highlights persistent malaria transmission in the study location.
Given the role of parasite genetic variability in contributing to artemisinin resistance and the therapeutic failures of artemisinin-based combination therapies (ACTs), analyzing genetic mutations in clinical isolates is critical. In this study, the sequencing of the PfBDP1 gene revealed no polymorphisms, as all isolates maintained the wild-type alleles. This genetic conservation suggests that PfBDP1 may serve as a stable and viable target for future drug development.
Building on these findings, this study advanced computational drug discovery approaches aimed at targeting PfBDP1. Through pharmacophore modeling of a vast molecular database and virtual screening of 1785 small molecule inhibitors against the active site of PfBDP1 (PDB ID: 7M97), several promising candidates were identified. From this pool, nine top-performing compounds emerged, which were subsequently refined to six based on detailed post-screening evaluations. Among these, CHEMBL2216838 stood out as the most promising lead compound, demonstrating superior binding affinity and pharmacokinetic potential, thus warranting further investigation in downstream drug development efforts.
CHEMBL2216838 exhibited a high binding affinity of −9.9 kcal/mol to the active site of PfBDP1. Additionally, it demonstrated better physicochemical and pharmacokinetic properties while posing a lower toxicity risk profile compared to that of other molecules, including bromosporine (a reference inhibitor) and chloroquine (a standard antimalarial drug).
Post-screening analysis examined physicochemical properties and pharmacokinetic parameters such as gastrointestinal (GI) absorption, blood–brain barrier permeability, and interactions with CYP 450 enzymes, using SwissADME [33]. All nine molecules displayed high gastrointestinal absorption but were unable to permeate the blood–brain barrier.
The SwissADME BOILED-Egg plot of the nine best-hits predicted that P-glycoprotein could actively efflux the molecules out of the central nervous system, potentially reducing or nullifying their effectiveness. Given P-glycoprotein’s significant role in ADMET properties and drug transport, several scientific studies have been conducted to better understand its interactions with the substrates of drug molecules. The activity of this efflux pump is known to influence drug pharmacokinetics and contribute to multidrug resistance [34].
Drug-metabolizing enzymes play a vital role in drug clearance by converting lipophilic molecules into more water-soluble metabolites, which are then excreted through the kidneys or bile [35,36]. The inhibition or activation of these enzymes can lead to clinically significant drug–drug interactions [35]. Patients suffering from infectious and inflammatory diseases may be particularly vulnerable to adverse drug reactions and altered drug metabolism due to such interactions [37].
Cytochrome P450 (CYP450) enzymes are essential for metabolizing small molecules, aiding in tissue and organ protection. Among the various isoforms, CYP1A2, CYP2C19, CYP2C9, and CYP2D6 are among the five most crucial for drug metabolism [36,38]. CYP1A2 catalyzes the hydroxylation of aromatic amines and other oxidative reactions [39]. Due to its high expression in the liver, CYP1A2 is involved in metabolizing several therapeutically significant drugs and endogenous compounds [39,40]. Drug interactions involving CYP1A2 often result from the reversible or irreversible inhibition of its active site by small molecule inhibitors.
CYP2C9 plays a crucial role in metabolizing weakly acidic compounds, including warfarin, nonsteroidal anti-inflammatory drugs (NSAIDs), and endogenous substances such as steroids and arachidonic acid [41,42]. Meanwhile, CYP2C19 is responsible for metabolizing proton pump inhibitors (PPIs) and activating the anticoagulant clopidogrel into its active form [43]. This enzyme also contributes to the metabolism of certain antidepressants [44].
CYP2D6 is involved in metabolizing a wide range of clinically significant drugs from various therapeutic classes, accounting for approximately 15–25% of all prescribed medications, despite its relatively low expression in the liver [45]. It is highly susceptible to inhibition by numerous compounds, even those that are not its direct substrates, due to their strong binding affinity to the enzyme [46]. Some of these inhibitors are potent enough to alter a patient’s metabolic phenotype, a phenomenon known as phenocopying. The structure–activity relationships of CYP2D6 substrates and inhibitors have been instrumental in the development of pharmacophore models [47].
CHEMBL2216838 was predicted to inhibit CYP1A2, CYP2C19, and CYP2D6, but not CYP2C9, which is essential for metabolizing the NSAIDs commonly used to treat malaria symptoms. Lipophilicity, measured as the consensus LogP value, is a key property in drug development. To improve prediction accuracy, multiple methods (iLOGP, XLOGP3, WLOGP, MLOGP, and SILICOS-IT) were used to assess the compound’s lipophilicity [48]. CHEMBL2216838 exhibited consensus LogP values below five, suggesting optimal absorption and efficient penetration through cell membranes.
The OSIRIS Property Explorer tool was employed to predict solubility, drug-likeness, drug score, and potential toxicity [49]. Solubility is a key factor in drug development, affecting formulation, handling, absorption, and the delivery of active molecules at low pharmacological doses [50]. According to OSIRIS Property Explorer, CHEMBL2216838 exhibited a high solubility value of −3.91, surpassing that of chloroquine (−4.06).
Drug-likeness is an important measure used to assess whether a compound possesses the properties necessary for an active oral drug. It is a delicate balancing act between molecular characteristics and structural features that dictates if a new molecule is like a known drug [51]. The Lipinski rule of five serves as a widely accepted guideline in this evaluation, stipulating that a drug-like molecule should have a molecular weight below 500 g/mol, fewer than 10 hydrogen bond acceptors, fewer than 5 hydrogen bond donors, fewer than 10 rotatable bonds, and a polar surface area (PSA) below 140 Å. A positive drug-likeness value suggests that a compound contains structural features commonly found in commercial drugs [52]. CHEMBL2216838 demonstrated the highest drug-likeness score of 8.60, outperforming the standard drug chloroquine (7.39).
Drug score is another critical parameter in drug assessment. It integrates multiple factors, such as the partition coefficient (cLogP), solubility (cLogS), molecular weight, drug-likeness, and toxicity risk [53]. The drug score ranges from no risk (0.81–1.0) to medium risk (0.61–0.8) to high risk (less than 0.6). A higher drug score increases the chances of a molecule becoming a candidate [54,55], and CHEMBL2216838 achieved a drug score of 0.78, categorizing it within the medium-risk range. Furthermore, toxicity assessments indicated that CHEMBL2216838 and seven other compounds exhibited low risks of mutagenicity, tumorigenicity, irritation, and reproductive toxicity.
To evaluate the stability of the binding interaction between CHEMBL2216838 and the active site residues of PfBDP1, molecular dynamics (MD) simulations were performed [53]. Stability is crucial for the ligand’s ability to effectively inhibit PfBDP1 [56]. Throughout the simulation period, the root mean square deviation (RMSD) and root mean square fluctuation (RMSF) of both the protein and the ligand were monitored in order to assess the structural stability and binding conformation.
The RMSD value quantifies changes in protein conformation by comparing two sets of atomic coordinates over time [57]. RMSF further identifies which structural elements exhibit the most deviation from their mean positions. RMSF represents the average displacement of a particle, such as a protein residue, relative to a reference position [57].
PfBDP1 RMSD fluctuated consistently between 0.8 and 4.0Å after first rising from 0.00. For CHEMBL2216838, the RMSD values ranged between 0.4 and 2.0 Å, which were significantly lower than those of PfBDP1. This indicates that CHEMBL2216838 remains stable within the active site, maintaining a single binding mode. The RMSF analysis provided insights into the fluctuations in amino acid residues and ligand atoms, highlighting their role in binding and interaction entropy. The ‘Fit Ligand on Protein’ line displays the CHEMBL2216838 RMSF as being between 0.5 and 1.5Å, with respect to PfBDP1.
The torsional analysis examined the conformational strain experienced by CHEMBL2216838 when maintaining a protein-bound state. During the simulation, all rotatable bonds in CHEMBL2216838 underwent conformational adjustments, as reflected in the torsion plot spanning the simulation timeframe (0.00–100.00 sec). Furthermore, molecular dynamics confirmed a stable hydrogen bond interaction between CHEMBL2216838 and the conserved Asn413 residue of PfBDP1, aligning with findings from prior docking studies [22].
Although the in silico inhibitory study is primarily theoretical and requires experimental data to confirm the presented hypotheses, our earlier experimental findings showed that MCL significantly reduced parasitemia and downregulated PfBDP1 expression. These findings lend credence to our in silico predictions and highlight the compound’s potential antimalarial mechanism of action.
Another potential limitation of this study involves an engineered GLU458SER mutation in the crystal structure of PfBDP1 (PDB ID: 7M97). However, this mutation is located outside of the active ZA flexible loop region, suggesting that it is unlikely to impact PfBDP1’s structural integrity or function. Additionally, both glutamine (wild-type) and serine (mutant) are neutral polar hydrophilic amino acids, further indicating that the mutation may not significantly alter the protein’s behavior.
Collectively, our data reinforce the hypothesis that PfBDP1 plays a critical regulatory role in erythrocyte invasion and parasite proliferation. The gene’s high conservation and functional relevance suggest that it is a promising antimalarial target.
4. Materials and Methods
4.1. Ex Vivo Study
4.1.1. Study Location and Participant Recruitment
This study was carried out in Ota, located in Ogun State, southwestern Nigeria. The parasitological and epidemiological assessments took place from August 2021 to August 2022, encompassing both the wet season (April to October) and the dry season (November to March). All procedures followed the established protocols. The participants included malaria-positive individuals who gave informed consent prior to inclusion.
The inclusion criteria for this study comprised individuals of all age groups with confirmed Plasmodium falciparum infection and parasitemia levels of at least 2000 parasites/µL within 48 h of sample collection. The exclusion criteria comprised individuals who had received antimalarial therapy within the previous two weeks, had mixed infections (e.g., P. falciparum, P. vivax, or P. ovale), parasitemia below 2000 parasites/µL, or had coexisting health conditions such as sickle cell disease. Ethical clearance was obtained from the Covenant Health Research Ethics Committee (CHREC) under the reference number CHREC/081/2021.
4.1.2. Sample Collection and Processing
Blood samples (2 mL) were collected from symptomatic malaria patients and examined using Giemsa-stained thick and thin blood films under a light microscope by a trained phlebotomist. The samples were preserved under cold chain conditions and immediately transported to the Molecular Biology Laboratory at Covenant University. For verification, the presence of Plasmodium spp. was reconfirmed using polymerase chain reaction (PCR).
4.1.3. Molecular Procedure
Genomic DNA was isolated from the malaria-positive samples using the Zymo Research® DNA Extraction Kit (Zymo Research Corporation, Irvine, CA, USA), following the manufacturer’s guidelines. Sample purity and concentration were assessed with a NanoDrop™ One Microvolume UV-Vis Spectrophotometer (Thermo Fisher Scientific, Waltham, MA, USA). Further molecular testing included the detection of single-nucleotide polymorphisms (SNPs). The confirmation of P. falciparum infection was achieved through MSP2 gene (185 bp) amplification using species-specific PCR primers.
4.1.4. DNA Amplification and Sequencing
The amplification of the PfBDP1 gene was performed on a Mastercycler X50s PCR system (Eppendorf, Hamburg, Germany) using an initial denaturation at 94 °C for 5 min, followed by 40 cycles of denaturation at 94 °C for 40 s, gene-specific annealing for 1 min, extension at 60 °C for 1 min, and a final elongation step at 60 °C for 7 min. The reaction volume was 25 μL. The products were analyzed via 1.5% agarose gel electrophoresis, stained with 4 μL ethidium bromide, and run at 100 V/cm for 1 h. Gel images were captured using the Bio-Rad Gel Doc™ XR+ system and quantified with Image Lab™ software #1709690. Band intensities were compared against 100 bp and 1000 bp DNA ladder markers. Sequencing was outsourced to Inqaba Biotec West Africa (Oyo, Nigeria), and the resulting sequences were aligned to the reference Pf3D7 strain for the PfBDP1 gene using Geneious Prime 2022.1 (NCBI database).
4.2. In Silico Study
4.2.1. Protein Structure Retrieval and Alignment
The crystal structures of PfBDP1 (PDB ID: 7M97) and PfGCN5 (PDB ID: 5TPX) are available on the Protein Data Bank (PDB) [23] and were retrieved from the database. PfGCN5 histone acetyltransferase (HAT) (PDB ID: 5TPX) is a homolog of PfBDP1 and has a crystal structure co-crystallized with a ligand (PubChem ID: 7H7) [17]; however, the PfBDP1 (PDB ID: 7M97) crystal structure is not co-crystallized with a ligand. Pymol (The PyMOL Molecular Graphics System, Version 1.2r3pre, Schrödinger, LLC.) was used to conduct a structural alignment between the crystal structure of PfBDP1 (PDB ID: 7M97) and PfGCN5 (PDB ID: 5TPX) to aid in the determination of the PfBDP1 (PDB ID: 7M97) active site.
4.2.2. Active Site Determination of PfBDP1
Three factors were considered when determining the active site of PfBDP1 used for the virtual screening analysis. The first is the amino acid residues reported from a previous docking study using the apo form of the PfBDP1 3D structure (PDB ID 3FKM). This study reported that amino acid residues ILE355A, PHE356A, LYS358A, VAL360A, ASP361A, TYR412A, ASN413A, and VAL419A are present in the active site of the apo form of the PfBDP1 3D structure (PDB ID: 3FKM) [22].
The second is the result of the amino acid sequence alignment between PfBDP1 and PfGCN5. Since PfGCN5 is a homolog of PfBDP1 and has been co-crystallized with a ligand, Clustal Omega [58] was used to align the amino acid sequences of PfBDP1 and PfGCN5 to determine the similar amino acid residues in the active site of both proteins. PDBsum [59] was used to visualize the similar amino acid residues present at the active site of both proteins.
The third is the result of active site prediction of PfBDP1 using the Computed Atlas of Surface Topography of Proteins (CASTp) 3.0, a web-based tool that describes and quantifies geometrical and topological characteristics of protein structures, such as surface pockets, internal cavities, and cross channels [60,61]. PfBDP1’s crystal structure was retrieved from PDB and was loaded onto the CASTp 3.0 Server. These three results were combined and used to decide on a suitable ligand binding pocket on PfBDP1’s (PDB ID: 7M97) active site.
4.2.3. Pharmacophore Modeling
The Pharmit server was utilized to construct a pharmacophore model based on the PfBDP1 crystal structure (PDB ID: 7M97) and a reference ligand [62]. Pharmit is an online platform comprising nine molecular databases containing millions of drug-like compounds that can be screened against specific proteins [63]. The server operates using a pharmacophore modeling approach combined with the AutoDock Vina scoring algorithm [30]. To develop the pharmacophore model, the PfBDP1 crystal structure and the reference ligand were uploaded to the Pharmit server. The model was generated by identifying key structural features of the reference ligand. A pharmacophore query feature was defined, specifying the extent to which a database molecule must align with the given molecular configuration. For a compound to be considered a match, its pharmacophore feature points must overlap with the corresponding spheres in the query. Increasing the feature radius enhances the likelihood of identifying matching molecules [63].
4.2.4. Preparation of the Protein and Ligands for Virtual Screening
The PfBDP1 crystal structure was designated as the receptor and prepared using Chimera software. This preparation involved structure minimization, the addition of Gasteiger charges, the incorporation of polar hydrogen atoms, the merging of non-polar hydrogen atoms, the removal of non-amino-acid residues, and the completion of any missing amino acid residues [64].
To facilitate molecular docking, OpenBabel was used to convert the receptor file from .pdb format to an AutoDock-compatible .pdbqt format. Similarly, PyRx was employed to convert ligand files from .sdf to .pdbqt format. Ligand preparation included charge assignment, conformer generation, and geometry optimization using AutoDockTools 4.2.6, which was subsequently used for screening simulations [65,66].
4.2.5. Virtual Screening
AutoDock Vina was used to conduct the virtual screening of potential hit molecules against the active site of PfBDP1 (PDB ID: 7M97) [67]. A grid box was defined around the active site residues with dimensions of 43.035 Å × 12.568 Å × 39.675 Å using a grid spacing of 0.375 Å. The grid was set with 60, 50, and 60 points along the x, y, and z axes, respectively. Following docking simulations, the nine best-hit compounds were selected based on their binding affinity to the PfBDP1 active site. Chloroquine was included as a reference drug due to its extensive use in in vitro and in vivo studies assessing malaria parasite inhibition.
4.2.6. Post-Screening Analysis
Post-screening analysis was conducted using Swiss ADME predictor [68], OSIRIS Property Explorer [69], and Discovery Studio [70]. The SwissADME predictor provided insights into the physicochemical properties, pharmacokinetics, oral bioavailability, water solubility, lipophilicity, and medicinal chemistry of the top selected hits, along with the reference ligand (bromosporine) and the standard drug (chloroquine) [68].
OSIRIS Property Explorer was utilized to assess drug-likeness, drug score, molecular weight, consensus lipophilicity (cLogP), total polar surface area (TPSA), solubility, and potential toxicity risks, including mutagenicity, tumorigenicity, irritation, and reproductive toxicity [71].
A lead molecule was selected based on high binding affinity, drug-likeness, drug score, favorable physicochemical properties, and low-risk toxicity properties. Discovery Studio was used to visualize the 2D and 3D bond interactions between the lead molecule and the active site of PfBDP1 [70].
4.2.7. Molecular Dynamics Simulation of the Lead Molecule and PfBDP1 Complex
Molecular dynamics (MD) simulations were performed to assess the stability of the best-hit molecule in complex with PfBDP1 using the GROMACS simulation package (version 5.1.4) and the CHARMM27 force field [72]. The SwissParam online tool was used to generate a molecular topology file compatible with CHARMM27, and an explicit water model was employed for solvation. The protein–ligand complex was immersed in a solvent environment, with Na+ ions replacing water molecules to ensure charge neutrality.
Following solvation, energy minimization was performed, followed by NVT and NPT equilibration over 5 ns. The V-rescale thermostat and Berendsen barostat were applied to maintain a temperature of 298 K and a pressure of 1 bar, respectively. The system then underwent a 100 ns MD simulation with a 2 fs time step per run. Long-range electrostatic interactions were managed using a 1 nm cutoff and the Smooth Particle Mesh Ewald (PME) method [73].
Post-simulation analysis was conducted using Visual Molecular Dynamics (VMD) software [74]. Structural stability and dynamics were evaluated by plotting the root mean square deviation (RMSD), root mean square fluctuation (RMSF) of the ligand, ligand torsion profile, radius of gyration (Rg), hydrogen bonding interactions, principal component analysis (PCA), and the dynamic cross-correlation map (DCCM). These analyses were performed using XMGRACE (version 5.1.19) and Bio3D on the Galaxy Europe platform [75].
4.3. Experimental Support for Computational Predictions
Computational and biological validation of 7-[(7-methoxy-4, 5-dihydro-1H-benzo [g] indazol-3-yl) carbonyl]-2-phenyl-5, 6, 7, 8-tetrahydropyrazolo [1, 5-a] pyrido [4, 3-d] Pyrimidin-9 (1H)-one (MCL) was previously conducted against PfAP2-I and PfBDP1 [29,30]. A summary of those results is presented in the Results Section to support the current computational findings.
5. Conclusions
This study makes a significant contribution to the ongoing search for novel antimalarial drug targets by providing both molecular and computational evidence for PfBDP1 as a promising therapeutic target. By demonstrating the conservation of the PfBDP1 gene in field isolates and identifying high-affinity small molecule inhibitors, particularly CHEMBL2216838, the research highlights a viable pathway for the development of next-generation antimalarial agents.
The use of integrated bioinformatics, virtual screening, and molecular dynamics simulations strengthens the predictive power of the findings and supports the structural and pharmacological relevance of PfBDP1 inhibition. The identification of CHEMBL2216838 as a lead compound with favorable binding affinity, drug-likeness, and safety profile, surpassing those of existing drugs like chloroquine, sets the stage for preclinical validation and further structure-based drug design efforts.
Given the persistent threat of drug-resistant malaria, these findings provide a foundational basis for expanding the antimalarial drug pipeline, offering hope for more effective, targeted, and safe therapies for populations at greatest risk, particularly in sub-Saharan Africa.
Author Contributions
Conceptualization and methodology: D.O.O. (David O. Oladejo) and T.M.D. Software, investigation, data curation, formal analysis, visualization, and writing—original draft preparation: D.O.O. (David O. Oladejo), G.O.O., and D.O.O. (Daniel O. Oladejo). Supervision, writing—review, and editing: T.M.D., O.O.O., and E.E.J.I. Project administration and funding acquisition: O.O.O., and E.E.J.I. All authors have read and agreed to the published version of the manuscript.
Funding
This study received research funding from the Covenant Applied Informatics and Communication Africa Centre of Excellence (CApIC-ACE) under the World Bank Africa Centre of Excellence (ACE Impact) Project.
Institutional Review Board Statement
Ethical approvals for the clinical and in vivo studies were approved by the Covenant Health Research Ethics Committee (approval numbers: CHREC /081/2021 and CHREC /131/2022).
Informed Consent Statement
Informed consent was obtained from all subjects involved in the ex vivo study.
Data Availability Statement
The raw data supporting the conclusions of this article will be made available by the authors on request.
Acknowledgments
We appreciate the management of ACE Medicare Clinics Ota, Ogun state, Nigeria, for providing the necessary support in obtaining the clinical blood samples used in this study.
Conflicts of Interest
The authors declare no conflict of interest.
Abbreviations
| PfBDP1 | Plasmodium falciparum bromodomain protein 1 |
| PfGCN5 | Plasmodium falciparum general control non-depressible protein 5 |
| RBC | Red blood cell |
| PDB | Protein data bank |
| RMSD | Root mean square deviation |
| RMSF | Root mean square fluctuation |
References
- World Health Organization (WHO). World Malaria Report 2023; World Health Organization: Geneva, Switzerland, 2023. [Google Scholar]
- World Health Organization (WHO). World Malaria Report 2022; World Health Organization: Geneva, Switzerland, 2022. [Google Scholar]
- Suresh, N.; Haldar, K. Mechanisms of artemisinin resistance in Plasmodium falciparum malaria. Curr. Opin. Pharmacol. 2018, 42, 46. [Google Scholar] [CrossRef]
- Walters, H.; Temesvari, L. Target acquired: Transcriptional regulators as drug targets for protozoan parasites. Int. J. Parasitol. 2021, 51, 599–611. [Google Scholar] [CrossRef]
- Reid, A.J.; Talman, A.M.; Bennett, H.M.; Gomez, A.R.; Sanders, M.J.; Illingworth, C.R.J.; Billker, O.; Berriman, M.; Lawniczak, M.K.N. Single-cell RNA-seq reveals hidden transcriptional variation in malaria parasites. elife 2018, 7, e33105. [Google Scholar] [CrossRef] [PubMed]
- Duffy, M.F.; Selvarajah, S.A.; Josling, G.A.; Petter, M. Epigenetic regulation of the Plasmodium falciparum genome. Brief Funct Genomics 2014, 13, 203–216. [Google Scholar] [CrossRef] [PubMed]
- Quinn, J.E.; Jeninga, M.D.; Limm, K.; Pareek, K.; Meißgeier, T.; Bachmann, A.; Duffy, M.F.; Petter, M. The Putative Bromodomain Protein PfBDP7 of the Human Malaria Parasite Plasmodium falciparum Cooperates with PfBDP1 in the Silencing of Variant Surface. Front. Cell. Dev. Biol. 2022, 10, 816558. [Google Scholar] [CrossRef] [PubMed]
- Josling, G.A.; Selvarajah, S.A.; Petter, M.; Duffy, M.F. The role of bromodomain proteins in regulating gene expression. Genes 2012, 3, 320–343. [Google Scholar] [CrossRef]
- Zaware, N.; Zhou, M. Bromodomain biology and drug discovery. Nat. Struct. Mol. Biol. 2019, 26, 870–879. [Google Scholar] [CrossRef]
- Josling, G.A.; Petter, M.; Oehring, S.C.; Gupta, A.P.; Dietz, O.; Wilson, D.W.; Schubert, T.; Längst, G.; Gilson, P.R.; Crabb, B.S.; et al. A Plasmodium falciparum bromodomain protein regulates invasion gene expression. Cell Host Microbe 2015, 17, 741–751. [Google Scholar] [CrossRef]
- Aurrecoechea, C.; Brestelli, J.; Brunk, B.P.; Dommer, J.; Fischer, S.; Gajria, B.; Gao, X.; Gingle, A.; Grant, G.; Harb, O.S.; et al. PlasmoDB: A functional genomic database for malaria parasites. Nucleic Acids Res. 2009, 37, D539–D543. [Google Scholar] [CrossRef]
- Singh, A.K.; Phillips, M.; Alkrimi, S.; Tonelli, M.; Boyson, S.P.; Malone, K.L.; Nix, J.C.; Glass, K.C. Structural insights into acetylated histone ligand recognition by the BDP1 bromodomain of Plasmodium falciparum. Int. J. Biol. Macromol. 2022, 223, 316–326. [Google Scholar] [CrossRef]
- Rawat, M.; Malhotra, R.; Shintre, S.; Pani, S.; Karmodiya, K. Role of PfGCN5 in nutrient sensing and transcriptional regulation in Plasmodium falciparum. J. Biosci. 2020, 45, 11. [Google Scholar] [CrossRef]
- Santos, J.M.; Josling, G.; Ross, P.; Joshi, P.; Orchard, L.; Campbell, T.; Schieler, A.; Cristea, I.M.; Llinás, M. Red blood cell invasion by the malaria parasite is coordinated by the PfAP2-I transcription factor. Cell Host Microbe 2017, 21, 731.e10–741.e10. [Google Scholar] [CrossRef]
- Jeffers, V.; Yang, C.; Huang, S.; Sullivan, W.J. Bromodomains in Protozoan Parasites: Evolution, Function, and Opportunities for Drug Development. Microbiol. Mol. Biol. Rev. 2017, 81, e00047-16. [Google Scholar] [CrossRef]
- Toenhake, C.G.; Fraschka, S.A.-K.; Vijayabaskar, M.S.; Westhead, D.R.; van Heeringen, S.J.; Bártfai, R. Chromatin accessibility-based characterization of the gene regulatory network underlying Plasmodium falciparum blood-stage development. Cell Host Microbe 2018, 23, 557–569. [Google Scholar] [CrossRef]
- Glass, K.; Singh, A.; Vulikh, M.; Phillips, M.; Tonelli, M.; Patel, T.; Demeler, B.; Nix, J. Plasmodium falciparum Bromodomain Protein 1 (PfBDP1): A master regulator of red blood cell invasion genes. Struct. Dyn. 2025, 12 (Suppl. S2), A399. [Google Scholar] [CrossRef]
- Chung, C.W. Small molecule bromodomain inhibitors: Extending the druggable genome. Prog. Med. Chem. 2012, 51, 1–55. [Google Scholar] [CrossRef] [PubMed]
- Moustakim, M.; Clark, P.G.; Trulli, L.; Fuentes de Arriba, A.L.; Ehebauer, M.T.; Chaikuad, A.; Murphy, E.J.; Mendez-Johnson, J.; Daniels, D.; Hou, C.D.; et al. Discovery of a PCAF Bromodomain Chemical Probe. Angew. Chem. Int. Ed. 2017, 56, 827–831. [Google Scholar] [CrossRef]
- Amann, M.; Warstat, R.; Rechten, K.K.; Theuer, P.; Schustereder, M.; Clavey, S.; Breit, B.; Einsle, O.; Hügle, M.; Petter, M.; et al. A novel inhibitor against the Bromodomain Protein 1 of the malaria pathogen Plasmodium falciparum. ChemMedChem 2025, 20, e202500024. [Google Scholar] [CrossRef]
- Chen, L.; Yap, J.L.; Yoshioka, M.; Lanning, M.E.; Fountain, R.N.; Raje, M.; Scheenstra, J.A.; Strovel, J.W.; Fletcher, S. BRD4 Structure-Activity Relationships of Dual PLK1 Kinase/BRD4 Bromodomain Inhibitor BI-2536. ACS Med. Chem. Lett. 2015, 6, 764–769. [Google Scholar] [CrossRef]
- Chua, M.J.; Robaa, D.; Skinner-Adams, T.S.; Sippl, W.; Andrews, K.T. Activity of bromodomain protein inhibitors/binders against asexual-stage Plasmodium falciparum parasites. Int. J. Parasitol. Drugs Drug Resist. 2018, 8, 189–193. [Google Scholar] [CrossRef]
- Filippakopoulos, P.; Knapp, S. Targeting bromodomains: Epigenetic readers of lysine acetylation. Nat. Rev. Drug Discov. 2014, 13, 337–356. [Google Scholar] [CrossRef] [PubMed]
- Brogi, S.; Ramalho, T.C.; Kuca, K.; Medina-Franco, J.L.; Valko, M. Editorial: In silico Methods for Drug Design and Discovery. Front. Chem. 2020, 8, 612. [Google Scholar] [CrossRef]
- Vardhan, S.; Sahoo, S. In silico ADMET and molecular docking study on searching potential inhibitors from limonoids and triterpenoids for COVID-19. Comput. Biol. Med. 2020, 124, 103936. [Google Scholar] [CrossRef]
- Lipinski, C.A.; Lombardo, F.; Dominy, B.W.; Feeney, P.J. Experimental and computational approaches to estimate solubility and permeability in drug discovery and development settings. Adv. Drug Deliv. Rev. 2012, 64, 4–17. [Google Scholar] [CrossRef]
- Veber, D.F.; Johnson, S.R.; Cheng, H.-Y.; Smith, B.R.; Ward, K.W.; Kopple, K.D. Molecular properties that influence the oral bioavailability of drug candidates. J. Med. Chem. 2002, 45, 2615–2623. [Google Scholar] [CrossRef] [PubMed]
- Lobanov M, Bogatyreva N, Galzitskaya O. Radius of gyration as an indicator of protein structure compactness. Mol. Biol. 2008, 42, 623–628. [CrossRef]
- Oladejo, D.O.; Dokunmu, T.M.; Tebamifor, M.E.; Omunagbe, M.B.; Okafor, E.O.; Iweala, E.E. Acute oral toxicity and antimalarial studies of 7-[(7-methoxy-4,5-dihydro-1H-benzo[g]indazol-3-yl) carbonyl]-2-phenyl-5,6,7,8-tetrahydropyrazolo [1,5-a] pyrido [4,3-d] pyrimidin-9 (1H)-one in mouse models. Sci. Afr. 2024, 24, e02194. [Google Scholar] [CrossRef]
- Oladejo, D.O.; Anzaku, D.O.; Mamudu, C.O.; Elugbadebo, T.; Dokunmu, T.M.; Adebiyi, E.F.; Iweala, E.E. Gene expression levels and inhibitory effect of 7-[(7-methoxy-4,5-dihydro-1H-benzo[g]indazol-3-yl) carbonyl]-2-phenyl-5,6,7,8-tetrahydropyrazolo [1,5-a] pyrido [4,3-d] Pyrimidin-9 (1H)-one (MCL) against AP2-I and BDP1 in malaria experimental models. Sci. Afr. 2024, 23, e02010. [Google Scholar] [CrossRef]
- Doshi, K.; Pandya, N.; Datt, M. In silico assessment of natural products and approved drugs as potential inhibitory scaffolds targeting aminoacyl-tRNA synthetases from Plasmodium. Biotech. 2020, 10, 470. [Google Scholar] [CrossRef]
- Malmquist, N.A.; Moss, T.A.; Mecheri, S.; Scherf, A.; Fuchter, M.J. Small-molecule histone methyltransferase inhibitors display rapid antimalarial activity against all blood stage forms in Plasmodium falciparum. Proc. Natl. Acad. Sci. USA 2012, 109, 16708–16713. [Google Scholar] [CrossRef]
- Daina, A.; Michielin, O.; Zoete, V. SwissADME: A free web tool to evaluate pharmacokinetics, drug-likeness and medicinal chemistry friendliness of small molecules. Sci Rep. 2017, 7, 42717. [Google Scholar] [CrossRef] [PubMed]
- Gombar, V.K.; Polli, J.W.; Humphreys, J.E.; Wring, S.A.; Serabjit-Singh, C.S. Predicting P-Glycoprotein Substrates by a Quantitative Structure-Activity Relationship Model. J. Pharm. Sci. 2004, 93, 957–968. [Google Scholar] [CrossRef]
- Makris, T.M.; Denisov, I.; Schlichting, I.; Sligar, S.G. Activation of molecular oxygen by cytochrome P450. In Cytochrome P450: Structure, Mechanism, and Biochemistry, 3rd ed.; Springer: Cham, Switzerland, 2005; pp. 149–182. [Google Scholar] [CrossRef]
- Di, L. The role of drug metabolizing enzymes in clearance. Expert Opin Drug Metab Toxicol. 2014, 10, 379–393. [Google Scholar] [CrossRef] [PubMed]
- Mallick, P.; Taneja, G.; Moorthy, B.; Ghose, R. Regulation of drug-metabolizing enzymes in infectious and inflammatory disease: Implications for biologics–small molecule drug interactions. Expert Opin Drug Metab. Toxicol. 2017, 13, 605–616. [Google Scholar] [CrossRef] [PubMed]
- Dong, D.; Wu, B.; Chow, D.; Hu, M. Substrate selectivity of drug-metabolizing cytochrome P450s predicted from crystal structures and in silico modeling. Drug Metab. Rev. 2012, 44, 192–208. [Google Scholar] [CrossRef]
- Zhou, S.-F.; Wang, B.; Yang, L.-P.; Liu, J.-P. Structure, function, regulation and polymorphism and the clinical significance of human cytochrome P450 1A2. Drug Metab. Rev. 2010, 42, 268–354. [Google Scholar] [CrossRef]
- Gunes, A.; Dahl, M.L. Variation in CYP1A2 activity and its clinical implications: Influence of environmental factors and genetic polymorphisms. Pharmacogenomics 2008, 9, 625–637. [Google Scholar] [CrossRef]
- Lee, C.R.; Goldstein, J.A.; Pieper, J.A. Cytochrome P450 2C9 polymorphisms: A comprehensive review of the in-vitro and human data. Pharmacogenetics Genom. 2002, 12, 251–263. [Google Scholar] [CrossRef]
- Lu, Y.; Cederbaum, A.I. CYP2E1 and oxidative liver injury by alcohol. Free. Radic. Biol. Med. 2008, 44, 723–738. [Google Scholar] [CrossRef]
- Boulenc, X.; Djebli, N.; Shi, J.; Perrin, L.; Brian, W.; Van Horn, R.; Hurbin, F. Effects of omeprazole and genetic polymorphism of CYP2C19 on the clopidogrel active metabolite. Drug Metab. Dispos. 2012, 40, 187–197. [Google Scholar] [CrossRef]
- Zanger, U.; Schwab, M. Cytochrome P450 enzymes in drug metabolism: Regulation of gene expression, enzyme activities, and impact of genetic variation. Pharmacol. Ther. 2013, 138, 103–141. [Google Scholar] [CrossRef] [PubMed]
- Stingl, J.C.; Brockmöller, J.; Viviani, R. Genetic variability of drug-metabolizing enzymes: The dual impact on psychiatric therapy and regulation of brain function. Mol. Psychiatry 2012, 18, 273–287. [Google Scholar] [CrossRef]
- Gelston, E.A.; Coller, J.K.; Lopatko, O.V.; James, H.M.; Schmidt, H.; White, J.M.; Somogyi, A.A. Methadone inhibits CYP2D6 and UGT2B7/2B4 in vivo: A study using codeine in methadone- and buprenorphine-maintained subjects. Br. J. Clin. Pharmacol. 2011, 73, 786–794. [Google Scholar] [CrossRef]
- Lewis, D.V.; Lake, B.; Dickins, M. Substrates of human cytochromes P450 from families CYP1 and CYP2: Analysis of enzyme selectivity and metabolism. Drug Metab. Drug Interact. 2004, 20, 111–142. [Google Scholar] [CrossRef] [PubMed]
- Datta, R.; Das, D.; Das, S. Efficient lipophilicity prediction of molecules employing deep-learning models. Chemom. Intell. Lab. Syst. 2021, 213, 104309. [Google Scholar] [CrossRef]
- Sander, T. OSIRIS property explorer. In Organic Chemistry Portal; Idorsia Pharmaceuticals Ltd.: Allschwil, Switzerland, 2001. [Google Scholar]
- Wu, C.; Benet, L. Predicting drug disposition via application of BCS: Transport/absorption/elimination interplay and development of a biopharmaceutics drug disposition classification system. Pharm. Res. 2005, 22, 11–23. [Google Scholar] [CrossRef] [PubMed]
- Ursu, O.; Rayan, A.; Goldblum, A.; Oprea, T.I. Understanding drug-likeness. WIREs Comput. Mol. Sci. 2011, 1, 760–781. [Google Scholar] [CrossRef]
- Egbert, M.; Whitty, A.; Keserű, G.M.; Vajda, S. Why Some Targets Benefit from beyond Rule of Five Drugs. J. Med. Chem. 2019, 62, 10005–10025. [Google Scholar] [CrossRef]
- Alonso, H.; Bliznyuk, A.; Gready, J. Combining docking and molecular dynamics simulations in drug design. Med. Res. Rev. 2006, 26, 531–568. [Google Scholar] [CrossRef]
- Behrouz, S.; Rad, M.N.S.; Shahraki, B.T.; Fathalipour, M.; Behrouz, M.; Mirkhani, H. Design, synthesis, and in silico studies of novel eugenyloxy propanol azole derivatives having potent antinociceptive activity and evaluation of their β-adrenoceptor blocking property. Mol. Divers. 2019, 23, 147–164. [Google Scholar] [CrossRef]
- Chodankar, R.S.; Mahajan, A.A. Characterization and In-silico toxicity prediction of degradation products of felbamate. Futur. J. Pharm. Sci. 2021, 7, 198. [Google Scholar] [CrossRef]
- Bowers, K.J.; Chow, E.; Xu, H.; Dror, R.O.; Eastwood, M.P.; Gregersen, B.A.; Klepeis, J.L.; Kolossvary, I.; Moraes, M.A.; Sacerdoti, F.D.; et al. Scalable algorithms for molecular dynamics simulations on commodity clusters. In Proceedings of the 2006 ACM/IEEE Conference on Supercomputing, New York, NY, USA, 11 November 2006. [Google Scholar] [CrossRef]
- Batut, B.; Hiltemann, S.; Bagnacani, A.; Baker, D.; Bhardwaj, V.; Blank, C.; Bretaudeau, A.; Brillet-Guéguen, L.; Čech, M.; Chilton, J.; et al. Community-Driven Data Analysis Training for Biology. Cell Syst. 2018, 6, 752–758.e1. [Google Scholar] [CrossRef] [PubMed]
- Sievers, F.; Higgins, D.G. Clustal Omega for making accurate alignments of many protein sequences. Protein Sci. 2018, 27, 135–145. [Google Scholar] [CrossRef] [PubMed]
- Laskowski, R.A.; Jabłońska, J.; Pravda, L.; Vařeková, R.S.; Thornton, J.M. PDBsum: Structural summaries of PDB entries. Protein Sci. 2018, 27, 129–134. [Google Scholar] [CrossRef] [PubMed]
- Tian, W.; Chen, C.; Lei, X.; Zhao, J.; Liang, J. CASTp 3.0: Computed atlas of surface topography of proteins. Nucleic Acids Res. 2018, 46, 363–367. [Google Scholar] [CrossRef]
- Dundas, J.; Ouyang, Z.; Tseng, J.; Binkowski, A.; Turpaz, Y.; Liang, J. CASTp: Computed atlas of surface topography of proteins with structural and topographical mapping of functionally annotated residues. Nucleic Acids Res. 2006, 34, W116–W118. [Google Scholar] [CrossRef]
- Sharma, A.; Yogavel, M.; Sharma, A. Structural and functional attributes of malaria parasite diadenosine tetraphosphate hydrolase. Sci Rep. 2016, 6, 19981. [Google Scholar] [CrossRef]
- Sunseri, J.; Koes, D. Pharmit: Interactive exploration of chemical space. Nucleic Acids Res. 2016, 44, 442–448. [Google Scholar] [CrossRef]
- Pettersen, E.F.; Goddard, T.D.; Huang, C.C.; Couch, G.S.; Greenblatt, D.M.; Meng, E.C.; Ferrin, T.E. UCSF Chimera—A visualization system for exploratory research and analysis. J. Comput. Chem. 2004, 25, 1605–1612. [Google Scholar] [CrossRef]
- Singh, I.; Mishra, S. Molecular docking analysis of Pyrimethamine derivatives with Plasmodium falciparum dihydrofolate reductase. Bioinformation 2018, 14, 232–235. [Google Scholar] [CrossRef]
- O’Boyle, N.M.; Banck, M.; James, C.A.; Morley, C.; Vandermeersch, T.; Hutchison, G.R. Open Babel: An Open chemical toolbox. J. Cheminform. 2011, 3, 33. [Google Scholar] [CrossRef] [PubMed]
- Morris, G.M.; Huey, R.; Lindstrom, W.; Sanner, M.F.; Belew, R.K.; Goodsell, D.S.; Olson, A.J. AutoDock4 and AutoDockTools4: Automated docking with selective receptor flexibility. J. Comput. Chem. 2009, 30, 2785–2791. [Google Scholar] [CrossRef] [PubMed]
- Lohidakshan, K.; Rajan, M.; Ganesh, A.; Paul, M.; Jerin, J. Pass and Swiss ADME collaborated in silico docking approach to the synthesis of certain pyrazoline spacer compounds for dihydrofolate reductase inhibition and antimalarial activity. Bangladesh J. Pharmacol. 2018, 13, 23–29. [Google Scholar] [CrossRef]
- Torres, E.; Moreno, E.; Ancizu, S.; Barea, C.; Galiano, S.; Aldana, I.; Monge, A.; Pérez-Silanes, S. New 1, 4-di-N-oxide-quinoxaline-2-ylmethylene isonicotinic acid hydrazide derivatives as anti-Mycobacterium tuberculosis agents. Bioorg. Med. Chem. Lett. 2011, 21, 3699–3703. [Google Scholar] [CrossRef]
- BIOVIA Discovery Studio Visualizer; Dassault Systems: San Diego, CA, USA, 2017.
- Mahato, S.; Singh, A.; Rangan, L.; Jana, C.K. Synthesis, in silico studies and in vitro evaluation for antioxidant and antibacterial properties of diarylmethylamines: A novel class of structurally simple and highly potent pharmacophore. Eur. J. Pharm. Sci. 2016, 88, 202–209. [Google Scholar] [CrossRef]
- Mollazadeh, S.; Sahebkar, A.; Shahlaei, M.; Moradi, S. Nano drug delivery systems: Molecular dynamic simulation. J. Mol. Liq. 2021, 332, 115823. [Google Scholar] [CrossRef]
- Safarizadeh, H.; Garkani-Nejad, Z. Molecular docking, molecular dynamics simulations and QSAR studies on some of 2-arylethenylquinoline derivatives for inhibition of Alzheimer’s amyloid-beta aggregation: Insight into mechanism of interactions and parameters for design of new inhibitors. J. Mol. Graph. Model. 2019, 87, 129–143. [Google Scholar] [CrossRef]
- Oduselu, G.O.; Afolabi, R.; Ademuwagun, I.; Vaughan, A.; Adebiyi, E. Structure-based pharmacophore modeling, virtual screening, and molecular dynamics simulation studies for identification of Plasmodium falciparum 5-aminolevulinate synthase inhibitors. Front. Med. 2023, 9, 1022429. [Google Scholar] [CrossRef]
- Grant, B.; Rodrigues, A.; Elsawy, K.; McCammon, J.; Caves, L. Bio3d: An R package for the comparative analysis of protein structures. Bioinformatics 2006, 22, 2695–2696. [Google Scholar] [CrossRef]

Disclaimer/Publisher’s Note: The statements, opinions and data contained in all publications are solely those of the individual author(s) and contributor(s) and not of MDPI and/or the editor(s). MDPI and/or the editor(s) disclaim responsibility for any injury to people or property resulting from any ideas, methods, instructions or products referred to in the content. |
© 2025 by the authors. Licensee MDPI, Basel, Switzerland. This article is an open access article distributed under the terms and conditions of the Creative Commons Attribution (CC BY) license (https://creativecommons.org/licenses/by/4.0/).