

What Insights Do Short-Maturity (7DTE) Return Predictive Regressions Offer about Risk Preferences in the Oil Market?


Abstract
1. Introduction
2. Forecasting Oil Futures Returns and Relation to the Literature
3. Data on Short Maturity (7DTE) Options and Oil Futures
4. Short Maturity (7DTE) Oil Futures Return Predictability
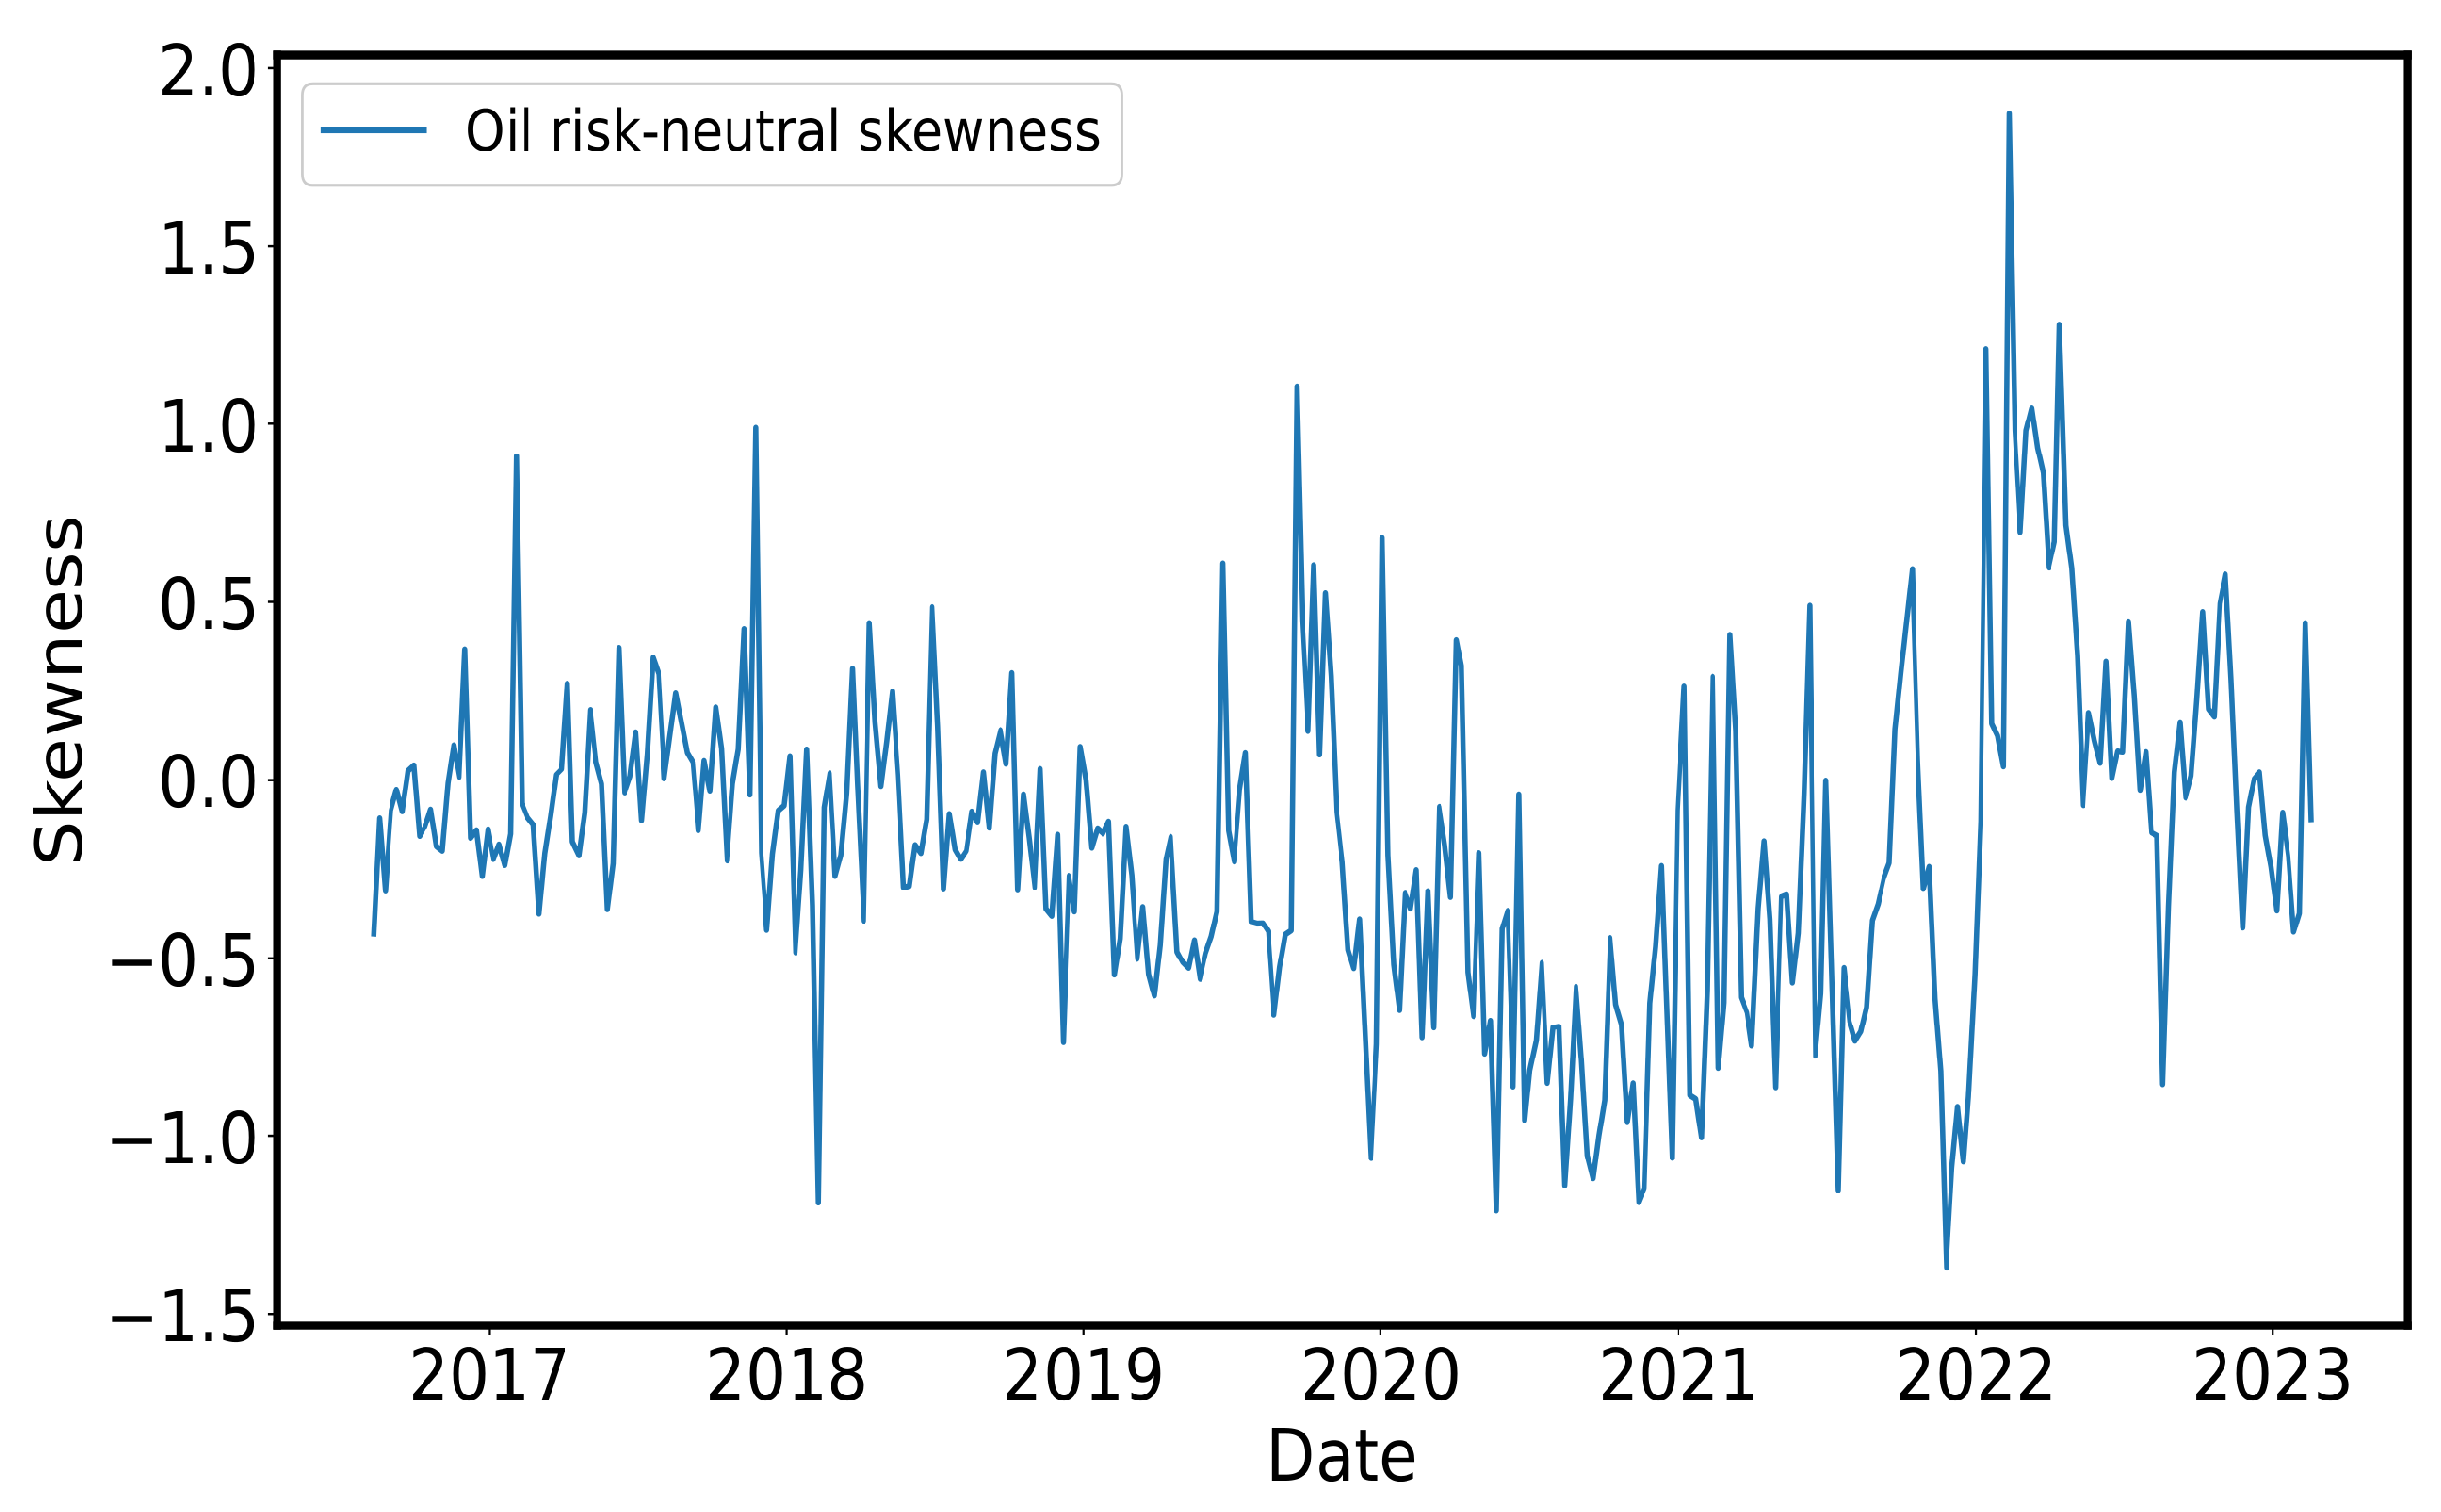
- skewness from weekly oil options (). This weekly variable is .
- excess kurtosis from weekly oil options (). This weekly variable is .
- Realized variance of oil futures returns (). This weekly variable is based on oil futures returns sampled at five-minute intervals.
- Realized skewness from oil futures returns (). This weekly variable is based on oil futures returns sampled at five-minute intervals.
- second equity return cumulant (). This is based on weekly S&P 500 equity index options prices. We use , with .
- third equity return cumulant (). This is based on weekly S&P 500 equity index options prices.
- fourth equity return cumulant (). This is based on weekly S&P 500 equity index options prices.
- skewness from weekly equity options (). This weekly variable is . We use S&P 500 equity index options prices.
- excess kurtosis from weekly equity options (). This weekly variable is . We use S&P 500 equity index options prices.
- Realized variance of equity futures returns (). This weekly variable is based on S&P 500 E-mini equity futures returns sampled at five-minute intervals.
- Realized skewness from equity futures returns (). This weekly variable is based on S&P 500 E-mini equity futures returns sampled at five-minute intervals.
- Growth rate of crude oil stock (). This is constructed based on EIA releases of petroleum status reports (https://www.eia.gov/petroleum/supply/weekly/, accessed on 14 May 2024). The underlying quantity is crude oil stock.
- Growth rate of crude oil production (). The underlying variable is domestic crude oil production (EIA estimates).
- Growth rate of crude oil imports (). The underlying variable is crude oil imports (EIA estimates).
- When the nested model is the historical average and is the full model, the values are 1.13% and 0.97% for WTI and the oil basket, respectively. These values suggest that using as a predictor adds to the predictive ability beyond using the historical average.
- When the alternative predictor is the nested model and the bivariate predictor constitutes the full model, the resulting values reported in Table 5 and Table 6 are all positive and range from 0.25% to 4.1%. These values align with the notion that has additional predicting power over the considered alternative predictor.
5. Risk Preferences and the Third Risk-Neutral Return Cumulant
5.1. Oil Futures Risk Premiums
5.2. Sign of (Theoretical Counterpart to ) in Theoretical Economies
6. Conclusions
Author Contributions
Funding
Institutional Review Board Statement
Informed Consent Statement
Data Availability Statement
Acknowledgments
Conflicts of Interest
References
- Alquist, R.; Kilian, L. What do we learn from the price of crude oil futures? J. Appl. Econom. 2010, 25, 539–573. [Google Scholar] [CrossRef]
- Alquist, R.; Kilian, L.; Vigfusson, R. Forecasting the price of oil. In Handbook of Economic Forecasting; Elsevier: Amsterdam, The Netherlands, 2013; Volume 2, pp. 427–507. [Google Scholar]
- Miao, H.; Ramchander, S.; Wang, T.; Yang, D. Influential factors in crude oil price forecasting. Energy Econ. 2017, 68, 77–88. [Google Scholar] [CrossRef]
- Funk, C. Forecasting the real price of oil—Time-variation and forecast combination. Energy Econ. 2018, 76, 288–302. [Google Scholar] [CrossRef]
- Cotter, J.; Eyiah-Donkor, E.; Poti, V. Commodity Futures Return Predictability and Intertemporal Asset Pricing; Working Paper; University College Dublin: Dublin, Ireland, 2020. [Google Scholar]
- Ellwanger, R.; Snudden, S. Forecasts of the real price of oil revisited: Do they beat the random walk? J. Bank. Financ. 2023, 154, 106962. [Google Scholar] [CrossRef]
- Conlon, T.; Cotter, J.; Eyiah-Donkor, E. Forecasting the price of oil: A cautionary note. J. Commod. Mark. 2024, 33, 100378. [Google Scholar] [CrossRef]
- Killian, L. Not all oil price shocks are alike: Disentangling demand and supply shocks in the crude oil market. Am. Econ. Rev. 2009, 99, 1053–1069. [Google Scholar] [CrossRef]
- Baumeister, C.; Hamilton, J. Structural interpretation of vector autoregressions with incomplete identification: Revisiting the role of oil supply and demand shocks. Am. Econ. Rev. 2019, 109, 1873–1910. [Google Scholar] [CrossRef]
- Routledge, B.; Seppi, D.; Spatt, C. Equilibrium forward curves for commodities. J. Financ. 2000, 55, 1297–1338. [Google Scholar] [CrossRef]
- Trolle, A.; Schwartz, E. Unspanned stochastic volatility and the pricing of commodity derivatives. Rev. Financ. Stud. 2009, 22, 4423–4461. [Google Scholar] [CrossRef]
- Chiang, I.; Hughen, K.; Sagi, J. Estimating Oil Risk Factors Using Information from Equity and Derivatives Markets. J. Financ. 2015, 70, 769–804. [Google Scholar] [CrossRef]
- Ready, R. Oil consumption, economic growth, and oil futures: The impact of long-run oil supply uncertainty on asset prices. J. Monet. Econ. 2018, 94, 1–26. [Google Scholar] [CrossRef]
- Christoffersen, P.; Jacobs, K.; Pan, X. The State Price Density Implied by Crude Oil Futures and Option Prices. Rev. Financ. Stud. 2022, 35, 1064–1103. [Google Scholar] [CrossRef]
- Gao, L.; Hitzemann, S.; Shaliastovich, I.; Xu, L. Oil Volatility Risk. J. Financ. Econ. 2022, 144, 456–494. [Google Scholar] [CrossRef]
- Kang, W.; Rouwenhorst, G.; Tang, K. A tale of two premiums: The role of hedgers and speculators in commodity futures markets. J. Financ. 2014, 75, 377–417. [Google Scholar] [CrossRef]
- Fernandez-Perez, A.; Frijns, B.; Fuertes, A.M.; Miffre, J. The skewness of commodity futures returns. J. Bank. Financ. 2018, 86, 143–158. [Google Scholar] [CrossRef]
- Mastroeni, L.; Mazzoccoli, A.; Quaresima, G.; Vellucci, P. Decoupling and recoupling in the crude oil price benchmarks: An investigation of similarity patterns. Energy Econ. 2021, 94, 105036. [Google Scholar] [CrossRef]
- Le, T.H.; Boubaker, S.; Bui, M.T.; Park, D. On the volatility of WTI crude oil prices: A time-varying approach with stochastic volatility. Energy Econ. 2023, 117, 106474. [Google Scholar] [CrossRef]
- Bakshi, G.; Madan, D. Spanning and Derivative-Security Valuation. J. Financ. Econ. 2000, 55, 205–238. [Google Scholar] [CrossRef]
- Bakshi, G.; Kapadia, N.; Madan, D. Stock Return Characteristics, Skew Laws, and the Differential Pricing of Individual Equity Options. Rev. Financ. Stud. 2003, 16, 101–143. [Google Scholar] [CrossRef]
- Prokopczuk, M.; Symeonidis, L.; Simen, C. Variance risk in commodity markets. J. Bank. Financ. 2017, 81, 136–149. [Google Scholar] [CrossRef]
- Ruan, X.; Zhang, J. Risk-neutral moments in the crude oil market. Energy Econ. 2018, 72, 583–600. [Google Scholar] [CrossRef]
- Wong, P. Predicting intraday crude oil returns with higher order risk-neutral moments. J. Commod. Mark. 2023, 100331. [Google Scholar] [CrossRef]
- Campbell, J.; Thompson, S. Predicting Excess Stock Returns Out of Sample: Can Anything Beat the Historical Average? Rev. Financ. Stud. 2008, 21, 1509–1531. [Google Scholar] [CrossRef]
- Fuertes, A.M.; Miffre, J.; Rallis, G. Tactical allocation in commodity futures markets: Combining momentum and term structure signals. J. Bank. Financ. 2010, 34, 2530–2548. [Google Scholar] [CrossRef]
- Casassus, J.; Liu, P.; Tang, K. Economic Linkages, Relative Scarcity, and Commodity Futures Returns. Rev. Financ. Stud. 2013, 26, 1324–1362. [Google Scholar] [CrossRef]
- Ahmed, S.; Tsvetanov, D. The predictive performance of commodity futures risk factors. J. Bank. Financ. 2016, 71, 20–36. [Google Scholar] [CrossRef]
- Gao, X.; Li, B.; Liu, R. The relative pricing of WTI and Brent crude oil futures: Expectations or risk premia? J. Commod. Mark. 2023, 30, 100274. [Google Scholar] [CrossRef]
- Yang, Y.; Zhang, J.; Chen, S. Information effects of monetary policy announcements on oil price. J. Commod. Mark. 2023, 30, 100268. [Google Scholar] [CrossRef]
- Chang, C.L. Extreme events, economic uncertainty and speculation on occurrences of price bubbles in crude oil futures. Energy Econ. 2024, 130, 107318. [Google Scholar] [CrossRef]
- Cui, J.; Maghyereh, A. Unveiling interconnectedness: Exploring higher-order moments among energy, precious metals, industrial metals, and agricultural commodities in the context of geopolitical risks and systemic stress. J. Commod. Mark. 2024, 33, 100380. [Google Scholar] [CrossRef]
- Dai, Z.; Zhang, X.; Liang, C. Efficient predictability of oil price: The role of VIX-based panic index shadow line difference. Energy Econ. 2024, 129, 107234. [Google Scholar] [CrossRef]
- Gronwald, M.; Jin, X. Measuring world oil market integration with a Thick Pen. Energy Econ. 2024, 130, 107315. [Google Scholar] [CrossRef]
- Gupta, R.; Nielsen, J.; Pierdzioch, C. Stock market bubbles and the realized volatility of oil price returns. Energy Econ. 2024, 132, 107432. [Google Scholar] [CrossRef]
- Luo, Q.; Ma, F.; Wang, J.; Wu, Y. Changing determinant driver and oil volatility forecasting: A comprehensive analysis. Energy Econ. 2024, 129, 107187. [Google Scholar] [CrossRef]
- Zhang, L.; Chen, Y.; Bouri, E. Time-varying jump intensity and volatility forecasting of crude oil returns. Energy Econ. 2024, 129, 107236. [Google Scholar] [CrossRef]
- Bakshi, G.; Gao, X.; Xue, J. Recovery with Applications to Forecasting Equity Disaster Probability and Testing the Spanning Hypothesis in the Treasury Market. J. Financ. Quant. Anal. 2023, 58, 1808–1842. [Google Scholar] [CrossRef]
- Bakshi, G.; Crosby, J.; Gao, X.; Zhou, W. A New Formula for the Expected Excess Return of the Market; Working Paper; Temple University: Philadelphia, PA, USA, 2024. [Google Scholar]

| Mean | SD | Min. | 5th | 25th | 50th | 75th | 95th | Max. | |
|---|---|---|---|---|---|---|---|---|---|
| WTI crude oil futures: Number of OTM puts | 45 | 29 | 8 | 12 | 19 | 46 | 65 | 95 | 182 |
| WTI crude oil futures: Number of OTM calls | 46 | 32 | 11 | 13 | 20 | 44 | 62 | 101 | 203 |
| S&P 500 equity index: Number of OTM puts | 98 | 53 | 14 | 36 | 57 | 83 | 136 | 193 | 322 |
| S&P 500 equity index: Number of OTM calls | 35 | 24 | 8 | 14 | 19 | 26 | 44 | 87 | 158 |
| Mean (%) | SD (%) | Block Bootstrap | NW[] | Min. | Max. | Acf | Skewness | Kurtosis | (%) | ||
|---|---|---|---|---|---|---|---|---|---|---|---|
| Lower | Upper | ||||||||||
| Panel A: Oil futures returns, (weekly, %) | |||||||||||
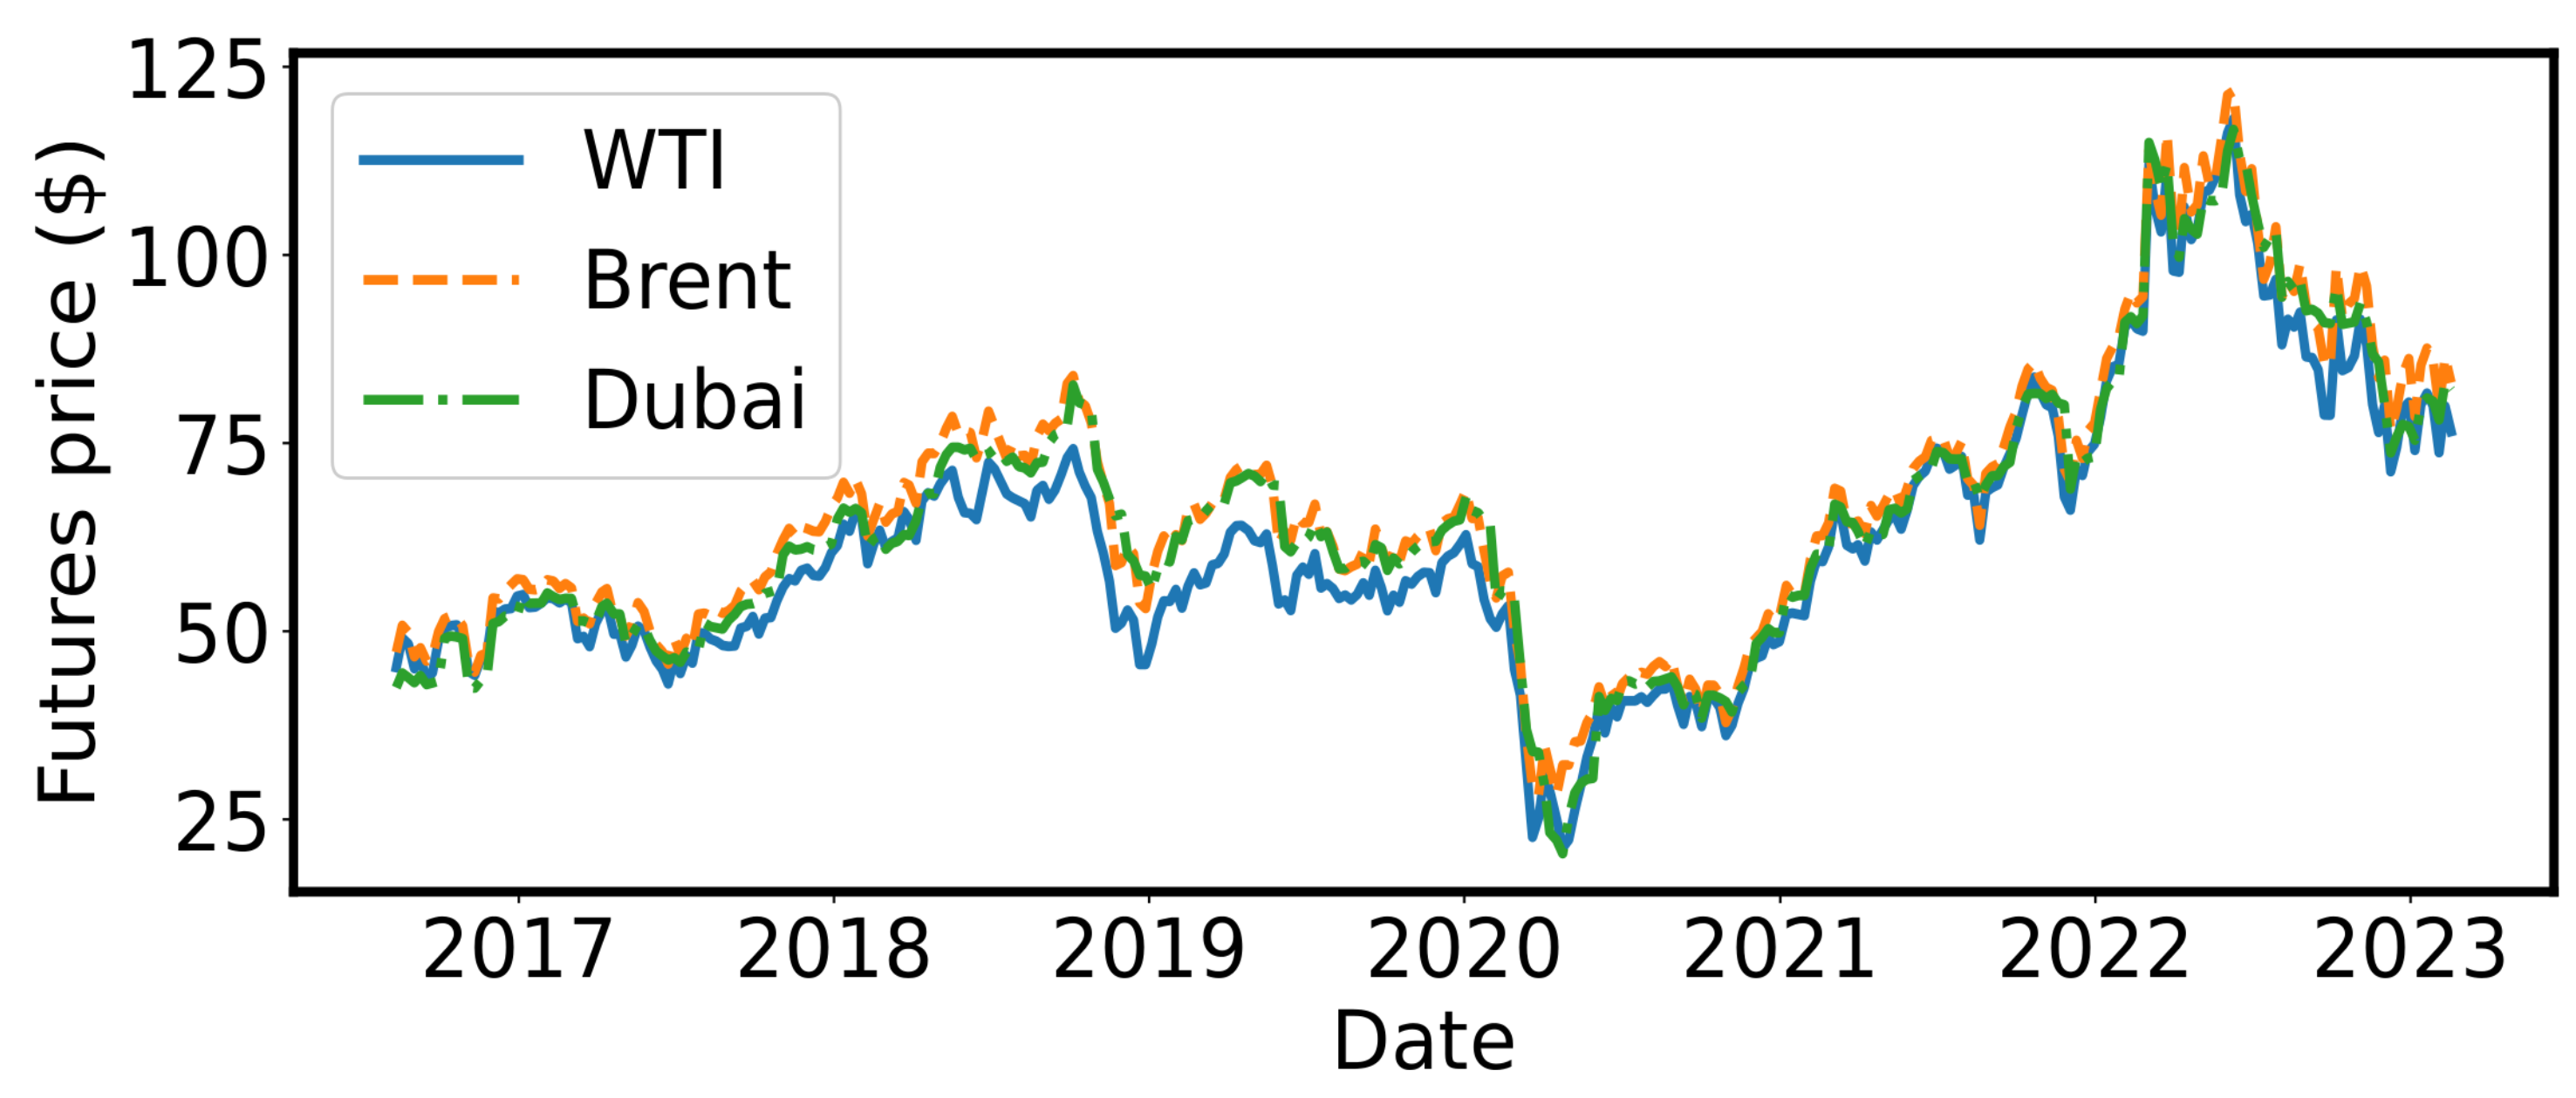
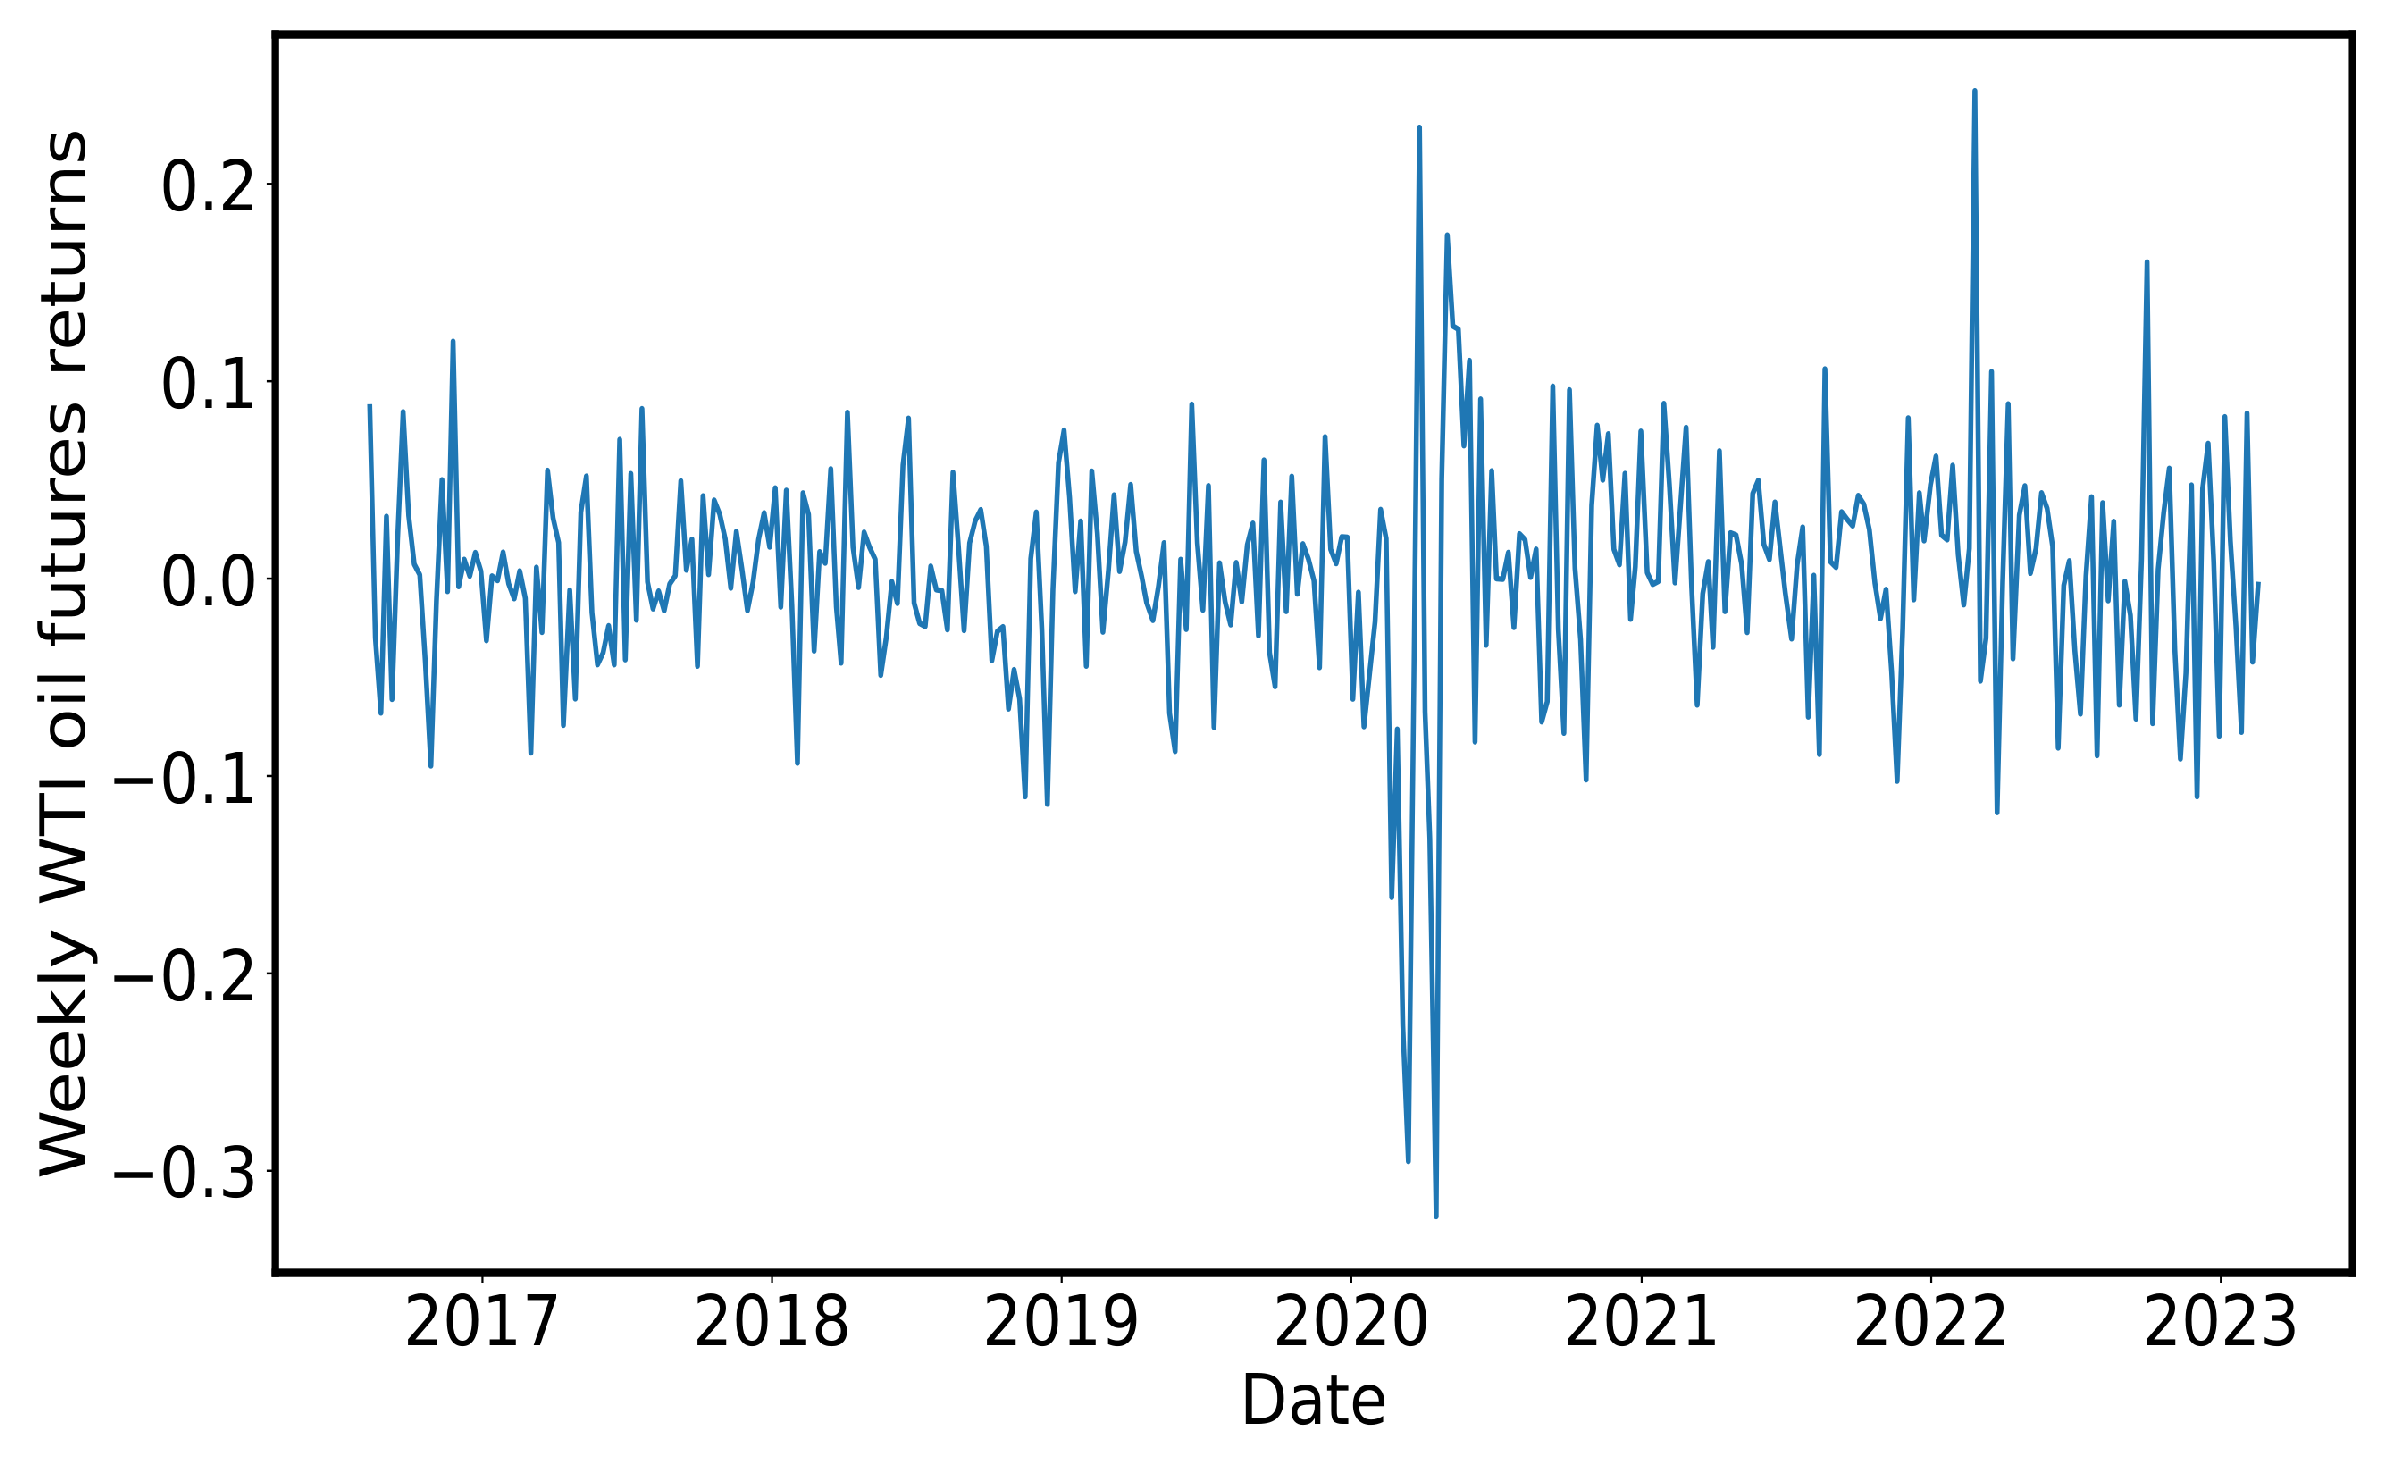
| WTI futures | 0.24 | 5.86 | ⌊−0.32 | 0.78⌋ | 0.46 | −32.3 | 24.7 | 0.11 | −0.7 | 5.9 | 55 |
| Brent futures | 0.30 | 5.08 | ⌊−0.18 | 0.74⌋ | 0.29 | −20.9 | 23.3 | 0.00 | 0.0 | 2.9 | 56 |
| Dubai futures | 0.31 | 4.89 | ⌊−0.26 | 0.85⌋ | 0.32 | −20.9 | 35.6 | 0.11 | 1.2 | 13.1 | 55 |
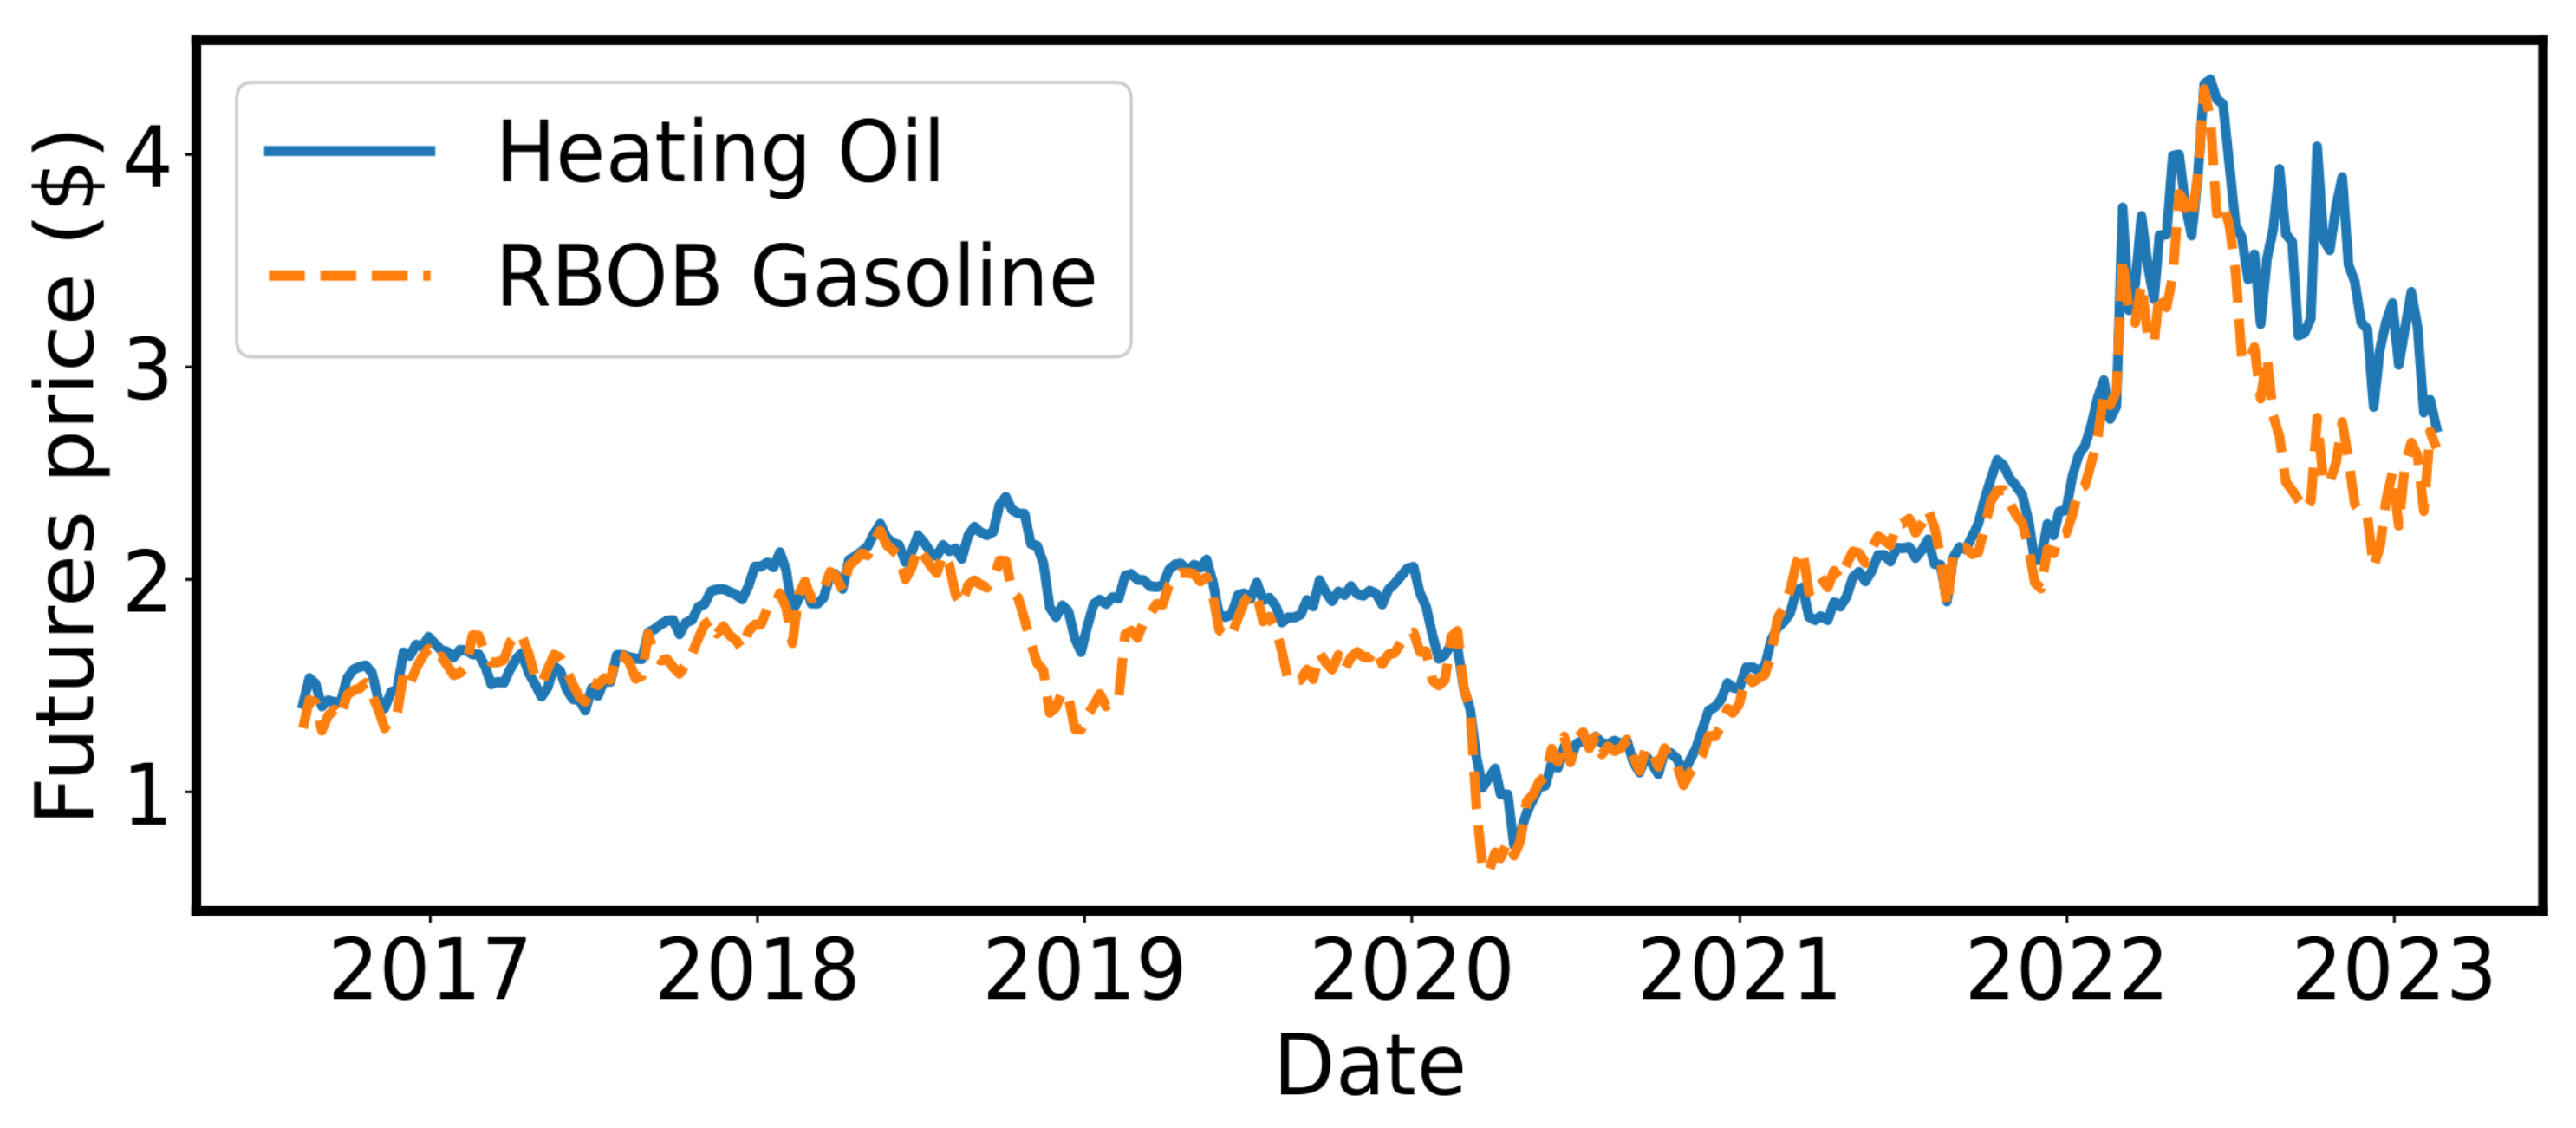
| Heating Oil futures | 0.34 | 5.31 | ⌊−0.11 | 0.80⌋ | 0.23 | −24.1 | 33.3 | −0.01 | 0.5 | 6.3 | 53 |
| RBOB Gasoline futures | 0.40 | 6.13 | ⌊−0.22 | 0.97⌋ | 0.27 | −33.0 | 24.4 | 0.08 | −0.4 | 5.2 | 53 |
| Equal weight basket | 0.32 | 4.84 | ⌊−0.18 | 0.81⌋ | 0.28 | −22.4 | 25.1 | 0.09 | 0.01 | 4.1 | 55 |
| Panel B: Volatility of oil futures returns (from intraday returns, annualized (%)) | |||||||||||
| WTI futures | 29.0 | 32.8 | ⌊24.6 | 35.0⌋ | 0.00 | 9.9 | 539.2 | 0.47 | 11.9 | 175.4 | |
| Brent futures | 27.0 | 15.4 | ⌊24.3 | 30.3⌋ | 0.00 | 10.9 | 163.6 | 0.73 | 4.7 | 31.4 | |
| Dubai futures | 27.7 | 34.3 | ⌊23.1 | 33.5⌋ | 0.00 | 1.2 | 349.6 | 0.36 | 4.4 | 28.4 | |
| Heating Oil futures | 24.6 | 13.1 | ⌊22.0 | 27.3⌋ | 0.00 | 11.7 | 121.4 | 0.79 | 3.3 | 15.8 | |
| RBOB Gasoline futures | 27.6 | 17.2 | ⌊24.5 | 31.5⌋ | 0.00 | 13.9 | 155.8 | 0.88 | 4.8 | 28.4 | |
| Panel C: Return correlations | Panel D: Correlation between return volatilities | ||||||||||
| WTI | Brent | Dubai | Heating Oil | WTI | Brent | Dubai | Heating Oil | ||||
| Brent futures | 0.86 | 0.81 | |||||||||
| Dubai futures | 0.61 | 0.58 | 0.48 | 0.70 | |||||||
| Heating Oil futures | 0.85 | 0.77 | 0.62 | 0.71 | 0.91 | 0.70 | |||||
| RBOB Gasoline futures | 0.81 | 0.81 | 0.57 | 0.79 | 0.76 | 0.92 | 0.65 | 0.87 | |||
| Mean | SD | Bootstrap Block | NW[] | Min. | Max. | Acf | Skewness | Kurtosis | (%) | ||
|---|---|---|---|---|---|---|---|---|---|---|---|
| Lower | Upper | ||||||||||
| 0.0042 | 0.0105 | ⌊0.0026 | 0.0065⌋ | 0.00 | 0.0003 | 0.1328 | 0.66 | 8.12 | 80.3 | ||
| −0.00012 | 0.00185 | ⌊−0.00033 | 0.00001⌋ | 0.24 | −0.03211 | 0.00581 | 0.17 | −15.10 | 263.6 | 32 | |
| 0.00032 | 0.00360 | ⌊0.00003 | 0.00083⌋ | 0.20 | −0.00121 | 0.06442 | 0.21 | 16.92 | 299.9 | ||
| −0.1773 | 0.47 | ⌊−0.26 | −0.09⌋ | 0.00 | −1.37 | 1.87 | 0.62 | 0.43 | 1.27 | 32 | |
| 6.2 | 2.4 | ⌊5.8 | 6.5⌋ | 0.00 | 2.8 | 26.2 | 0.43 | 3.56 | 21.15 | ||
| 0.0037 | 0.0306 | ⌊0.0013 | 0.0077⌋ | 0.059 | 0.0002 | 0.5591 | 0.12 | 17.76 | 322.81 | ||
| −0.1209 | 1.25 | ⌊−0.25 | −0.02⌋ | 0.08 | −9.32 | 6.63 | −0.02 | −0.60 | 12.51 | 44 | |
| 0.00065 | 0.00116 | ⌊0.00047 | 0.00089⌋ | 0.00 | 0.00006 | 0.01359 | 0.78 | 6.87 | 61.56 | ||
| −0.000027 | 0.00010 | ⌊−0.00005 | −0.00001⌋ | 0.00 | −0.00107 | 0.00000 | 0.71 | −8.54 | 79.77 | 0 | |
| 0.0000024 | 0.00001 | ⌊0.00000 | 0.00000⌋ | 0.02 | 0.00000 | 0.00021 | 0.51 | 13.20 | 200.50 | ||
| −1.3 | 0.5 | ⌊−1.3 | −1.2⌋ | 0.00 | −2.7 | −0.1 | 0.61 | −0.66 | 0.22 | 0 | |
| 7.4 | 4.8 | ⌊6.6 | 8.2⌋ | 0.00 | 2.1 | 48.3 | 0.51 | 3.35 | 18.49 | ||
| 0.00048 | 0.00116 | ⌊0.00032 | 0.00071⌋ | 0.00 | 0.00002 | 0.01443 | 0.79 | 8.33 | 84.51 | ||
| −0.17 | 0.66 | ⌊−0.24 | −0.11⌋ | 0.00 | −4.78 | 1.71 | 0.05 | −2.41 | 14.55 | 40 | |
| −0.10 | 0.56 | ⌊−0.18 | −0.02⌋ | 0.03 | −1.72 | 2.26 | 0.37 | 0.61 | 1.44 | 41 | |
| 0.11 | 2.23 | ⌊−0.02 | 0.23⌋ | 0.19 | −13.98 | 12.31 | −0.20 | −0.85 | 16.02 | 45 | |
| −0.10 | 9.64 | ⌊−0.42 | 0.28⌋ | 0.70 | −28.38 | 32.60 | −0.53 | 0.22 | 0.52 | 47 | |
| Predictor (Univariate) | Constant | NW[p] | NW[p] | (%) | CORR | Predict (Yes or No) | |
|---|---|---|---|---|---|---|---|
| Panel A: Three 7DTE higher-order risk-neutral return cumulants from oil market | |||||||
| 0.00 | 0.45 | 0.07 | 0.88 | −0.28 | 0.01 | No | |
| 0.00 | 0.55 | −3.57 | 0.01 | 0.98 | −0.11 | Yes | |
| 0.00 | 0.52 | 0.95 | 0.01 | 0.05 | 0.06 | Yes | |
| Panel B: Other predictors from oil markets | |||||||
| 0.00 | 0.64 | −0.01 | 0.40 | −0.11 | −0.04 | No | |
| −0.01 | 0.48 | 0.00 | 0.21 | 0.04 | 0.06 | No | |
| 0.00 | 0.56 | 0.08 | 0.07 | −0.13 | 0.04 | Yes | |
| 0.00 | 0.57 | −0.00 | 0.33 | −0.10 | −0.05 | No | |
| Panel C: Predictors from equity markets | |||||||
| 0.01 | 0.11 | −4.75 | 0.33 | 0.59 | −0.09 | No | |
| 0.00 | 0.11 | 88.92 | 0.14 | 1.88 | 0.15 | No | |
| 0.00 | 0.32 | −295.6 | 0.30 | 0.13 | −0.07 | No | |
| −0.01 | 0.16 | −0.01 | 0.02 | 0.40 | −0.08 | Yes | |
| −0.00 | 0.58 | 0.00 | 0.14 | 0.14 | 0.07 | No | |
| 0.01 | 0.09 | −6.2 | 0.23 | 1.22 | −0.12 | No | |
| 0.00 | 0.49 | 0.00 | 0.81 | −0.29 | 0.01 | No | |
| Panel D: Predictors from the Energy Information Administration (EIA) | |||||||
| 0.00 | 0.79 | −1.39 | 0.03 | 1.51 | −0.15 | Yes | |
| 0.00 | 0.48 | −0.06 | 0.69 | −0.25 | −0.02 | No | |
| 0.00 | 0.50 | −0.03 | 0.29 | 0.01 | −0.06 | No | |
| Alternative Predictor | Constant | NW[ ] | Predictor Is | Alternative | (%) | Joint | (%) | ||
|---|---|---|---|---|---|---|---|---|---|
| NW[] | NW[] | ||||||||
| 0.00 0.15 | −5.41 | 0.01 | −0.52 | 0.28 | 1.23 | 0.01 | 0.39 | ||
| 0.00 0.48 | −9.46 | 0.00 | −3.40 | 0.01 | 1.58 | 0.00 | 2.78 | ||
| 0.00 | 0.64 | −3.43 | 0.01 | 0.00 | 0.65 | 0.74 | 0.02 | 0.52 | |
| −0.01 | 0.46 | −3.56 | 0.01 | 0.00 | 0.21 | 1.02 | 0.01 | 1.25 | |
| 0.00 | 0.32 | −16.1 | 0.00 | −0.82 | 0.00 | 3.47 | 0.00 | 4.10 | |
| 0.00 | 0.64 | −3.45 | 0.01 | 0.00 | 0.53 | 0.79 | 0.03 | 1.08 | |
| 0.01 | 0.11 | −3.97 | 0.01 | −5.52 | 0.26 | 1.88 | 0.04 | 0.90 | |
| 0.00 | 0.13 | −4.08 | 0.02 | 97.1 | 0.10 | 3.28 | 0.04 | 1.23 | |
| 0.00 | 0.38 | −3.84 | 0.02 | −357.9 | 0.21 | 1.32 | 0.04 | 1.21 | |
| −0.01 | 0.12 | −3.65 | 0.01 | −0.01 | 0.02 | 1.46 | 0.00 | 0.96 | |
| −0.00 | 0.50 | −3.63 | 0.01 | 0.00 | 0.12 | 1.19 | 0.01 | 1.00 | |
| 0.01 | 0.10 | −3.98 | 0.02 | −6.88 | 0.19 | 2.53 | 0.05 | 1.08 | |
| 0.00 | 0.56 | −3.57 | 0.01 | 0.00 | 0.74 | 0.72 | 0.03 | 1.18 | |
| −0.00 | 0.90 | −3.97 | 0.00 | −0.78 | 0.01 | 3.37 | 0.00 | 0.95 | |
| 0.00 | 0.59 | −3.55 | 0.01 | −0.06 | 0.68 | 0.75 | 0.03 | 1.12 | |
| 0.00 | 0.62 | −3.64 | 0.01 | −0.04 | 0.23 | 1.08 | 0.03 | 1.25 | |
| Alternative Predictor | Constant | Predictor Is | Alternative | NW[] | (%) | Joint | |||
|---|---|---|---|---|---|---|---|---|---|
| NW[] | NW[] | ||||||||
| 0.00 | 0.15 | −4.92 | 0.01 | −0.27 | 0.52 | 1.96 | 0.00 | 0.51 | |
| 0.00 | 0.33 | −6.52 | 0.00 | −1.46 | 0.21 | 2.00 | 0.00 | 1.56 | |
| 0.00 | 0.40 | −3.91 | 0.00 | 0.00 | 0.75 | 1.79 | 0.00 | 0.25 | |
| −0.01 | 0.47 | −3.99 | 0.00 | 0.00 | 0.17 | 2.20 | 0.00 | 1.13 | |
| 0.00 | 0.25 | −11.10 | 0.00 | −0.47 | 0.00 | 3.10 | 0.00 | 2.21 | |
| 0.00 | 0.44 | −3.86 | 0.00 | 0.00 | 0.39 | 1.94 | 0.00 | 0.88 | |
| 0.01 | 0.03 | −4.35 | 0.00 | −4.97 | 0.19 | 3.23 | 0.00 | 0.68 | |
| 0.00 | 0.06 | −4.42 | 0.00 | 80.79 | 0.06 | 4.45 | 0.00 | 0.97 | |
| 0.00 | 0.24 | −4.20 | 0.00 | −268.28 | 0.18 | 2.33 | 0.00 | 1.06 | |
| −0.01 | 0.11 | −4.07 | 0.00 | −0.01 | 0.01 | 2.81 | 0.00 | 0.60 | |
| 0.00 | 0.48 | −4.06 | 0.00 | 0.00 | 0.09 | 2.62 | 0.00 | 0.95 | |
| 0.01 | 0.04 | −4.34 | 0.00 | −5.84 | 0.12 | 3.77 | 0.00 | 0.95 | |
| 0.00 | 0.39 | −4.01 | 0.00 | 0.00 | 0.65 | 1.86 | 0.00 | 0.76 | |
| 0.00 | 0.60 | −4.19 | 0.00 | −0.88 | 0.09 | 2.85 | 0.00 | 0.81 | |
| 0.00 | 0.38 | −3.99 | 0.00 | −0.03 | 0.77 | 1.80 | 0.00 | 0.82 | |
| 0.00 | 0.40 | −4.08 | 0.00 | −0.04 | 0.10 | 2.49 | 0.00 | 1.04 | |
| Alternative Predictor | Constant | Predictor Is | Alternative | NW[] | (%) | Joint | ||
|---|---|---|---|---|---|---|---|---|
| NW[] | NW[] | |||||||
| 0.00 0.11 | −3.59 | 0.08 | −0.42 | 0.18 | 0.46 | 0.21 | ||
| 0.00 0.28 | −9.97 | 0.00 | −4.53 | 0.00 | 2.11 | 0.00 | ||
| 0.00 | 0.51 | −1.90 | 0.20 | −0.01 | 0.38 | 0.23 | 0.22 | |
| 0.00 | 0.69 | −2.12 | 0.17 | 0.00 | 0.34 | 0.20 | 0.28 | |
| 0.00 | 0.16 | −15.59 | 0.00 | −0.88 | 0.00 | 4.30 | 0.00 | |
| 0.00 | 0.41 | −2.02 | 0.18 | 0.00 | 0.44 | 0.12 | 0.32 | |
| 0.00 | 0.17 | −2.30 | 0.17 | −2.37 | 0.61 | 0.31 | 0.37 | |
| 0.00 | 0.11 | −2.40 | 0.18 | 52.12 | 0.34 | 1.01 | 0.28 | |
| 0.00 | 0.26 | −2.26 | 0.17 | −172.5 | 0.49 | 0.21 | 0.32 | |
| −0.01 | 0.09 | −2.21 | 0.15 | −0.01 | 0.01 | 1.00 | 0.01 | |
| 0.00 | 0.54 | −2.19 | 0.15 | 0.00 | 0.13 | 0.59 | 0.15 | |
| 0.00 | 0.09 | −2.36 | 0.17 | −3.94 | 0.37 | 0.82 | 0.28 | |
| 0.00 | 0.32 | −2.16 | 0.16 | 0.00 | 0.36 | 0.19 | 0.26 | |
| 0.00 | 0.55 | −2.30 | 0.12 | −0.75 | 0.14 | 0.72 | 0.12 | |
| 0.00 | 0.36 | −2.13 | 0.17 | −0.02 | 0.87 | 0.02 | 0.37 | |
| 0.00 | 0.38 | −2.22 | 0.15 | −0.05 | 0.05 | 0.87 | 0.06 | |
| Alternative Predictor | Constant | Predictor Is | Alternative | NW[] | (%) | Joint | ||
|---|---|---|---|---|---|---|---|---|
| NW[] | NW[] | |||||||
| 0.01 | 0.04 | −10.45 | 0.00 | −0.82 | 0.12 | 9.56 | 0.00 | |
| 0.00 | 0.45 | −9.43 | 0.01 | −1.07 | 0.56 | 7.81 | 0.00 | |
| 0.00 | 0.36 | −7.74 | 0.00 | 0.00 | 0.48 | 7.80 | 0.00 | |
| 0.00 | 0.59 | −7.57 | 0.00 | 0.00 | 0.24 | 7.95 | 0.00 | |
| 0.00 | 0.40 | −11.48 | 0.00 | −0.26 | 0.25 | 8.10 | 0.00 | |
| 0.00 | 0.58 | −7.38 | 0.00 | 0.00 | 0.31 | 8.06 | 0.00 | |
| 0.01 | 0.00 | −8.35 | 0.00 | −10.46 | 0.00 | 13.79 | 0.00 | |
| 0.01 | 0.05 | −8.25 | 0.00 | 123.5 | 0.00 | 13.69 | 0.00 | |
| 0.00 | 0.24 | −8.04 | 0.00 | −595.8 | 0.00 | 10.22 | 0.00 | |
| −0.01 | 0.08 | −7.68 | 0.00 | −0.01 | 0.01 | 9.16 | 0.00 | |
| −0.01 | 0.28 | −7.68 | 0.00 | 0.00 | 0.04 | 9.05 | 0.00 | |
| 0.01 | 0.02 | −8.12 | 0.00 | −8.79 | 0.00 | 12.03 | 0.00 | |
| 0.00 | 0.68 | −7.55 | 0.00 | 0.00 | 0.67 | 7.86 | 0.00 | |
| 0.00 | 0.71 | −7.76 | 0.00 | −0.81 | 0.25 | 8.59 | 0.00 | |
| 0.00 | 0.51 | −7.58 | 0.00 | 0.01 | 0.91 | 7.71 | 0.00 | |
| 0.00 | 0.51 | −7.65 | 0.00 | −0.04 | 0.24 | 8.24 | 0.00 | |
| Alternative Predictor | Constant | Predictor Is | Alternative | NW[] | (%) | Joint | ||
|---|---|---|---|---|---|---|---|---|
| NW[] | NW[] | |||||||
| 0.00 | 0.20 | −3.91 | 0.01 | −0.15 | 0.63 | 0.85 | 0.00 | |
| 0.00 | 0.26 | −6.41 | 0.03 | −1.76 | 0.20 | 1.09 | 0.00 | |
| 0.00 | 0.34 | −3.32 | 0.00 | 0.00 | 0.88 | 0.80 | 0.00 | |
| 0.00 | 0.54 | −3.36 | 0.00 | 0.00 | 0.21 | 1.10 | 0.00 | |
| 0.00 | 0.23 | −9.51 | 0.00 | −0.40 | 0.02 | 1.63 | 0.00 | |
| 0.00 | 0.38 | −3.16 | 0.00 | 0.00 | 0.17 | 1.13 | 0.00 | |
| 0.00 | 0.08 | −3.50 | 0.00 | −2.00 | 0.46 | 1.01 | 0.00 | |
| 0.00 | 0.11 | −3.56 | 0.00 | 38.39 | 0.21 | 1.31 | 0.00 | |
| 0.00 | 0.25 | −3.34 | 0.00 | 24.17 | 0.87 | 0.82 | 0.00 | |
| −0.01 | 0.24 | −3.43 | 0.00 | −0.01 | 0.04 | 1.52 | 0.00 | |
| 0.00 | 0.72 | −3.42 | 0.00 | 0.00 | 0.16 | 1.23 | 0.00 | |
| 0.00 | 0.08 | −3.52 | 0.00 | −2.77 | 0.28 | 1.18 | 0.00 | |
| 0.00 | 0.26 | −3.38 | 0.00 | 0.00 | 0.58 | 0.89 | 0.00 | |
| 0.00 | 0.59 | −3.64 | 0.00 | −1.24 | 0.03 | 2.55 | 0.00 | |
| 0.00 | 0.32 | −3.36 | 0.00 | −0.03 | 0.82 | 0.82 | 0.00 | |
| 0.00 | 0.33 | −3.45 | 0.00 | −0.04 | 0.17 | 1.43 | 0.00 | |
| Alternative Predictor | Constant | Predictor Is | Alternative | NW[] | (%) | Joint | ||
|---|---|---|---|---|---|---|---|---|
| NW[] | NW[] | |||||||
| 0.00 | 0.68 | −1.26 | 0.63 | 0.58 | 0.40 | 1.03 | 0.00 | |
| 0.00 | 0.35 | 2.67 | 0.47 | 3.46 | 0.05 | 1.26 | 0.00 | |
| 0.00 | 0.38 | −3.17 | 0.00 | 0.00 | 0.62 | 0.48 | 0.00 | |
| −0.01 | 0.32 | −3.31 | 0.00 | 0.00 | 0.08 | 1.10 | 0.00 | |
| 0.00 | 0.35 | −2.86 | 0.55 | 0.03 | 0.91 | 0.44 | 0.00 | |
| 0.00 | 0.37 | −3.30 | 0.00 | 0.00 | 0.91 | 0.43 | 0.00 | |
| 0.01 | 0.08 | −3.65 | 0.00 | −4.48 | 0.47 | 1.18 | 0.00 | |
| 0.01 | 0.05 | −3.82 | 0.00 | 92.8 | 0.18 | 2.66 | 0.00 | |
| 0.00 | 0.24 | −3.50 | 0.00 | −239.4 | 0.44 | 0.71 | 0.00 | |
| −0.01 | 0.43 | −3.38 | 0.00 | −0.01 | 0.14 | 0.83 | 0.00 | |
| 0.00 | 0.57 | −3.40 | 0.00 | 0.00 | 0.16 | 1.08 | 0.00 | |
| 0.01 | 0.04 | −3.73 | 0.00 | −6.83 | 0.27 | 2.15 | 0.00 | |
| 0.00 | 0.33 | −3.37 | 0.00 | 0.00 | 0.34 | 0.66 | 0.00 | |
| 0.00 | 0.40 | −3.35 | 0.00 | −0.13 | 0.84 | 0.44 | 0.00 | |
| 0.00 | 0.34 | −3.31 | 0.00 | −0.08 | 0.57 | 0.51 | 0.00 | |
| 0.00 | 0.36 | −3.42 | 0.00 | −0.05 | 0.11 | 0.98 | 0.00 | |
| Panel A: | |||||||||
| constant | NW[p] | NW[p] | NW[p] | NW[p] | (%) | ||||
| WTI | 0.00 | 0.33 | −0.15 | 0.87 | −9.13 | 0.01 | −2.91 | 0.42 | 1.31 |
| Oil basket | 0.00 | 0.20 | −0.13 | 0.84 | −6.23 | 0.01 | −1.02 | 0.65 | 1.74 |
| Panel B: Regression with dummy variables | |||||||||
| WTI | constant | NW[p] | NW[p] | NW[p] | NW[p] | ||||
| −0.01 | 0.12 | 7.31 | 0.07 | −0.21 | 0.82 | 6.15 | 0.01 | ||
| NW[p] | NW[p] | NW[p] | |||||||
| 53.07 | 0.62 | −7.96 | 0.04 | −27.94 | 0.00 | ||||
| NW[p] | NW[p] | NW[p] | (%) | ||||||
| −188.34 | 0.48 | −1.96 | 0.59 | −109.46 | 0.05 | 2.22 | |||
| Oil basket | constant | NW[p] | NW[p] | NW[p] | NW[p] | ||||
| −0.01 | 0.30 | 5.66 | 0.18 | −0.16 | 0.80 | 4.51 | 0.04 | ||
| NW[p] | NW[p] | NW[p] | |||||||
| 83.03 | 0.39 | −4.95 | 0.05 | −24.38 | 0.01 | ||||
| NW[p] | NW[p] | NW[p] | (%) | ||||||
| −152.42 | 0.59 | −0.17 | 0.94 | −81.53 | 0.10 | 2.33 | |||
Weeks | Full Sample 12 August 2016, to 23 February 2023 Weekly Returns (%) | Subsample 12 August 2016, to 5 June 2020 Weekly Returns (%) | Subsample 5 June 2020, to 23 February 2023 Weekly Returns (%) | |||||||||||||
|---|---|---|---|---|---|---|---|---|---|---|---|---|---|---|---|---|
| Mean Return | Block Bootstrap | NW[] | (%) | Mean Return | Block Bootstrap | NW[] | (%) | Mean Return | Block Bootstrap | NW[] | (%) | Sharpe Ratio | ||||
| 8 | 0.13 | ⌊−0.39 | 0.67⌋ | 0.68 | 54 | −0.24 | ⌊−1.13 | 0.34⌋ | 0.58 | 48 | 0.63 | ⌊0.04 | 1.28⌋ | 0.10 | 63 | 0.90 |
| 7 | 0.09 | ⌊−0.42 | 0.61⌋ | 0.77 | 53 | −0.37 | ⌊−1.24 | 0.18⌋ | 0.39 | 47 | 0.71 | ⌊0.14 | 1.34⌋ | 0.06 | 63 | 1.01 |
| 6 | 0.33 | ⌊−0.17 | 0.85⌋ | 0.28 | 55 | 0.01 | ⌊−0.83 | 0.54⌋ | 0.98 | 50 | 0.77 | ⌊0.16 | 1.42⌋ | 0.05 | 62 | 1.09 |
| 5 | 0.22 | ⌊−0.31 | 0.75⌋ | 0.48 | 55 | −0.01 | ⌊−0.86 | 0.53⌋ | 0.97 | 50 | 0.54 | ⌊−0.16 | 1.28⌋ | 0.17 | 61 | 0.76 |
| 4 | 0.04 | ⌊−0.47 | 0.56⌋ | 0.89 | 52 | −0.19 | ⌊−1.03 | 0.35⌋ | 0.66 | 47 | 0.36 | ⌊−0.29 | 1.02⌋ | 0.33 | 60 | 0.51 |
| 3 | 0.14 | ⌊−0.38 | 0.65⌋ | 0.65 | 53 | 0.05 | ⌊−0.78 | 0.58⌋ | 0.90 | 51 | 0.25 | ⌊−0.40 | 0.91⌋ | 0.51 | 56 | 0.35 |
| 2 | 0.07 | ⌊−0.44 | 0.60⌋ | 0.83 | 54 | −0.13 | ⌊−0.98 | 0.43⌋ | 0.76 | 51 | 0.34 | ⌊−0.30 | 1.01⌋ | 0.36 | 58 | 0.48 |
| 1 | 0.09 | ⌊−0.41 | 0.64⌋ | 0.77 | 54 | −0.13 | ⌊−0.96 | 0.46⌋ | 0.76 | 51 | 0.40 | ⌊−0.26 | 1.09⌋ | 0.29 | 58 | 0.57 |
Disclaimer/Publisher’s Note: The statements, opinions and data contained in all publications are solely those of the individual author(s) and contributor(s) and not of MDPI and/or the editor(s). MDPI and/or the editor(s) disclaim responsibility for any injury to people or property resulting from any ideas, methods, instructions or products referred to in the content. |
© 2024 by the authors. Licensee MDPI, Basel, Switzerland. This article is an open access article distributed under the terms and conditions of the Creative Commons Attribution (CC BY) license (https://creativecommons.org/licenses/by/4.0/).
Share and Cite
Bakshi, G.; Gao, X.; Zhang, Z. What Insights Do Short-Maturity (7DTE) Return Predictive Regressions Offer about Risk Preferences in the Oil Market? Commodities 2024, 3, 225-247. https://doi.org/10.3390/commodities3020014
Bakshi G, Gao X, Zhang Z. What Insights Do Short-Maturity (7DTE) Return Predictive Regressions Offer about Risk Preferences in the Oil Market? Commodities. 2024; 3(2):225-247. https://doi.org/10.3390/commodities3020014
Chicago/Turabian StyleBakshi, Gurdip, Xiaohui Gao, and Zhaowei Zhang. 2024. "What Insights Do Short-Maturity (7DTE) Return Predictive Regressions Offer about Risk Preferences in the Oil Market?" Commodities 3, no. 2: 225-247. https://doi.org/10.3390/commodities3020014
APA StyleBakshi, G., Gao, X., & Zhang, Z. (2024). What Insights Do Short-Maturity (7DTE) Return Predictive Regressions Offer about Risk Preferences in the Oil Market? Commodities, 3(2), 225-247. https://doi.org/10.3390/commodities3020014