Innovation and Drivers of Productivity: A Global Analysis of Selected Critical Minerals
Abstract
1. Introduction
2. Literature Review
3. Methods and Data
3.1. Measures of Efficiency
3.2. TFP and Its Decomposition
3.3. Empirical Model
3.4. Data and Variables
4. Empirical Results and Discussion
4.1. Technical Efficiency
4.2. Changes in Productivity and Its Drivers
5. Conclusions
Funding
Data Availability Statement
Conflicts of Interest
Appendix A
| Country | Mean | Std. Err. | Lower CI | Upper CI |
|---|---|---|---|---|
| Argentina | 0.339 | 0.024 | 0.292 | 0.386 |
| Armenia | 0.138 | 0.006 | 0.126 | 0.150 |
| Australia | 0.427 | 0.011 | 0.404 | 0.449 |
| Bolivia | 0.262 | 0.046 | 0.172 | 0.352 |
| Botswana | 0.258 | 0.034 | 0.193 | 0.324 |
| Brazil | 0.393 | 0.018 | 0.358 | 0.428 |
| Bulgaria | 0.357 | 0.015 | 0.328 | 0.386 |
| Canada | 0.385 | 0.009 | 0.366 | 0.403 |
| Chile | 0.416 | 0.006 | 0.404 | 0.429 |
| China | 0.373 | 0.004 | 0.364 | 0.381 |
| Dem. Rep. Congo | 0.699 | 0.007 | 0.684 | 0.713 |
| Dominican Republic | 0.032 | 0.004 | 0.025 | 0.039 |
| Ecuador | 0.370 | 0.000 | 0.370 | 0.370 |
| Eritrea | 0.532 | 0.068 | 0.399 | 0.665 |
| Finland | 0.462 | 0.024 | 0.416 | 0.508 |
| Indonesia | 0.468 | 0.018 | 0.432 | 0.504 |
| Iran | 0.555 | 0.014 | 0.528 | 0.582 |
| Kazakhstan | 0.417 | 0.018 | 0.381 | 0.452 |
| Kyrgyzstan | 0.436 | 0.010 | 0.417 | 0.455 |
| Laos | 0.599 | 0.038 | 0.524 | 0.674 |
| Mauritania | 0.481 | 0.040 | 0.403 | 0.560 |
| Mexico | 0.286 | 0.007 | 0.272 | 0.301 |
| Mongolia | 0.382 | 0.013 | 0.357 | 0.407 |
| Panama | 0.275 | 0.009 | 0.258 | 0.292 |
| Papua New Guinea | 0.445 | 0.022 | 0.401 | 0.489 |
| Peru | 0.318 | 0.008 | 0.302 | 0.334 |
| Philippines | 0.232 | 0.011 | 0.210 | 0.255 |
| Poland | 0.654 | 0.011 | 0.633 | 0.676 |
| Portugal | 0.736 | 0.015 | 0.707 | 0.766 |
| Russia | 0.566 | 0.012 | 0.542 | 0.590 |
| Saudi Arabia | 0.708 | 0.015 | 0.679 | 0.737 |
| South Africa | 0.093 | 0.008 | 0.078 | 0.108 |
| Spain | 0.428 | 0.030 | 0.369 | 0.487 |
| Sweden | 0.208 | 0.014 | 0.180 | 0.236 |
| Tanzania | 0.117 | 0.011 | 0.097 | 0.138 |
| Turkey | 0.756 | 0.009 | 0.738 | 0.774 |
| USA | 0.287 | 0.005 | 0.276 | 0.297 |
| Vietnam | 0.253 | 0.017 | 0.220 | 0.286 |
| Zambia | 0.584 | 0.009 | 0.567 | 0.601 |
| Zimbabwe | 0.059 | 0.004 | 0.052 | 0.066 |
| Country | Mean | Std. Err. | Lower CI | Upper CI |
|---|---|---|---|---|
| Argentina | 0.393 | 0.015 | 0.364 | 0.422 |
| Armenia | 0.262 | 0.017 | 0.229 | 0.296 |
| Australia | 0.395 | 0.007 | 0.381 | 0.409 |
| Bolivia | 0.410 | 0.063 | 0.286 | 0.534 |
| Brazil | 0.289 | 0.013 | 0.264 | 0.314 |
| Bulgaria | 0.191 | 0.028 | 0.136 | 0.247 |
| Burkina Faso | 0.499 | 0.014 | 0.471 | 0.527 |
| Canada | 0.291 | 0.009 | 0.274 | 0.307 |
| Chile | 0.182 | 0.013 | 0.156 | 0.208 |
| China | 0.223 | 0.006 | 0.211 | 0.235 |
| Cote d’Ivoire | 0.486 | 0.019 | 0.449 | 0.523 |
| Dem. Rep. Congo | 0.512 | 0.025 | 0.463 | 0.560 |
| Dominican Republic | 0.658 | 0.014 | 0.631 | 0.685 |
| Ecuador | 0.276 | 0.212 | 0.139 | 0.691 |
| Egypt | 0.503 | 0.015 | 0.474 | 0.533 |
| Eritrea | 0.266 | 0.103 | 0.064 | 0.467 |
| Finland | 0.215 | 0.022 | 0.171 | 0.258 |
| Ghana | 0.471 | 0.008 | 0.455 | 0.487 |
| Greece | 0.373 | 0.037 | 0.300 | 0.446 |
| Guatemala | 0.400 | 0.056 | 0.291 | 0.510 |
| Guinea | 0.488 | 0.020 | 0.449 | 0.527 |
| Guyana | 0.399 | 0.036 | 0.328 | 0.470 |
| Honduras | 0.292 | 0.024 | 0.246 | 0.338 |
| Indonesia | 0.502 | 0.022 | 0.459 | 0.546 |
| Iran | 0.017 | 0.001 | 0.015 | 0.019 |
| Kazakhstan | 0.274 | 0.017 | 0.240 | 0.307 |
| Kyrgyzstan | 0.493 | 0.040 | 0.415 | 0.571 |
| Laos | 0.225 | 0.025 | 0.176 | 0.273 |
| Liberia | 0.452 | 0.083 | 0.289 | 0.616 |
| Mali | 0.529 | 0.020 | 0.491 | 0.567 |
| Mauritania | 0.309 | 0.032 | 0.247 | 0.371 |
| Mexico | 0.201 | 0.006 | 0.189 | 0.213 |
| Mongolia | 0.198 | 0.047 | 0.106 | 0.291 |
| Namibia | 0.105 | 0.031 | 0.045 | 0.166 |
| New Zealand | 0.394 | 0.018 | 0.358 | 0.430 |
| Nicaragua | 0.499 | 0.021 | 0.458 | 0.541 |
| Panama | 0.032 | 0.004 | 0.024 | 0.039 |
| Papua New Guinea | 0.506 | 0.019 | 0.469 | 0.543 |
| Peru | 0.207 | 0.012 | 0.185 | 0.230 |
| Philippines | 0.284 | 0.020 | 0.244 | 0.325 |
| Poland | 0.015 | 0.002 | 0.011 | 0.018 |
| Russia | 0.375 | 0.011 | 0.354 | 0.396 |
| Saudi Arabia | 0.019 | 0.003 | 0.013 | 0.024 |
| Senegal | 0.545 | 0.029 | 0.488 | 0.603 |
| South Africa | 0.262 | 0.010 | 0.243 | 0.281 |
| Spain | 0.356 | 0.039 | 0.279 | 0.433 |
| Suriname | 0.464 | 0.026 | 0.413 | 0.515 |
| Sweden | 0.183 | 0.013 | 0.158 | 0.208 |
| Tajikistan | 0.338 | 0.036 | 0.267 | 0.410 |
| Tanzania | 0.597 | 0.015 | 0.568 | 0.627 |
| Thailand | 0.567 | 0.032 | 0.505 | 0.629 |
| Turkey | 0.503 | 0.017 | 0.470 | 0.536 |
| USA | 0.318 | 0.010 | 0.299 | 0.336 |
| Uzbekistan | 0.646 | 0.006 | 0.635 | 0.658 |
| Zambia | 0.078 | 0.003 | 0.072 | 0.085 |
| Zimbabwe | 0.029 | 0.002 | 0.025 | 0.032 |
References
- Matysek, A.L.; Fisher, B.S. Productivity and Innovation in the Mining Industry. BAE Research Report, Retrieved from Canberra. 2016. Available online: https://www.baeconomics.com.au/ (accessed on 7 November 2023).
- Chen, J.; Zhu, Z.; Xie, H.Y. Measuring intellectual capital: A new model and empirical study. J. Intellect. Cap. 2004, 5, 195–212. [Google Scholar] [CrossRef]
- Lala, A.; Moyo, M.; Rehbach, S.; Sellschop, R. Productivity in mining operations: Reversing the downward trend. AusIMM Bull. 2016, 2016, 46–49. Available online: https://www.ausimm.com/bulletin (accessed on 7 November 2023).
- Duan, L. Estimation of export cutoff productivity of Chinese industrial enterprises. PLoS ONE 2022, 17, e0277842. [Google Scholar] [CrossRef]
- Weldegiorgis, F.S.; Dietsche, E.; Ahmad, S. Inter-Sectoral Economic Linkages in the Mining Industries of Botswana and Tanzania: Analysis Using Partial Hypothetical Extraction Method. Resources 2023, 12, 78. [Google Scholar] [CrossRef]
- Yasmin, T.; El Refae, G.A.; Eletter, S.; Kaba, A. Examining the total factor productivity changing patterns in Ka-zakhstan: An input-output analysis. J. East. Eur. Cent. Asian Res. JEECAR 2022, 9, 938–950. [Google Scholar]
- Fernandez, V. Copper mining in Chile and its regional employment linkages. Resour. Policy 2021, 70, 101173. [Google Scholar] [CrossRef]
- Garcia, P.; Knights, P.F.; Tilton, J.E. Labor productivity and comparative advantage in mining: The copper industry in Chile. Resour. Policy 2001, 27, 97–105. [Google Scholar] [CrossRef]
- Gruenhagen, J.H.; Parker, R. Factors driving or impeding the diffusion and adoption of innovation in mining: A systematic review of the literature. Resour. Policy 2020, 65, 101540. [Google Scholar] [CrossRef]
- Humphreys, D. Mining productivity and the fourth industrial revolution. Miner. Econ. 2020, 33, 115–125. [Google Scholar] [CrossRef]
- Sánchez, F.; Hartlieb, P. Innovation in the Mining Industry: Technological Trends and a Case Study of the Challenges of Disruptive Innovation. Min. Met. Explor. 2020, 37, 1385–1399. [Google Scholar] [CrossRef]
- Lovell, C.A.K.; Lovell, J.E. Productivity decline in Australian coal mining. J. Prod. Anal. 2013, 40, 443–455. [Google Scholar] [CrossRef]
- Ahmad, S. Estimating input-mix efficiency in a parametric framework: Application to state-level agricultural data for the United States. Appl. Econ. 2020, 52, 3976–3997. [Google Scholar] [CrossRef]
- Ahmad, S.; Steen, J.; Ali, S.; Valenta, R. Carbon-adjusted efficiency and technology gaps in gold mining. Resour. Policy 2023, 81, 103327. [Google Scholar] [CrossRef]
- Farrell, M.J. The Measurement of Productive Efficiency. J. R. Stat. Soc. Ser. A Gen. 1957, 120, 253–290. [Google Scholar] [CrossRef]
- Färe, R.; Grosskopf, S.; Norris, M.; Zhang, Z. Productivity Growth, Technical Progress, and Efficiency Change in Industrialized Countries. Am. Econ. Rev. 1994, 84, 66–83. [Google Scholar]
- Nishimizu, M.; Page, J.M. Total Factor Productivity Growth, Technological Progress and Technical Efficiency Change: Dimensions of Productivity Change in Yugoslavia, 1965–1978. Econ. J. 1982, 92, 920–936. [Google Scholar] [CrossRef]
- Mahadevan, R.; Asafu-Adjaye, J. The productivity–inflation nexus: The case of the Australian mining sector. Energy Econ. 2005, 27, 209–224. [Google Scholar] [CrossRef]
- Parida, M.; Madheswaran, S. Effect of firm ownership on productivity: Empirical evidence from the Indian mining industry. Miner. Econ. 2021, 34, 87–103. [Google Scholar] [CrossRef]
- Syed, A.; Grafton, R.Q.; Kalirajan, K.; Parham, D. Multifactor productivity growth and the Australian mining sector. Aust. J. Agric. Resour. Econ. 2015, 59, 549–570. [Google Scholar] [CrossRef]
- Charnes, A.; Cooper, W.W.; Rhodes, E. Measuring the efficiency of decision making units. Eur. J. Oper. Res. 1978, 2, 429–444. [Google Scholar] [CrossRef]
- Schmidt, P.; Lovell, C.K. Estimating technical and allocative inefficiency relative to stochastic production and cost frontiers. J. Econ. 1979, 9, 343–366. [Google Scholar] [CrossRef]
- Ahmad, S.; Shankar, S.; Steen, J.; Verreynne, M.-L.; Burki, A.A. Using measures of efficiency for regionally-targeted smallholder policy intervention: The case of Pakistan’s horticulture sector. Land Use Policy 2021, 101, 105179. [Google Scholar] [CrossRef]
- Bravo-Ureta, B.E.; Pinheiro, A.E. Technical, Economic, and Allocative Efficiency in Peasant Farming: Evidence from the Dominican Republic. Dev. Econ. 1997, 35, 48–67. [Google Scholar] [CrossRef]
- Kalirajan, K.P. On measuring economic efficiency. J. Appl. Econom. 1990, 5, 75–85. [Google Scholar] [CrossRef]
- Ahmad, S.; Burki, A.A. Banking deregulation and allocative efficiency in Pakistan. Appl. Econ. 2016, 48, 1182–1196. [Google Scholar] [CrossRef]
- Burki, A.A.; Ahmad, S. Bank governance changes in Pakistan: Is there a performance effect? J. Econ. Bus. 2010, 62, 129–146. [Google Scholar] [CrossRef]
- Drake, J.; Swisdak, M.; Che, H.; Shay, M. Electron acceleration from contracting magnetic islands during reconnec-tion. Nature 2006, 443, 553–556. [Google Scholar] [CrossRef]
- Fukuyama, H.; Weber, W.L. Estimating output allocative efficiency and productivity change: Application to Japanese banks. Eur. J. Oper. Res. 2002, 137, 177–190. [Google Scholar] [CrossRef]
- Isaiah, M.; Johane, D.; Dambala, G.; Fiona, T. Environmental and Technical Efficiency in Large Gold Mines in Developing Countries. MPRA Paper. 2021. Available online: https://ideas.repec.org/p/pra/mprapa/108068.html (accessed on 7 November 2023).
- Shao, L.; He, Y.; Feng, C.; Zhang, S. An empirical analysis of total-factor productivity in 30 sub-sub-sectors of China’s nonferrous metal industry. Resour. Policy 2016, 50, 264–269. [Google Scholar] [CrossRef]
- Grifell-Tatjé, E.; Lovell, C.A.K. Productivity, price recovery, capacity constraints and their financial consequences. J. Prod. Anal. 2014, 41, 3–17. [Google Scholar] [CrossRef][Green Version]
- Topp, V. Productivity in the Mining Industry: Measurement and Interpretation; productivity commission staff working paper; Australian Productivity Commission: Canberra, Australia, 2008. [Google Scholar]
- Ilboudo, P.S. Foreign Direct Investment and Total Factor Productivity in the Mining Sector: The Case of Chile; Connecticut College: New London, CT, USA, 2014. [Google Scholar]
- De Solminihac, H.; Gonzales, L.E.; Cerda, R. Copper mining productivity: Lessons from Chile. J. Policy Model. 2018, 40, 182–193. [Google Scholar] [CrossRef]
- Oliveira, R.; Camanho, A.S.; Zanella, A. Expanded eco-efficiency assessment of large mining firms. J. Clean. Prod. 2017, 142, 2364–2373. [Google Scholar] [CrossRef]
- Jorgenson, D.W.; Griliches, Z. The Explanation of Productivity Change. Rev. Econ. Stud. 1967, 34, 249–283. [Google Scholar] [CrossRef]
- O’Donnell, C.J. Nonparametric Estimates of the Components of Productivity and Profitability Change in U.S. Agriculture. Am. J. Agric. Econ. 2012, 94, 873–890. [Google Scholar] [CrossRef]
- Solow, R.M. Technical Change and the Aggregate Production Function. Rev. Econ. Stat. 1957, 39, 312. [Google Scholar] [CrossRef]
- Carlaw, K.I.; Lipsey, R.G. Productivity, Technology and Economic Growth: What is the Relationship? J. Econ. Surv. 2003, 17, 457–495. [Google Scholar] [CrossRef]
- Crowson, P. Mine size and the structure of costs. Resour. Policy 2003, 29, 15–36. [Google Scholar] [CrossRef]
- Bozorgebrahimi, A.; Hall, R.A.; Morin, M.A. Equipment size effects on open pit mining performance. Int. J. Surf. Min. Reclam. Environ. 2005, 19, 41–56. [Google Scholar] [CrossRef]
- Yatchew, A. An elementary estimator of the partial linear model. Econ. Lett. 1997, 57, 135–143. [Google Scholar] [CrossRef]
- Kulshreshtha, M.; Parikh, J.K. Study of efficiency and productivity growth in opencast and underground coal mining in India: A DEA analysis. Energy Econ. 2002, 24, 439–453. [Google Scholar] [CrossRef]
- Triebs, T.P.; Saal, D.S.; Arocena, P. Estimating economies of scale and scope with flexible technology. J. Prod. Anal. 2016, 45, 173–186. [Google Scholar] [CrossRef]
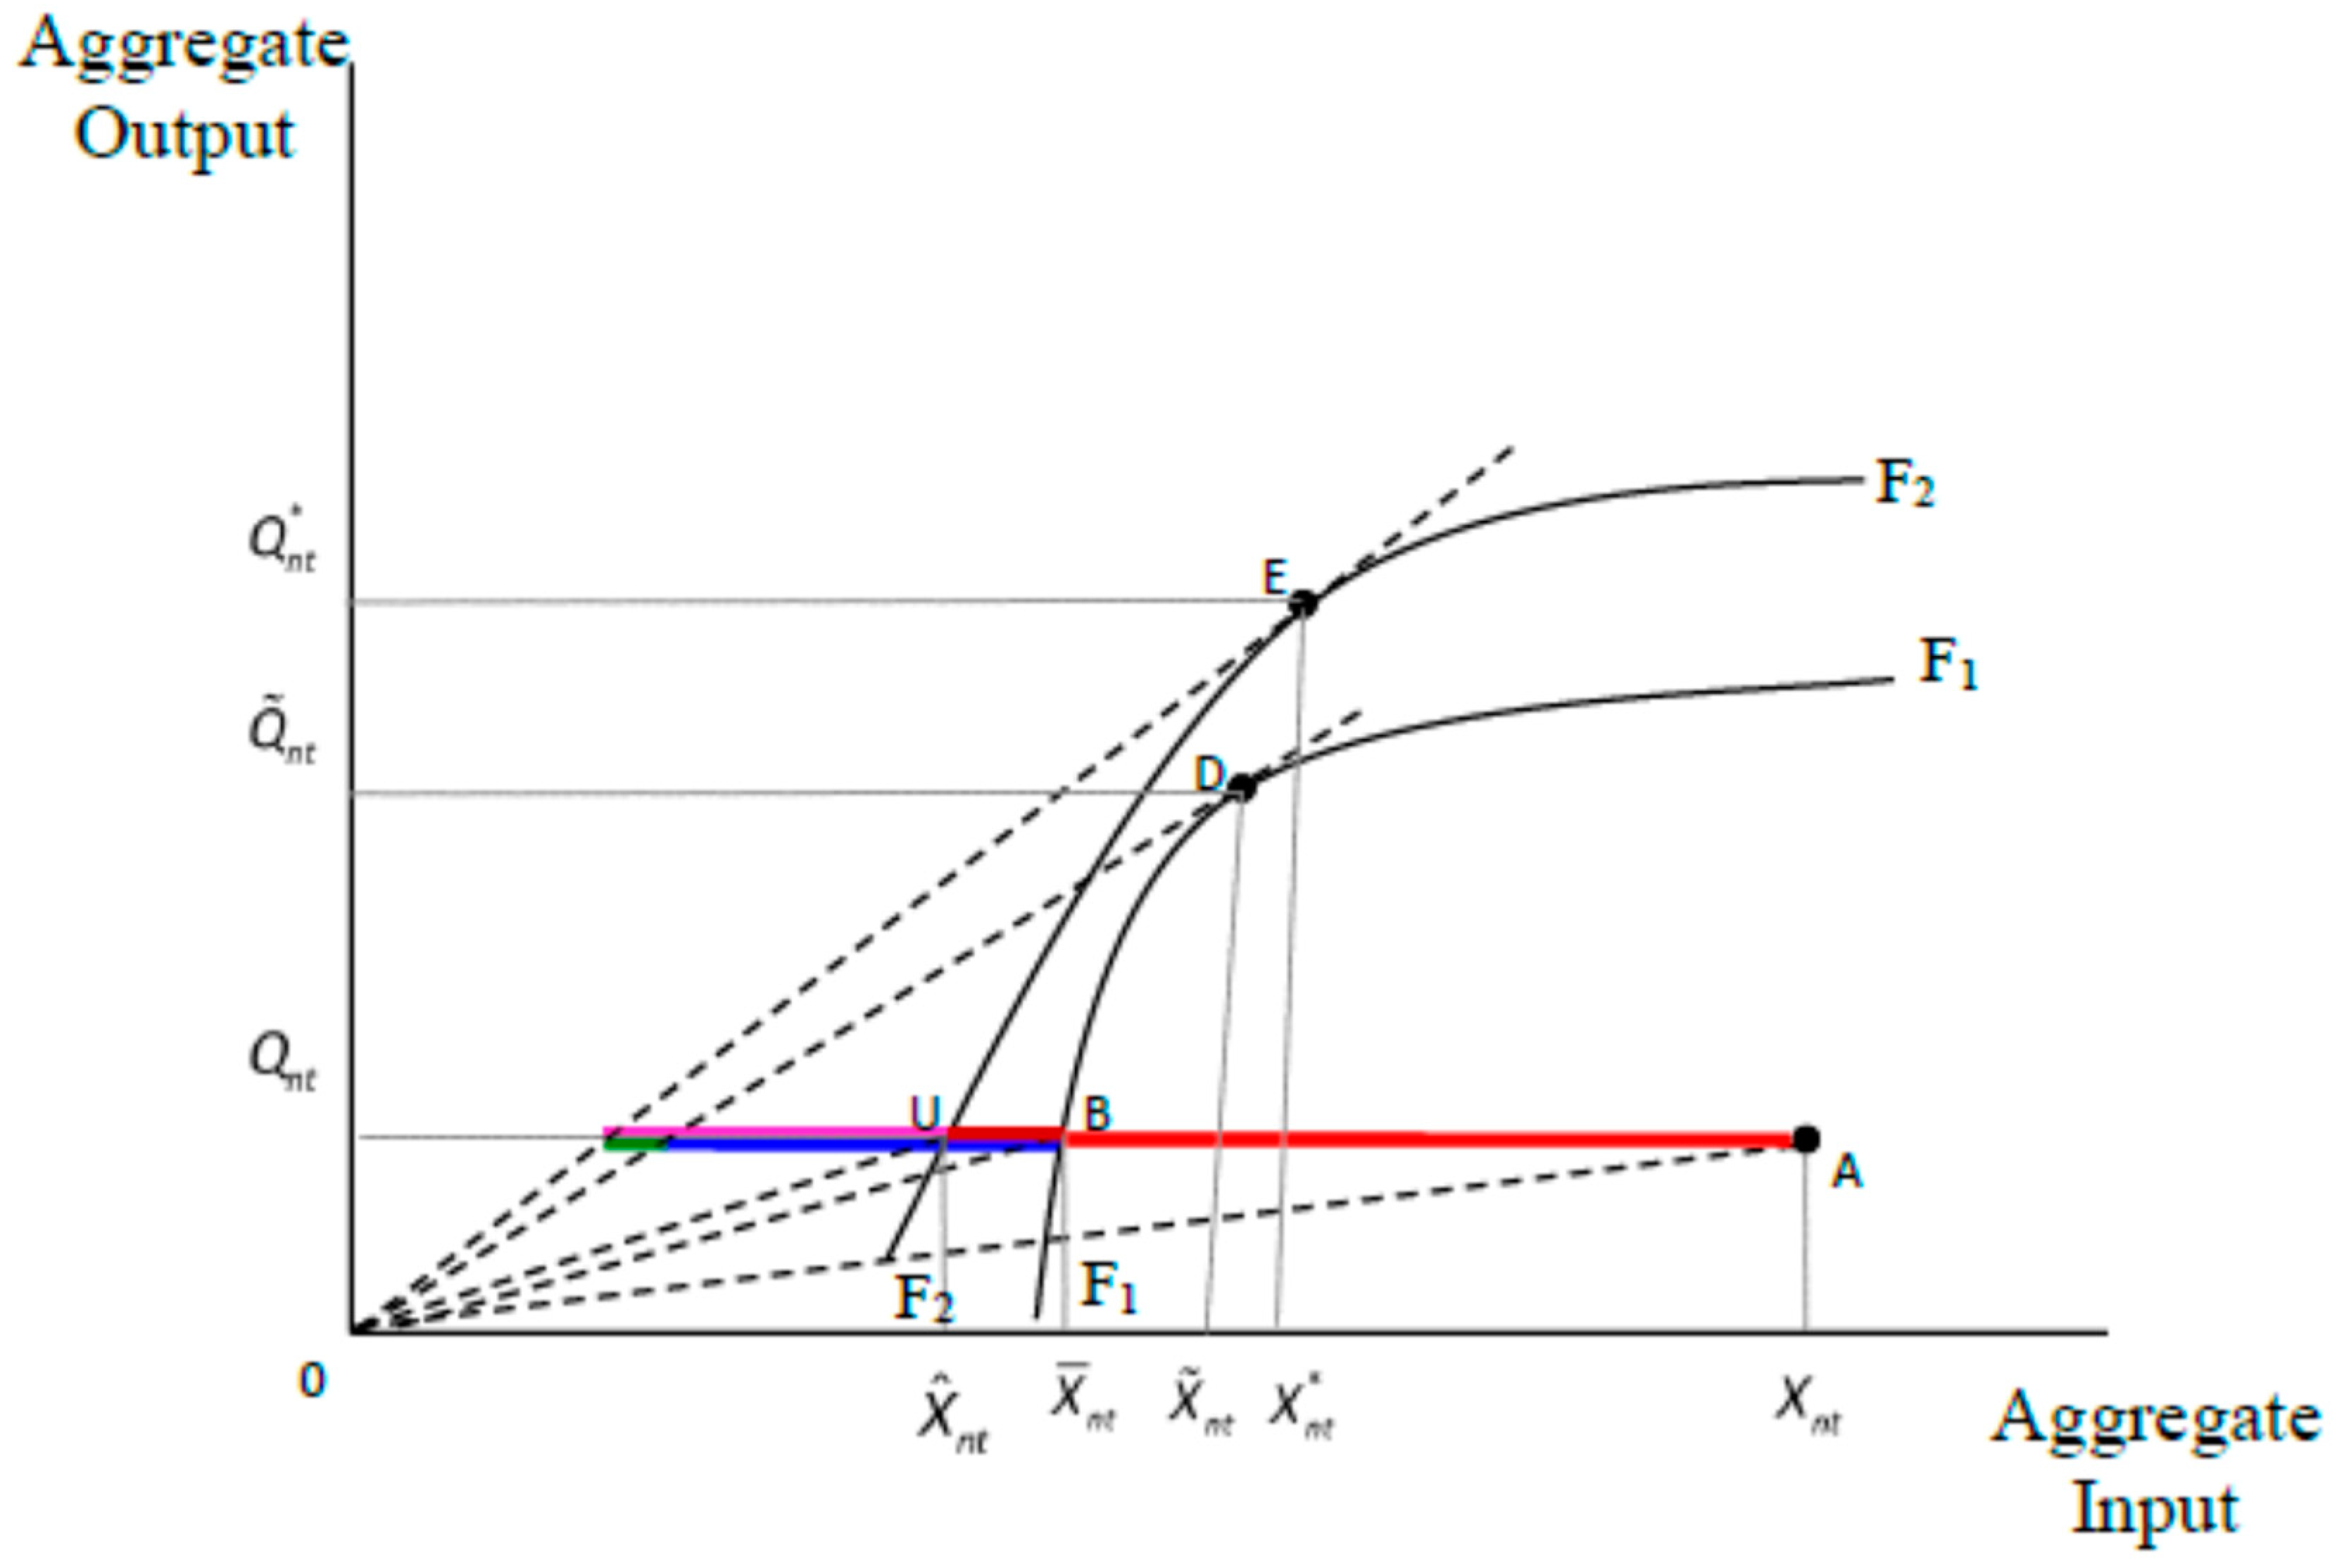
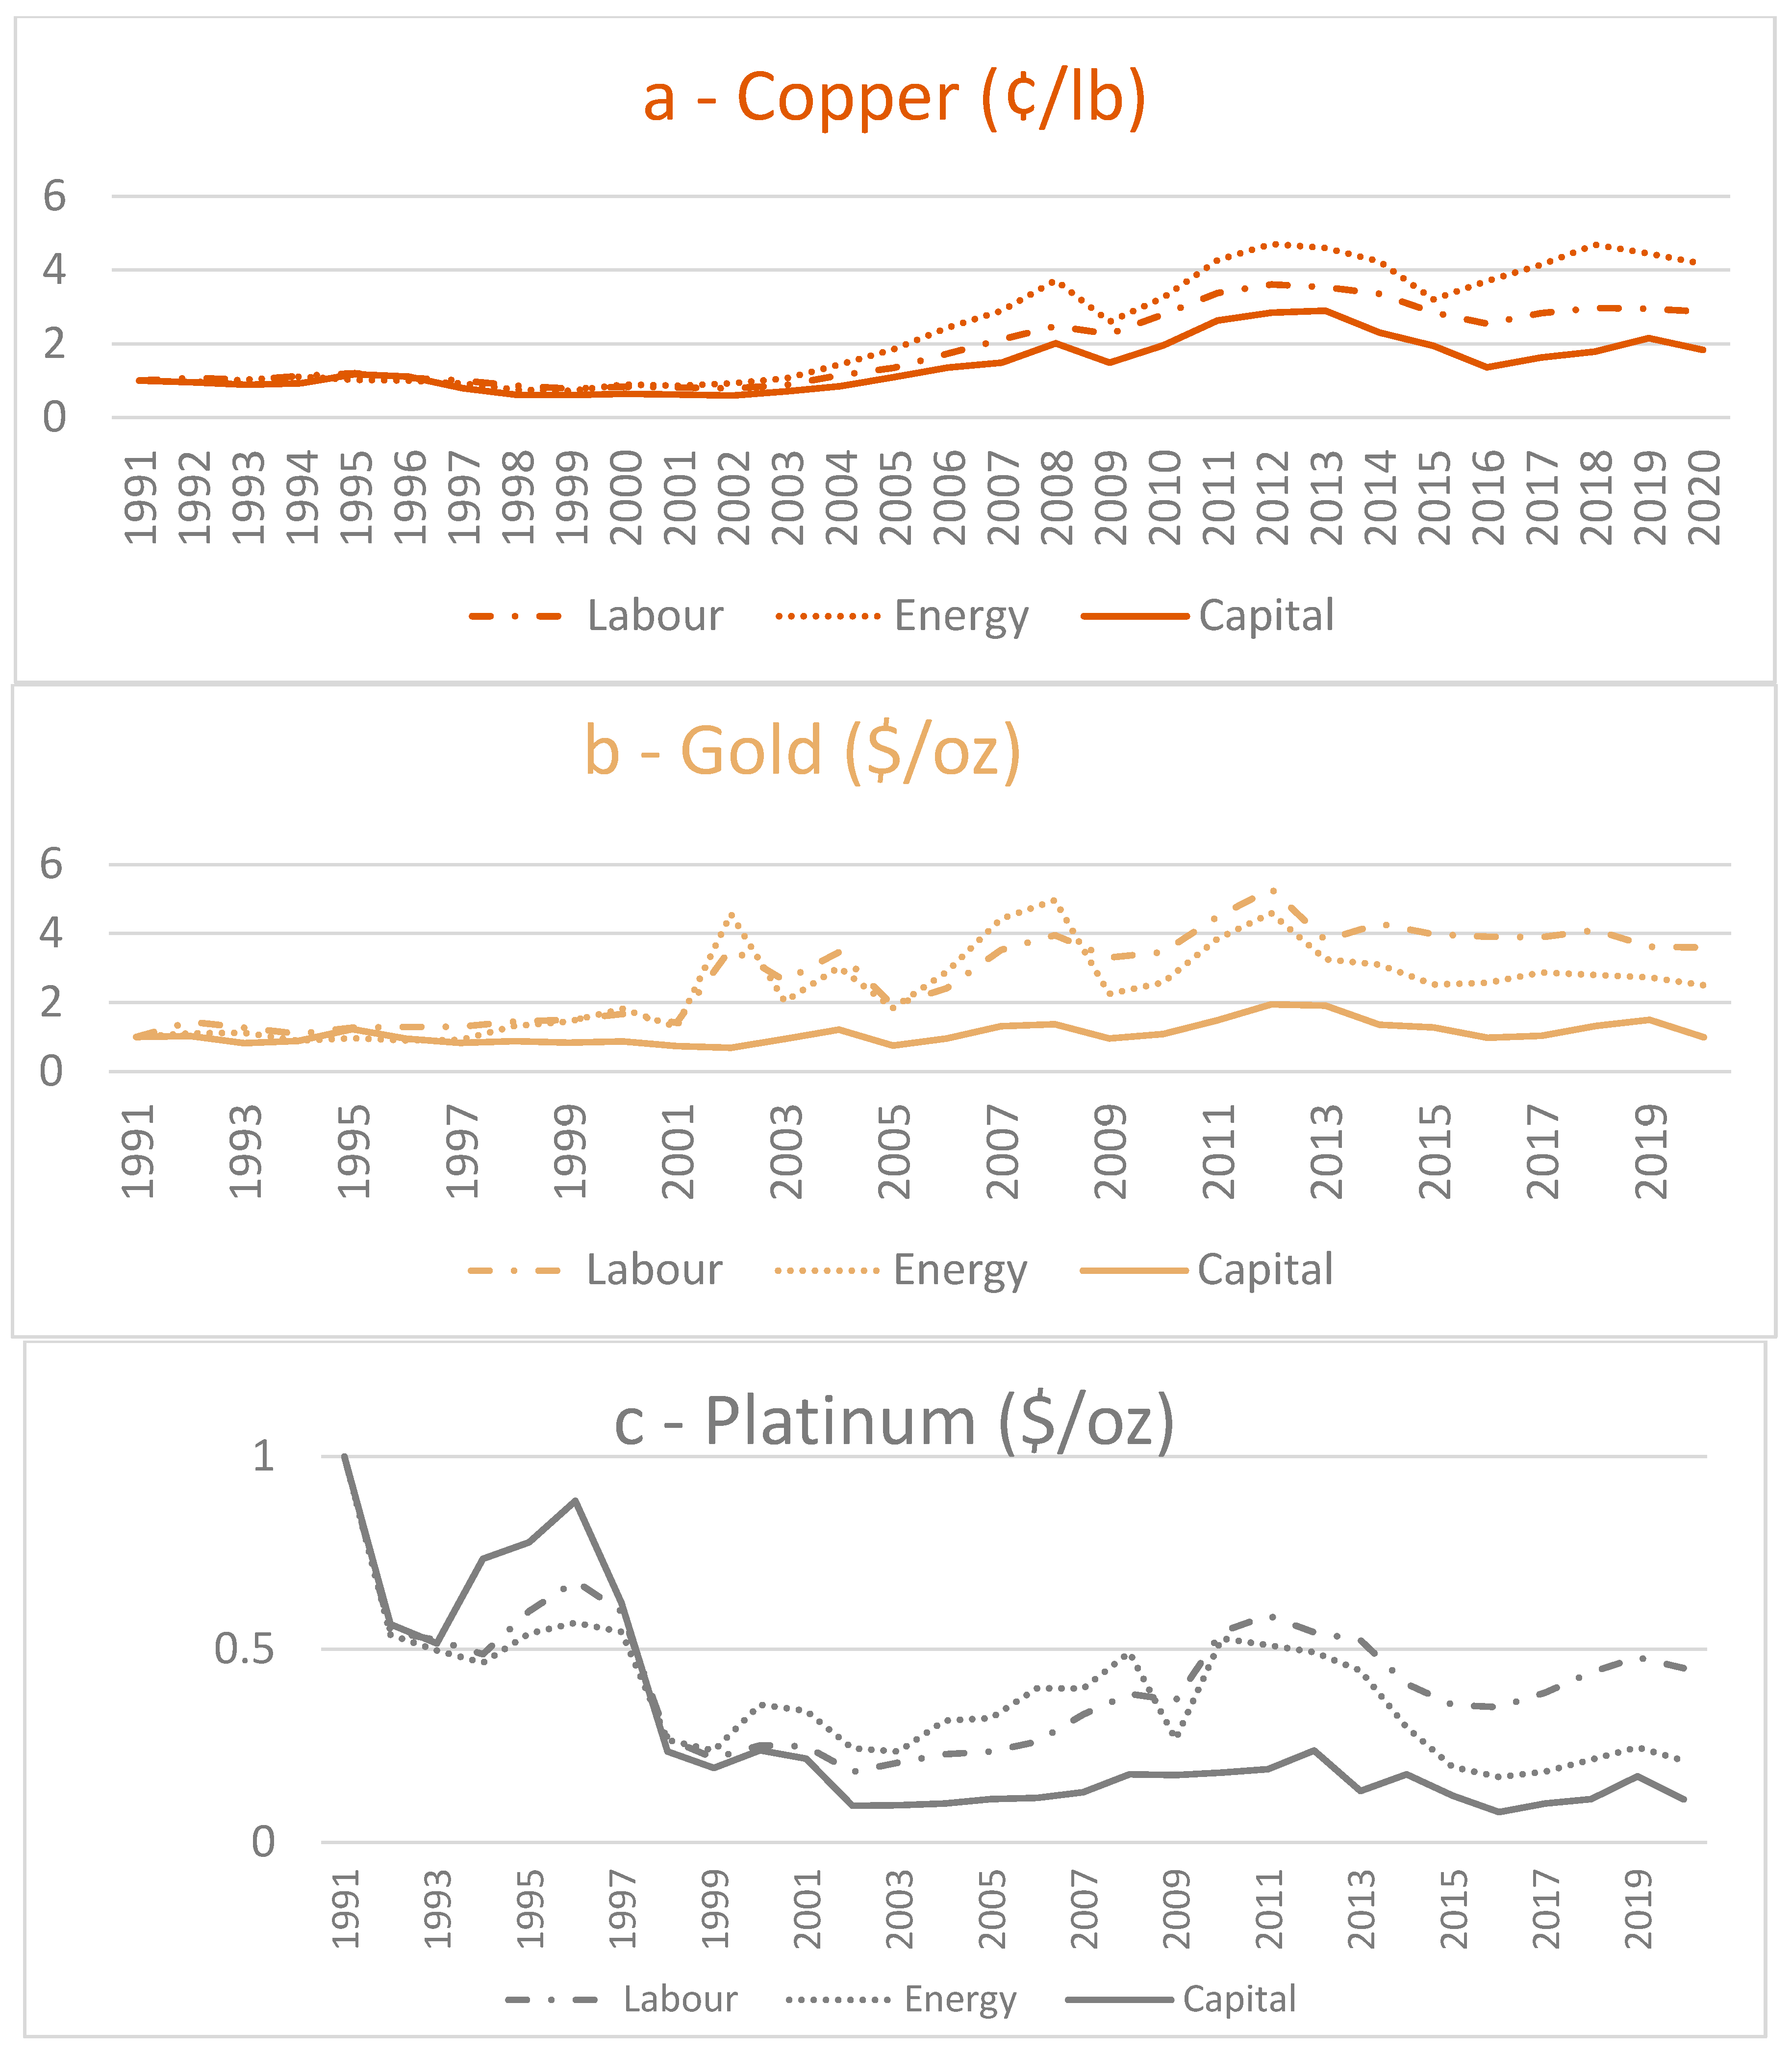
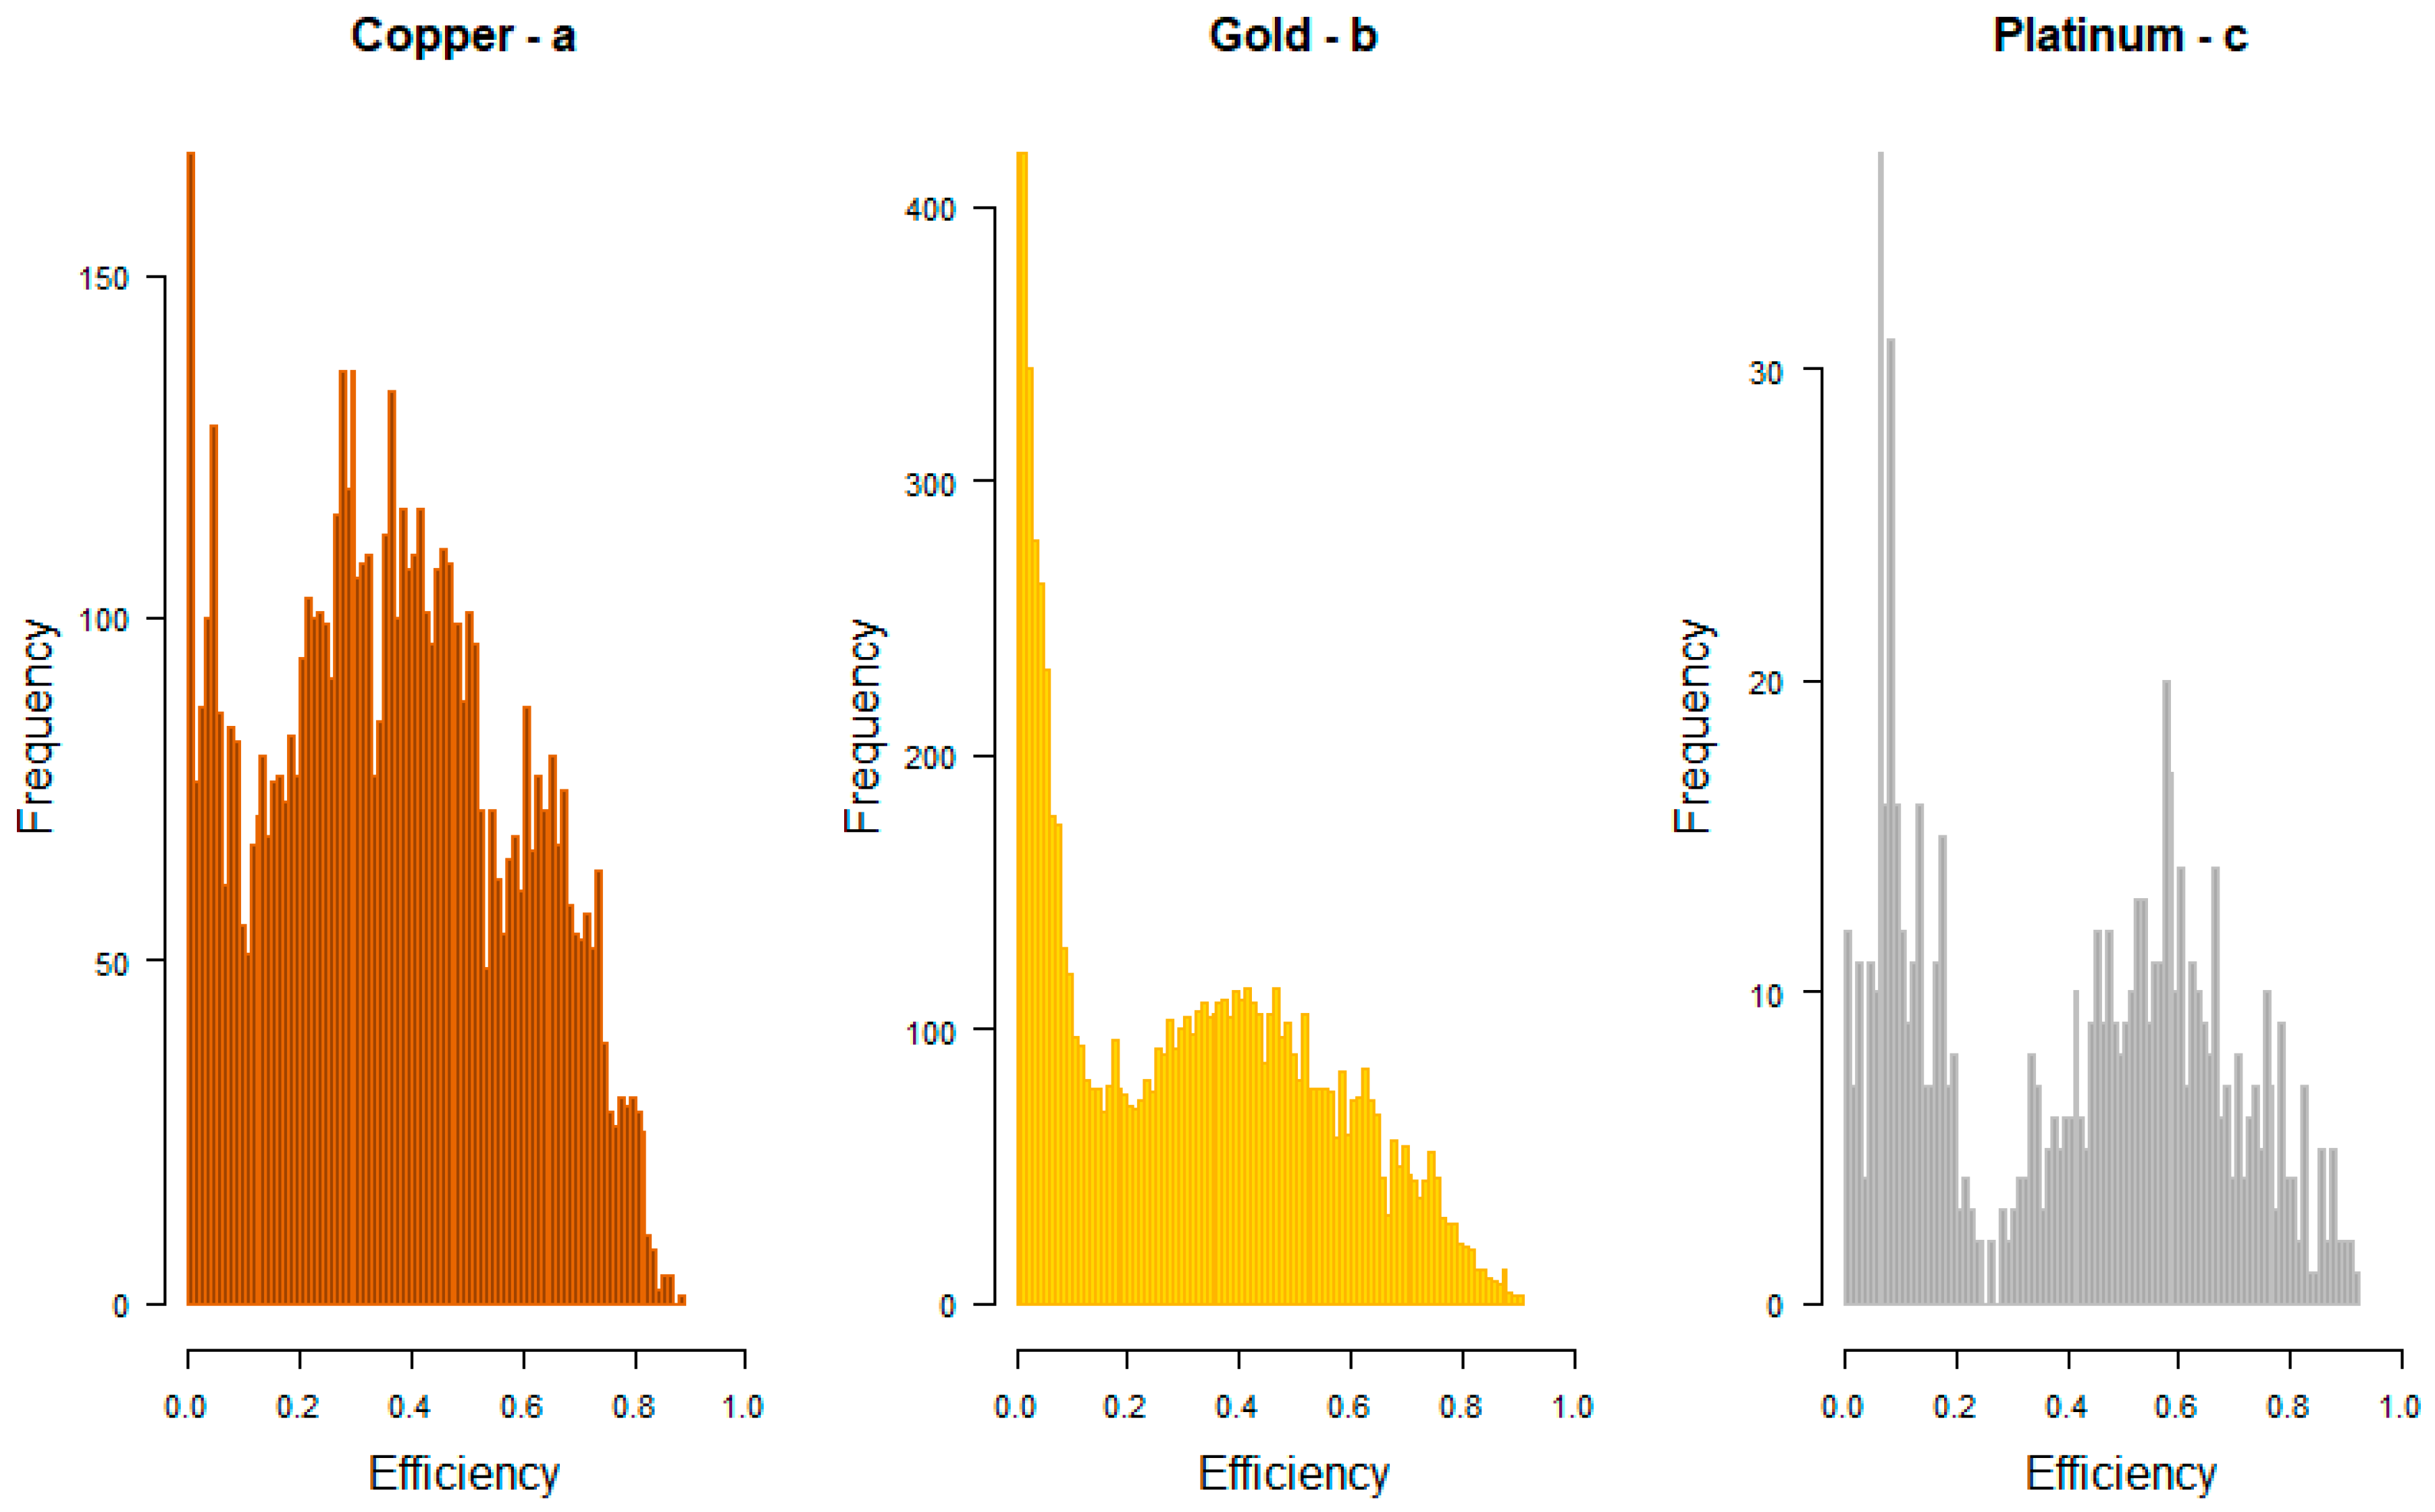
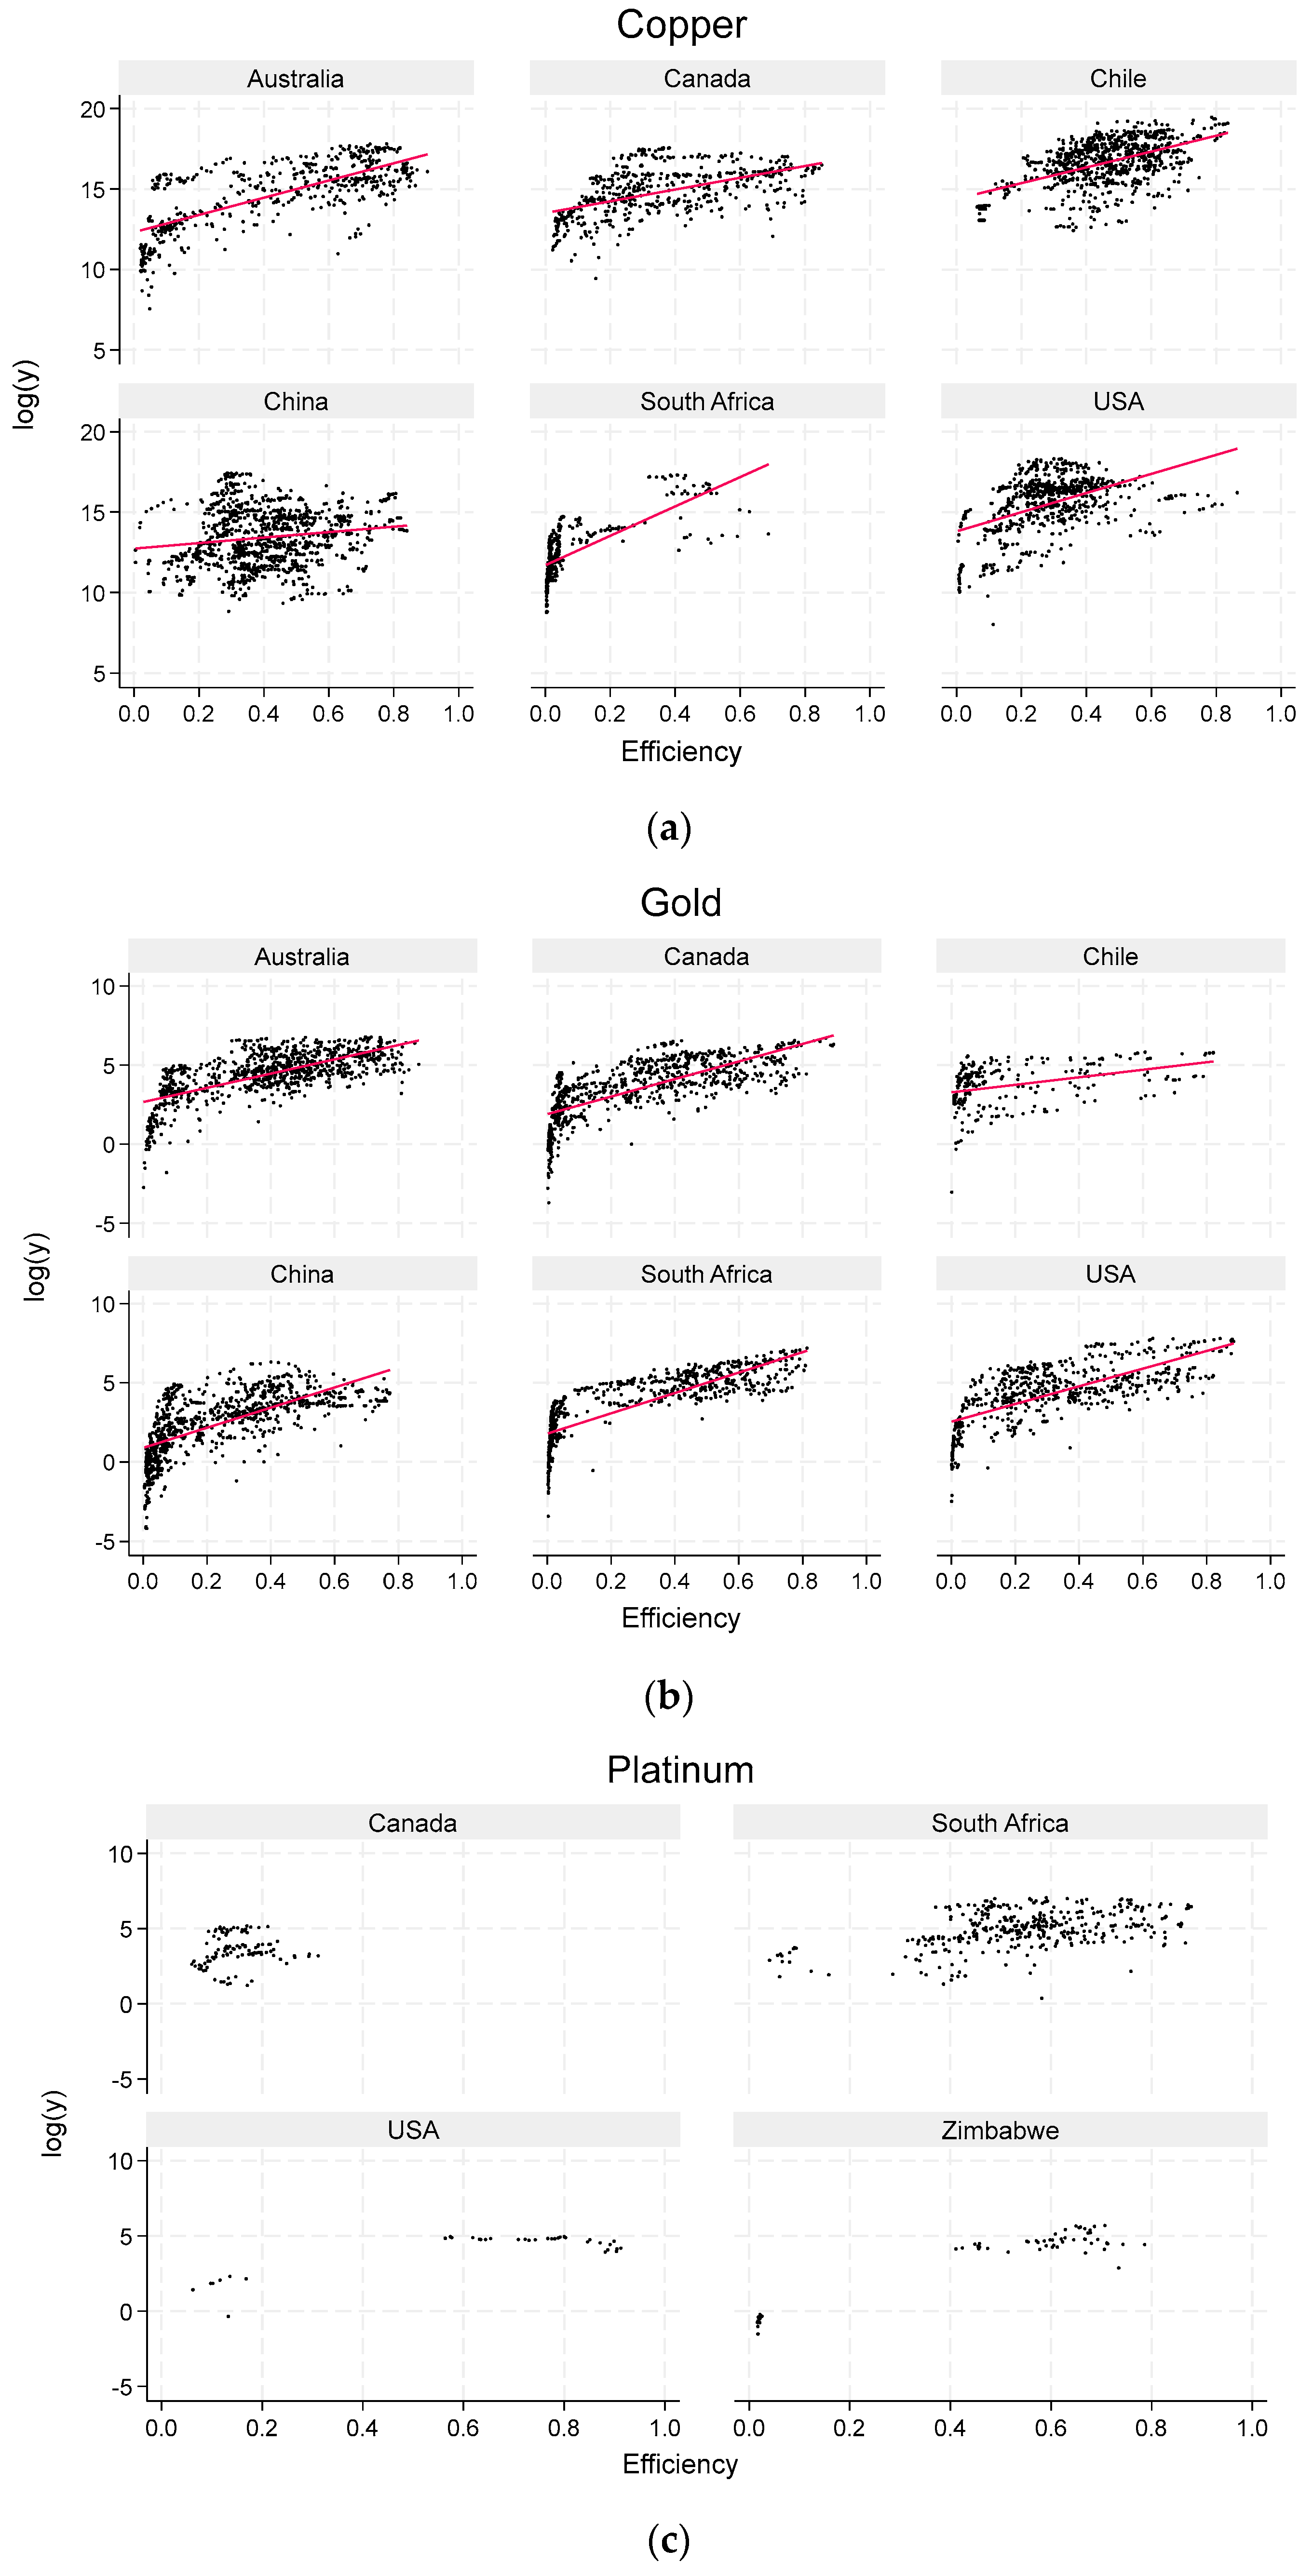
| Variables | Description | Copper | Gold | Platinum |
|---|---|---|---|---|
| log(y) | Output (Tonnes) | 14.81 | 5.38 | 3.71 |
| (2.13) | (2.24) | (1.94) | ||
| log(lab) | Labour ($) | 21.89 | 9.81 | 9.89 |
| (1.56) | (1.43) | (1.44) | ||
| log(fuel) | Fuel ($) | 21.42 | 9.20 | 9.26 |
| (1.58) | (1.43) | (1.38) | ||
| log(cap) | Capital ($) | 21.21 | 9.26 | 9.34 |
| (1.86) | (1.67) | (1.66) | ||
| log(ore) | Ore (Tonnes) | 22.81 | 22.11 | 22.34 |
| (1.81) | (1.60) | (1.59) | ||
| N | Number of observations | 6706 | 8895 | 8247 |
Disclaimer/Publisher’s Note: The statements, opinions and data contained in all publications are solely those of the individual author(s) and contributor(s) and not of MDPI and/or the editor(s). MDPI and/or the editor(s) disclaim responsibility for any injury to people or property resulting from any ideas, methods, instructions or products referred to in the content. |
© 2023 by the author. Licensee MDPI, Basel, Switzerland. This article is an open access article distributed under the terms and conditions of the Creative Commons Attribution (CC BY) license (https://creativecommons.org/licenses/by/4.0/).
Share and Cite
Ahmad, S. Innovation and Drivers of Productivity: A Global Analysis of Selected Critical Minerals. Commodities 2023, 2, 417-432. https://doi.org/10.3390/commodities2040024
Ahmad S. Innovation and Drivers of Productivity: A Global Analysis of Selected Critical Minerals. Commodities. 2023; 2(4):417-432. https://doi.org/10.3390/commodities2040024
Chicago/Turabian StyleAhmad, Shabbir. 2023. "Innovation and Drivers of Productivity: A Global Analysis of Selected Critical Minerals" Commodities 2, no. 4: 417-432. https://doi.org/10.3390/commodities2040024
APA StyleAhmad, S. (2023). Innovation and Drivers of Productivity: A Global Analysis of Selected Critical Minerals. Commodities, 2(4), 417-432. https://doi.org/10.3390/commodities2040024


