
‘Safe Assets’ during COVID-19: A Portfolio Management Perspective


Abstract
1. Introduction
- Hedge: An asset that is uncorrelated or negatively correlated with another asset or portfolio on average. A strict hedge is (strictly) negatively correlated with another asset or a portfolio on average.
- Diversifier: An asset that is positively (but not perfectly correlated) with another asset or portfolio on average.
- Safe haven: An asset that is uncorrelated or negatively correlated with another asset or portfolio in times of market stress or turmoil.
- Gold,
- U.S. government bonds,
- German government bonds,
- The Swiss franc,
- The Japanese yen.
2. Literature Review
2.1. On the Safe-Haven Regression Framework
2.2. First Contributions on Safe Havens during COVID-19
2.3. On the Classic Role of Gold as Safe Haven
2.4. On the Role of Alternative Assets as Safe Haven, Such as Bitcoin
3. Data and Methods
3.1. Data Sample
3.1.1. A Focus on Gold-Based Cryptocurrencies
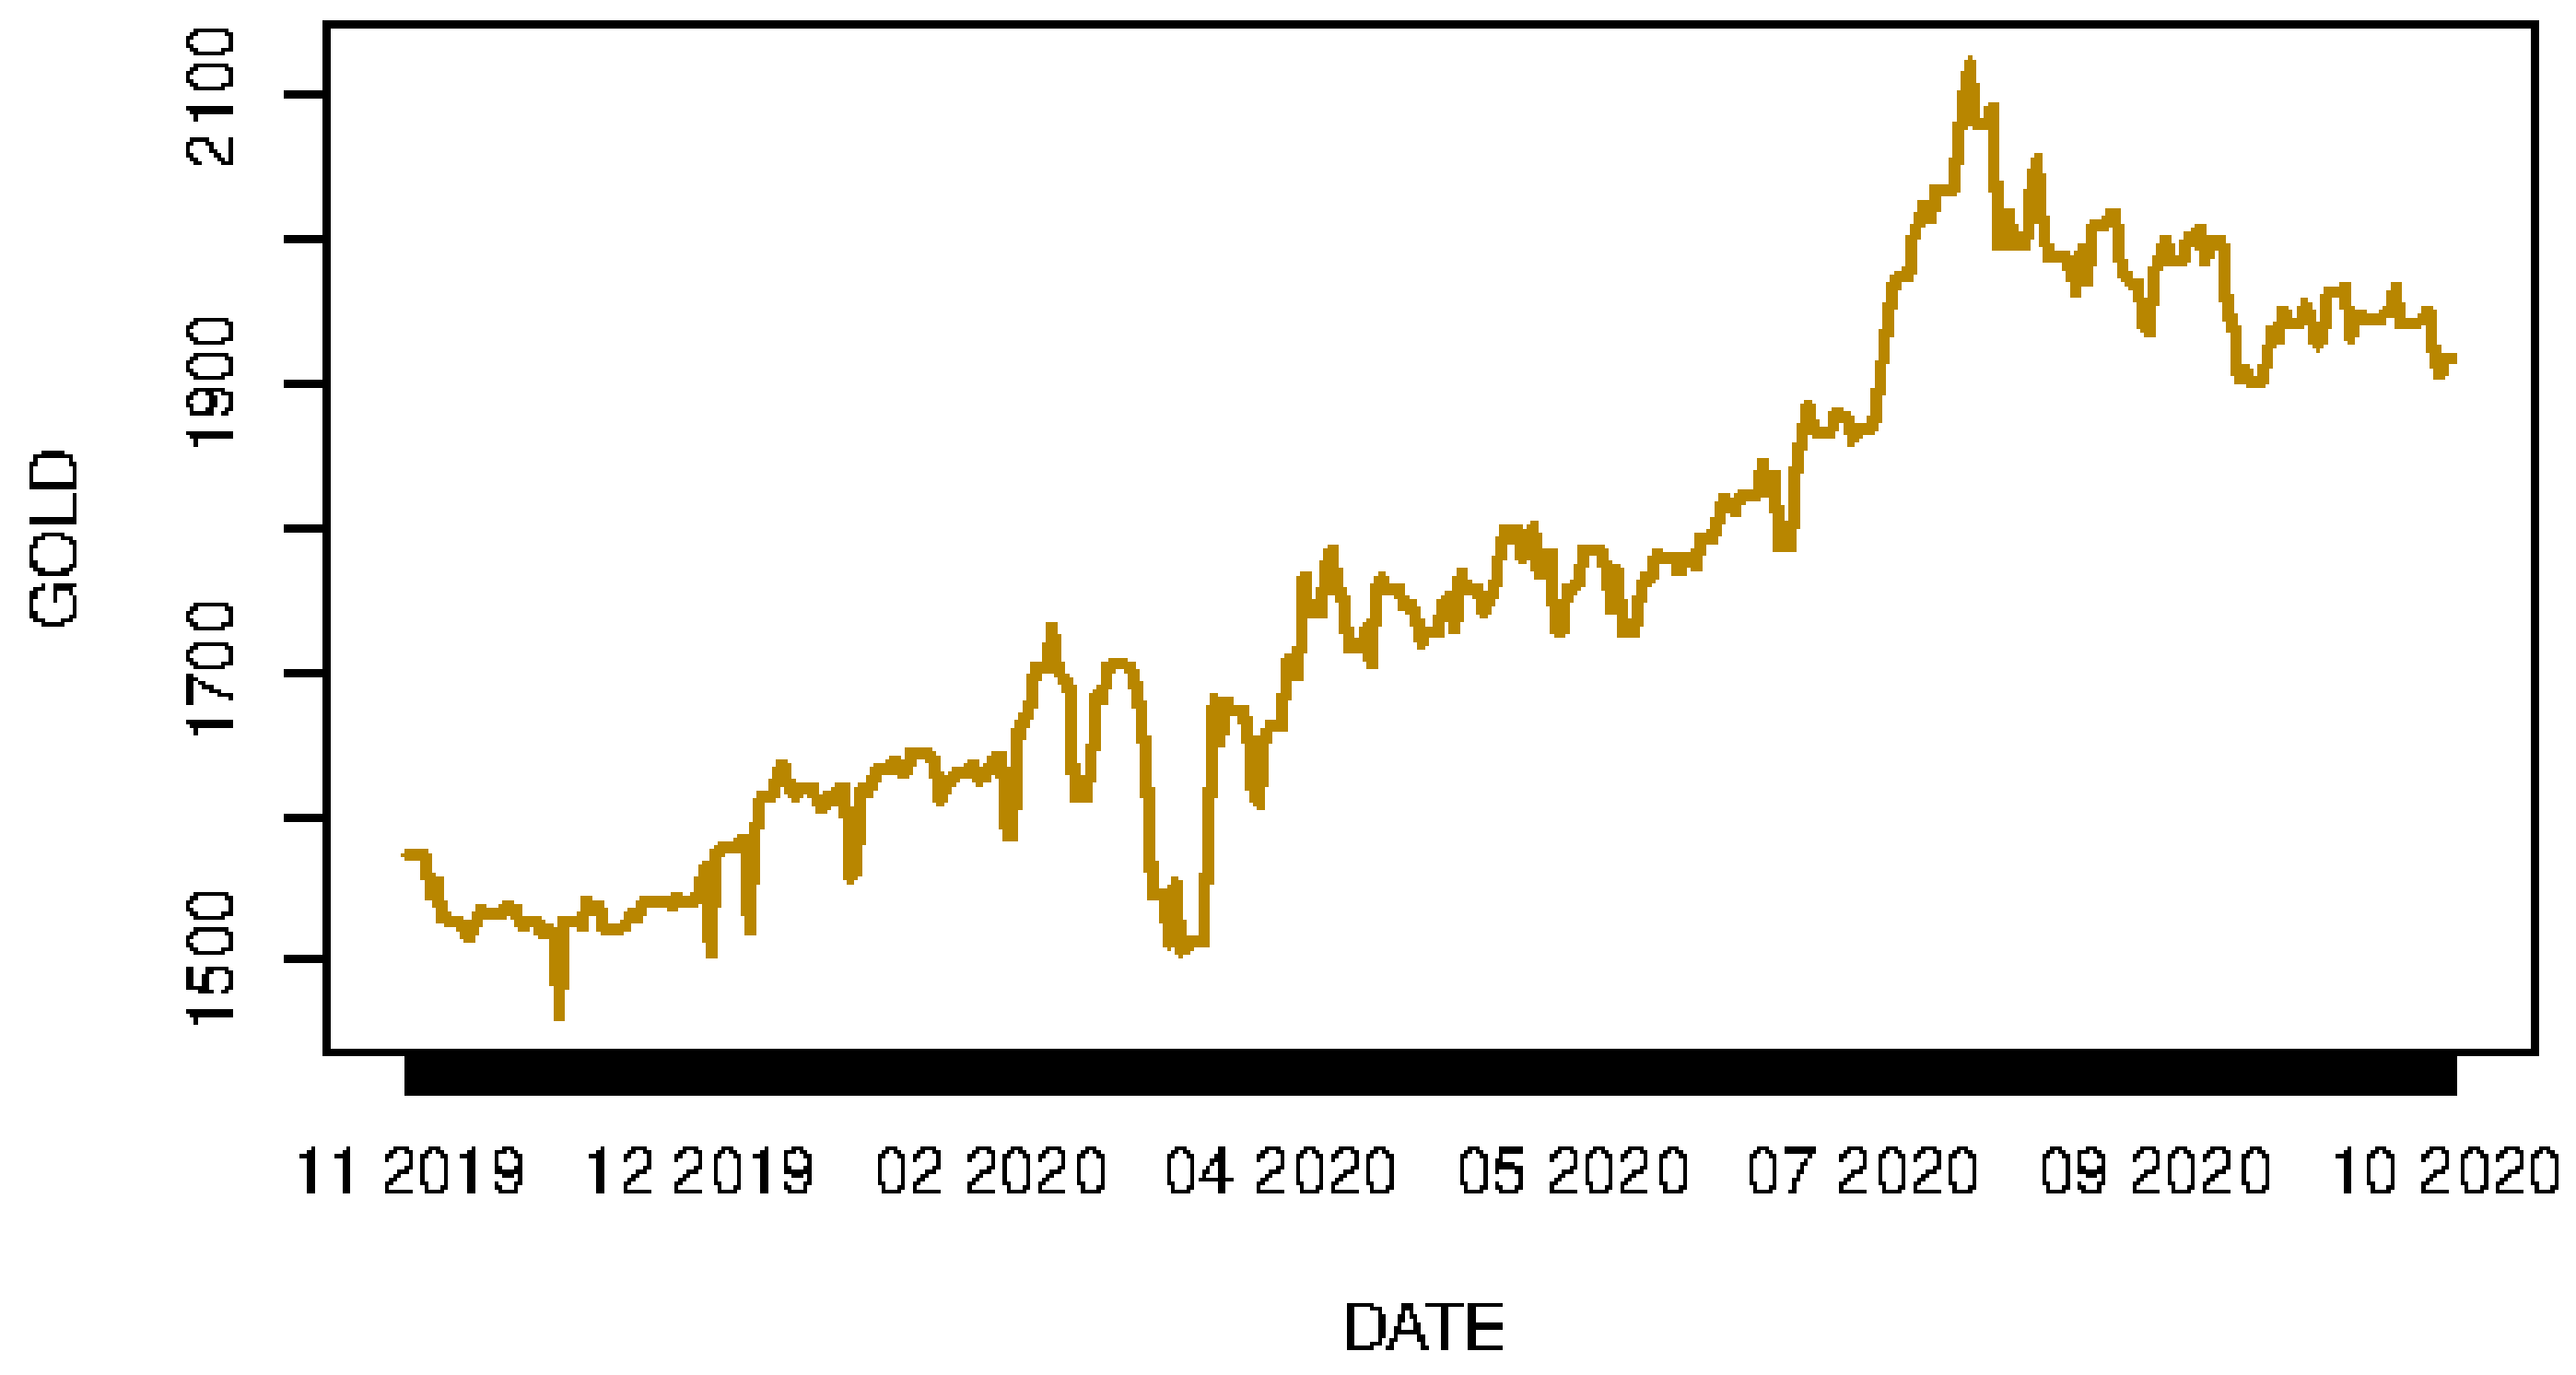
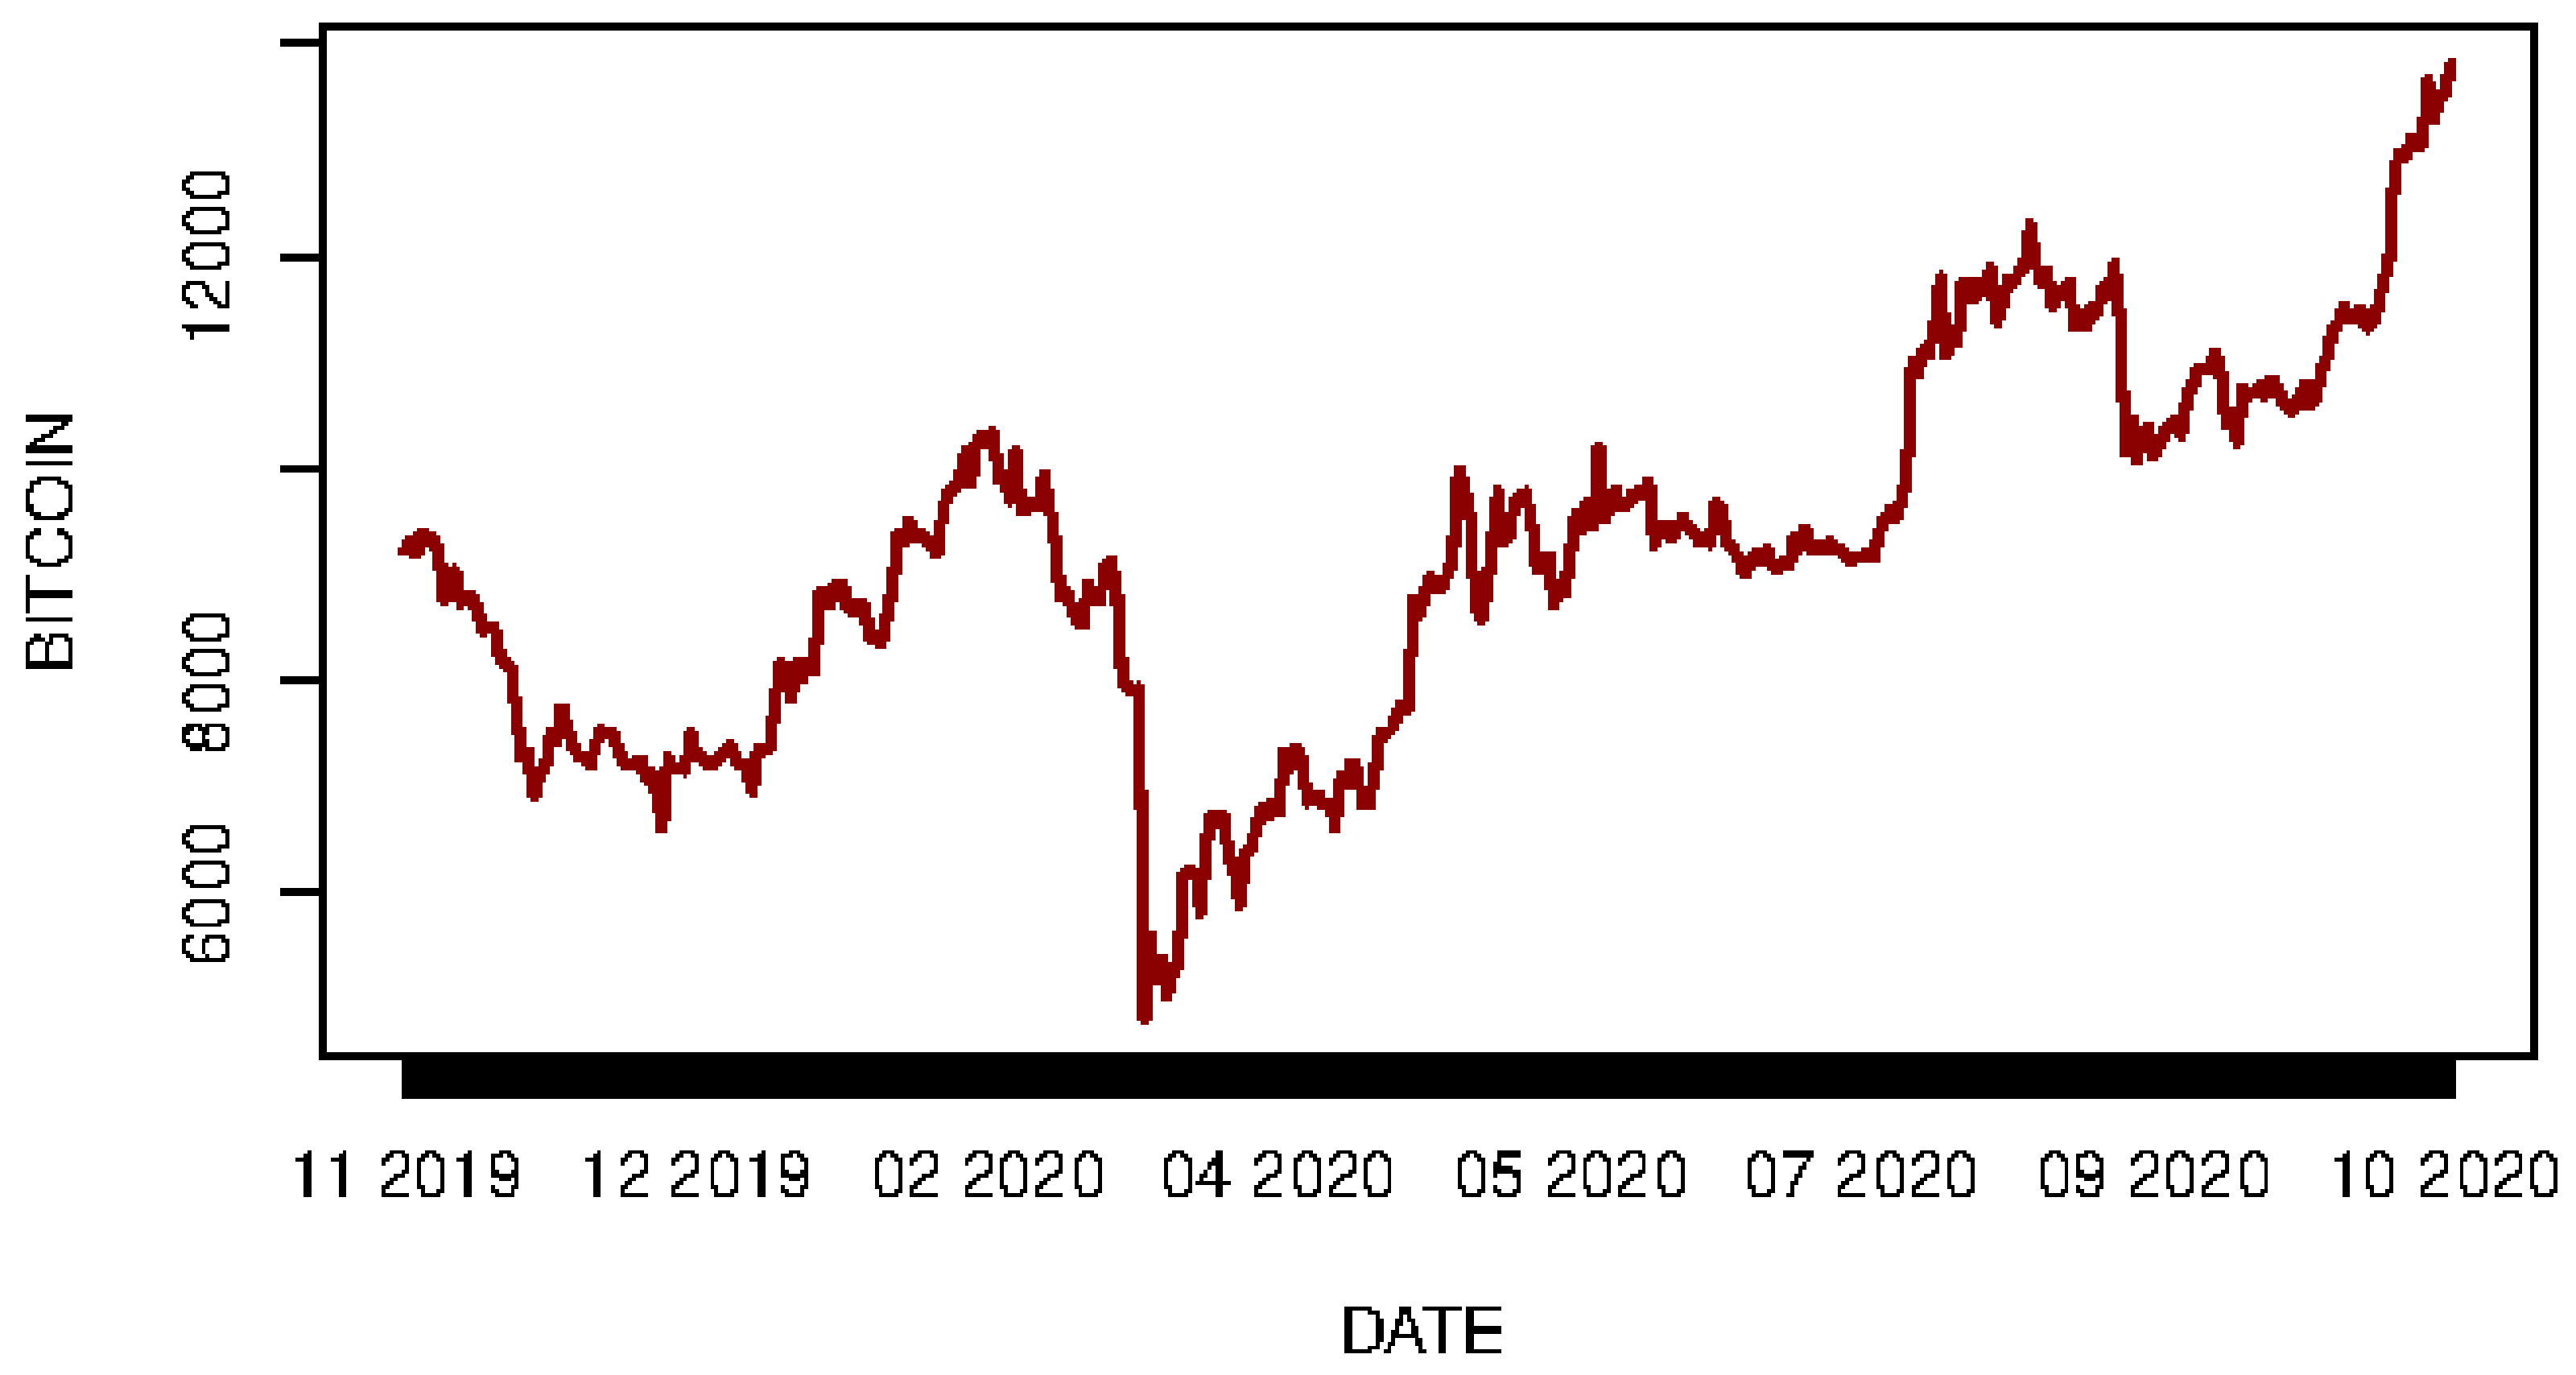
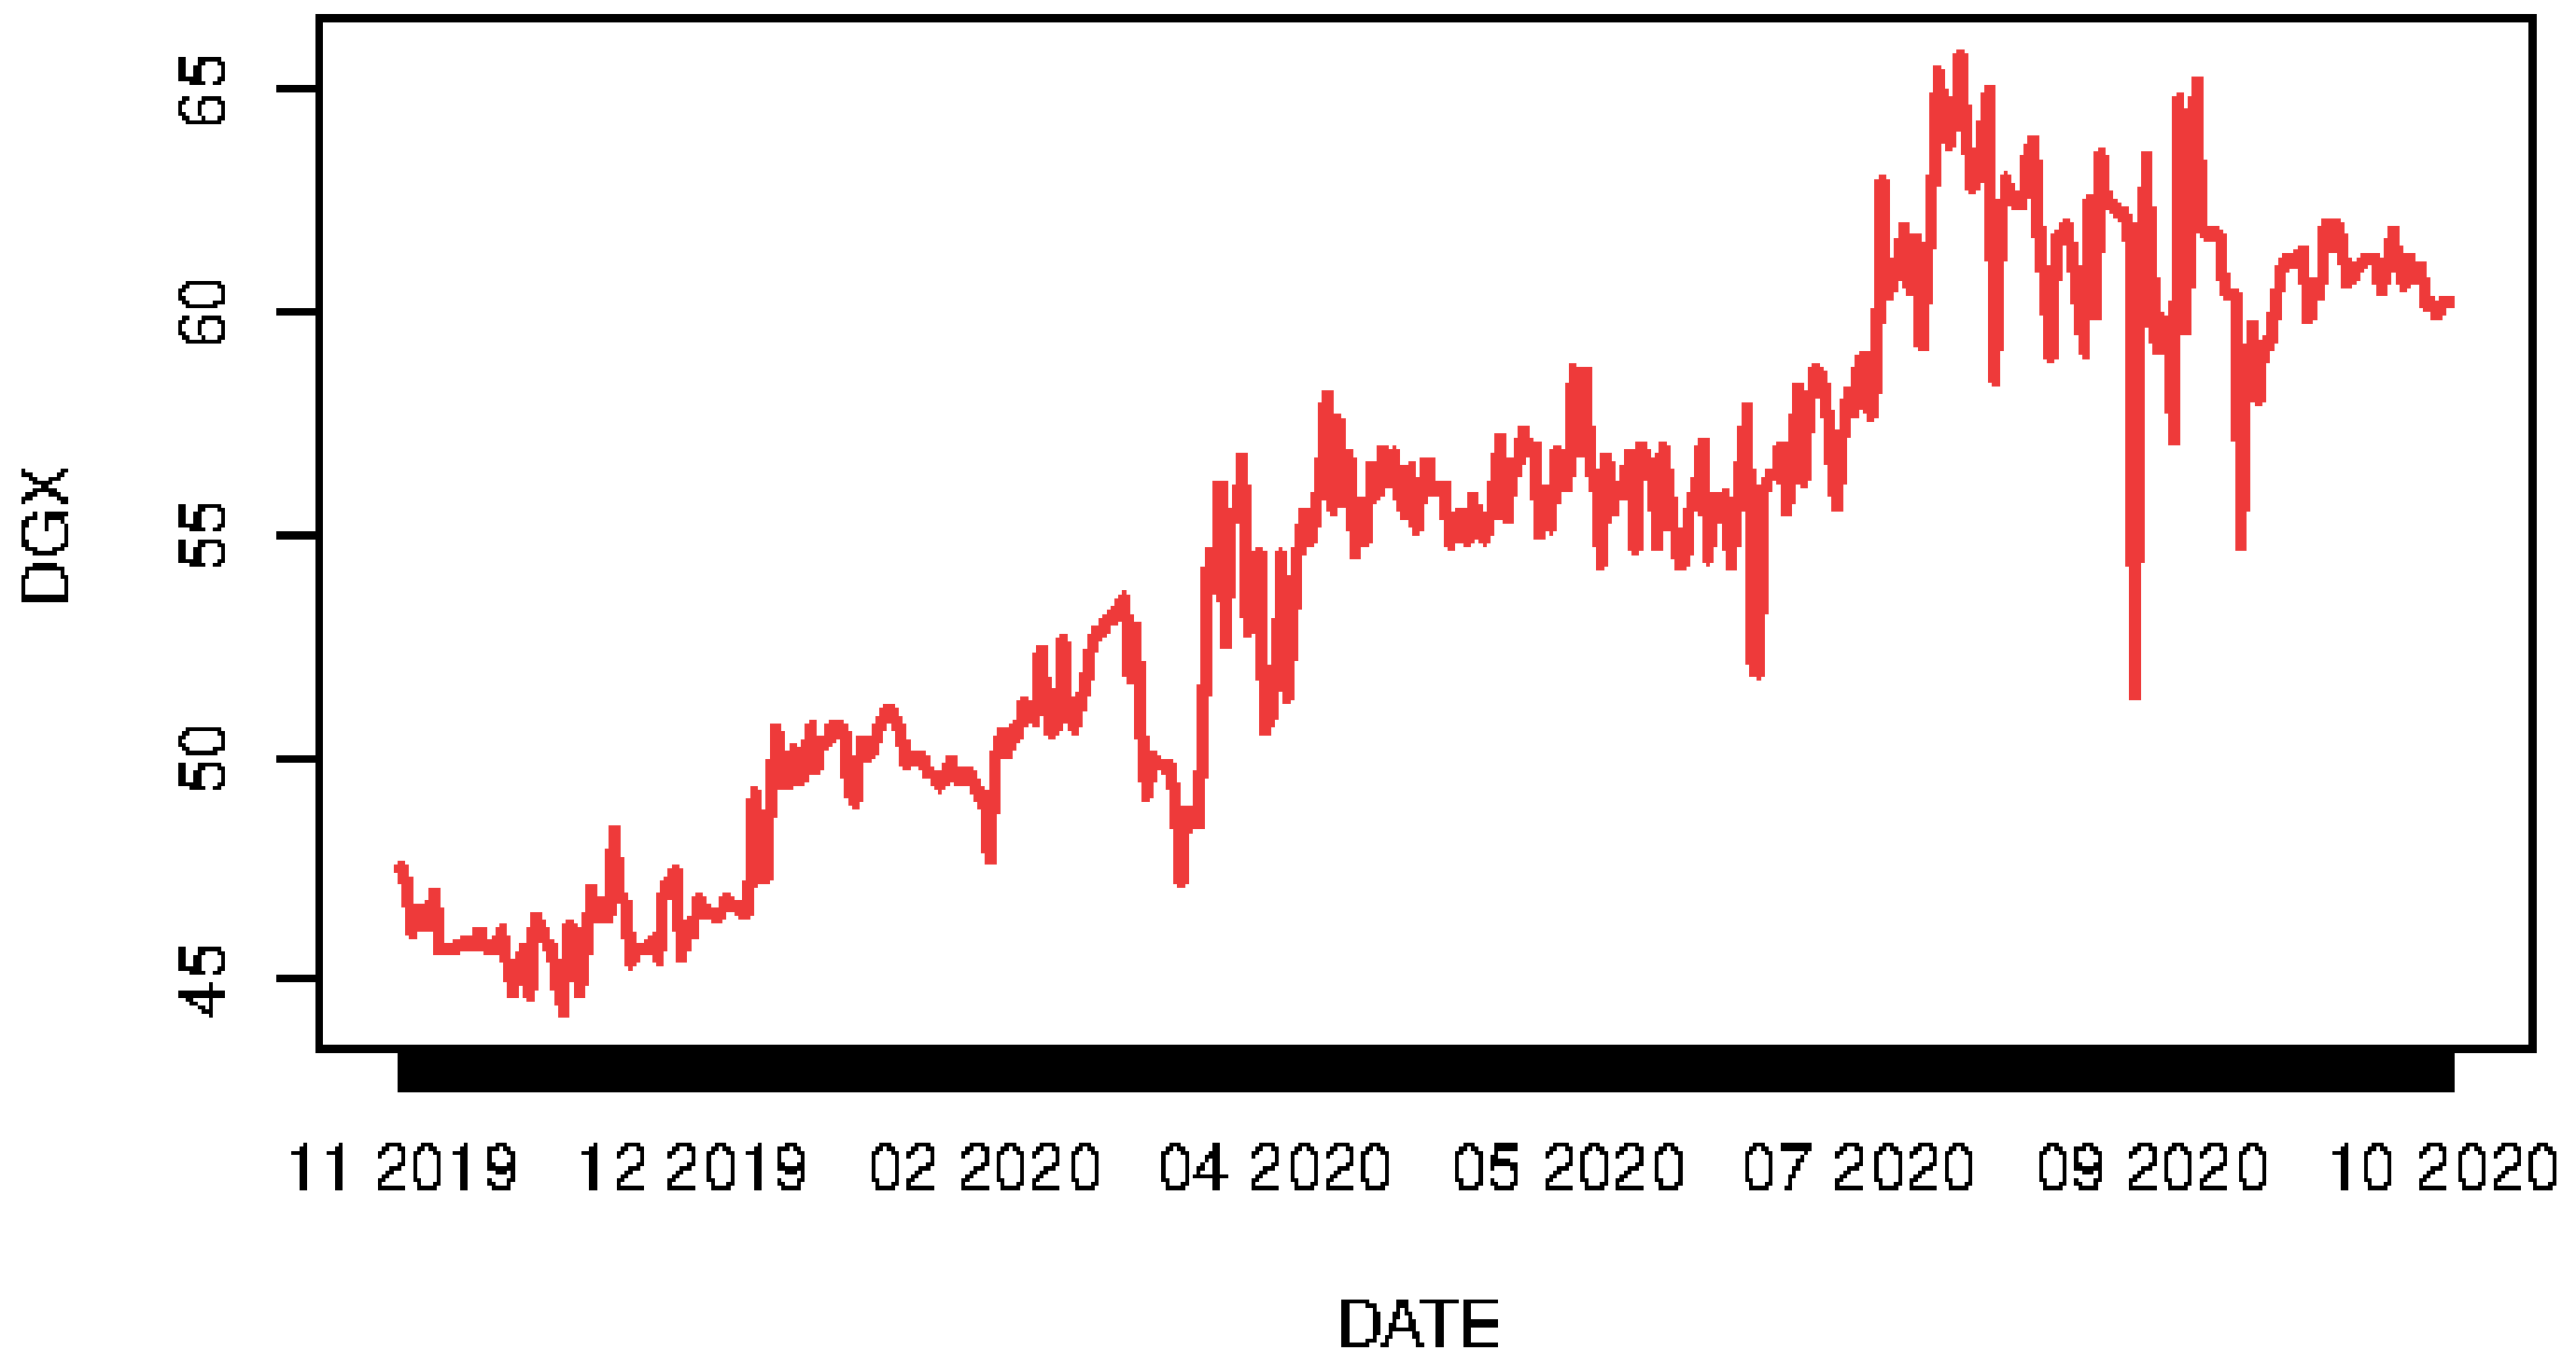
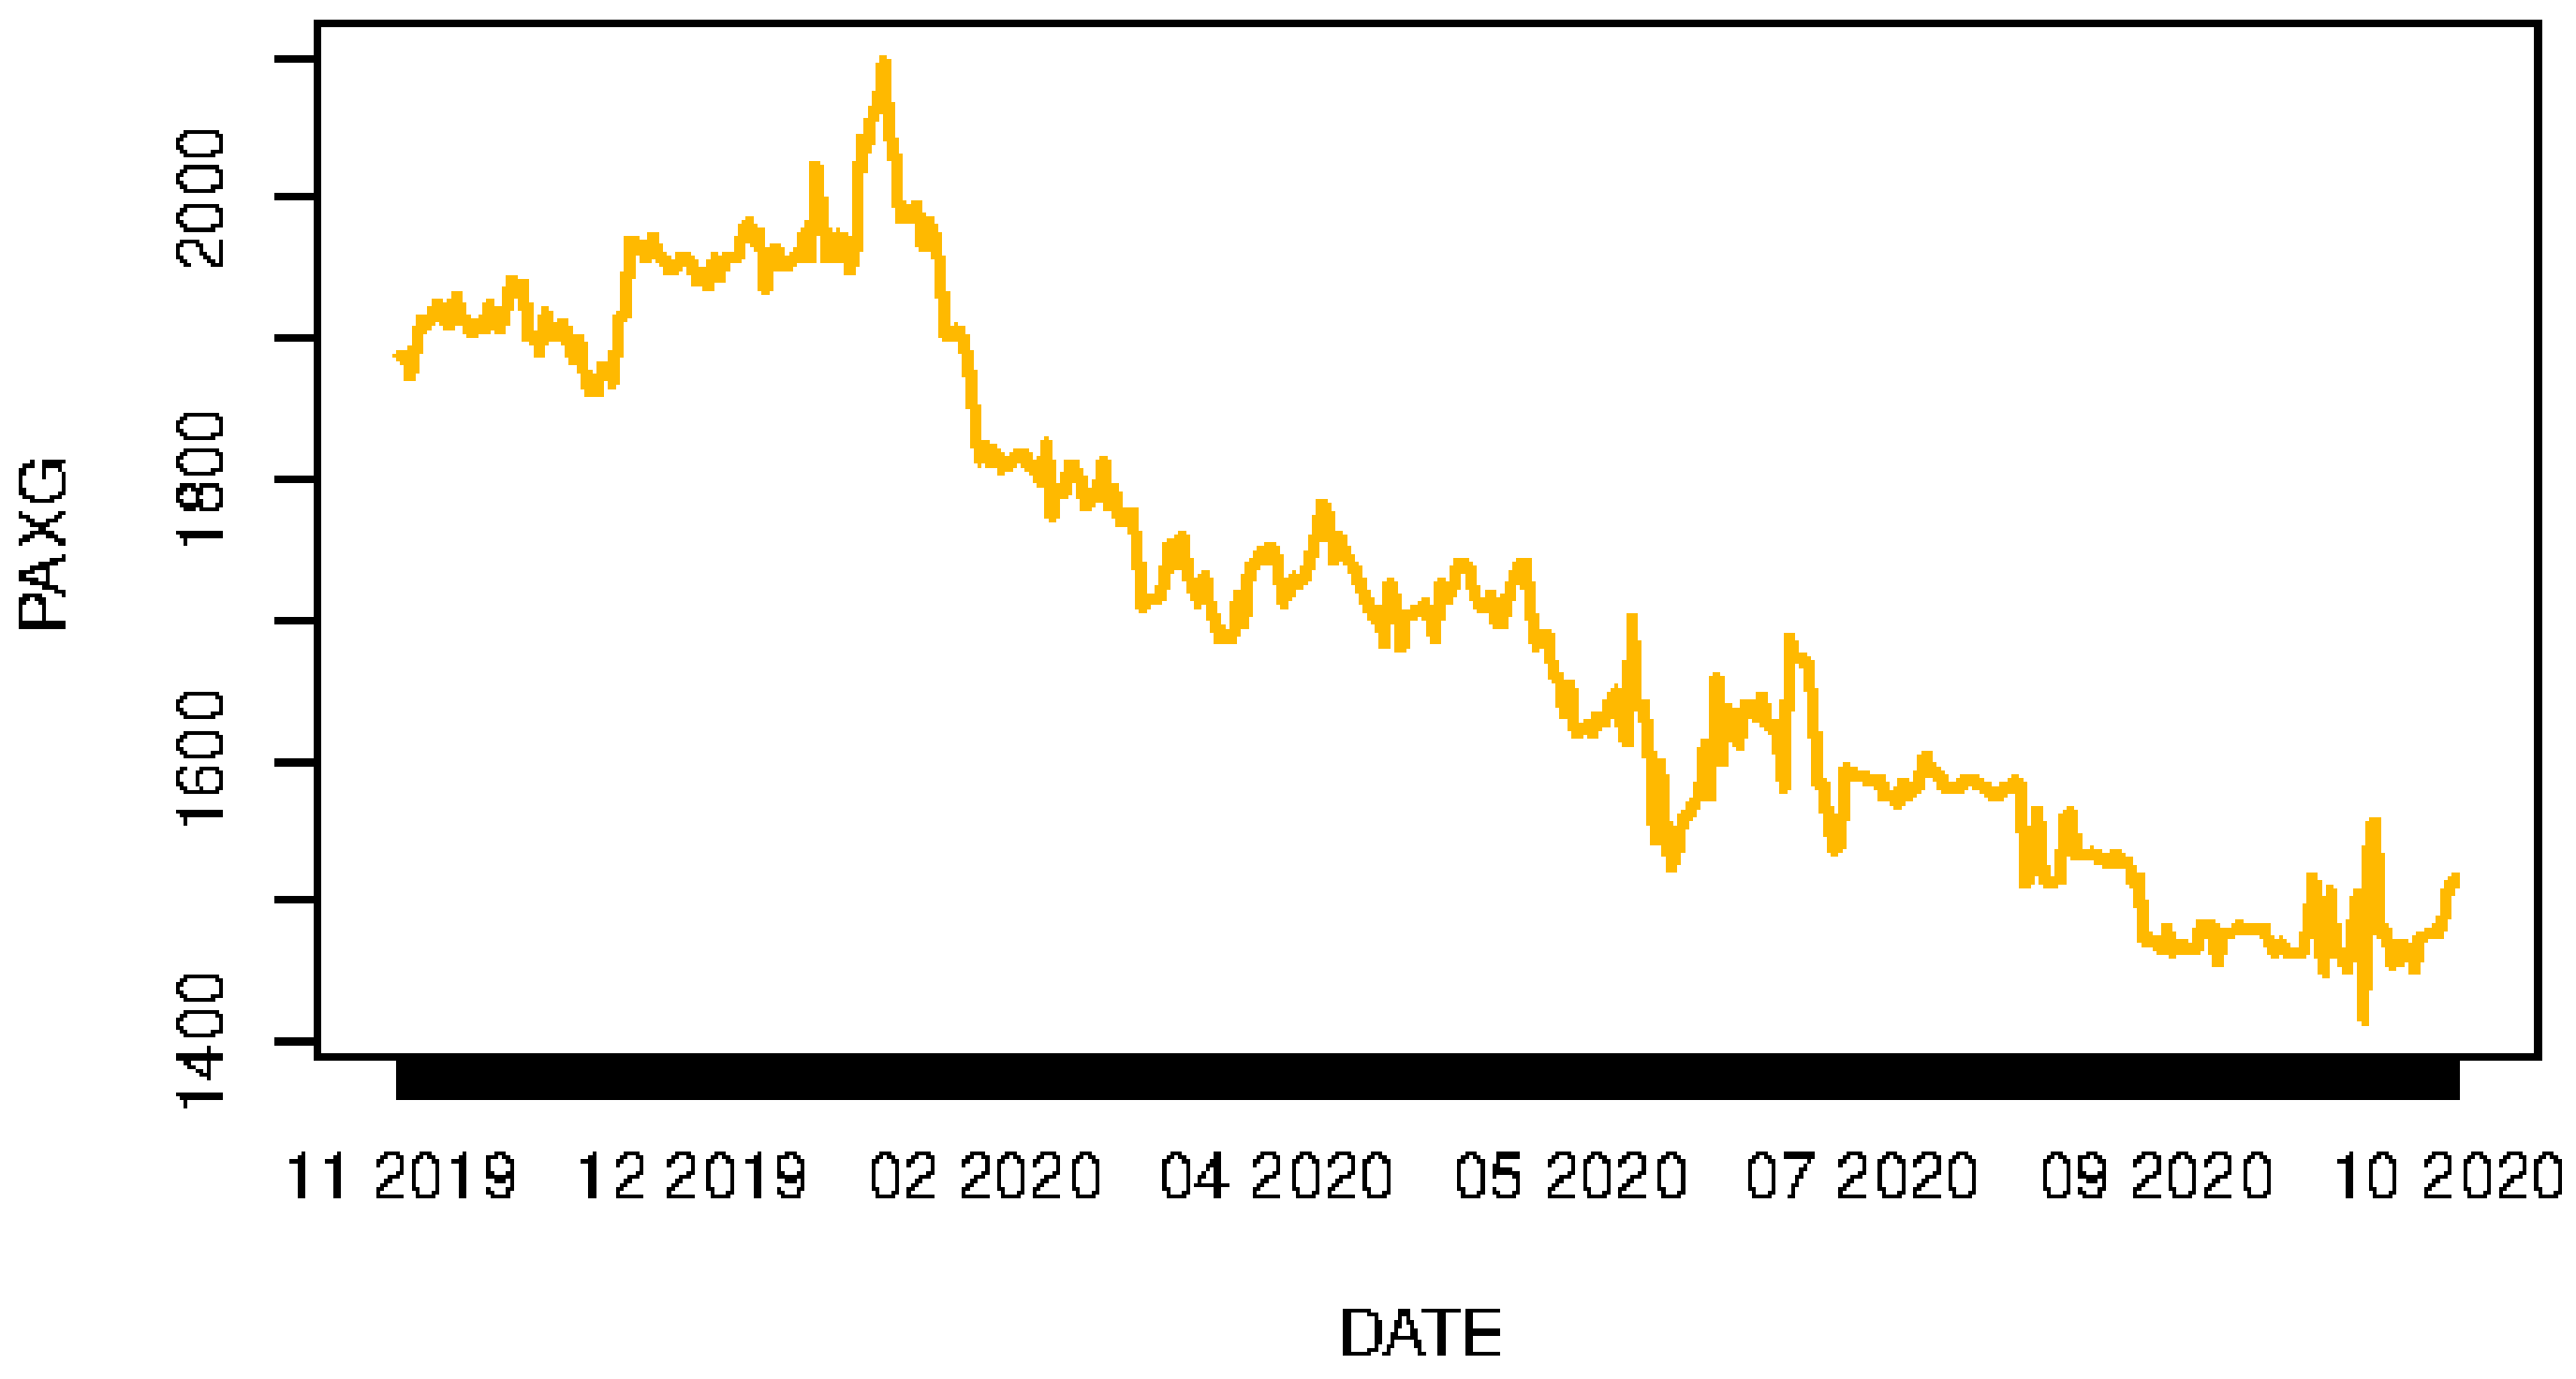
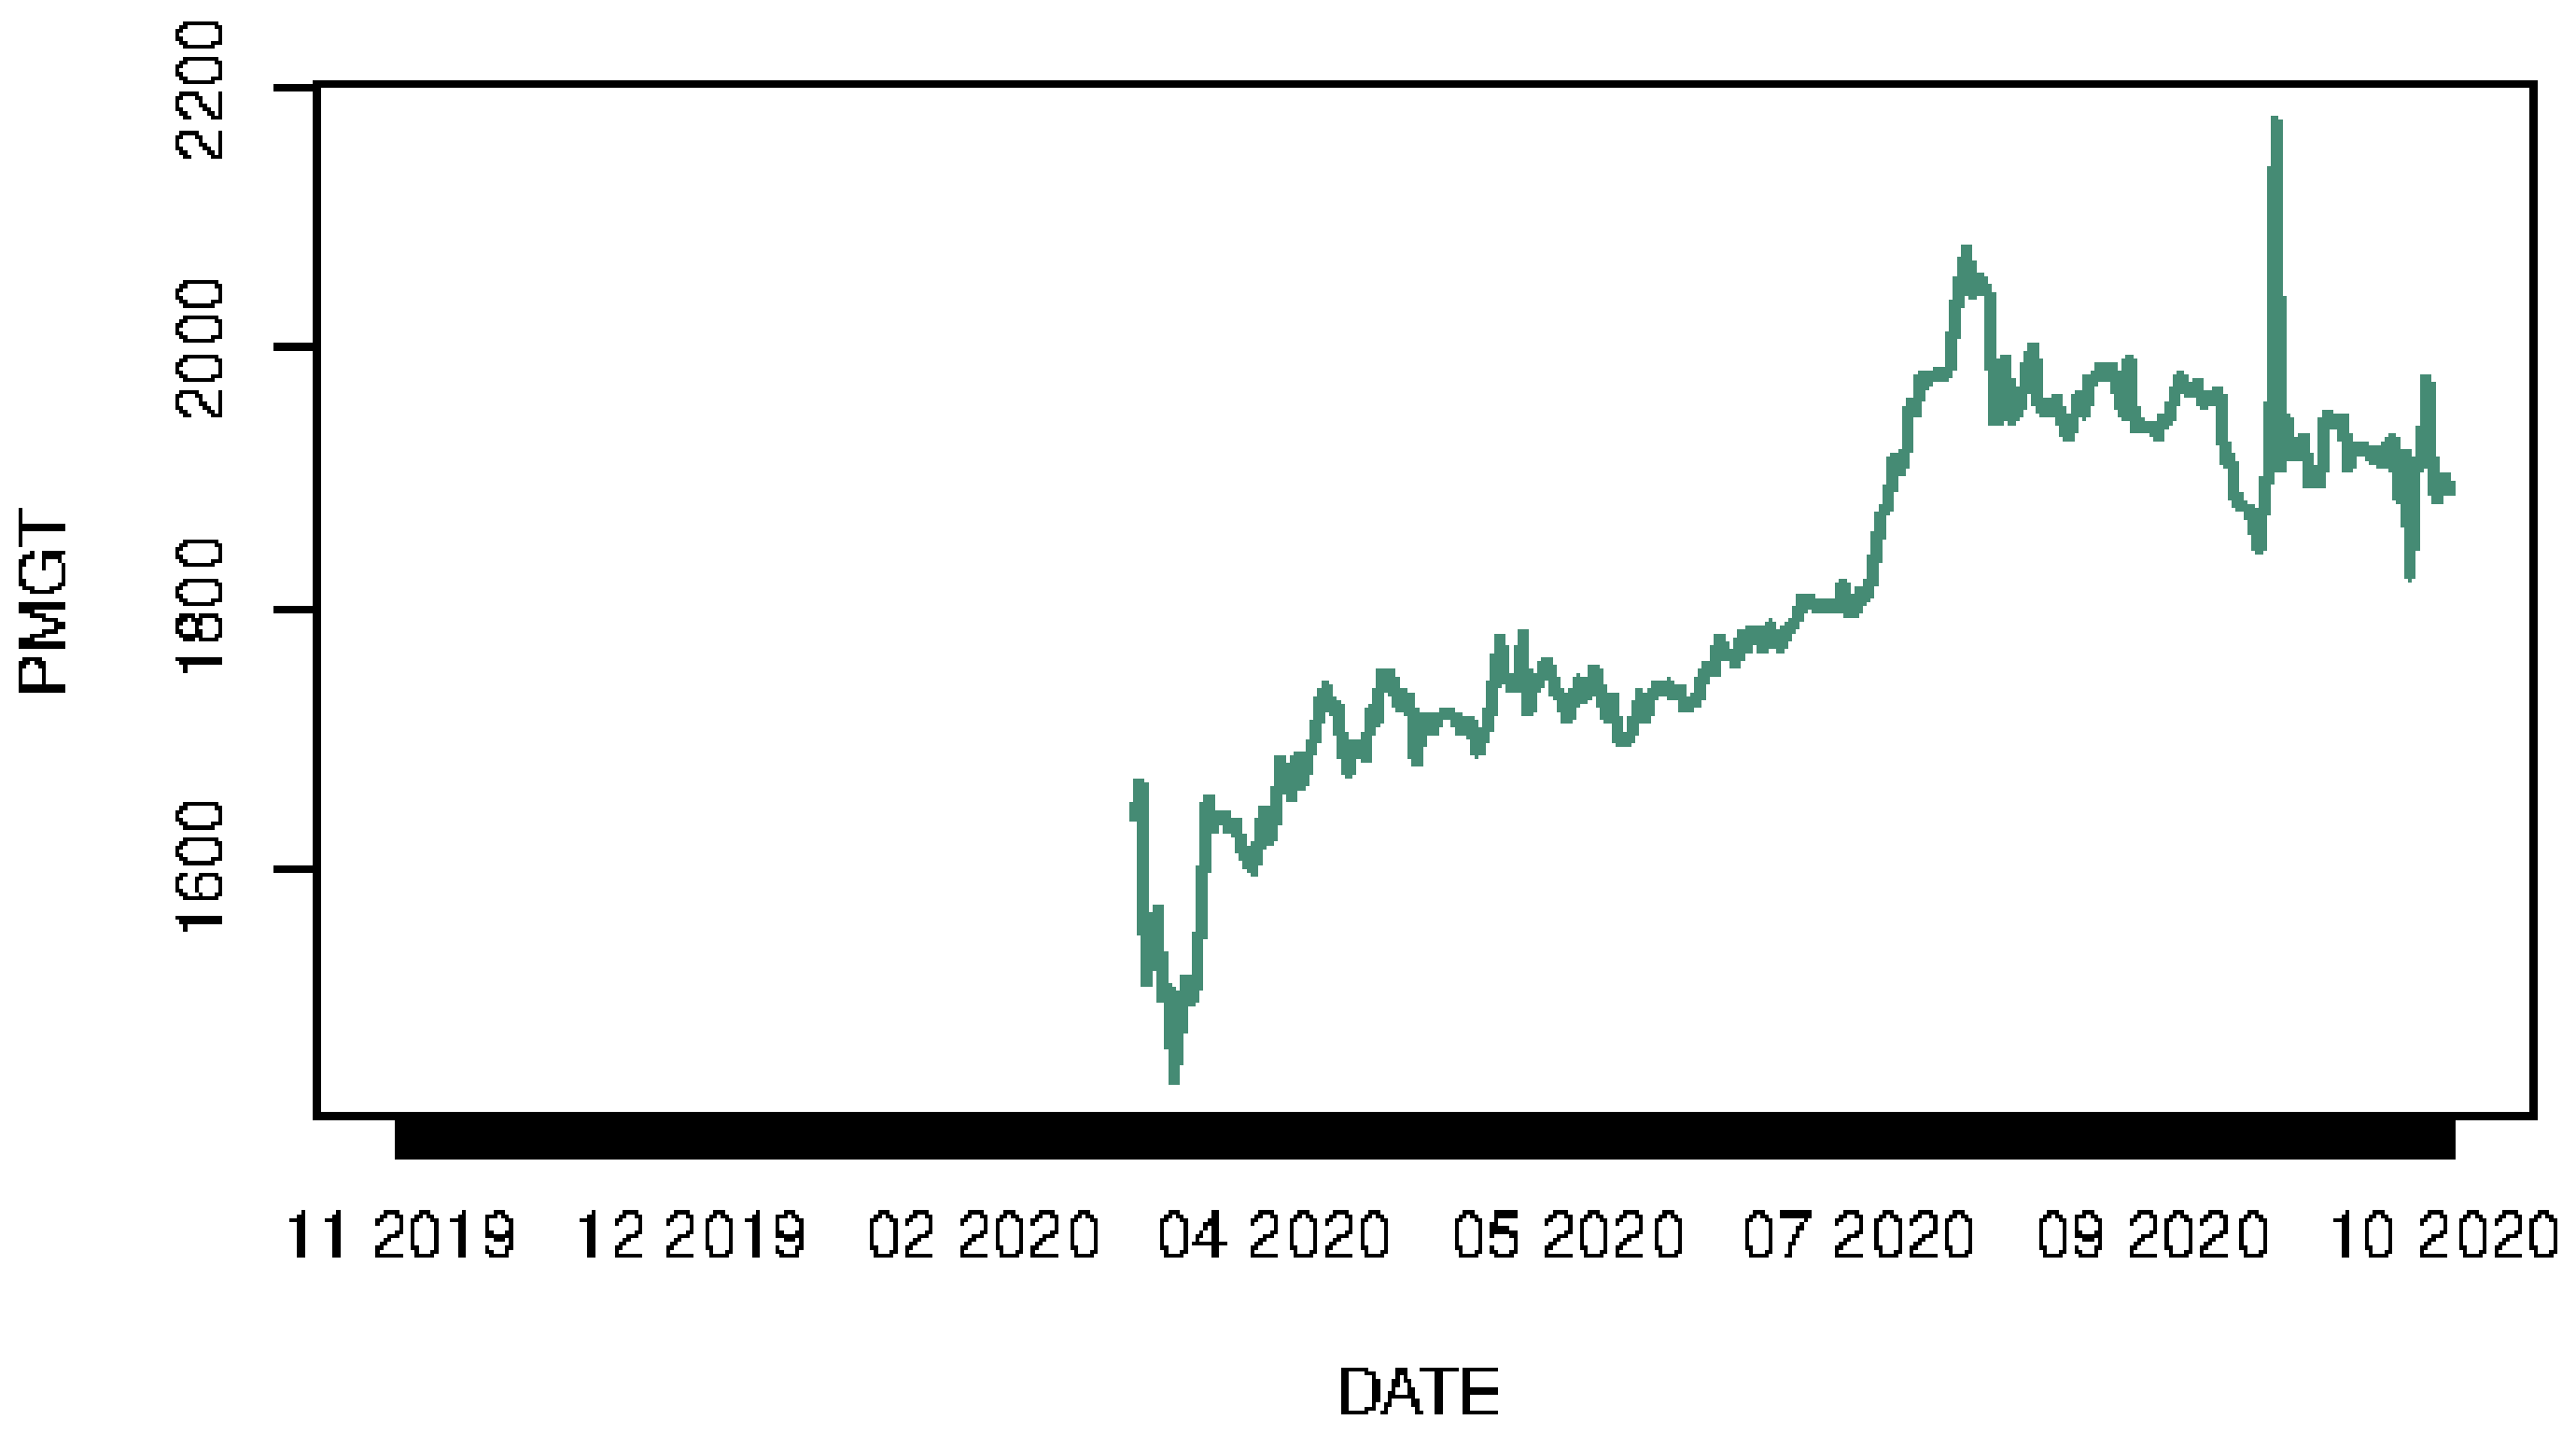
3.1.2. Series’ Plots
3.2. Models
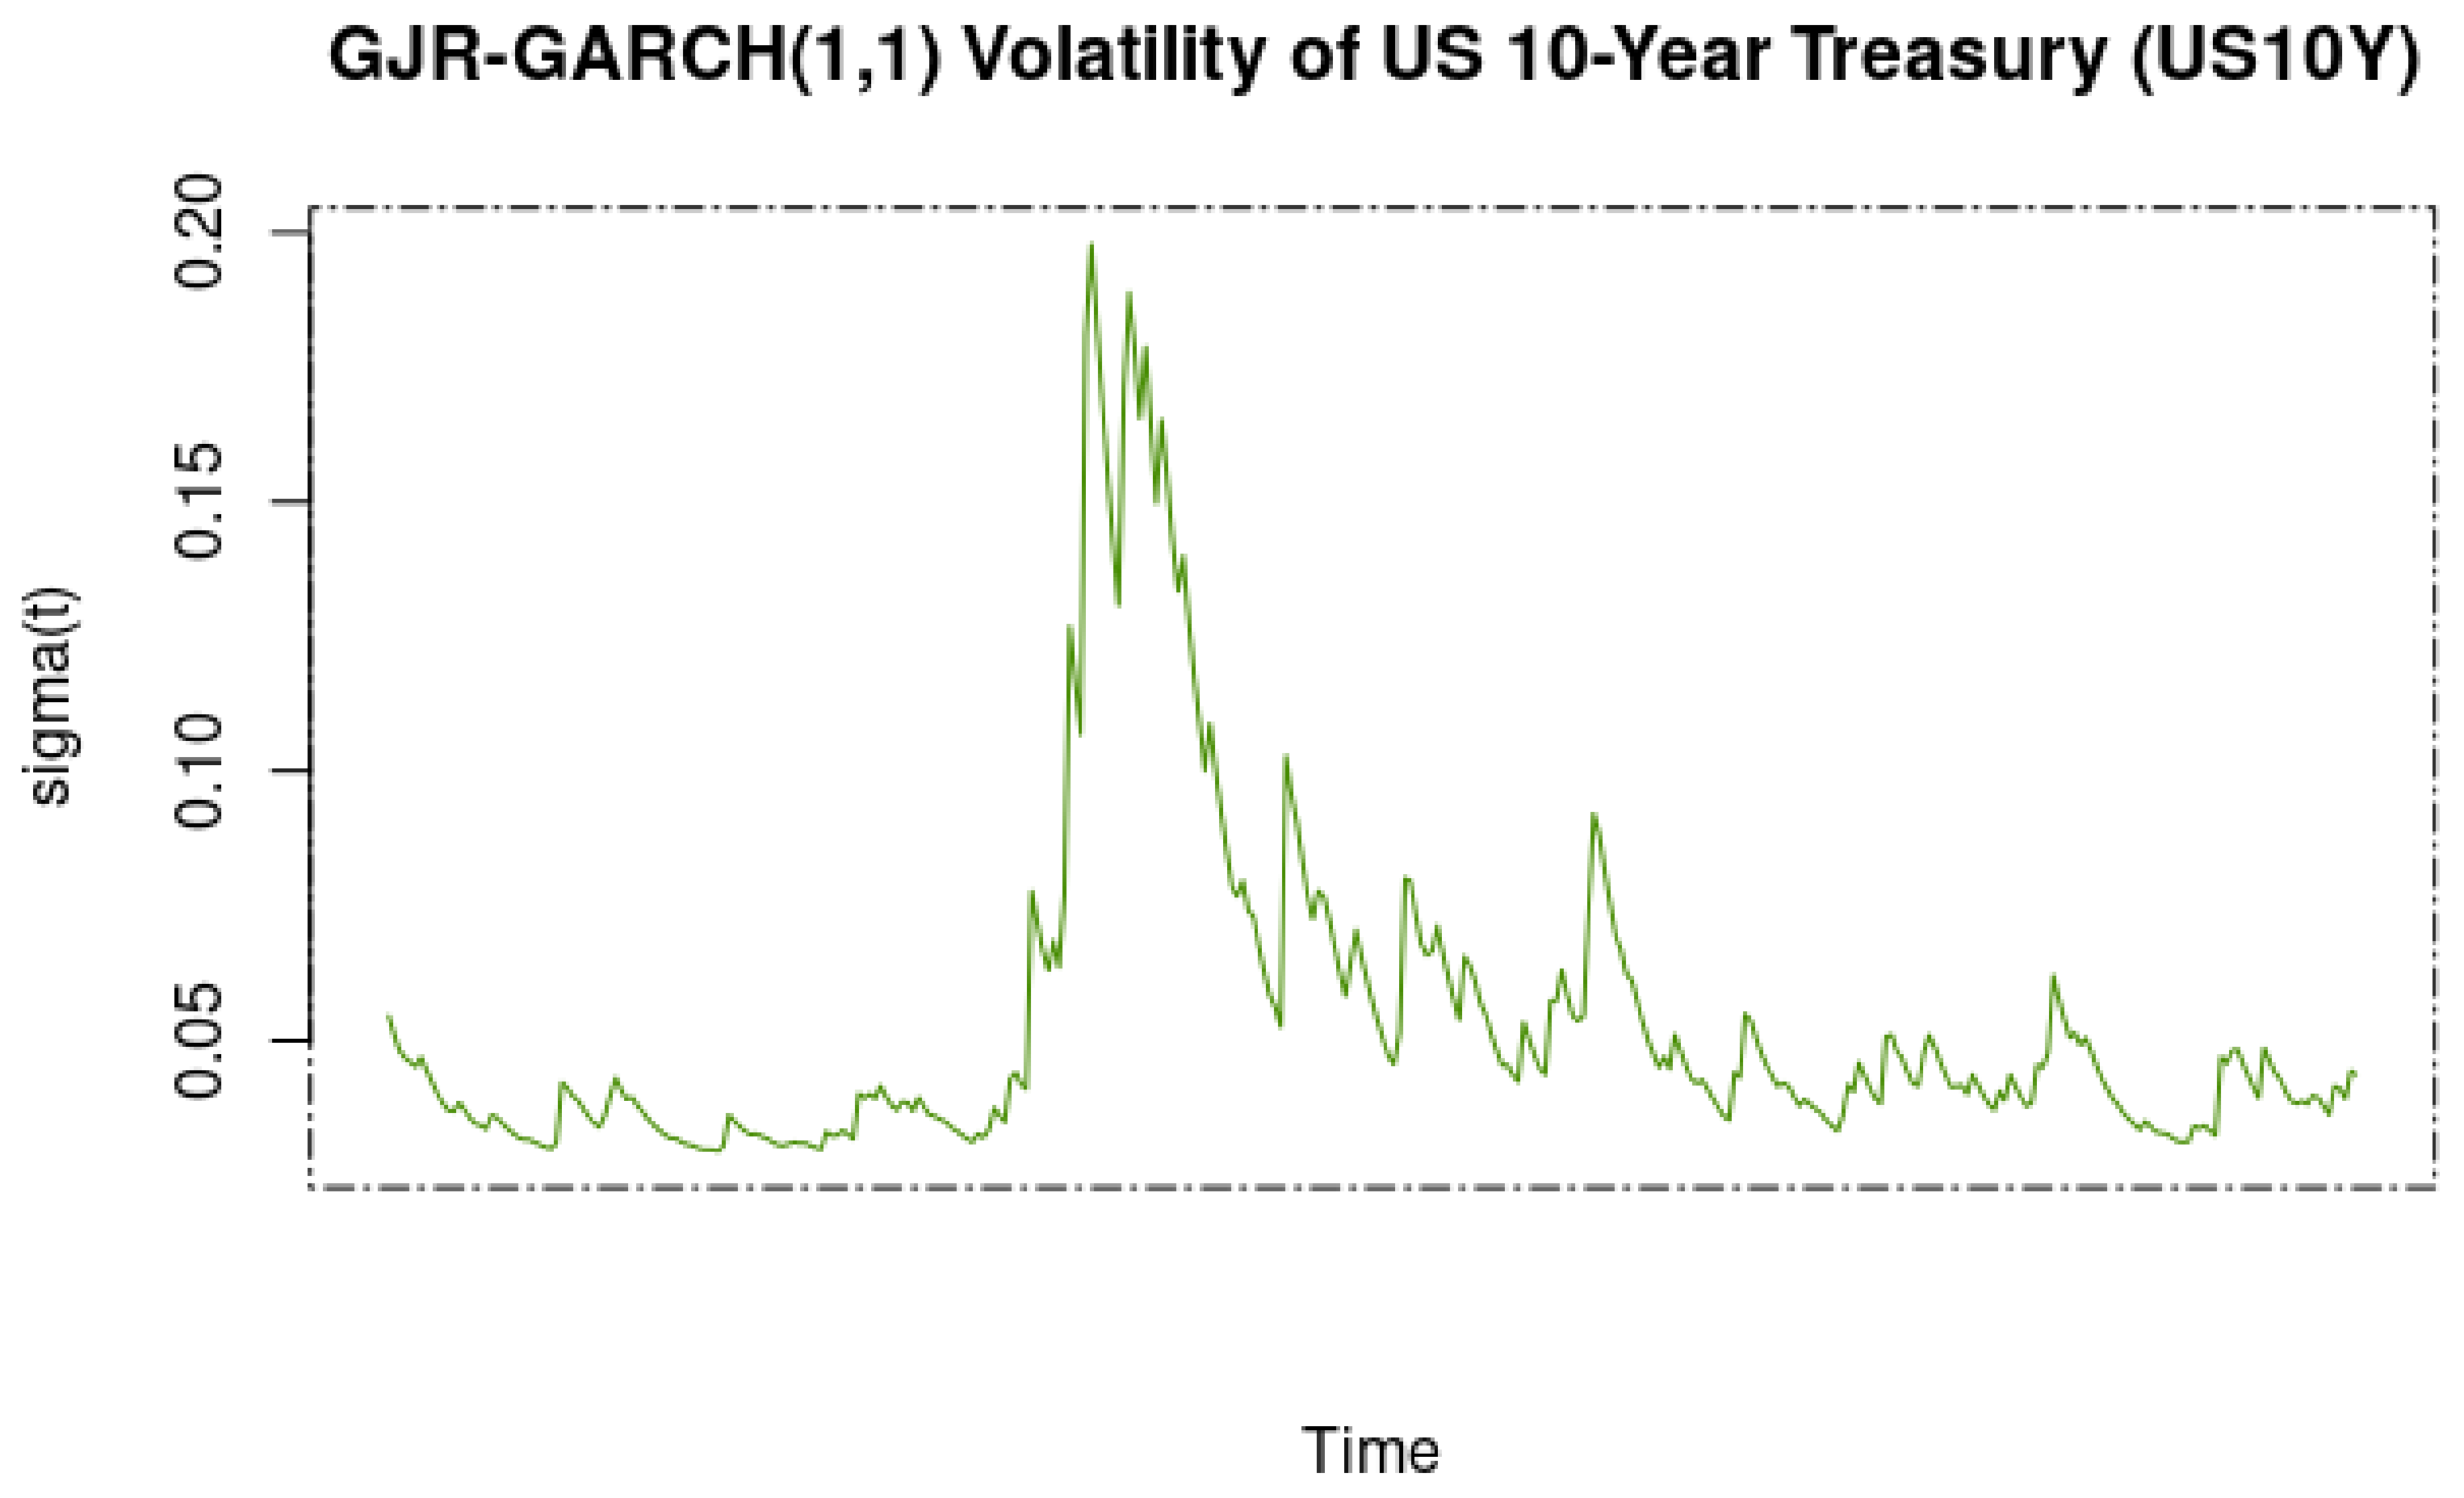
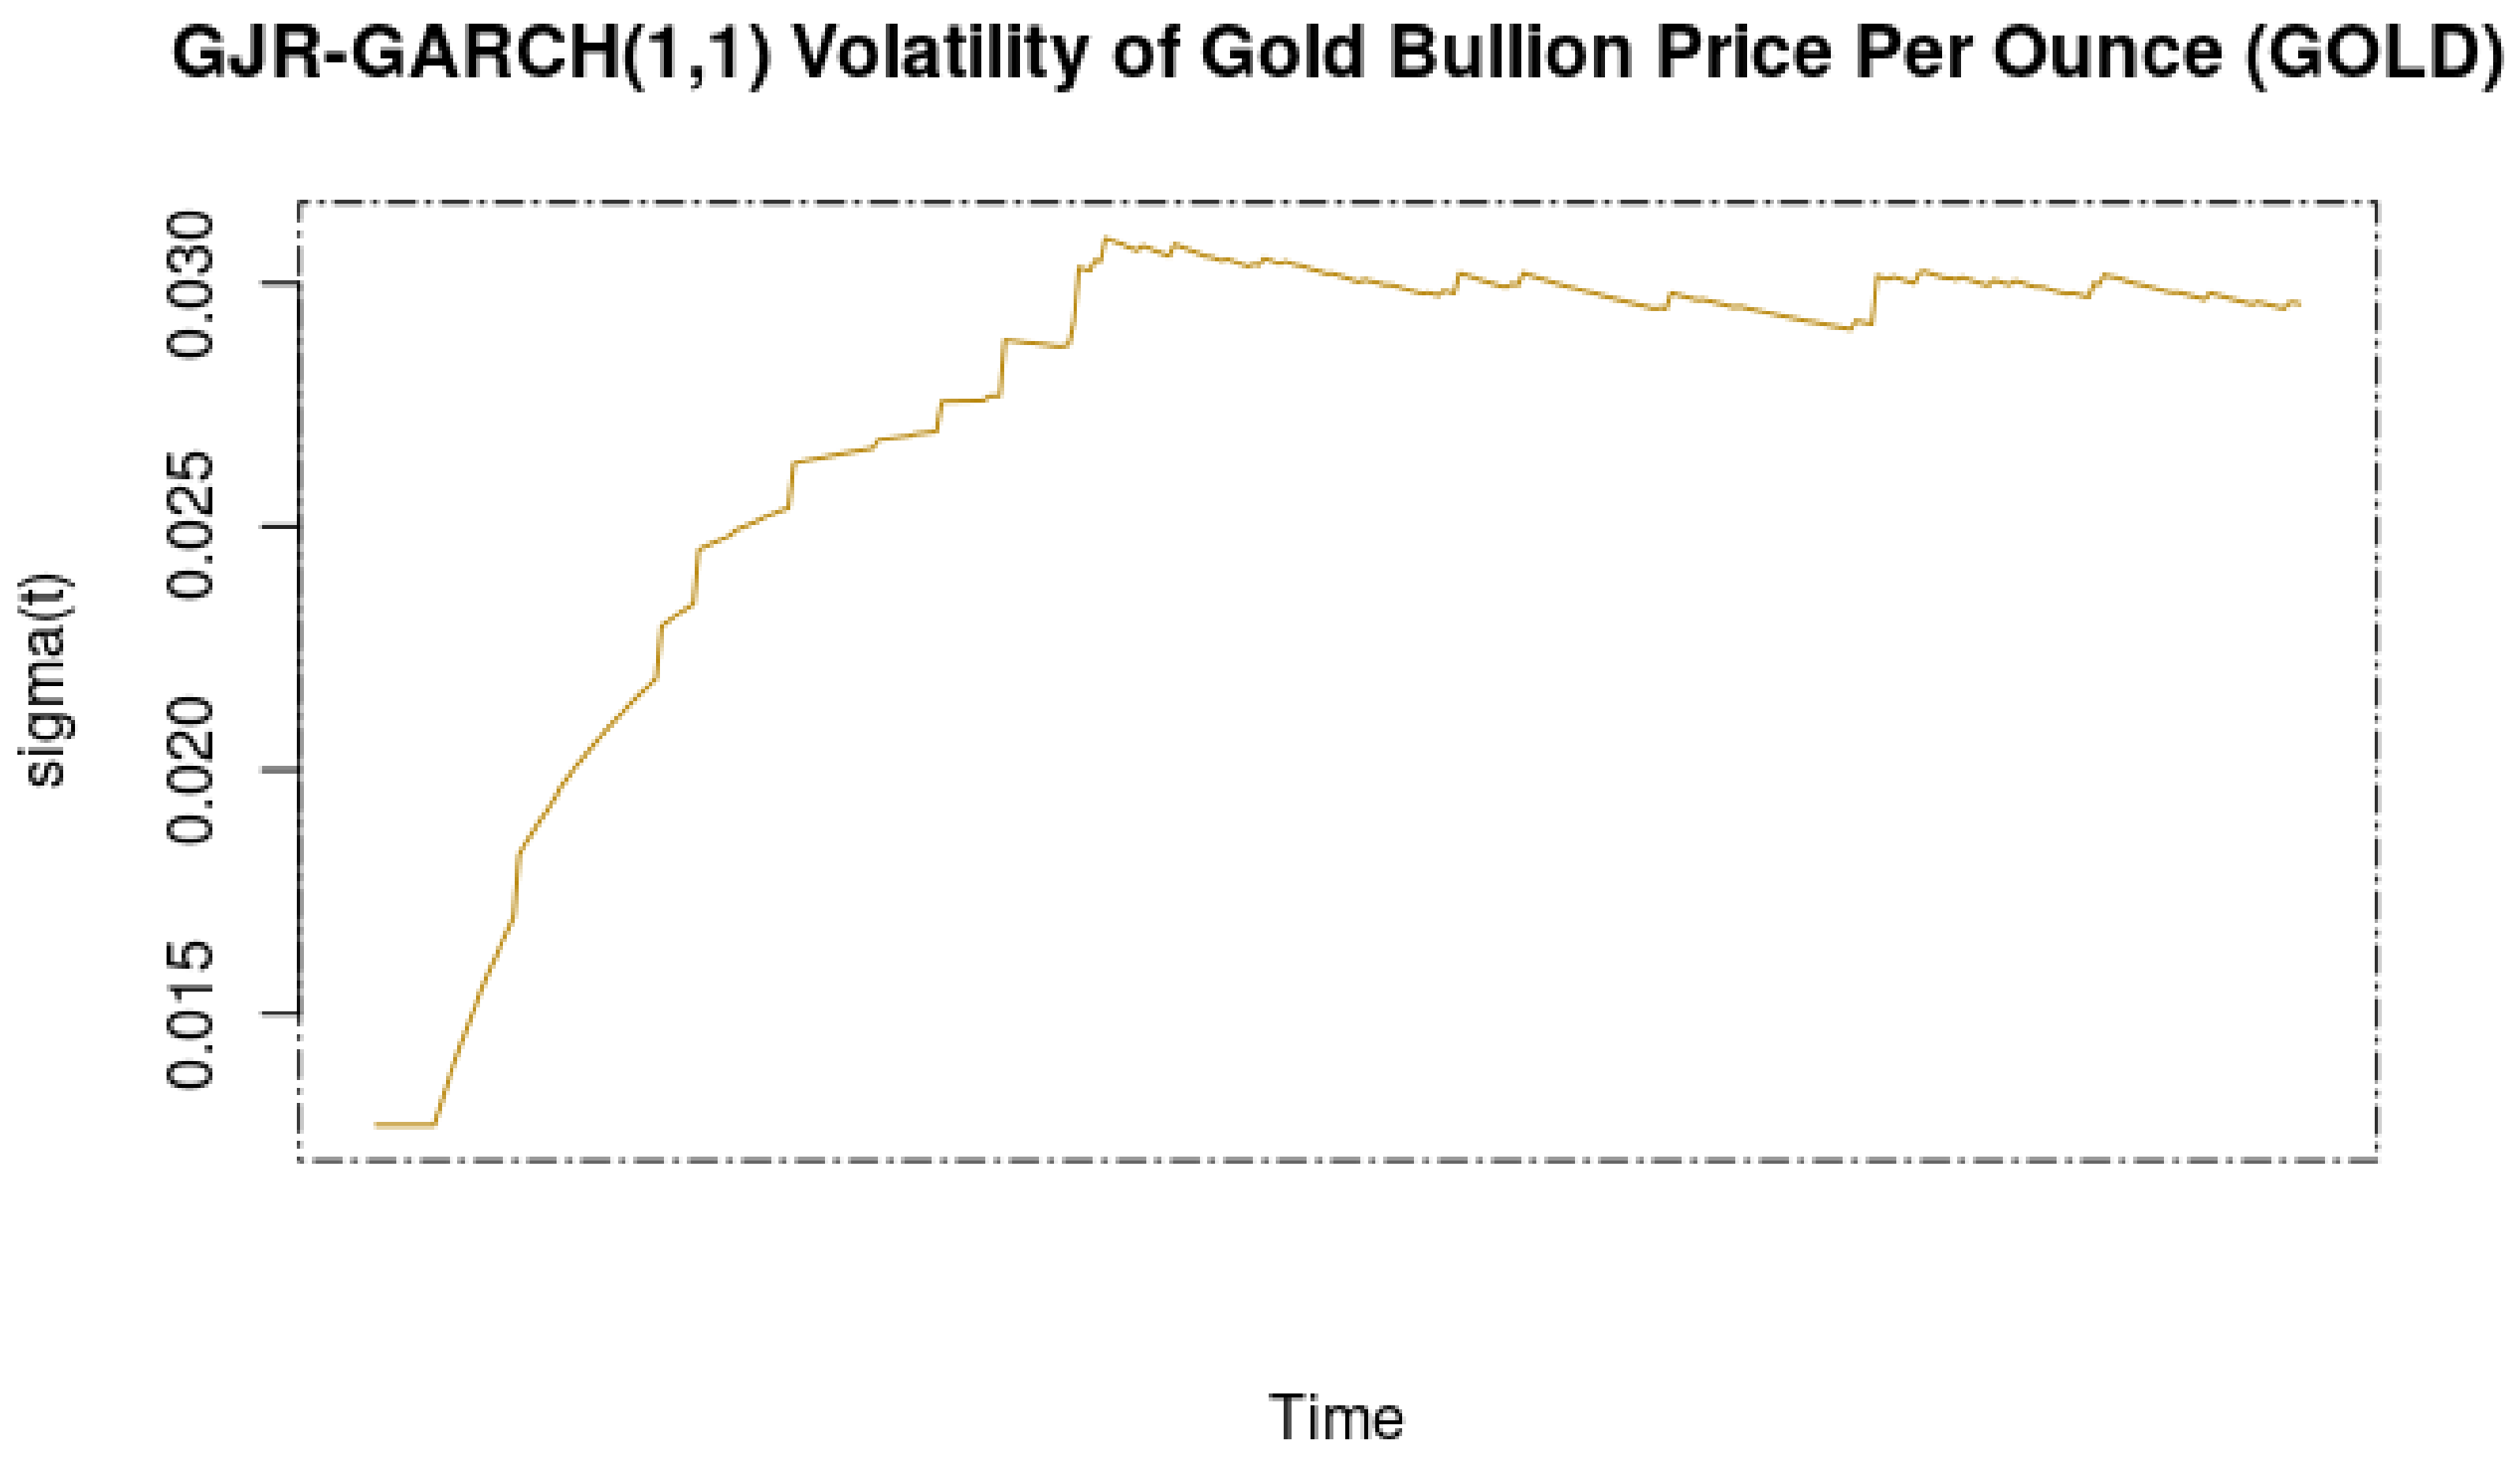
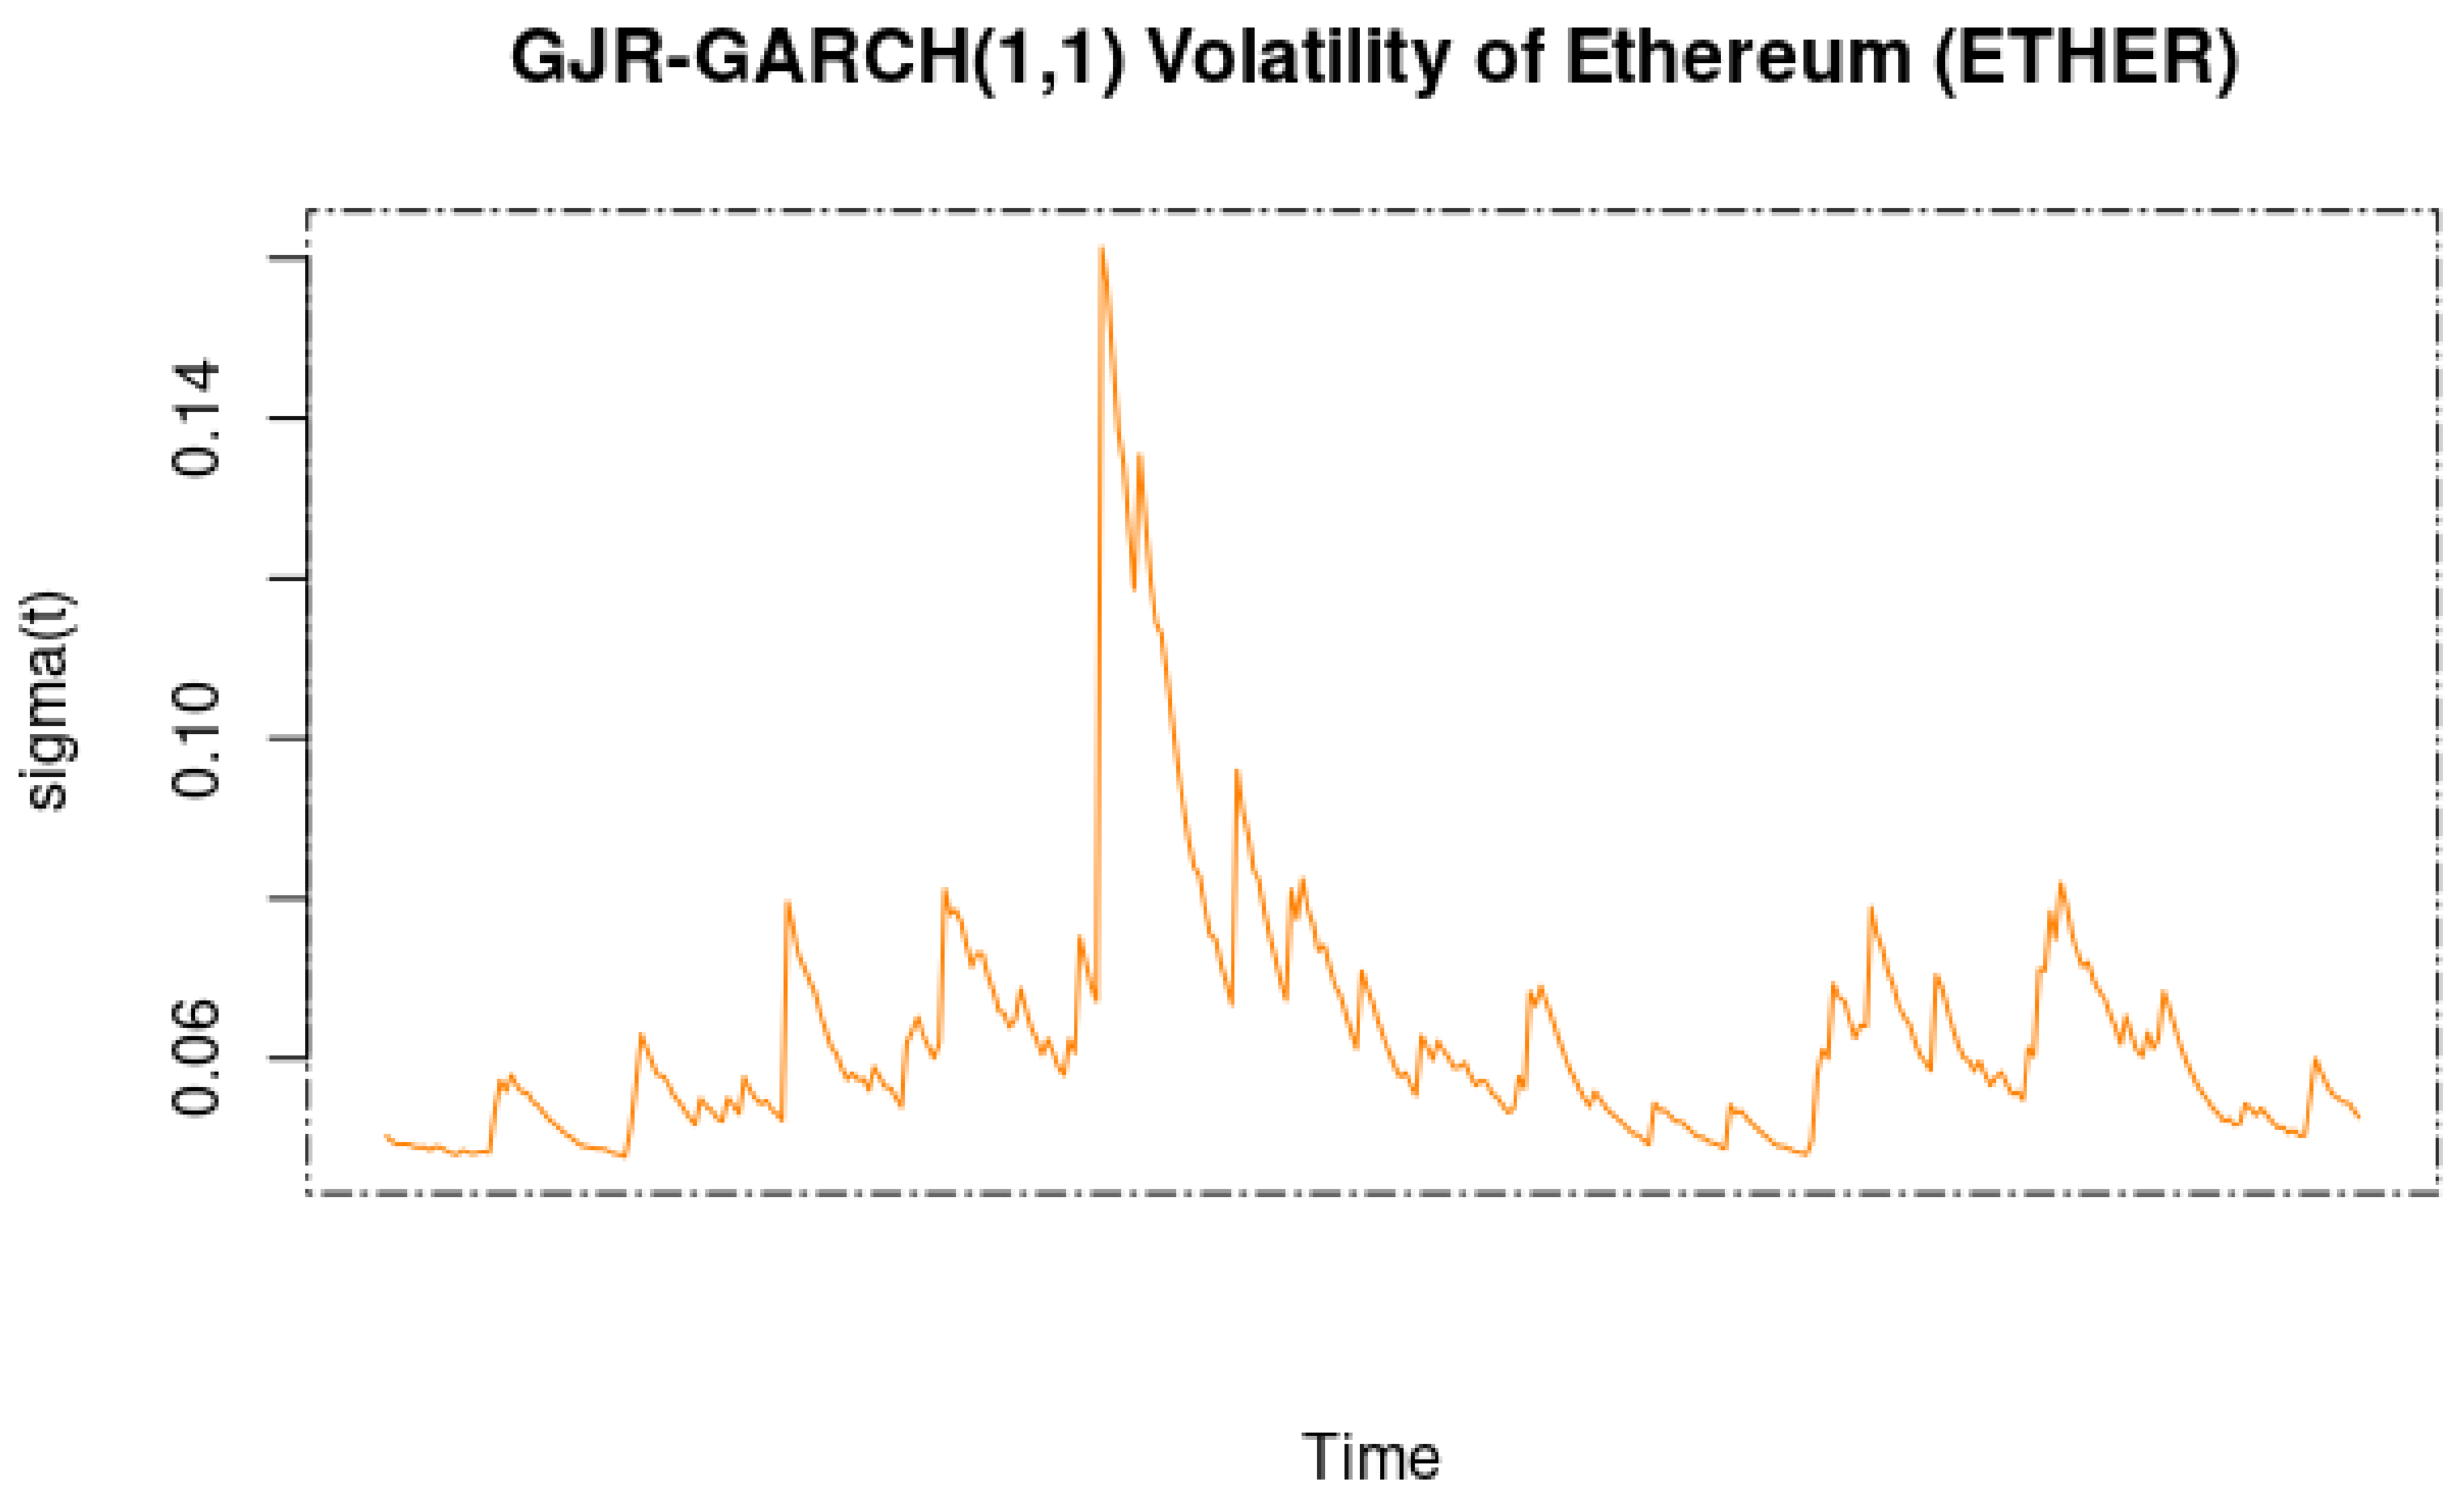
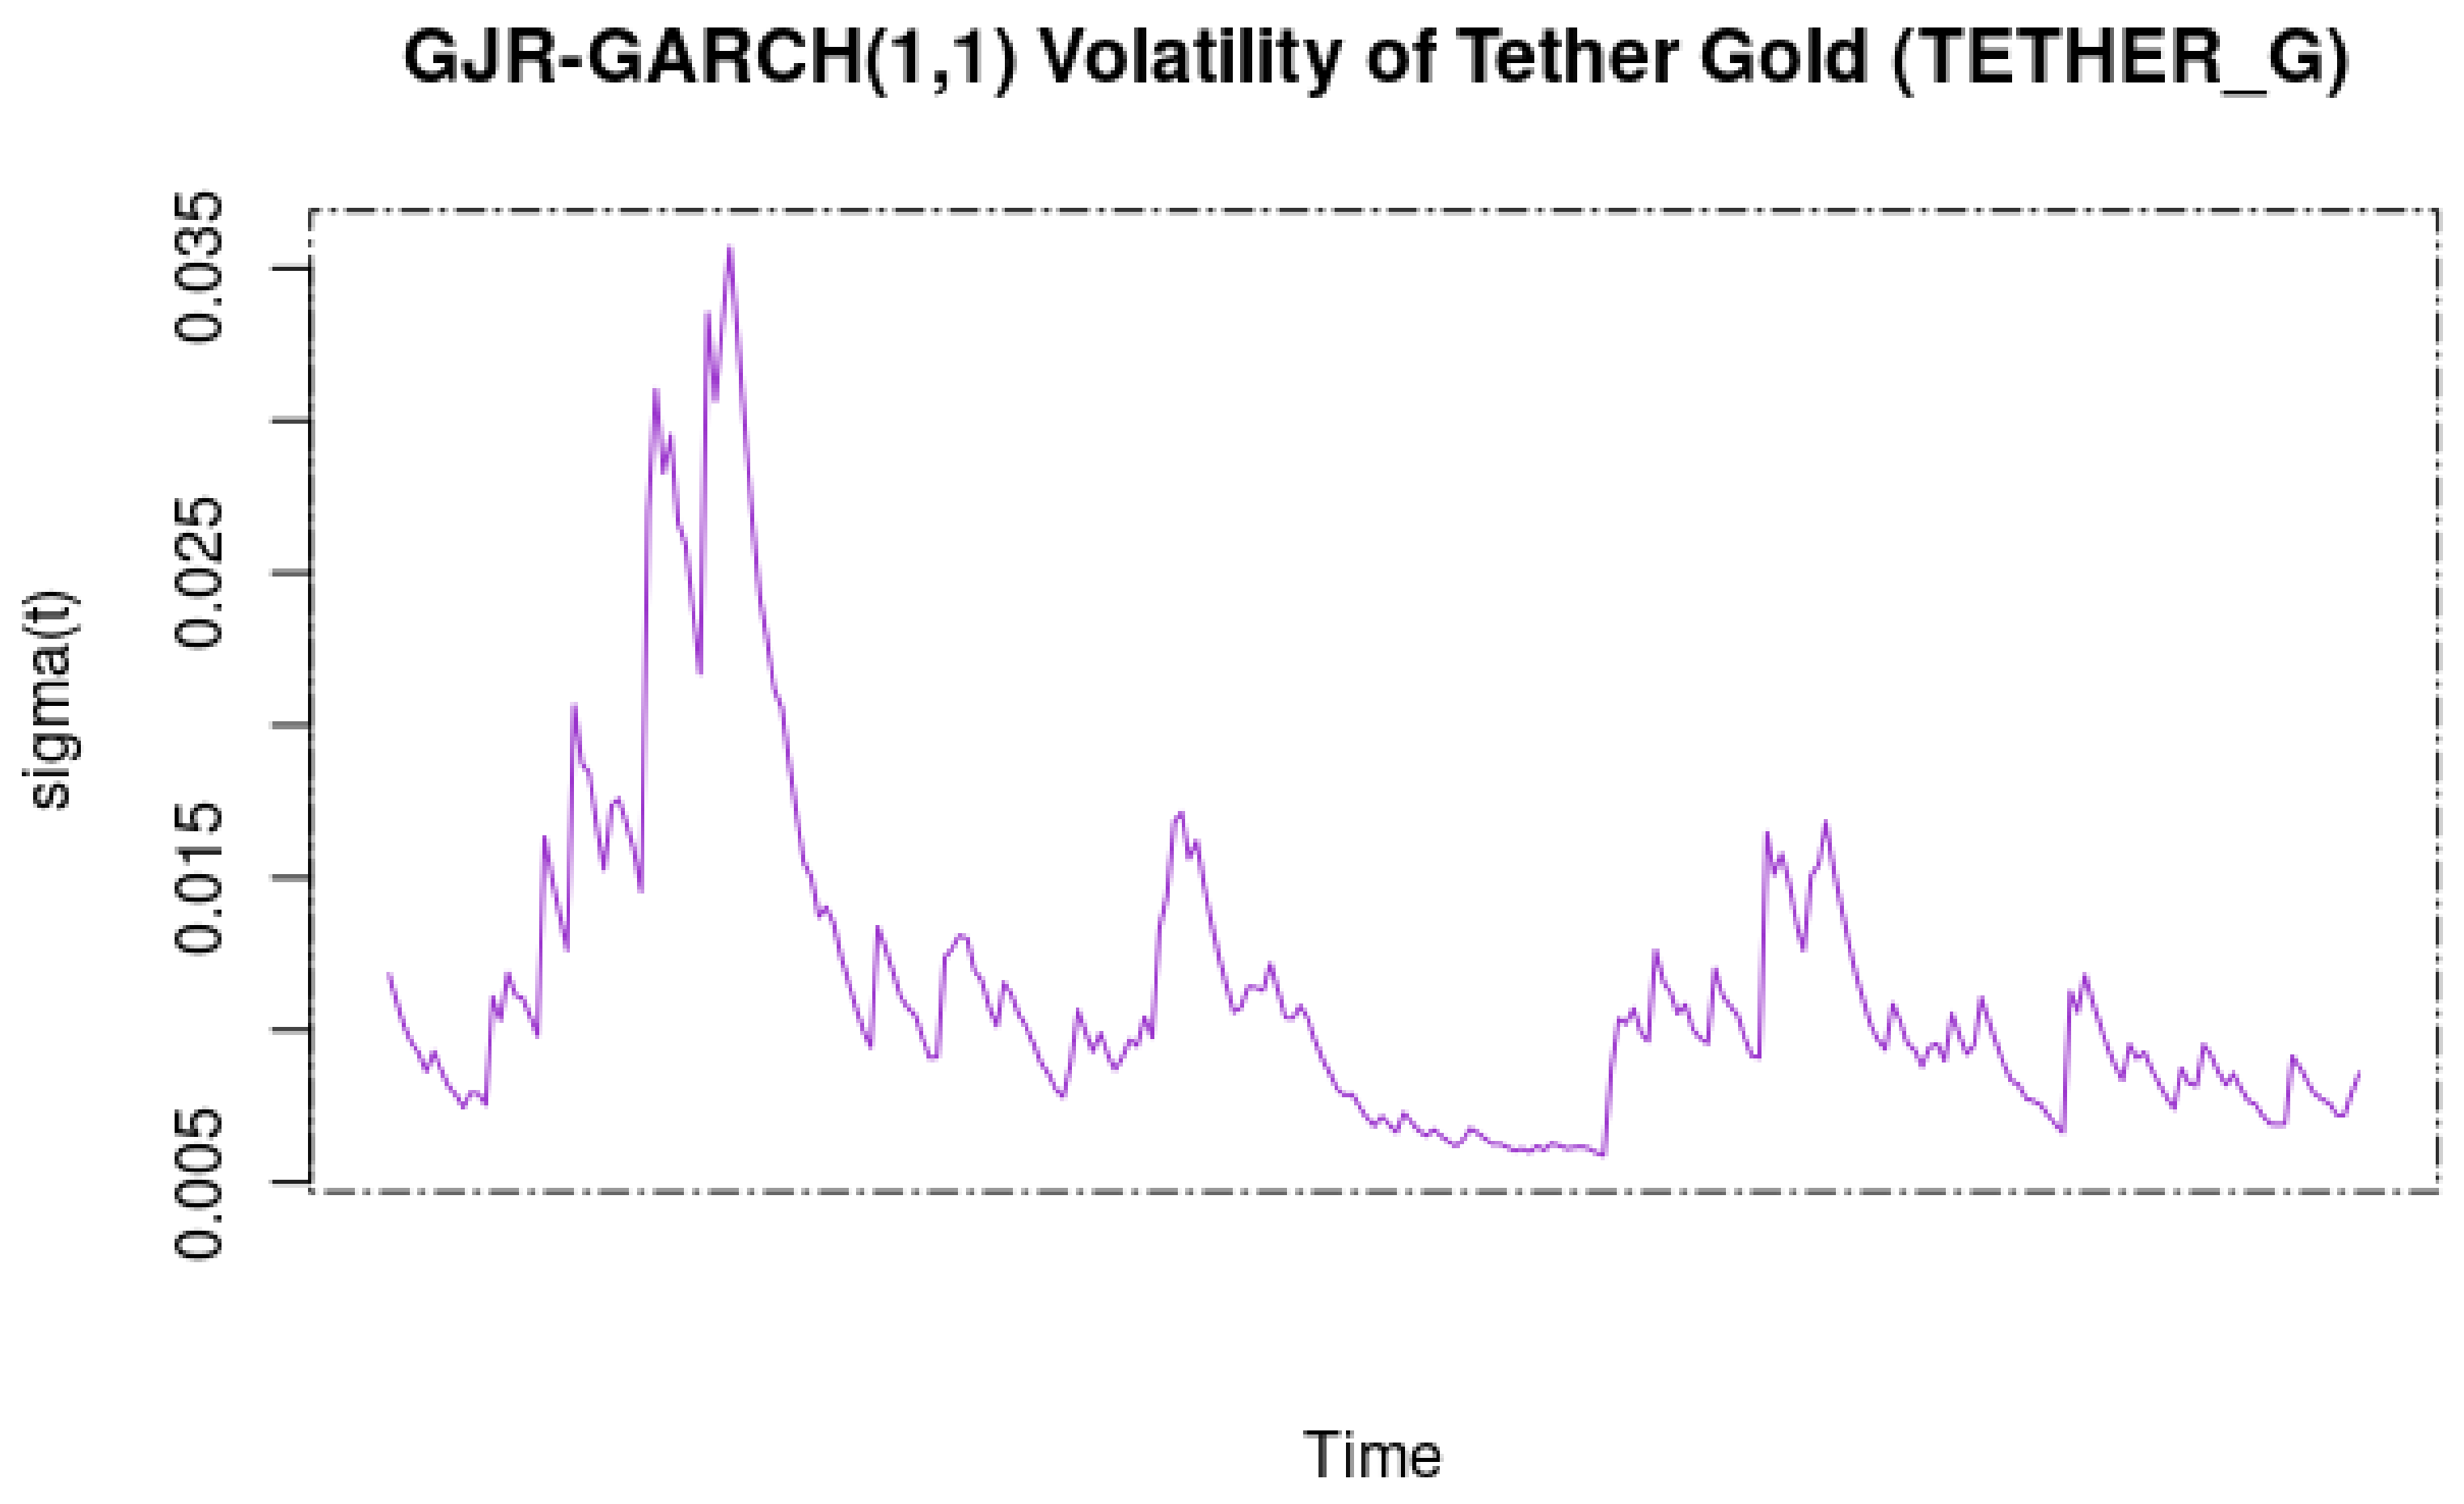
3.2.1. Volatility
3.2.2. Safe-Haven Regressions
- Hedge: A strong (weak) hedge is defined as an asset that is negatively correlated (uncorrelated) with another asset or portfolio, on average.
- Safe haven: A strong (weak) safe haven is defined as an asset that is negatively correlated (uncorrelated) with another asset or portfolio in certain periods only, e.g., in times of falling stock markets.
- Hedge: An instrument can be considered a hedge if it is, on average, negatively correlated with the S&P ().
- Safe haven: It can be treated as a safe haven if its correlation diminishes or becomes negative in the moments of extreme declines in the base asset ().
- Diversifier: It can be called a diversifier if its correlation with the base asset is, on average, positive ().
4. Safe-Haven Results
4.1. Equation (3) Estimates
- Hedge: The instrument can be considered a hedge if the intercept is negative.
- Safe haven: The instrument can be considered a strong safe haven when is significantly lower than 0.
- In the ‘Hedge’ column, negative coefficients indicate that the asset is a hedge against stocks.
- In the ‘Safe Haven’ column, zero (negative) coefficients during extreme market conditions (5% quantile) indicate that the asset is a weak (strong) safe haven.
- We detect no ‘Hedge’ during the COVID-19 period.
- We detect potentially five ‘Safe Havens’:
- US 10-Year Bond,
- Gold,
- Perth Mint Gold Token (PMGT),
- PAX Gold (PAXG),
- Tether Gold.
4.2. Equation (4) Estimates
- We detect potentially one ‘Hedge’ during the COVID-19 period, i.e., Tether Gold (although not statistically significant). Other assets could be called ‘Diversifiers’ (although not significant either).
- We confirm the possibility to have five ‘Safe Havens’ (although not exactly the same as in Equation (3)):
- Gold,
- Perth Mint Gold Token (PMGT),
- Bitcoin,
- Ethereum,
- Digix gold (DGX).
- What is striking is the high significance (between 1% and 5%) recorded for each candidate as a safe haven in this context.
5. Portfolio Optimization
5.1. Global Minimum Variance Portfolio with Monte Carlo Simulations
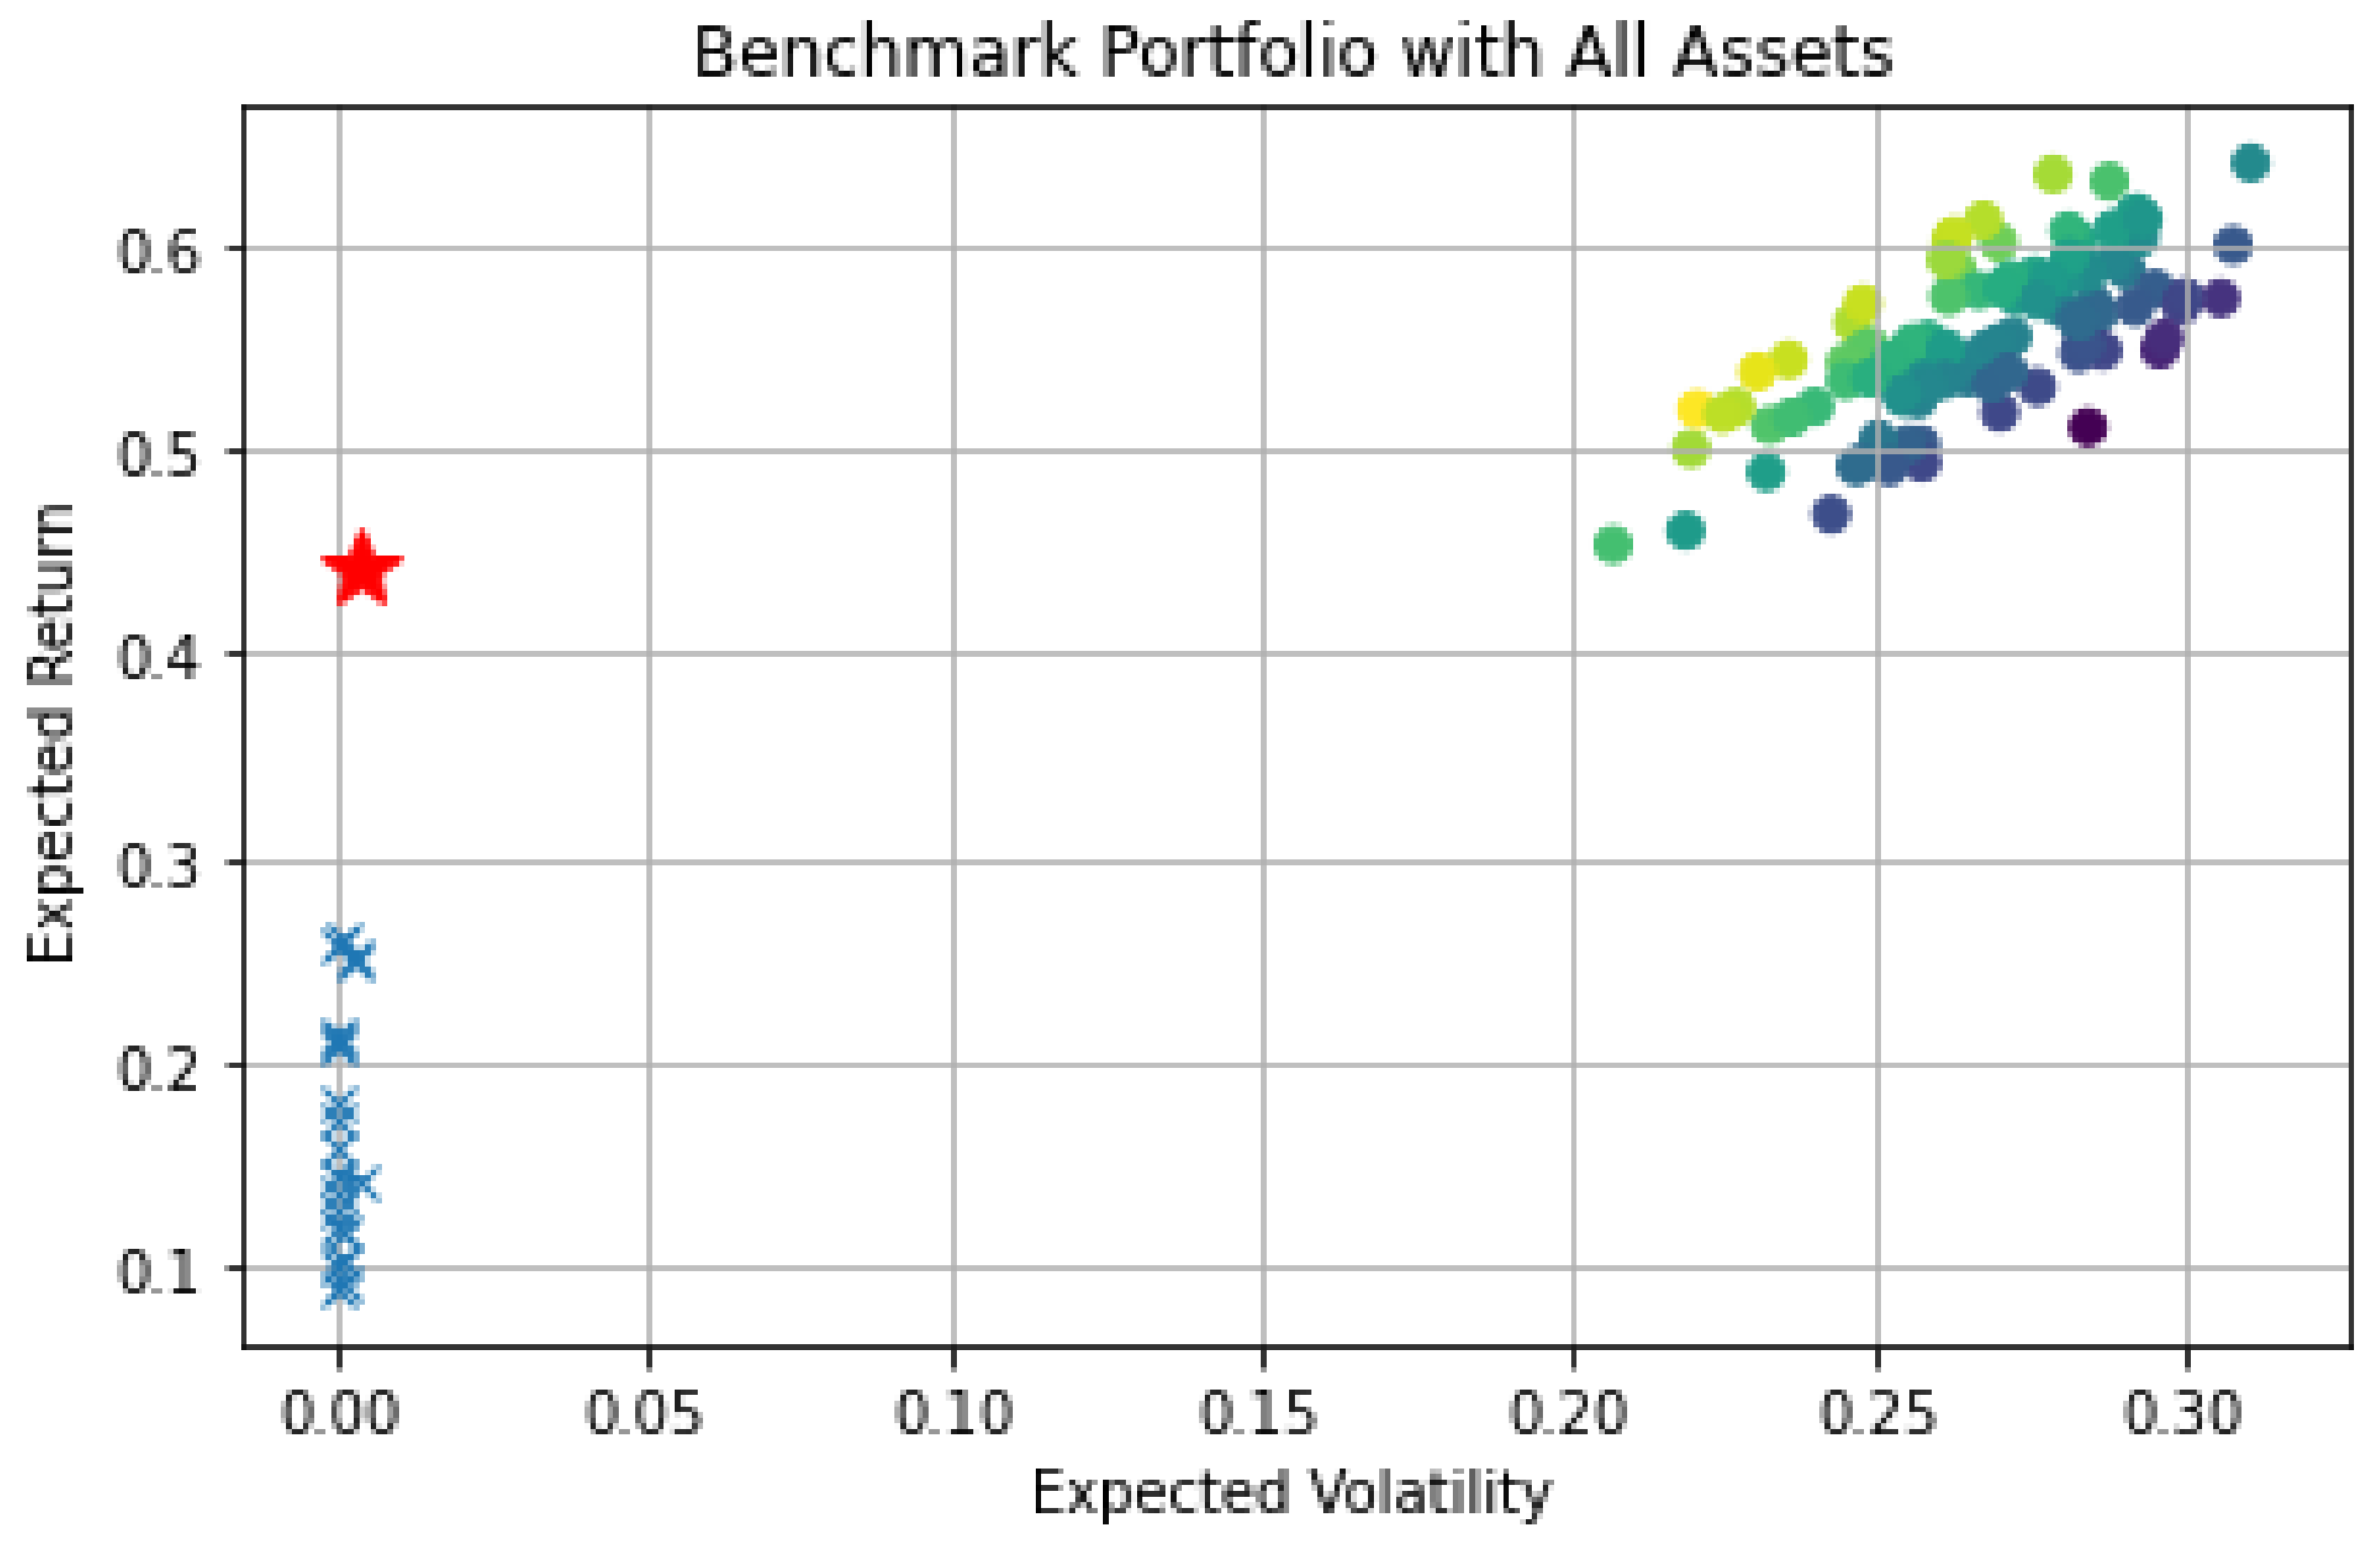
5.1.1. Benchmark Portfolio Results
- × symbols are the dominated assets;
- ⋆ symbols are the tangent risk-free assets (short- to long-term U.S. bonds);
- ○ symbols are the optimal investments on the portfolio frontier.
- SSE Composite Index and ALL ORDINARIES;
- IPC MEXICO and MERVAL;
- S&P-GSCI Commodity Index Future and Bitcoin Futures;
- Bitcoin Cash and Litecoin USD;
- XRP USD and DOGE USD;
- Digix gold token USD and Tether Gold USD.
- Soybean Futures;
- IPC MEXICO;
- Shenzhen Component.
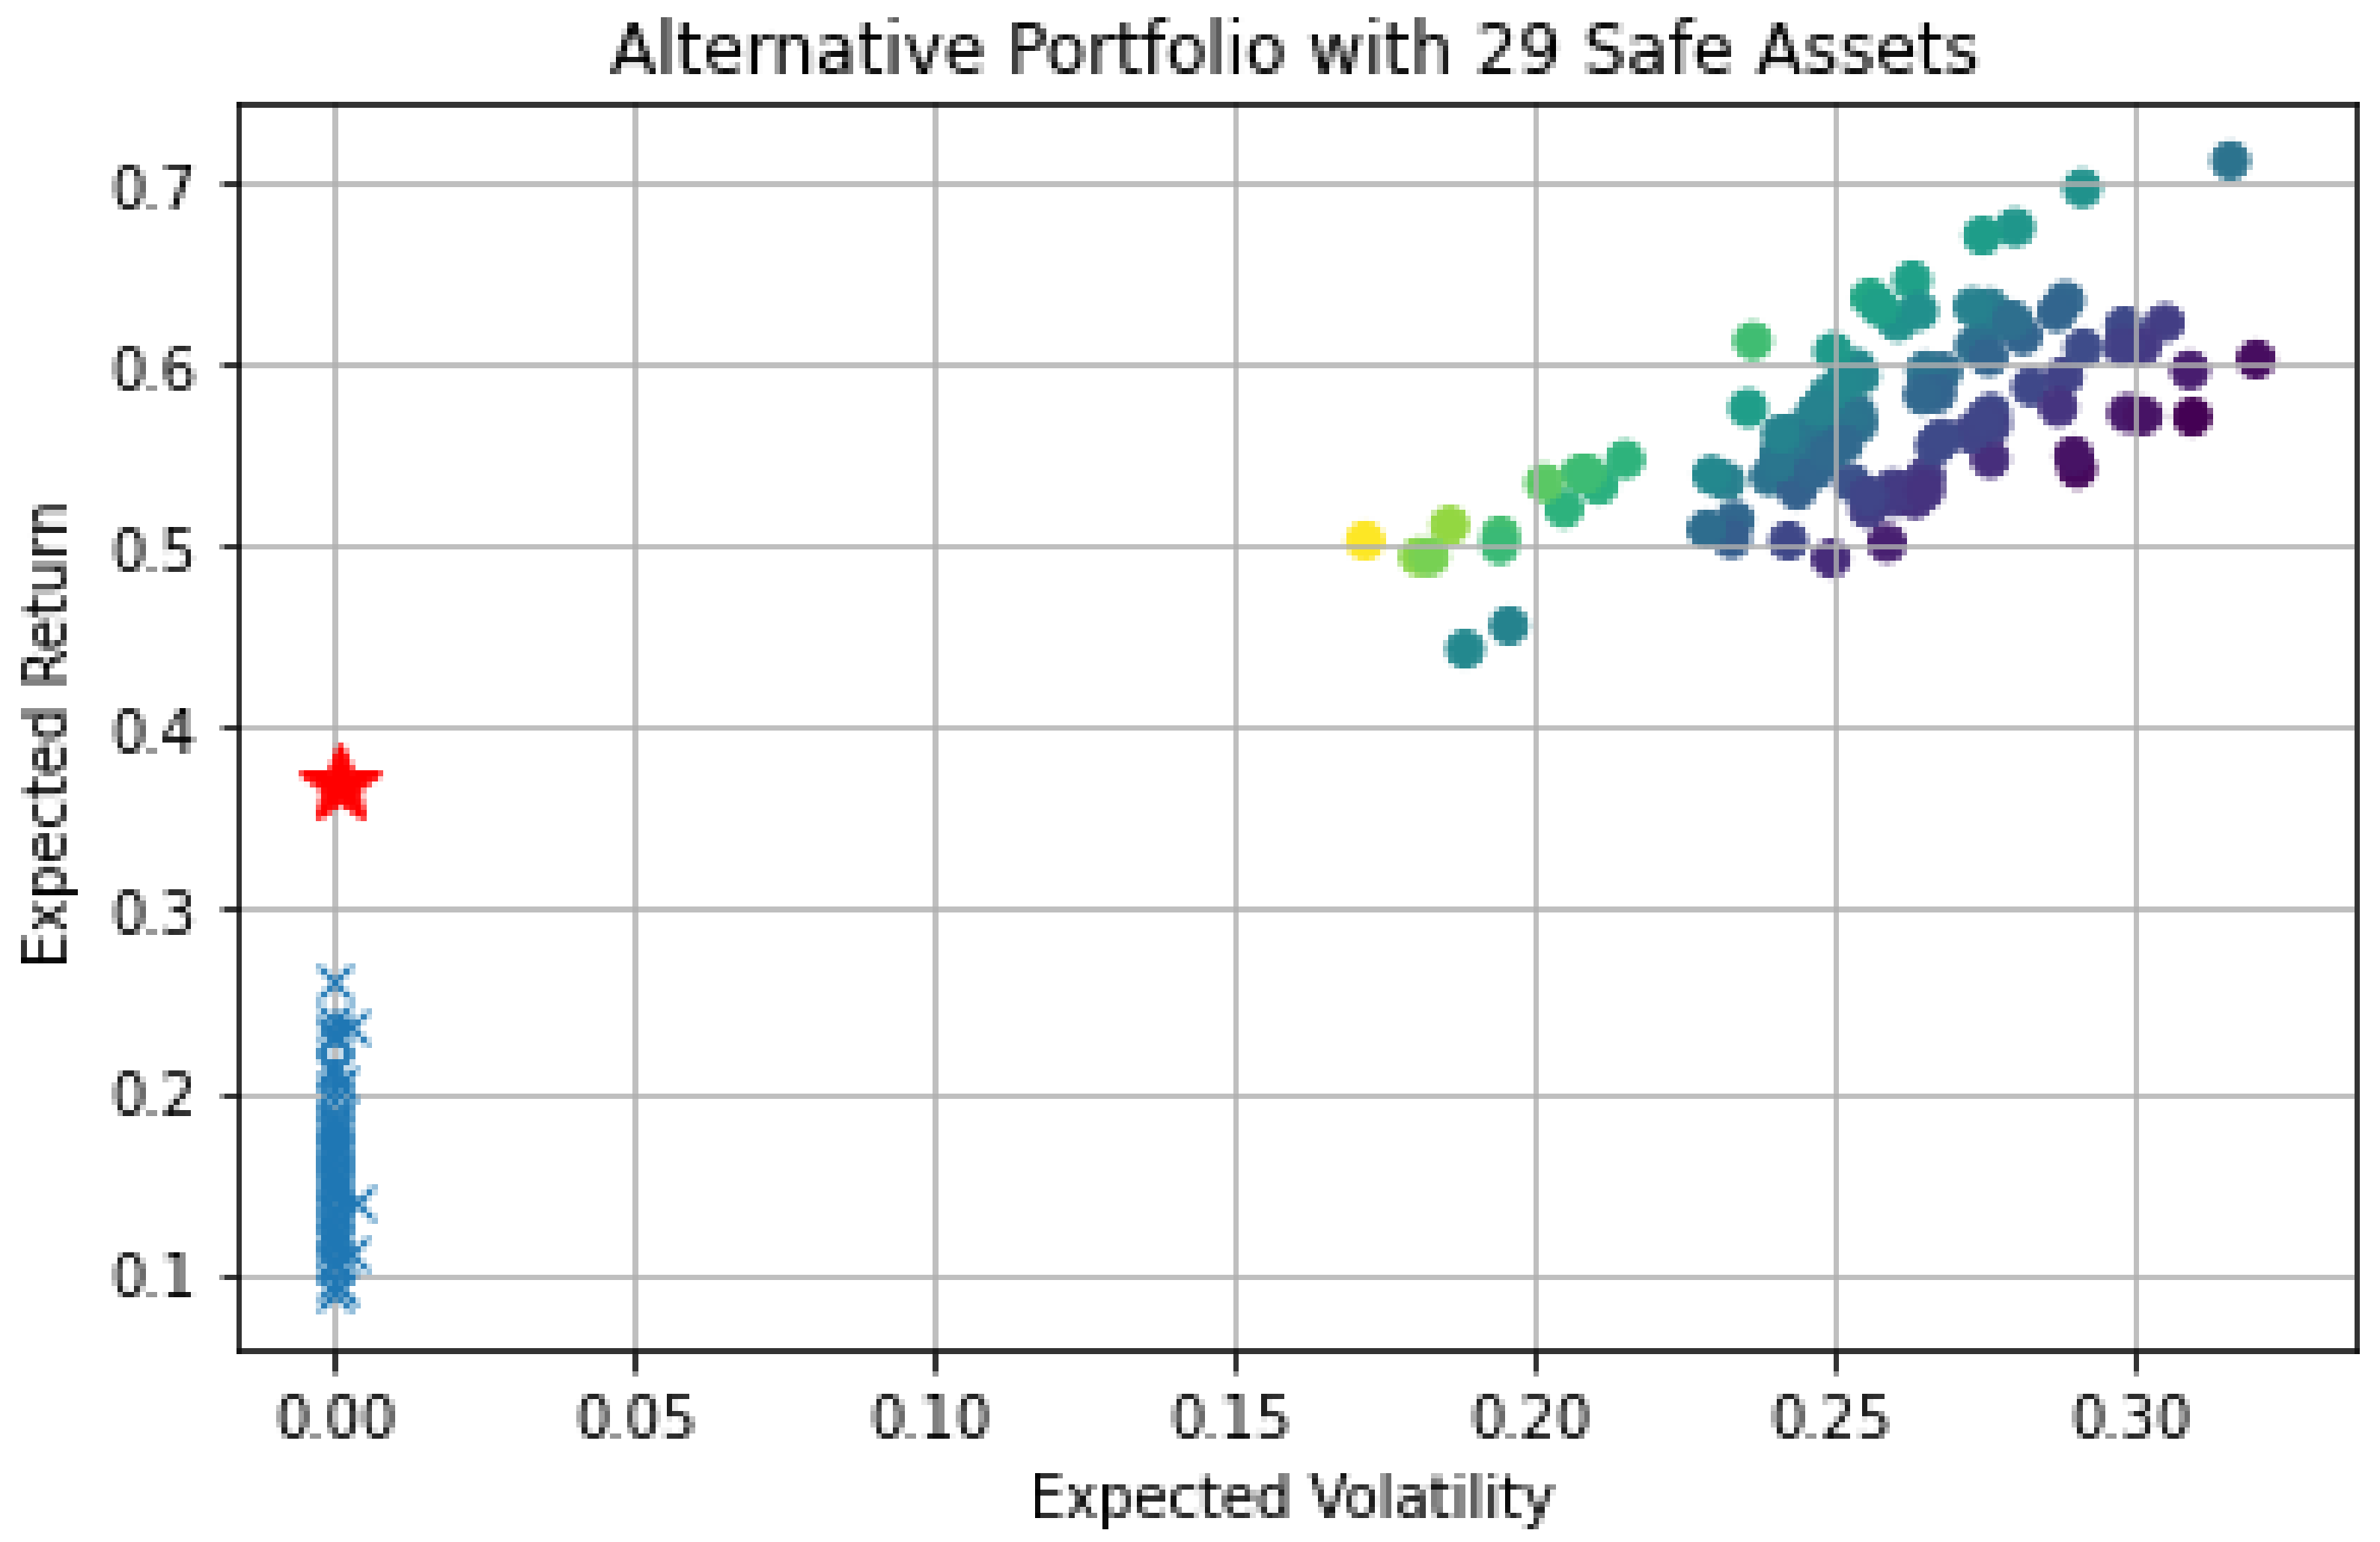
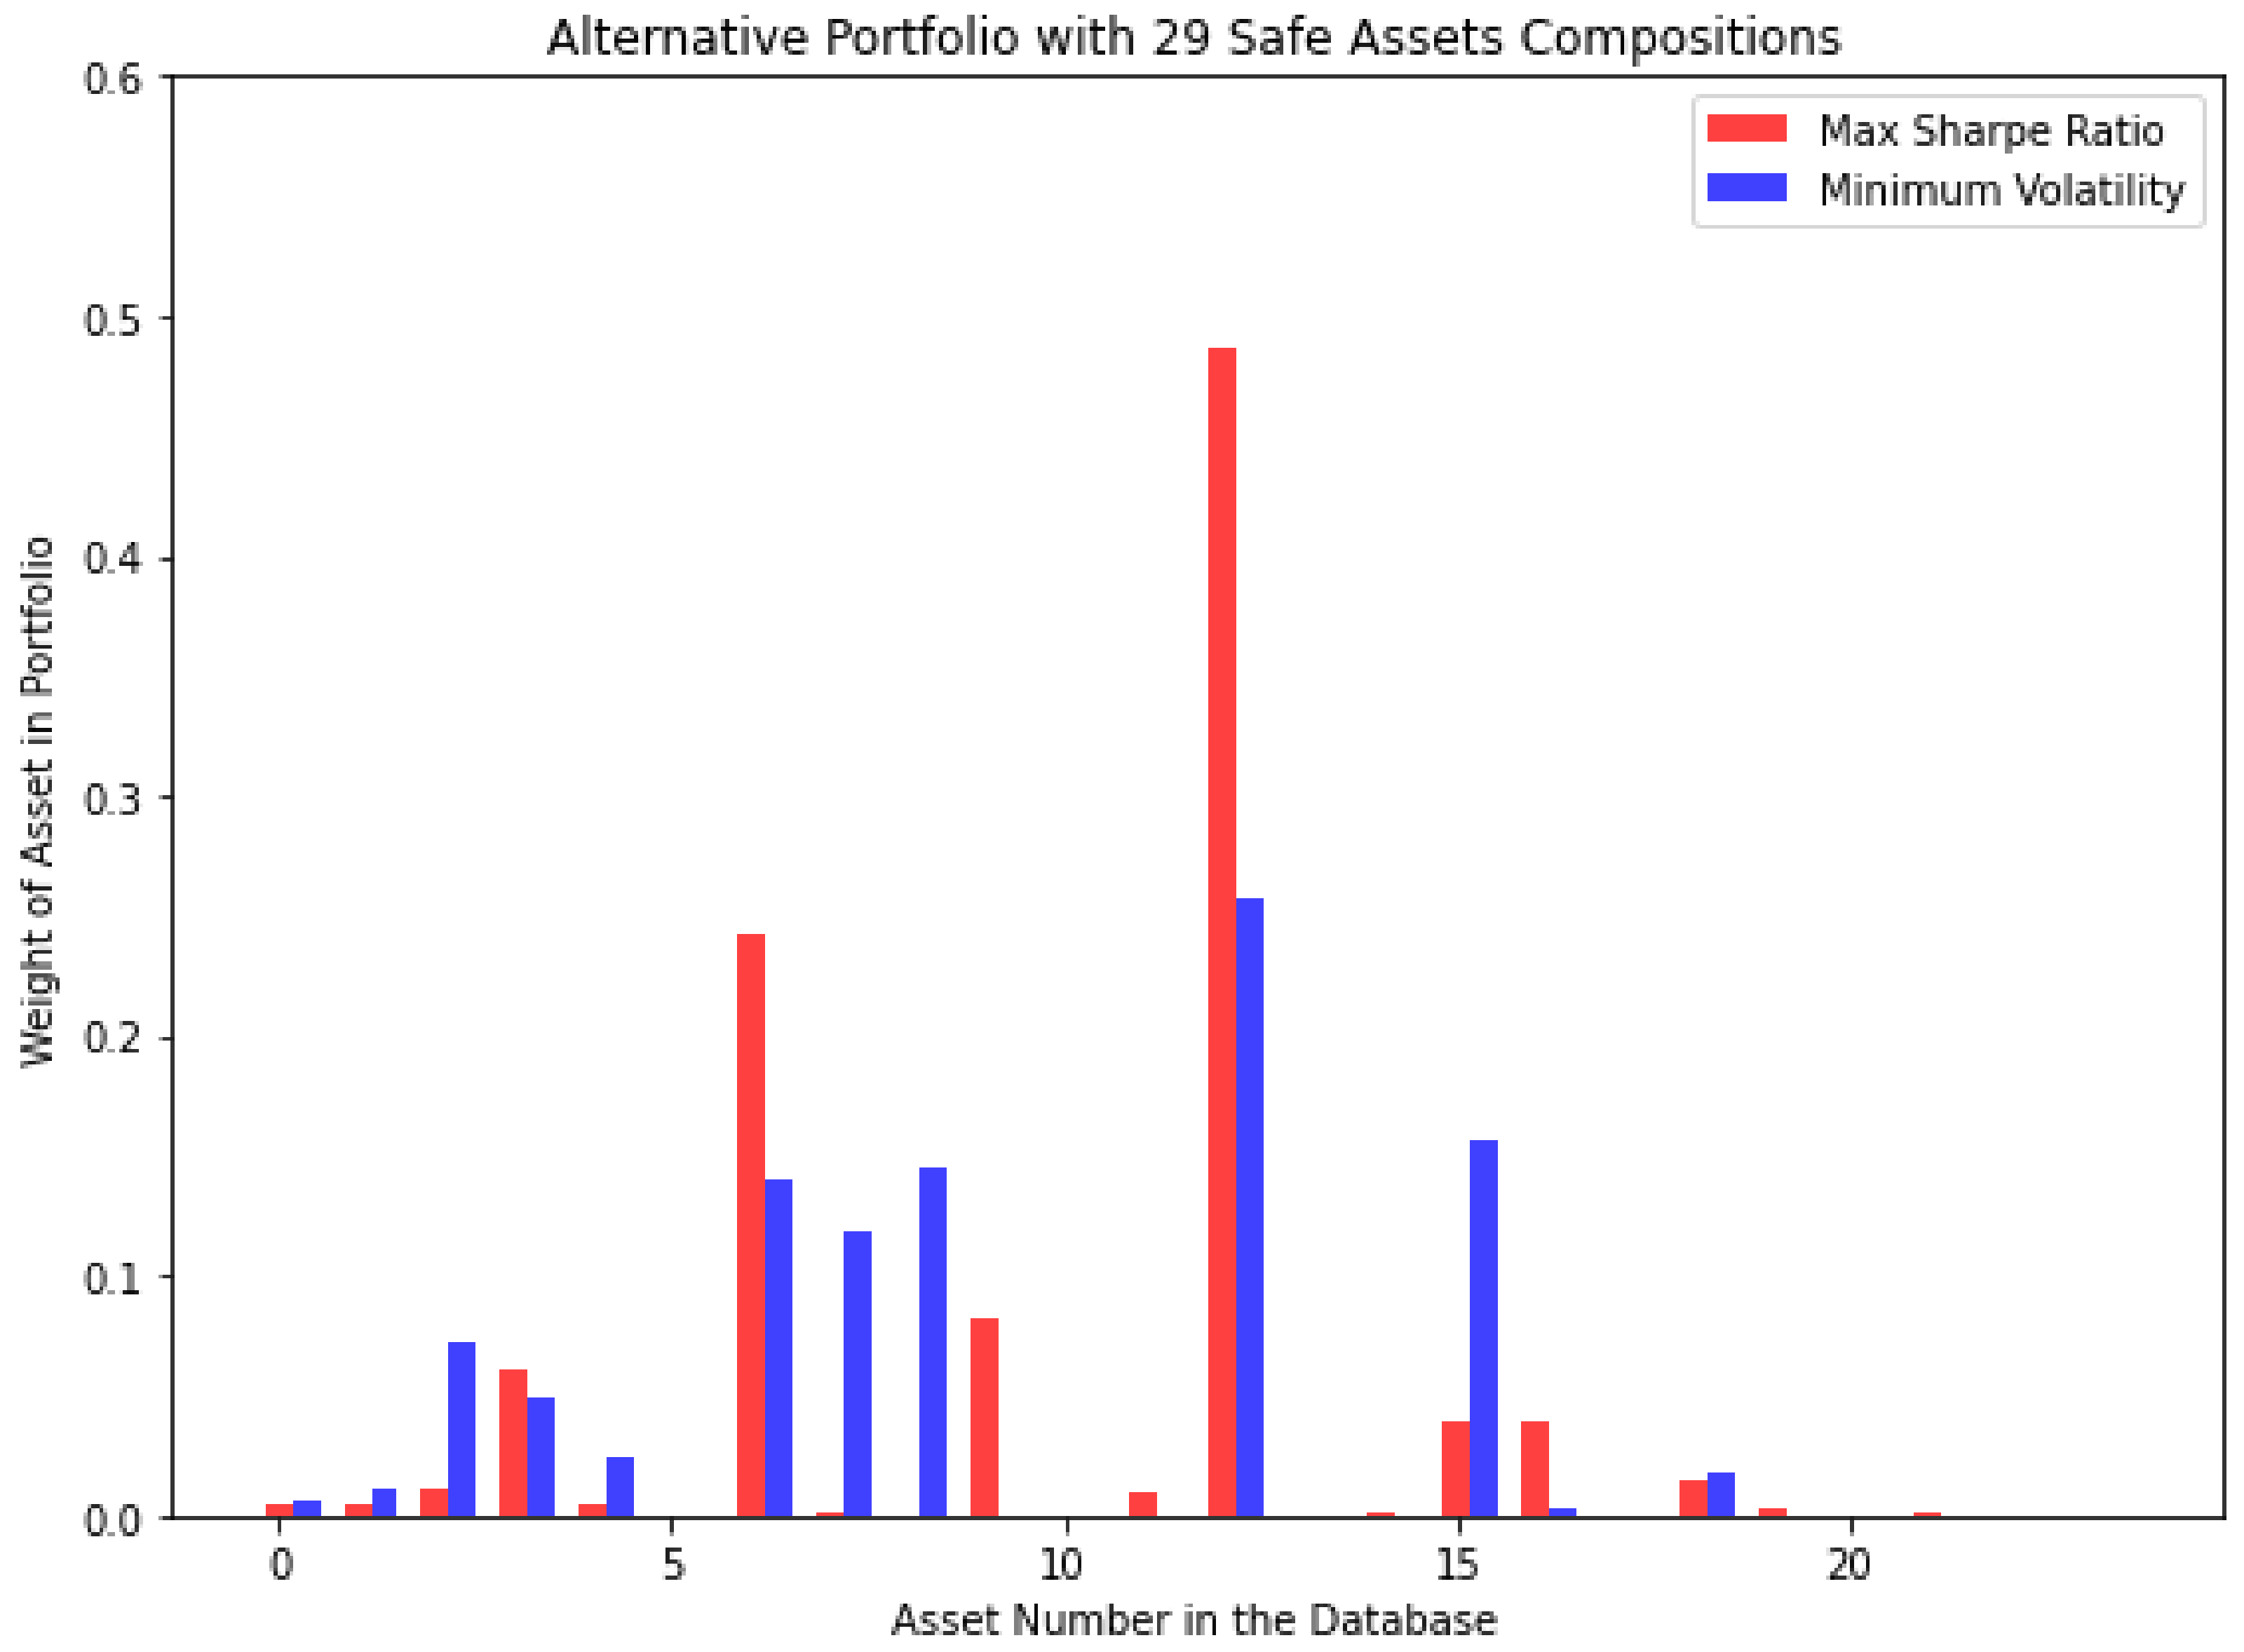
5.1.2. Alternative Portfolio Results
- Soybean Futures CBOT;
- XRP-USD;
- Perth Mint Gold Token USD.
- IPC MEXICO;
- Bitcoin Cash USD.
5.2. Robustness Checks
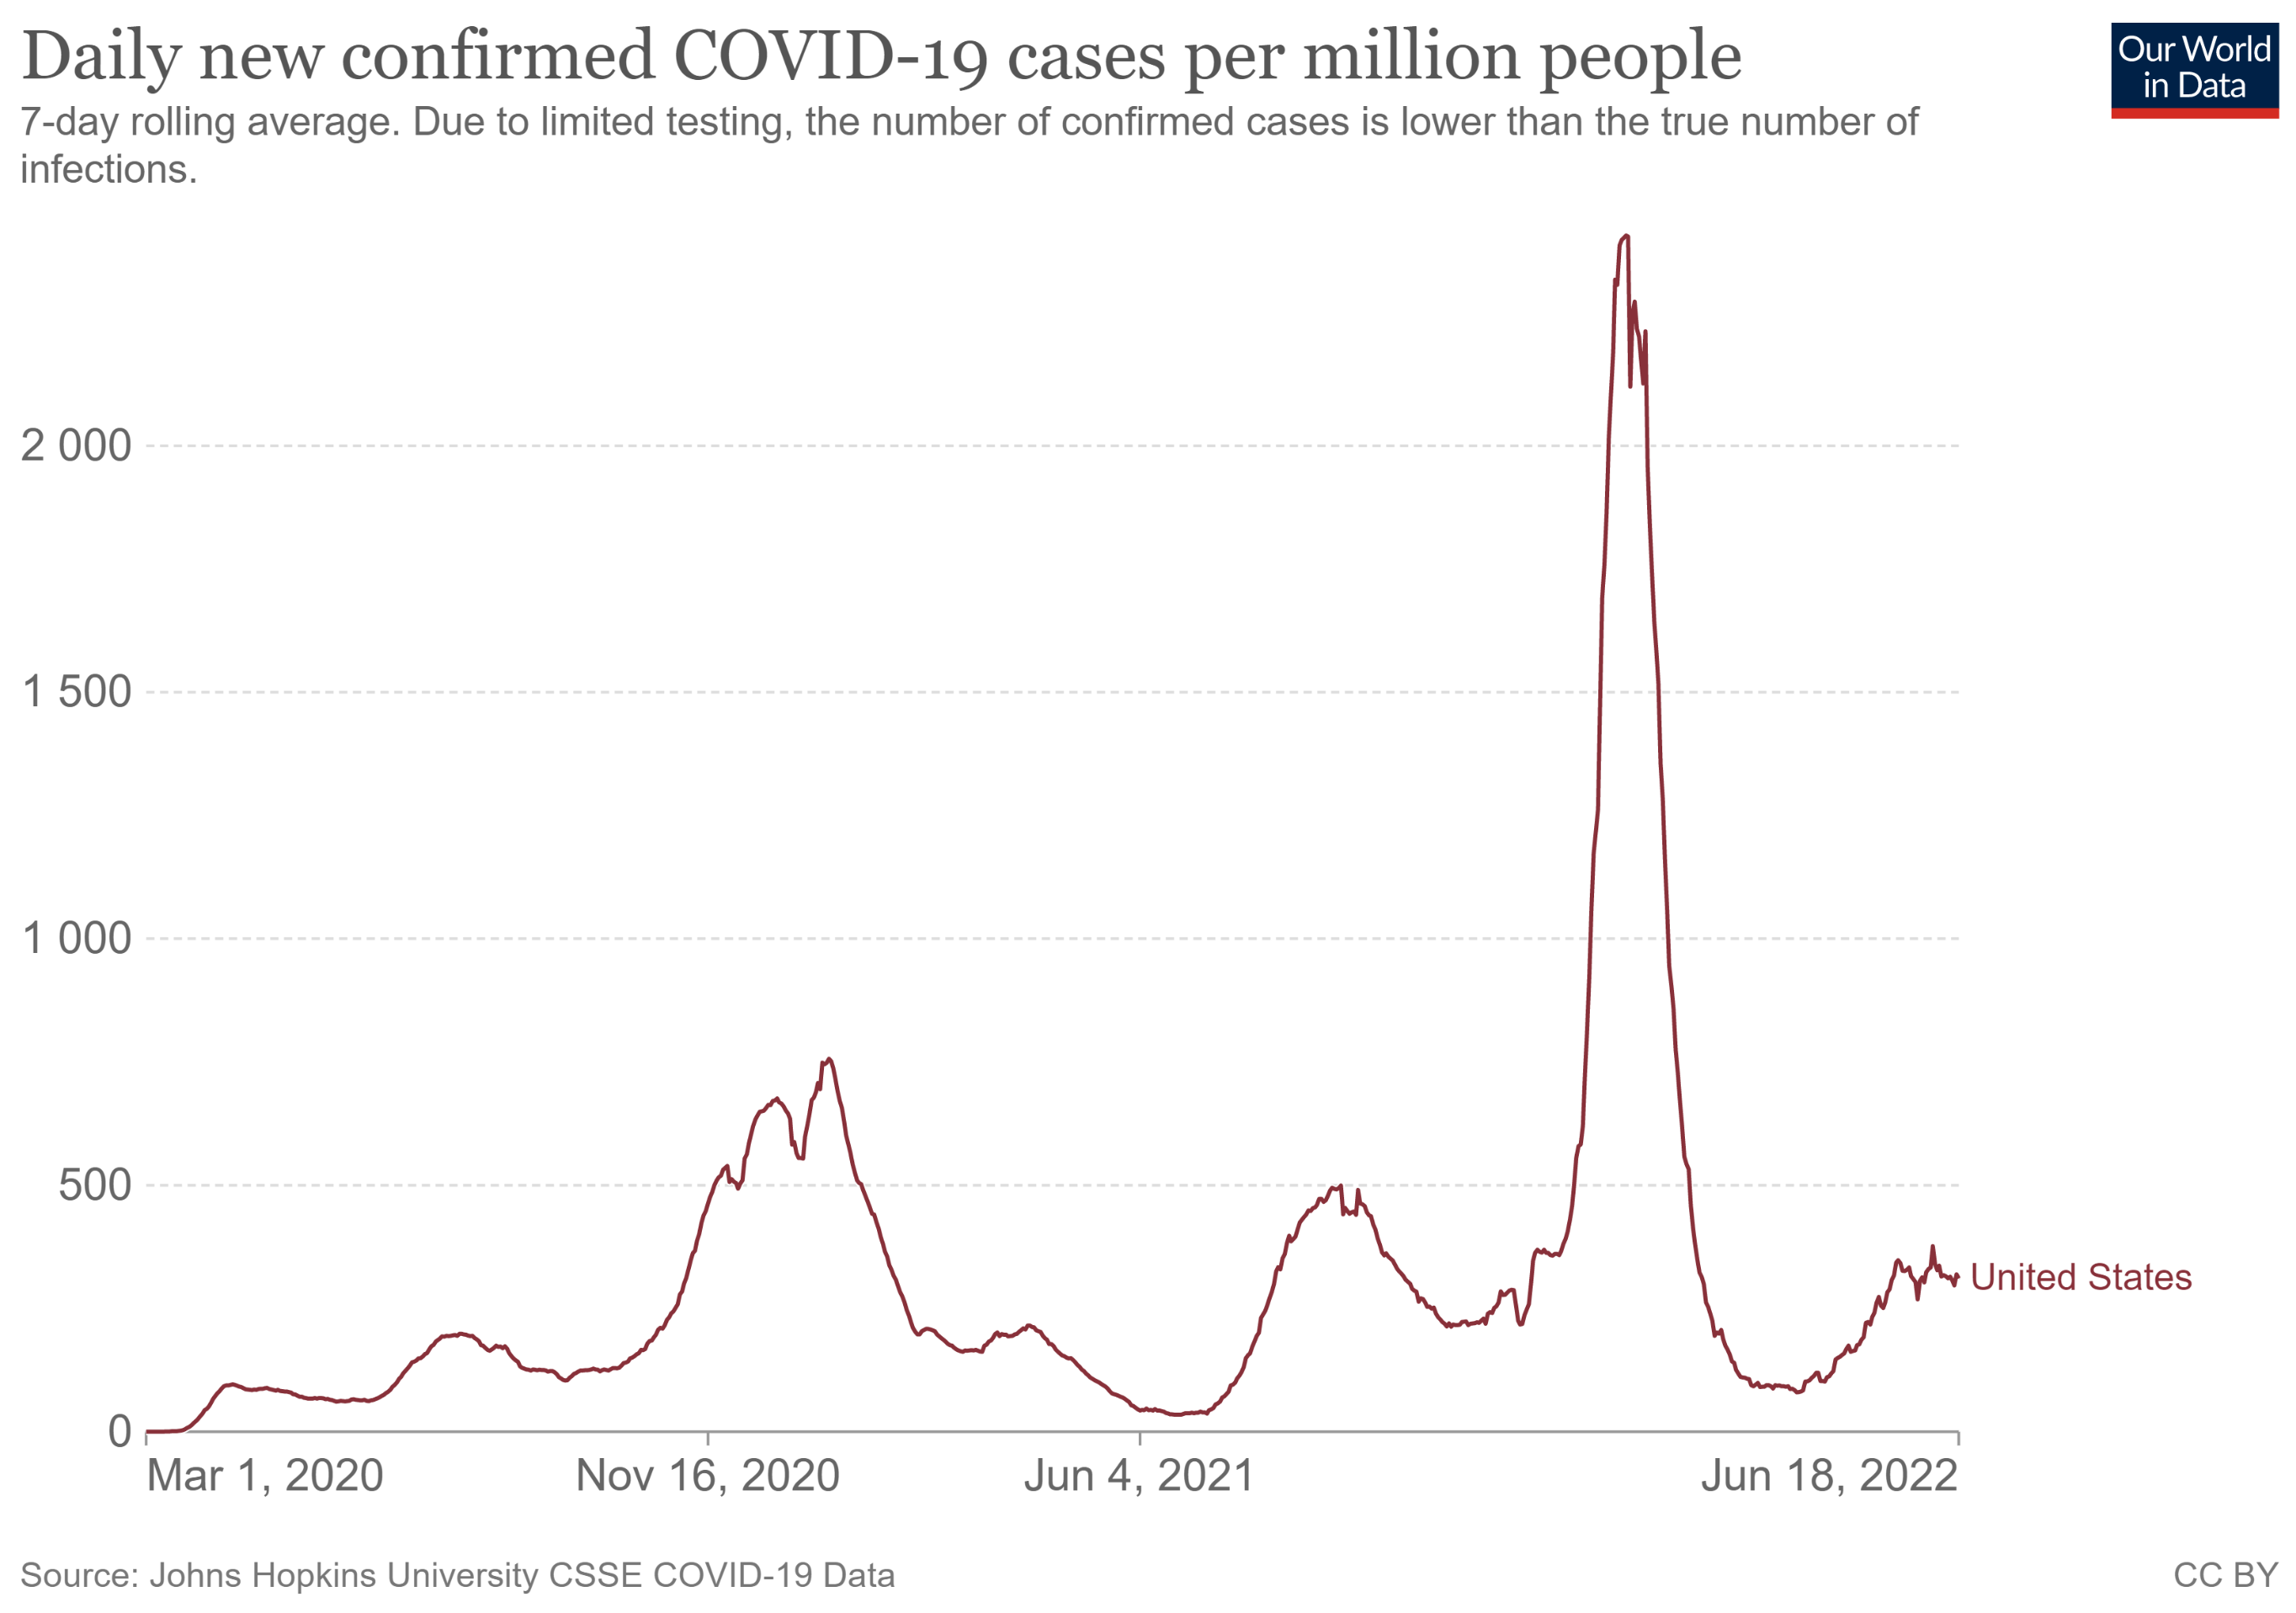
- From 2019-11-01 to 2020-10-31;
- From 2020-11-01 to 2021-05-31;
- From 2021-07-31 to 2022-03-31.
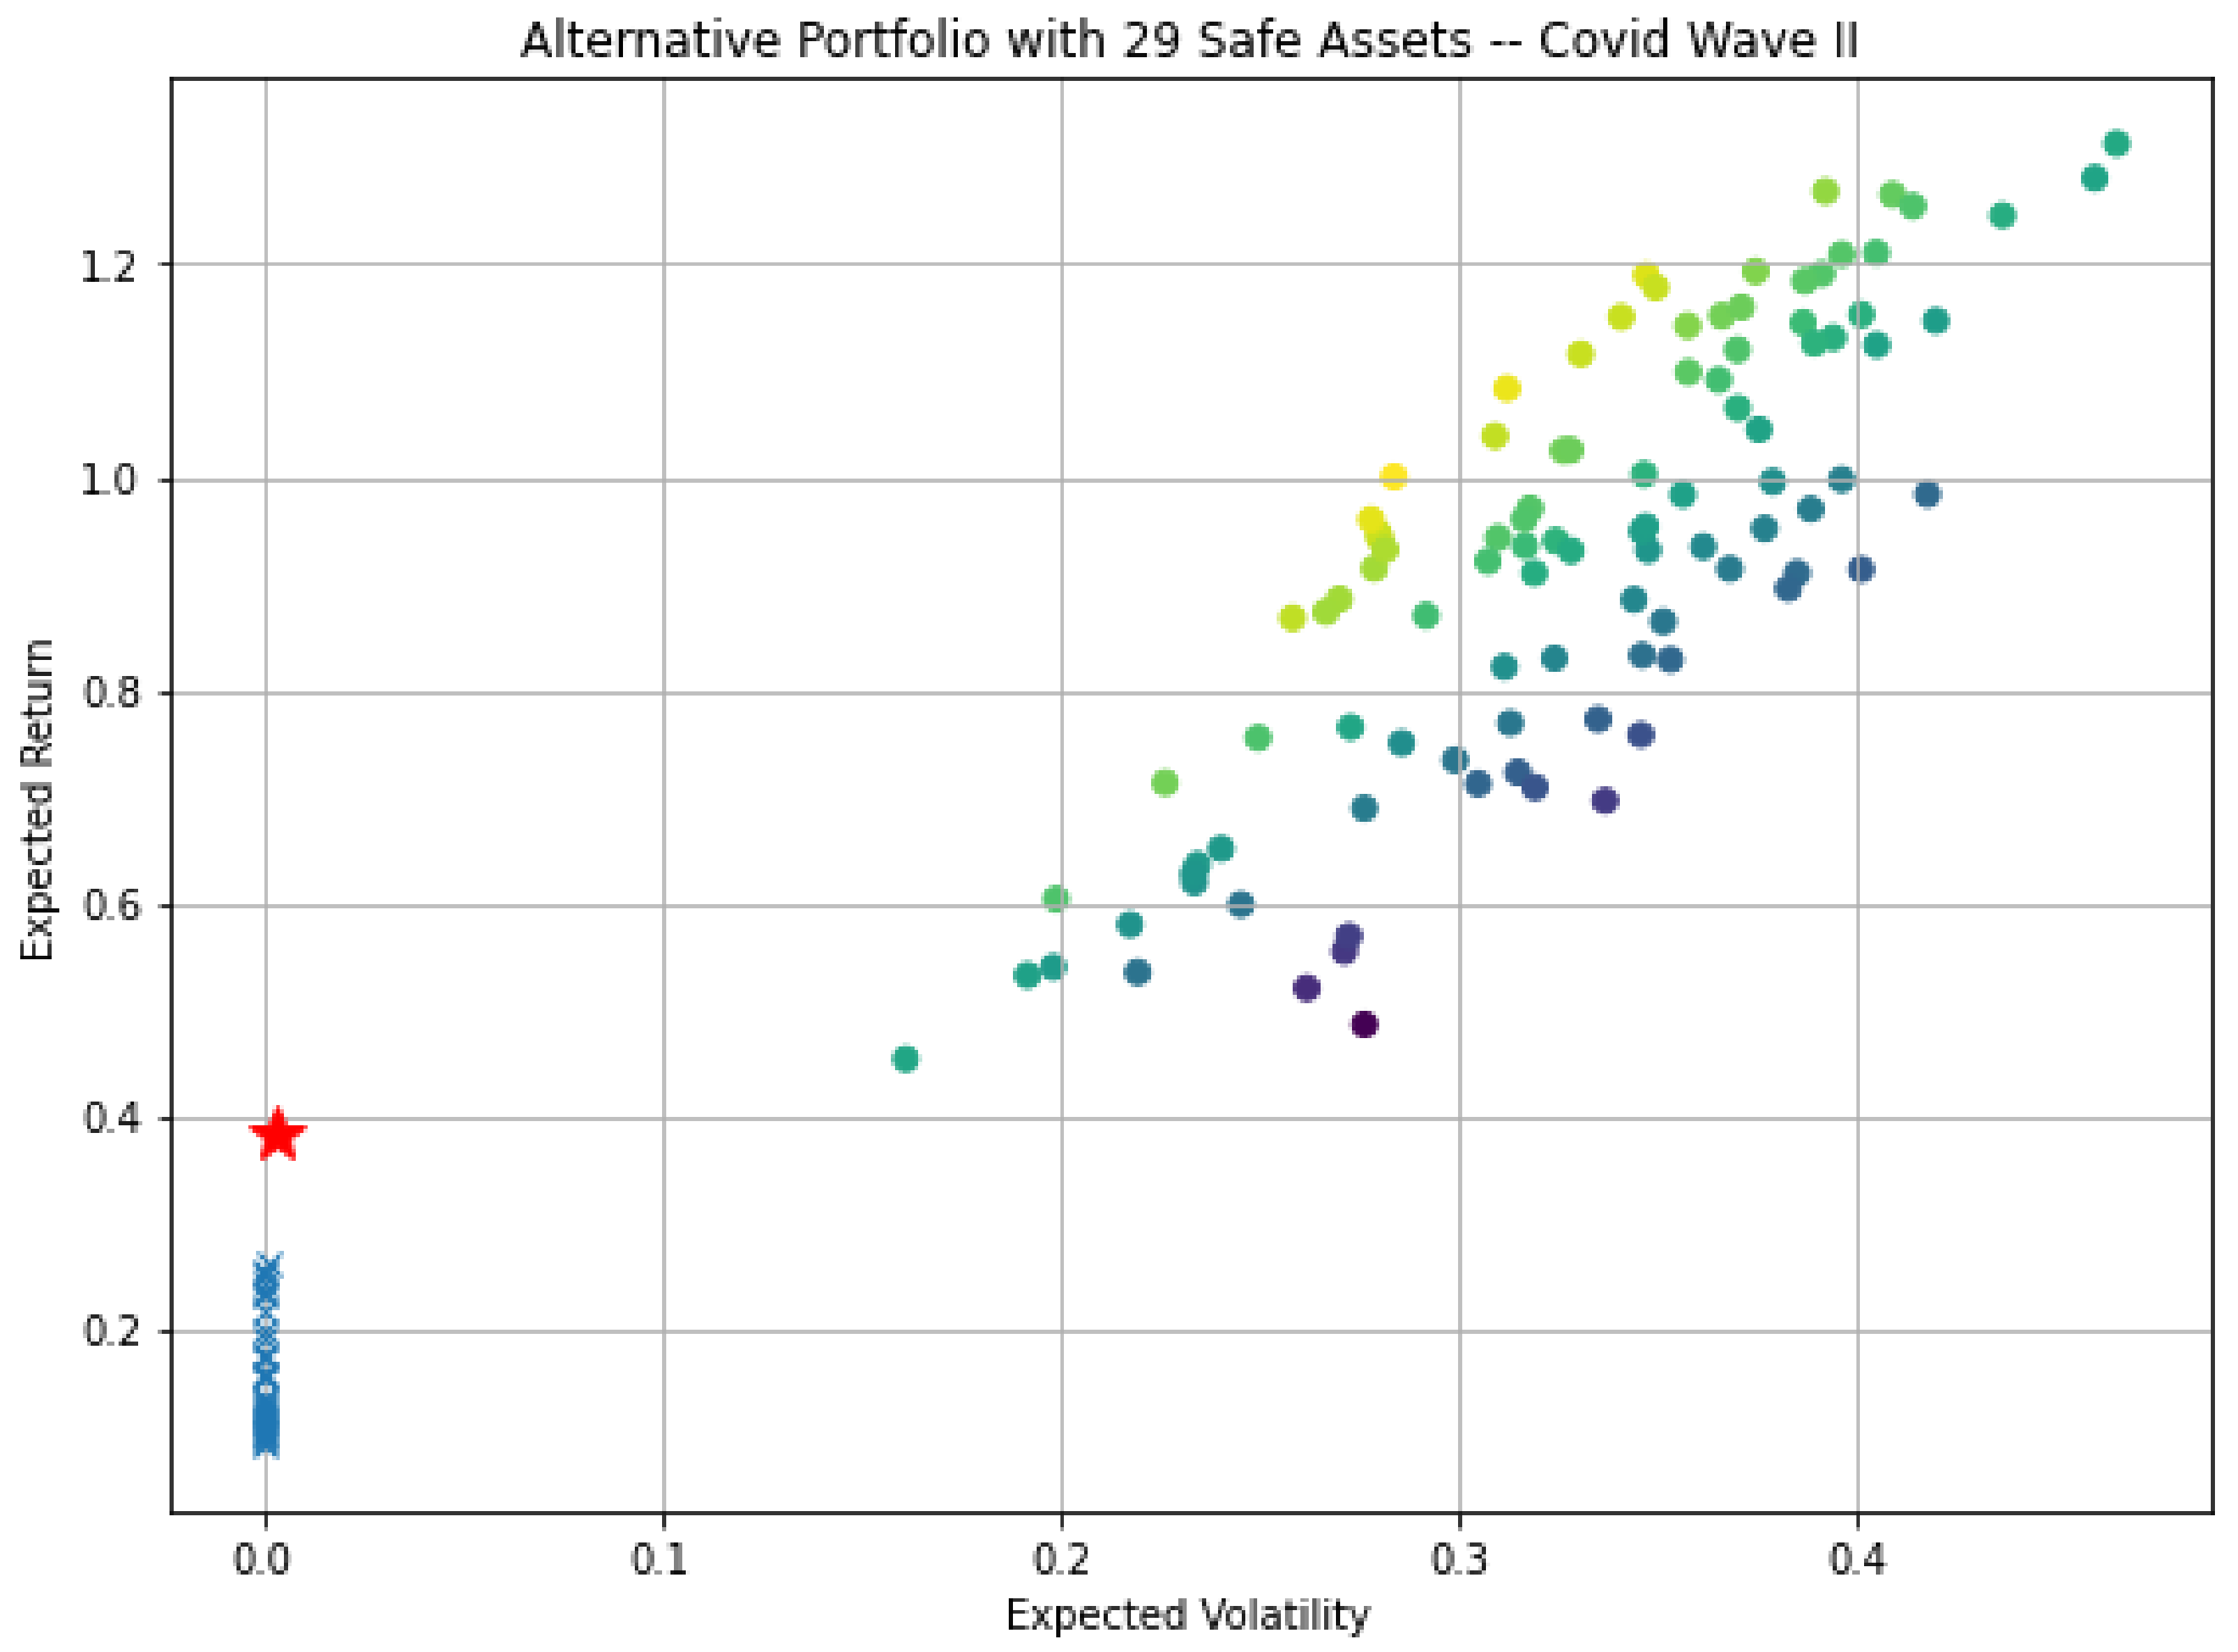
5.2.1. COVID-19 Wave II
- S&P 500;
- PAXG-USD;
- Perth Mint Gold Token USD.
- SSE Composite Index;
- CHF–USD.
5.2.2. COVID-19 Wave III
- Shenzhen Component;
- JPY-USD;
- U.S. Global GO GOLD and Precious Metal Miners ETF.
- MERVAL;
- Soybean Futures;
- USDT-USD.
5.2.3. Risk Parity versus Equal Weighting
Risk Parity
Equal Weighting
- Phase I: A mix of stock markets (China, Australia, Mexico and Argentina), and a basket of commodities and cryptocurrencies;
- Phase II: S&P500 and the gold-backed tokens PAXG and PMGT;
- Phase III: Chinese stocks, Yen currency, and physical goldmine ETFs.
5.3. Policy Implications
6. Conclusions
Funding
Institutional Review Board Statement
Informed Consent Statement
Data Availability Statement
Acknowledgments
Conflicts of Interest
Appendix A
Appendix A.1. Non-Nested Version of [1]’s Safe-Haven Regressions
Appendix A.2. DCC Model

| Variable | Mean | Median | Minimum | Maximum |
|---|---|---|---|---|
| GSPC | 3117.7 | 3193.9 | 2237.4 | 3580.8 |
| DJI | 25,843 | 26,379 | 18,592 | 29,101 |
| IXIC | 10,008 | 10,402 | 6860.7 | 12,056 |
| RUT | 1417.2 | 1452.1 | 991.16 | 1649.1 |
| GDAXI | 11,921 | 12,495 | 8441.7 | 13,255 |
| FCHI | 4758.4 | 4875.9 | 3754.8 | 5197.8 |
| N100 | 943.18 | 972.5 | 733.93 | 1017.8 |
| N225 | 21,758 | 22,549 | 16,553 | 23,671 |
| HSI | 24,378 | 24,458 | 21,696 | 26,339 |
| SS | 3098.5 | 3214.1 | 2660.2 | 3451.1 |
| SZ | 12,159 | 12,817 | 9691.5 | 14,149 |
| AXJO | 5773.6 | 5927.6 | 4735.7 | 6210.3 |
| AORD | 5898.3 | 6069.2 | 4753.3 | 6414.2 |
| JKSE | 4892.4 | 4958.8 | 3937.6 | 5371.5 |
| KS11 | 2137.3 | 2184.3 | 1457.6 | 2443.6 |
| GSPTSE | 15,408 | 15,671 | 11,229 | 16,790 |
| BVSP | 91804 | 95983 | 63570 | 1.06 × 10 |
| MXX | 36,821 | 36,981 | 32,964 | 39,954 |
| MERV | 40,799 | 42,748 | 22,087 | 52,513 |
| CHFUSDX | 1.0654 | 1.0612 | 1.0114 | 1.1077 |
| JPYUSDX | 0.0093679 | 0.00936 | 0.0089855 | 0.0095863 |
| EURUSDX | 1.1387 | 1.1339 | 1.0657 | 1.1948 |
| GBPUSDX | 1.2667 | 1.2609 | 1.1494 | 1.3399 |
| GOAU | 19.983 | 20.643 | 10.635 | 25.583 |
| GCF | 1807.6 | 1799.2 | 1477.3 | 2051.5 |
| SIF | 20.553 | 18.983 | 11.735 | 29.249 |
| PAF | 2097.3 | 2154.1 | 1449.9 | 2454 |
| PLF | 849.27 | 858.1 | 595.9 | 1009.6 |
| GDF | 316.88 | 334.6 | 245.9 | 360.1 |
| CLF | 34.371 | 39.22 | −37.63 | 43.39 |
| ZSF | 912.05 | 884.25 | 821.75 | 1087.8 |
| KCF | 109.94 | 109.15 | 93.65 | 134.8 |
| BTCF | 9751.5 | 9655 | 4930 | 13685 |
| BTGUSD | 8.9524 | 9.0663 | 5.9208 | 11.628 |
| BCHUSD | 244.95 | 238.15 | 170.74 | 317.3 |
| LTCUSD | 47.343 | 45.924 | 32.876 | 67.028 |
| ETHUSD | 278.39 | 244.14 | 110.61 | 477.05 |
| USDTUSD | 1.0015 | 1.0011 | 0.97425 | 1.0202 |
| XRPUSD | 0.22113 | 0.20518 | 0.14106 | 0.31477 |
| XLMUSD | 0.075237 | 0.07354 | 0.035161 | 0.11365 |
| DOGEUSD | 0.0026639 | 0.002596 | 0.001566 | 0.00475 |
| XMRUSD | 77.576 | 67.922 | 33.816 | 133.73 |
| ZECUSD | 56.183 | 55.515 | 24.504 | 96.03 |
| DASHUSD | 74.994 | 73.189 | 42.945 | 100.56 |
| DGXUSD | 58.306 | 57.899 | 47.26 | 68.394 |
| PAXGUSD | 1819.9 | 1801.6 | 1513.5 | 2083.3 |
| PMGTUSD | 1818.3 | 1798.6 | 1438.8 | 2173.4 |
| XAUTUSD | 1805 | 1795 | 1466.9 | 2014 |
| VIX | 32.733 | 28.51 | 21.35 | 82.69 |
| FTSE | 5951.9 | 6000 | 4993.9 | 6484.3 |
| EUROBOND | 22.951 | 23.06 | 21.79 | 23.6 |
| US30Y | 1.3948 | 1.372 | 0.937 | 1.918 |
| US10Y | 0.72545 | 0.676 | 0.499 | 1.471 |
| US5Y | 0.40394 | 0.335 | 0.195 | 1.318 |
| US13WK | 0.19722 | 0.11 | −0.105 | 1.518 |
| GSPC | 302.8 | 0.097122 | −0.81474 | −0.06963 |
| DJI | 2291.3 | 0.088662 | −0.93106 | 0.29012 |
| IXIC | 1335 | 0.13339 | −0.63954 | −0.59918 |
| RUT | 163.72 | 0.11553 | −0.77733 | −0.3176 |
| GDAXI | 1231.9 | 0.10334 | −0.97326 | −0.14441 |
| FCHI | 301 | 0.063257 | −1.0631 | 0.55411 |
| N100 | 62.133 | 0.065876 | −1.1804 | 0.77202 |
| N225 | 1875.6 | 0.086201 | −1.0678 | 0.034426 |
| HSI | 793.67 | 0.032556 | −0.49475 | 0.86656 |
| SS | 240.06 | 0.077474 | −0.1275 | −1.6337 |
| SZ | 1376.2 | 0.11318 | −0.22476 | −1.5779 |
| AXJO | 374.67 | 0.064894 | −1.0154 | −0.052617 |
| AORD | 420.36 | 0.071267 | −0.98265 | −0.1473 |
| JKSE | 298.4 | 0.060992 | −0.81914 | 0.39934 |
| KS11 | 236.87 | 0.11082 | −0.73733 | −0.35043 |
| GSPTSE | 1189.6 | 0.077205 | −1.3052 | 1.248 |
| BVSP | 10,827 | 0.11793 | −0.75801 | −0.78076 |
| MXX | 1429.3 | 0.038818 | −0.61974 | −0.14357 |
| MERV | 7872.8 | 0.19297 | −0.78904 | −0.37632 |
| CHFUSDX | 0.029413 | 0.027608 | −0.069166 | −1.562 |
| JPYUSDX | 0.0001176 | 0.012553 | −0.6437 | 0.81207 |
| EURUSDX | 0.040198 | 0.035303 | −0.18048 | −1.5264 |
| GBPUSDX | 0.037276 | 0.029428 | −0.43277 | 0.21355 |
| GOAU | 3.6367 | 0.18199 | −0.85314 | −0.024357 |
| GCF | 125.62 | 0.069499 | −0.35429 | −0.48181 |
| SIF | 4.8286 | 0.23494 | 0.09444 | −1.4002 |
| PAF | 211.42 | 0.1008 | −0.57303 | −0.13504 |
| PLF | 82.21 | 0.096801 | −0.60296 | 0.3686 |
| GDF | 38.71 | 0.12216 | −0.61853 | −1.1208 |
| CLF | 10.239 | 0.29789 | −2.7282 | 13.67 |
| ZSF | 76.078 | 0.083415 | 0.9121 | −0.53116 |
| KCF | 9.9735 | 0.090715 | 0.43049 | −0.45326 |
| BTCF | 1858 | 0.19053 | −0.36163 | −0.30078 |
| BTGUSD | 1.084 | 0.12109 | −0.15058 | −0.34292 |
| BCHUSD | 25.953 | 0.10595 | 0.56283 | 0.44416 |
| LTCUSD | 6.5943 | 0.13929 | 0.79179 | 0.20097 |
| ETHUSD | 94.811 | 0.34057 | 0.095365 | −1.3247 |
| USDTUSD | 0.0046009 | 0.004594 | −1.2207 | 14.747 |
| XRPUSD | 0.039326 | 0.17784 | 0.46479 | −0.53483 |
| XLMUSD | 0.01851 | 0.24602 | −0.20333 | −0.39884 |
| DOGEUSD | 0.0005364 | 0.20138 | 0.50818 | 0.89287 |
| XMRUSD | 22.987 | 0.29631 | 0.67723 | −0.18783 |
| ZECUSD | 15.341 | 0.27306 | 0.30926 | −0.24892 |
| DASHUSD | 8.5303 | 0.11375 | 0.28582 | 1.9477 |
| DGXUSD | 3.5698 | 0.061226 | −0.29486 | 0.62835 |
| PAXGUSD | 121.36 | 0.066685 | −0.14414 | −0.67559 |
| PMGTUSD | 134.5 | 0.073972 | −0.20357 | −0.40763 |
| XAUTUSD | 123.04 | 0.068164 | −0.3203 | −0.49998 |
| VIX | 11.645 | 0.35577 | 2.1719 | 4.7363 |
| FTSE | 270.06 | 0.045374 | −1.1288 | 1.7434 |
| EUROBOND | 0.43657 | 0.019022 | −0.5369 | −0.71108 |
| US30Y | 0.16006 | 0.11476 | 0.98626 | 1.5418 |
| US10Y | 0.17981 | 0.24786 | 2.2695 | 5.3534 |
| US5Y | 0.20918 | 0.51784 | 2.5682 | 6.8095 |
| US13WK | 0.31325 | 1.5883 | 3.2977 | 10.057 |
| GSPC | 2476.9 | 3484.5 | 465.18 | 0 |
| DJI | 21067 | 28512 | 3501.9 | 0 |
| IXIC | 7374.2 | 11693 | 2089 | 0 |
| RUT | 1086.9 | 1627.9 | 241.75 | 0 |
| GDAXI | 9547.4 | 13,193 | 2029.6 | 0 |
| FCHI | 4208.6 | 5080.8 | 471.89 | 0 |
| N100 | 828 | 1007.4 | 96.42 | 0 |
| N225 | 17,845 | 23,559 | 3048.6 | 0 |
| HSI | 23,066 | 25,546 | 972.85 | 0 |
| SS | 2751.7 | 3404.7 | 464.98 | 0 |
| SZ | 10110 | 13851 | 2676.8 | 0 |
| AXJO | 5005 | 6173.2 | 586.75 | 0 |
| AORD | 5016.3 | 6382.7 | 652.35 | 0 |
| JKSE | 4418.7 | 5280.4 | 485.38 | 0 |
| KS11 | 1688.1 | 2407.5 | 407.23 | 0 |
| GSPTSE | 12,707 | 16,625 | 1444.5 | 0 |
| BVSP | 71,277 | 1.04 × 10 | 20,040 | 0 |
| MXX | 33,923 | 38,708 | 1772.2 | 0 |
| MERV | 24,478 | 50,998 | 8672 | 0 |
| CHFUSDX | 1.0244 | 1.1028 | 0.060738 | 0 |
| JPYUSDX | 0.0091647 | 0.009552 | 0.0001665 | 0 |
| EURUSDX | 1.0804 | 1.1874 | 0.08307 | 0 |
| GBPUSDX | 1.22 | 1.322 | 0.057138 | 0 |
| GOAU | 12.31 | 24.295 | 4.6113 | 0 |
| GCF | 1587.3 | 1968.1 | 206.25 | 0 |
| SIF | 14.076 | 27.602 | 8.709 | 0 |
| PAF | 1756.8 | 2391.1 | 335.65 | 0 |
| PLF | 712.48 | 970.65 | 109.15 | 0 |
| GDF | 249.86 | 360.02 | 72.61 | 0 |
| CLF | 17.073 | 42.751 | 13.6 | 0 |
| ZSF | 830.85 | 1061.8 | 114.88 | 0 |
| KCF | 95.95 | 129.93 | 14.25 | 0 |
| BTCF | 6389.5 | 12728 | 2108.8 | 0 |
| BTGUSD | 7.3048 | 10.655 | 1.6849 | 0 |
| BCHUSD | 216.09 | 296.36 | 30.77 | 0 |
| LTCUSD | 39.14 | 59.358 | 6.5723 | 0 |
| ETHUSD | 134.98 | 416.17 | 170.38 | 0 |
| USDTUSD | 0.99706 | 1.0079 | 0.002584 | 0 |
| XRPUSD | 0.16575 | 0.2976 | 0.05463 | 0 |
| XLMUSD | 0.040603 | 0.10505 | 0.019332 | 0 |
| DOGEUSD | 0.001813 | 0.003517 | 0.000634 | 0 |
| XMRUSD | 47.062 | 127 | 29.484 | 0 |
| ZECUSD | 31.875 | 84.1 | 18.816 | 0 |
| DASHUSD | 65.982 | 92.32 | 9.5895 | 0 |
| DGXUSD | 52.921 | 63.905 | 4.5996 | 0 |
| PAXGUSD | 1630.3 | 1986.7 | 199.32 | 0 |
| PMGTUSD | 1608.9 | 1991 | 221.91 | 0 |
| XAUTUSD | 1634.5 | 1982.6 | 200.05 | 0 |
| VIX | 22.289 | 61.662 | 8.22 | 0 |
| FTSE | 5371 | 6292.6 | 290.76 | 0 |
| EUROBOND | 22.22 | 23.539 | 0.715 | 0 |
| US30Y | 1.1983 | 1.7338 | 0.1695 | 0 |
| US10Y | 0.562 | 1.127 | 0.1145 | 0 |
| US5Y | 0.2291 | 0.9082 | 0.1185 | 0 |
| US13WK | −0.0325 | 1.2205 | 0.0525 | 0 |
References
- Baur, D.G.; McDermott, T.K. Is gold a safe haven? International evidence. J. Bank. Financ. 2010, 34, 1886–1898. [Google Scholar] [CrossRef]
- Kliber, A. Looking for a safe haven against American stocks during COVID-19 pandemic. N. Am. J. Econ. Financ. 2022, 63, 101825. [Google Scholar] [CrossRef]
- Wasiuzzaman, S.; Rahman, H.S.W.H.A. Performance of gold-backed cryptocurrencies during the COVID-19 crisis. Financ. Res. Lett. 2021, 43, 101958. [Google Scholar] [CrossRef] [PubMed]
- Jalan, A.; Matkovskyy, R.; Yarovaya, L. “Shiny” crypto assets: A systemic look at gold-backed cryptocurrencies during the COVID-19 pandemic. Int. Rev. Financ. Anal. 2021, 78, 101958. [Google Scholar] [CrossRef] [PubMed]
- Baur, D.G.; Dimpfl, T. A Safe Haven Index. 2021. Available online: https://papers.ssrn.com/sol3/papers.cfm?abstract_id=3641589 (accessed on 19 January 2023).
- Mokni, K.; Youssef, M.; Ajmi, A.N. COVID-19 pandemic and economic policy uncertainty: The first test on the hedging and safe haven properties of cryptocurrencies. Res. Int. Bus. Financ. 2022, 60, 101573. [Google Scholar] [CrossRef]
- Ji, Q.; Zhang, D.; Zhao, Y. Searching for safe-haven assets during the COVID-19 pandemic. Int. Rev. Financ. Anal. 2020, 71, 101526. [Google Scholar] [CrossRef]
- Salisu, A.A.; Raheem, I.D.; Vo, X.V. Assessing the safe haven property of the gold market during COVID-19 pandemic. Int. Rev. Financ. Anal. 2021, 74, 101666. [Google Scholar] [CrossRef]
- Lahiani, A.; Mefteh-Wali, S.; Vasbieva, D.G. The safe-haven property of precious metal commodities in the COVID-19 era. Resour. Policy 2021, 74, 102340. [Google Scholar] [CrossRef]
- Kumar, A.S.; Padakandla, S.R. Testing the safe-haven properties of gold and bitcoin in the backdrop of COVID-19: A wavelet quantile correlation approach. Financ. Res. Lett. 2022, 47, 102707. [Google Scholar] [CrossRef]
- Tronzano, M. Optimal Portfolio Allocation between Global Stock Indexes and Safe Haven Assets: Gold versus the Swiss Franc (1999–2021). J. Risk Financ. Manag. 2022, 15, 241. [Google Scholar] [CrossRef]
- Baur, D.G.; Lucey, B.M. Is gold a hedge or a safe haven? An analysis of stocks, bonds and gold. Financ. Rev. 2010, 45, 217–229. [Google Scholar] [CrossRef]
- Akhtaruzzaman, M.; Boubaker, S.; Lucey, B.M.; Sensoy, A. Is gold a hedge or a safe-haven asset in the COVID–19 crisis? Econ. Model. 2021, 102, 105588. [Google Scholar] [CrossRef]
- Klein, T.; Thu, H.P.; Walther, T. Bitcoin is not the New Gold—A comparison of volatility, correlation, and portfolio performance. Int. Rev. Financ. Anal. 2018, 59, 105–116. [Google Scholar] [CrossRef]
- Wen, F.; Tong, X.; Ren, X. Gold or Bitcoin, which is the safe haven during the COVID-19 pandemic? Int. Rev. Financ. Anal. 2022, 81, 102121. [Google Scholar] [CrossRef]
- Mariana, C.D.; Ekaputra, I.A.; Husodo, Z.A. Are Bitcoin and Ethereum safe-havens for stocks during the COVID-19 pandemic? Financ. Res. Lett. 2021, 38, 101798. [Google Scholar] [CrossRef]
- Allen, D.E. Cryptocurrencies, Diversification and the COVID-19 Pandemic. J. Risk Financ. Manag. 2022, 15, 103. [Google Scholar] [CrossRef]
- Maasoumi, E.; Wu, X. Contrasting cryptocurrencies with other assets: Full distributions and the COVID Impact. J. Risk Financ. Manag. 2021, 14, 440. [Google Scholar] [CrossRef]
- Kristoufek, L. Grandpa, grandpa, tell me the one about Bitcoin being a safe haven: New evidence from the COVID-19 pandemic. Front. Phys. 2020, 8, 296. [Google Scholar] [CrossRef]
- Conlon, T.; Corbet, S.; McGee, R.J. Are cryptocurrencies a safe haven for equity markets? An international perspective from the COVID-19 pandemic. Res. Int. Bus. Financ. 2020, 54, 101248. [Google Scholar] [CrossRef]
- Lahmiri, S.; Bekiros, S. The impact of COVID-19 pandemic upon stability and sequential irregularity of equity and cryptocurrency markets. Chaos Solitons Fractals 2020, 138, 109936. [Google Scholar] [CrossRef]
- Grobys, K. When Bitcoin has the flu: On Bitcoin’s performance to hedge equity risk in the early wake of the COVID-19 outbreak. Appl. Econ. Lett. 2021, 28, 860–865. [Google Scholar] [CrossRef]
- Yan, K.; Yan, H.; Gupta, R. Are GARCH and DCC values of 10 cryptocurrencies affected by COVID-19? J. Risk Financ. Manag. 2022, 15, 113. [Google Scholar] [CrossRef]
- Hasan, M.B.; Hassan, M.K.; Rashid, M.M.; Alhenawi, Y. Are safe haven assets really safe during the 2008 global financial crisis and COVID-19 pandemic? Glob. Financ. J. 2021, 50, 100668. [Google Scholar] [CrossRef]
- Kyriazis, N.A.; Daskalou, K.; Arampatzis, M.; Prassa, P.; Papaioannou, E. Estimating the volatility of cryptocurrencies during bearish markets by employing GARCH models. Heliyon 2019, 5, e02239. [Google Scholar] [CrossRef] [PubMed]
- Disli, M.; Nagayev, R.; Salim, K.; Rizkiah, S.K.; Aysan, A.F. In search of safe haven assets during COVID-19 pandemic: An empirical analysis of different investor types. Res. Int. Bus. Financ. 2021, 58, 101461. [Google Scholar] [CrossRef]
- Glosten, L.R.; Jagannathan, R.; Runkle, D.E. On the relation between the expected value and the volatility of the nominal excess return on stocks. J. Financ. 1993, 48, 1779–1801. [Google Scholar] [CrossRef]
- Aielli, G.P. Dynamic conditional correlation: On properties and estimation. J. Bus. Econ. Stat. 2013, 31, 282–299. [Google Scholar] [CrossRef]
- Ghalanos, A. rmgarch: Multivariate GARCH models, CRAN. R Package Version 2019, 1, 1–3. [Google Scholar]
- Haugen, R.A.; Baker, N.L. The efficient market inefficiency of capitalization–weighted stock portfolios. J. Portf. Manag. 1991, 17, 35–40. [Google Scholar] [CrossRef]
- Chan, L.K.; Karceski, J.; Lakonishok, J. On portfolio optimization: Forecasting covariances and choosing the risk model. Rev. Financ. Stud. 1999, 12, 937–974. [Google Scholar] [CrossRef]
- Jagannathan, R.; Ma, T. Risk reduction in large portfolios: Why imposing the wrong constraints helps. J. Financ. 2003, 58, 1651–1683. [Google Scholar] [CrossRef]
- Clarke, R.G.; De Silva, H.; Thorley, S. Minimum-variance portfolios in the US equity market. J. Portf. Manag. 2006, 33, 10–24. [Google Scholar] [CrossRef]
- Chevallier, J.; Vo, D.T. Portfolio allocation across variance risk premia. J. Risk Financ. 2019, 20, 556–593. [Google Scholar] [CrossRef]
- Maillard, S.; Roncalli, T.; Teïletche, J. The properties of equally weighted risk contribution portfolios. J. Portf. Manag. 2010, 36, 60–70. [Google Scholar] [CrossRef]
- Chow, T.m.; Hsu, J.; Kalesnik, V.; Little, B. A survey of alternative equity index strategies. Financ. Anal. J. 2011, 67, 37–57. [Google Scholar] [CrossRef]
- Hood, M.; Malik, F. Is gold the best hedge and a safe haven under changing stock market volatility? Rev. Financ. Econ. 2013, 22, 47–52. [Google Scholar] [CrossRef]
- Aboura, S.; Chevallier, J. Cross-market index with Factor-DCC. Econ. Model. 2014, 40, 158–166. [Google Scholar] [CrossRef]
- Engle, R. Dynamic conditional correlation: A simple class of multivariate generalized autoregressive conditional heteroskedasticity models. J. Bus. Econ. Stat. 2002, 20, 339–350. [Google Scholar] [CrossRef]
- Engle, R. Anticipating Correlations: A New Paradigm for Risk Management; Princeton University Press: Princeton, NJ, USA, 2009. [Google Scholar]


| PMGT | US10Y | GOLD | BITCOIN | |
| a0 (Hedge) | 0.0591 | 1.5785 *** | 0.1159 *** | 0.8979 *** |
| a1 (Safe Haven) | −0.0037 | −0.0118 | −0.0028 | 0.0064 |
| ETHER | DGX | PAXG | TETHER_G | |
| a0 (Hedge) | 1.1553 *** | 0.1590 * | 0.0169 | 0.0738 ** |
| a1 (Safe Haven) | 0.0107 | 0.0022 | −0.0013 | −0.0046 * |
| PMGT | US10Y | GOLD | BITCOIN | |
| a0 (Hedge) | 2.9919 | 1.3934 | 0.3280 | 0.5823 |
| a1 (Safe Haven) | −0.5534 *** | 0.4205 * | −0.6862 *** | −0.4321 ** |
| ETHER | DGX | PAXG | TETHER_G | |
| a0 (Hedge) | 1.7682 | 0.7993 | 0.1943 | −3.0741 |
| a1 (Safe Haven) | −0.4986 ** | −0.5328 ** | 0.1887 | 1.2622 *** |
| Stock Markets | |||
| 1 | S&P 500 | 15 | ALL ORDINARIES |
| 2 | Dow Jones Industrial Average | 16 | Jakarta Composite Index |
| 3 | NASDAQ Composite | 17 | KOSPI Composite Index |
| 4 | Russell 2000 | 18 | S&P/TSX Composite index |
| 5 | VIX | 19 | IBOVESPA |
| 6 | FTSE 100 | 20 | IPC MEXICO |
| 7 | DAX PERFORMANCE-INDEX | 21 | MERVAL |
| 8 | CAC 40 | ||
| 9 | Euronext 100 Index | ||
| 10 | Nikkei 225 | ||
| 11 | HANG SENG INDEX | ||
| 12 | SSE Composite Index | ||
| 13 | Shenzhen Component | ||
| 14 | S&P/ASX 200 | ||
| Bonds | 34 | Palladium Futures NY Mercantile. | |
| 22 | 13 Week US Treasury Bill | 35 | Platinum Futures NY Mercantile. |
| 23 | US Treasury Government Bond 5 Years | Other Commodities | |
| 24 | US Treasury Government Bond 10 Years | 36 | S&P-GSCI Commodity Index. |
| 25 | US Treasury Government Bond 30 Years | 37 | Crude Oil Futures NY Mercantile. |
| 26 | Euro area 10-year Government Bonds ECB | 38 | Soybean Futures CBOT. |
| Exchange Rates | 39 | Orange Juice ICE Futures. | |
| 27 | CHF/USD | 40 | Coffee ICE Futures. |
| 28 | JPY/USD | ||
| 29 | EUR/USD | ||
| 30 | GBP/USD | ||
| Precious Metals | |||
| 31 | GO GOLD and Precious Metal Miners ETF | ||
| 32 | Gold Futures COMEX. Currency in USD | ||
| 33 | Silver Futures COMEX. Currency in USD | ||
| Cryptocurrencies | 52 | Dash USD CoinMarketCap. | |
| 41 | Bitcoin Futures CME. USD | Gold-backed Cryptocurrencies | |
| 42 | Bitcoin Gold USD CoinMarketCap. | 53 | Digix Gold Token USD. |
| 43 | Bitcoin Cash USD CoinMarketCap. | 54 | PAX Gold USD. |
| 44 | Litecoin USD CoinMarketCap. | 55 | Perth Mint Gold Token USD. |
| 45 | Ethereum USD CoinMarketCap. | 56 | Tether Gold USD. |
| Stablecoins | |||
| 46 | Tether USD CoinMarketCap. | ||
| 47 | XRP USD CoinMarketCap. | ||
| 48 | Stellar USD CoinMarketCap. | ||
| Dog coins | |||
| 49 | Dogecoin USD CoinMarketCap. | ||
| Cryptocurrencies for Privacy | |||
| 50 | Monero USD CoinMarketCap. | ||
| 51 | Zcash USD CoinMarketCap. |
| Stock Markets | Other Commodities | ||
| 1 | S&P 500 | 36 | S&P-GSCI Commodity Index |
| 15 | ALL ORDINARIES | 38 | Soybean Futures CBOT |
| 12 | SSE Composite Index | Cryptocurrencies for Value | |
| 13 | Shenzhen Component | 43 | Bitcoin Cash USD |
| 17 | KOSPI Composite Index | 44 | Litecoin USD |
| 20 | IPC MEXICO | Stablecoins | |
| 21 | MERVAL | 46 | Tether USD CoinMarketCap. |
| Bonds | 47 | XRP USD CoinMarketCap. | |
| 22 | 13 Week US Treasury Bill | Dog coins | |
| 23 | US Treasury Government Bond 5 Years | 49 | Dogecoin USD |
| 24 | US Treasury Government Bond 10 Years | Cryptocurrencies for Privacy | |
| 25 | US Treasury Government Bond 30 Years | 50 | Monero USD CoinMarketCap. |
| 26 | Euro area 10-year Government Bonds | 51 | Zcash USD CoinMarketCap. |
| Exchange Rates | Gold-backed Cryptocurrencies | ||
| 27 | CHF/USD | 53 | Digix gold token USD. |
| 28 | JPY/USD | 54 | PAX Gold USD. |
| Precious Metals | 55 | Perth Mint Gold Token USD. | |
| 31 | GO GOLD and Precious Metal Miners ETF | 56 | Tether Gold USD. |
| 32 | Gold Futures COMEX. Currency in USD |
| Portfolio Performance: 2019-11-01 to 2020-10-31 | ||
|---|---|---|
| Metric | Risk Parity | Equal Weighted |
| Start Balance | 10,000,000$ | 10,000,000$ |
| End Balance | 10,714,670$ | 12,294,860$ |
| Expected Return | 7.15% | 22.95% |
| Standard Deviation | 2.31% | 24.63% |
| Sharpe Ratio | 2.82 | 0.94 |
| Jensen’s Alpha | 5.87% | 6.54% |
| CAPM Beta | 0.05 | 0.76 |
| Stock Market Correlation | 0.56 | 0.85 |
| Portfolio Performance: 2020-11-01 to 2021-05-31 | ||
|---|---|---|
| Metric | Risk Parity | Equal Weighted |
| Start Balance | 10,000,000$ | 10,000,000$ |
| End Balance | 10,178,590$ | 18,556,710$ |
| Expected Return | 1.79% | 85.57% |
| Standard Deviation | 2.40% | 50.18% |
| Sharpe Ratio | 0.73 | 1.46 |
| Jensen’s Alpha | −2.35% | 39.90% |
| CAPM Beta | 0.18 | 1.42 |
| Stock Market Correlation | 0.78 | 0.30 |
| Portfolio performance: 2021-07-31 to 2022-03-31 | ||
|---|---|---|
| Metric | Risk Parity | Equal Weighted |
| Start Balance | 10,000,000$ | 10,000,000$ |
| End Balance | 9,942,000$ | 12,194,170$ |
| Expected Return | −0.58% | 21.94% |
| Standard Deviation | 9.27% | 41.82% |
| Sharpe Ratio | −0.10 | 0.63 |
| Jensen’s Alpha | −2.26% | 21.49% |
| CAPM Beta | 0.39 | 1.09 |
| Stock Market Correlation | 0.79 | 0.48 |
Disclaimer/Publisher’s Note: The statements, opinions and data contained in all publications are solely those of the individual author(s) and contributor(s) and not of MDPI and/or the editor(s). MDPI and/or the editor(s) disclaim responsibility for any injury to people or property resulting from any ideas, methods, instructions or products referred to in the content. |
© 2023 by the author. Licensee MDPI, Basel, Switzerland. This article is an open access article distributed under the terms and conditions of the Creative Commons Attribution (CC BY) license (https://creativecommons.org/licenses/by/4.0/).
Share and Cite
Chevallier, J. ‘Safe Assets’ during COVID-19: A Portfolio Management Perspective. Commodities 2023, 2, 13-51. https://doi.org/10.3390/commodities2010002
Chevallier J. ‘Safe Assets’ during COVID-19: A Portfolio Management Perspective. Commodities. 2023; 2(1):13-51. https://doi.org/10.3390/commodities2010002
Chicago/Turabian StyleChevallier, Julien. 2023. "‘Safe Assets’ during COVID-19: A Portfolio Management Perspective" Commodities 2, no. 1: 13-51. https://doi.org/10.3390/commodities2010002
APA StyleChevallier, J. (2023). ‘Safe Assets’ during COVID-19: A Portfolio Management Perspective. Commodities, 2(1), 13-51. https://doi.org/10.3390/commodities2010002