1. Introduction
The consistent increase in phishing websites in the current digital landscape presents a significant risk to individuals, organizations, and overall cybersecurity. Phishing attacks, which involve fraudulent efforts to acquire sensitive information, such as usernames, passwords, and financial data, are growing in number, frequency, and sophistication, posing a formidable challenge to cybersecurity. Recent statistics highlight the severity of the threat, showing a staggering increase in phishing incidents and substantial financial losses suffered by victims globally. According to APWG [
1] and APWG [
2], the number of new unique phishing websites per month jumped to 619,060 in 2023 from 92,564 in 2016, an increase of 569%. Meanwhile, APWG [
1] observed over 1.6 million phishing attacks in the first quarter of 2023, the highest number the APWG has ever recorded. Furthermore, the Federal Bureau of Investigation (FBI) reported that they received 11 times as many complaints from phishing victims in 2020 compared to 2016 [
3]. Moreover, IBM [
4] has reported that the average global cost of data breaches for organizations due to phishing is USD 4.76 million [
5]. This represents a significant financial burden on individuals, businesses, and economies alike. In addition, other substantial impacts of phishing website attacks include damage to the reputation of businesses [
6,
7,
8,
9,
10], theft of proprietary and confidential information [
11,
12,
13], distribution of other cyberattacks [
14,
15,
16,
17], and interference with democracy [
18,
19,
20,
21].
In light of the ever-growing threat landscape and the severe consequences associated with phishing website attacks, it is critical to develop highly accurate solutions for detecting and mitigating phishing websites. ML has become a powerful tool in the realm of phishing website prediction, leveraging features and patterns derived from the website’s structure, content, and user actions to identify malicious intent. Nevertheless, the efficacy of ML models is significantly impacted by the optimization of hyperparameters, which govern the learning process and influence the model’s prediction accuracy and generalization capability. Traditional hyperparameter optimization techniques depend on manual tuning or grid search methods, which entail significant time and computational investment, and may not yield optimal results.
To address these challenges, nature-inspired metaheuristic techniques, including GAs, DE, and PSO, present viable alternatives by drawing inspiration from behaviors observed in biological and social systems, natural selection, and mutation. These techniques have shown remarkable achievements in optimizing complex functions and solving combinatorial optimization problems in various domains, including financial modelling, engineering design, and logistics, among others. For example, Da Silva [
22] applied GAs to a logistic engineering problem to enhance the efficiency of a supply chain; Akbari, et al. [
23] used DE to optimize the production of electricity with wind renewable energy; and Chen, et al. [
24] showcased the utility of PSO in optimizing financial investment and portfolio strategies for investors.
By leveraging the intrinsic advantages of these techniques, this research aims to conduct a comparative analysis that assesses the effectiveness of GAs, DE, and PSO in optimizing the hyperparameters of ML models for phishing website detection. The goal is to shed light on their potential applications in enhancing the robustness of phishing website detection solutions. To achieve the goal, six ensemble classifiers are trained and evaluated on three publicly available datasets, with the hyperparameters of each one optimized using each optimization technique. To establish the baseline for the comparative analysis, each classifier is also trained and evaluated using default hyperparameters. Statistical significance tests are carried out to assess the impact of the techniques on the performance of the classifiers against the use of default hyperparameters, enabling us to identify the most effective technique in this context. To our knowledge, this is the first comparative study of these metaheuristic techniques for tuning ML models for this problem.
The rest of the paper is arranged as follows.
Section 2 provides the background on nature-inspired optimization techniques, particularly GAs, DE, and PSO.
Section 3 explains the related works, while
Section 4 describes the methodology adopted for this study.
Section 5 explains the experiments and presents the results along with the analyses, discussions, and statistical significance tests.
Section 6 concludes the paper by revisiting the methodology and the results and highlights future work.
2. Natured-Inspired Metaheuristic Optimization Techniques
In regard to optimization, the pursuit of efficient and effective solutions to complex problems has led researchers to examine the natural world for inspiration. Nature has long been a source of inspiration for problem-solving, providing sophisticated solutions to problems by showcasing adaptation, cooperation, and self-organization observed in biological, physical, and social systems [
25]. Natural processes have inspired a variety of metaheuristic techniques that are used to solve optimization challenges in different fields by mimicking these processes. There are three categories of nature-inspired metaheuristic techniques, as follows:
Evolutionary algorithms: Evolutionary Algorithms (EAs) are based on biological evolution principles, imitating natural selection to gradually improve candidate solutions towards optimal or nearly ideal outcomes. GAs and DE are two prominent types of EAs that provide distinct methods for optimization [
26];
Swarm intelligence algorithms: They draw inspiration from the collective behaviors seen in social insects, such as ants and bees, as well as animal groups, such as bird flocks and fish schools. These algorithms utilize the collaboration and interaction among members of a group to seek the best solutions. Examples, such as PSO and Ant Colony Optimization (ACO), are derived from various features of swarm behavior [
27];
Physics-inspired metaheuristic algorithms: These replicate physical phenomena and fundamental concepts in pursuit of optimal solutions. The algorithms emulate processes, such as gravitational forces, electromagnetic fields, and thermodynamic fluctuations, to efficiently explore solution spaces. Examples of such algorithms are the Gravitational Search Algorithm (GSA) and Simulated Annealing (SA) [
28].
The techniques have demonstrated success in optimizing complex functions, thereby addressing optimization challenges in various domains, such as supply chain management [
22], engineering design [
29], machine learning tasks [
30], investment portfolio management [
24], scheduling and resource allocation [
31], and drug discovery [
32]. In light of these successes, this study aims to deploy a selected number of these techniques, based on their long proven track record, to evaluate their effectiveness in optimizing ML models for the prediction of phishing websites. The selected techniques used in this study, namely GAs, DE, and PSO, are described below in detail.
2.1. Genetic Algorithms
Among EAs, GAs stand out for being a prominent and adaptable optimization technique. They are potent heuristic search and optimization techniques that draw inspiration from natural selection and genetics. Introduced by Holland in the 1970s, GAs are known for their efficiency in navigating large solution spaces and identifying nearly optimal solutions for complex optimization challenges in diverse fields [
33].
The algorithms are based on the concept of evolution, which involves selection, crossover, and mutation, mirroring biological systems [
34,
35]. The algorithm works on a group of possible solutions, depicted as individuals or chromosomes, and iteratively evolves these solutions across generations to improve their fitness for the optimization problem. Through this process, GAs efficiently search for global solutions by balancing exploration and exploitation of the search space, making them a valuable tool in tasks such as problem-solving, optimization, and machine learning.
Figure 1 presents a flow chart of the GA optimization process.
The optimization process of GAs can be described as follows [
35]:
Initialization: To start, initialize a population P consisting of N individuals. This involves generating a series of random real values for P = {p1, p2, …., pN}, each representing a possible solution to the optimization problem;
Evaluation: Evaluate the fitness f(p) of each individual p in the population by assessing the quality of the solution based on the objective function;
Selection: Choose individuals from the population for breeding according to their fitness. Individuals with higher fitness are more likely to be chosen, similar to natural selection favouring individuals with greater reproductive success. Typical selection methods include rank-based selection, roulette wheel selection, and tournament selection;
Crossover: Combine the selected individuals to generate offspring solutions by recombination or crossover. This approach imitates genetic recombination in biological reproduction by combining traits from parent individuals to create offspring. Various crossover operators, including uniform crossover, multi-point crossover, and single-point crossover, can be used;
Mutation: This involves introducing random modifications to offspring solutions to preserve diversity and explore new areas of the solution space. Mutation aids in avoiding premature convergence and guarantees that the algorithm maintains effective exploration of the search space. Mutation operators usually alter specific bits or components of the solution representation by flipping or modifying them;
Replacement: Substituting individuals in the population with the offspring solutions, usually with elitist or tournament selection methods, to maintain high-quality solutions. Elitism ensures that the most optimal solutions within the current population are passed on to the next generation, thus avoiding the loss of valuable information;
Termination: Repeat steps 2–6 for a set number of generations or until a termination condition is satisfied, including reaching a maximum iteration limit, attaining an acceptable solution, or a lack of improvement over a consecutive generation.
2.2. Differential Evolution
DE is one of the most popular and versatile metaheuristic techniques within EAs. DE was developed in 1997 by Storn and Price, as a heuristic search algorithm influenced by natural evolution processes in biological systems [
36]. DE is based on genetic inheritance, mutation, and selection principles, allowing it to efficiently explore complex solution spaces and discover nearly optimal solutions for difficult optimization problems. DE shares evolutionary concepts with GAs and other algorithms, but stands apart due to its differential mutation technique, which enhances the exploration of the solution space and adaption to local optima [
37]. DE operates on solution vectors in continuous space, making it suitable for optimization problems with real-valued parameters, unlike GAs that use genetic operators on binary strings.
Below is the methodology that the DE uses to optimize a given problem [
36]:
- i.
Initialization: DE starts with the initialization of a population of candidate solutions randomly selected from the search space. Every candidate solution is a possible solution to the current optimization problem. The potential solutions for each generation G can be represented as:
- ii.
Mutation: DE is characterized by its unique mutation approach, in which new potential solutions (called offspring) are created by combining current solutions. Three unique individuals (vectors) are randomly selected from the population for each candidate solution xi. The individuals are identified as xr1, xr2, and xr3. The mutant vector vi is calculated by perturbing xr1 using a scaled differential variation of the difference between xr2 and xr3. The operation is represented as:
where
F is a scaling factor that controls the amplification of the differential variation;
- iii.
Crossover: DE uses a crossover operation to merge information from the target vector xi,G with the mutant vector vi,G to create a trial vector ui,G+1. The crossover process is binomial, with each element of the trial vector being derived from either the mutant vector with a probability CR or from the target vector. This operation is mathematically expressed as:
In this context, j represents the component index, D indicates the dimensionality of the problem, randb() generates a random number within the range of 0 to 1, and rnbr(i) is a randomly selected index from 1, 2….., D;
- iv.
Selection: A selection method is used to decide whether to keep the trial vector ui,G+1 or the original target vector xi,G for the following generation. This choice is based on comparing the fitness values of ui,G+1 and xi,G. If the trial vector shows better fitness than the goal vector, it will take the place of the target vector in the population;
- v.
Termination: The mutation, crossover, and selection phases are repeated in a loop for a set number of generations, or until a specific termination condition is satisfied. Typical stopping conditions are either reaching a certain number of iterations or attaining an acceptable solution.
2.3. Particle Swarm Optimization
PSO is a metaheuristic algorithm that is population-based, self-adaptive, and stochastic. It is inspired by the social behavior of swarms, such as bird flocks or fish schools [
38]. The goal is to identify the best solutions for intricate problems by continuously modifying the positions and velocities of particles that represent potential solutions [
39]. The algorithm keeps track of the global best positions and fitness values, and updates individual particle positions according to personal trajectories and the best solutions [
40]. The adaptability of PSO is enhanced by its capability to combine with other algorithms and tackle real-world problems through parallel implementations. PSO’s iterative optimization method and its foundation in swarm intelligence make it a great tool for efficiently solving optimization challenges.
The PSO algorithm calculates the optimal function value for each particle by determining its best position. The algorithm calculates new velocities for each particle based on its present velocity, optimal position, and the optimal position of its neighbors. It periodically alters the positions, velocities, and neighbors of particles to keep them within certain bounds. The algorithm proceeds until it reaches a designated endpoint [
41]. Optimization is the process of identifying the best values for specific system features to fulfill design goals with minimal expense.
PSO represents each solution as a “bird/particle” within a search space. The particles move collectively to find the best position. The particle holds both the position and velocity vectors in a problem set within an n-dimensional space. A connection exists between the particle’s position and its range of mobility, which is utilized to describe the movement patterns [
42]. Particle j’s position is designated as
Xj = (
Xj1,
Xj2…….
Xjn) and its velocity is represented as
Vj = (
Vj1,
Vj2, …
Vjn). Equations (4) and (5), below, update the velocity and position of the particles [
43].
where
Xpbestij = personal best of the particle;
Xgbest = global best position of the group;
Cg,Cp = social and cognitive acceleration of the coefficient;
N = total number of variables;
r = uniformly distributed random number;
Vijk + 1 = velocity of jth particle of ith variable at k + 1th iteration;
Xijk + 1 = value of the position of jth particle of ith variable at kth iteration.
To enhance the PSO convergence rate, it is recommended to incorporate the inertia weight into the velocity in the initial equation. The calculated velocity of the particle is adjusted by including the weight inertia, as shown below.
where
W represents the inertial weight [
44].
3. Related Work
Optimizing the performance of ML algorithms relies on a number of crucial steps, with hyperparameter tuning being one of them. Hyperparameters, apart from the model’s trained parameters, control the learning process and have a substantial influence on the model’s accuracy and generalization capability. Nature-inspired metaheuristic techniques are becoming more popular for this task, since they are good at exploring the large hyperparameter space and finding areas where the best configurations might be found. They also maintain a balance between exploration and exploitation to prevent premature convergence and find the best hyperparameter configurations globally [
37,
45].
Taking advantage of this, several researchers have deployed these techniques for the task in the context of phishing website prediction. Al-Sarem, et al. [
46], for instance, compared the performance of six tree-based algorithms in classifying phishing websites, where the hyperparameters were optimized with GAs against the default hyperparameters. After evaluating the performance on three publicly available phishing website datasets, they observed that the Random Forest classifier yields the highest accuracy of 97.02% and 95.15% in datasets 1 and 3, respectively, while the LGBM classifier obtained the best accuracy of 98.65% in dataset 2, when both algorithms were optimized with GAs. A study by Stobbs, et al. [
47] compared the performance of a Tree-structured Parzen Estimator (TPE), a Bayesian optimization-based algorithm, and a GA in tuning the hyperparameters of four traditional ML algorithms for classifying phishing websites. Using two datasets created by the authors, each with 28 features based on URL and website properties, they found that the Random Forest classifier performed the best, with an accuracy of 99.33%, when performing feature selection with PSO and hyperparameter tuning with TPE.
Almousa, et al. [
48] proposed and assessed the performance of three deep learning-based models for the detection of phishing websites. Each model was trained and evaluated on three publicly available datasets and one that was created by the researchers. In each case, three scenarios were also applied in relation to hyperparameter tuning: (1) evaluation of the models with the default hyperparameters, (2) hyperparameter tuning using grid search, and (3) hyperparameter tuning using GAs. The results showed that the accuracy rate of each model was improved by up to 1% when grid search and GA methods were used, with the former slightly outperforming the latter. Pavan Kumar, et al. [
49] applied a swarm intelligence-based BAT optimization algorithm to optimize a convolution neural network in predicting phishing websites. Using a single publicly available phishing dataset consisting of 30 URL and webpage-based features, the study used the algorithm to tune the CNN’s optimizer parameters, in which the best accuracy of 94.8% was obtained with Adam. Alqahtani, et al. [
50] developed a deep autoencoder-based classifier for predicting phishing websites. A benchmark dataset of phishing and legitimate URLs was used to train and evaluate the model. Invasive Weed Optimization (IWO), an algorithm inspired by the unique properties of weed growth, was used to tune the hyperparameters of the model, optimizing the model to an optimal accuracy of 99.28%. Despite the great efforts made by these studies, they lack comparative analysis of several nature-inspired metaheuristic techniques to establish experimental evidence of the efficacy of these techniques in optimizing the hyperparameters of ML models in regard to this problem.
4. Methodology
In this section, the methodology used to evaluate the performance of GAs, DE, and PSO in optimizing the hyperparameters of ML models for predicting phishing websites is presented. To establish consistency in the performance of the algorithms, six ensemble classifiers, namely Random Forest, Gradient Boosting, LGBM, XGBoost, CatBoost, and ExtraTrees, were selected and used as classifiers for the training and evaluation processes. These tree-based classifiers were selected for two reasons: (1) significant percentages of outliers were observed in our datasets. Instead of deleting the outliers, which would have substantially decreased the dataset sizes, we opted to use classifiers that are insensitive to outliers. (2) The classifiers performed well in a similar study [
51]. To produce a baseline level of performance for observing the impact of the metaheuristic techniques on the performances of the classifiers, we also train and evaluate the classifiers without hyperparameter optimization.
Figure 2 below summarizes the methodology, consisting of four steps: data retrieval and partitioning and data pre-processing; classifier training and hyperparameter optimization and classifier evaluation; statistical significance testing on the impact of the metaheuristic techniques; and performance ranking of the techniques. First, three benchmark datasets consisting of various types of features that distinguish phishing and legitimate websites were retrieved from their respective online repositories (see details in
Section 5.1), before partitioning each one of them into training and testing datasets. Each training dataset is then pre-processed for feature selection and transformation and fed into each of the classifiers for modelling. The hyperparameters of each resulting classifier are then tuned using each of the three metaheuristic techniques, except in one scenario where the default hyperparameters are maintained. Next, each optimized classifier is evaluated with the testing data from each dataset and its performance is reported using multiple metrics. To validate the effectiveness of the metaheuristic techniques, we measured the statistical significance of the differences in the performance of all the optimized classifiers on the three datasets against the classifiers with default hyperparameters. From the test results, the metaheuristic techniques are ranked based on the number of classifiers they have genuinely impacted.
5. Experiments and Results
A total of 72 experiments were set up to train the classifiers and evaluate the metaheuristic techniques, i.e., six classifiers were trained and optimized, using the three metaheuristic techniques and with the default hyperparameters, on each of the three datasets. In order to evaluate and compare the performance across all the experiments, the performance measures accuracy, precision, recall, and F1 score were used. These measures are commonly used in evaluating the performance of ML models [
52,
53,
54]. They are defined as follows:
The above measures are derived from the counts of true positives (TPs), false positives (FPs), true negatives (TNs), and false negatives (FNs). A positive instance of this problem is a phishing website.
Python version 3.11 was used to develop codes for all the experiments, along with libraries including sklearn, lightgbm, xgboost, catboost, sklearn_genetic (for implementing GAs), scipy.optimize (for implementing DE), and pyswarm (for implementing PSO). The experiments were run on a machine with Windows 11, 16 GB memory, and Intel’s i7 processor specifications.
5.1. Datasets
To train the classifiers and evaluate the metaheuristic techniques for predicting phishing websites, three publicly available datasets were used. The reason for using multiple datasets in this study is to assess the generalizability of the classifiers and the metaheuristic techniques, since different datasets may exhibit different characteristics, such as varying noise levels, class imbalances, or feature distributions, which significantly influence a model’s performance. This approach provides assurances that the performance of a model is not confined to the specific peculiarities of the dataset [
55]. Additionally, employing multiple datasets aligns the evaluation with real-world scenarios. In practical applications, ML models are deployed in environments where the data characteristics may vary over time or across different contexts. Thus, testing the models and the metaheuristic techniques on diverse datasets mirrors real-world scenarios more accurately and provides a more reliable assessment of their performance in practical applications [
56].
The three selected datasets are labelled as D1, D2, and D3 for datasets 1, 2, and 3, respectively. D1 has a total of 58,645 instances, of which 27,998 are labelled as legitimate webpages and 30,647 as phishing webpages. D2 has a total of 88,647 instances, of which 58,000 are labelled as legitimate webpages and 30,647 are phishing webpages. Both D1 and D2 consist of the same 111 features extracted from phishing and legitimate URLs. The features were extracted from the properties of a whole URL (20 features), the URL’s domain (21 features), the URL’s directory (18 features), the URL’s file name (18 features), the URL parameters (20 features), and from resolving URL and external services (16 features). Both datasets were created, published and documented by Vrbančič, et al. [
57] and made available on GitHub (
https://github.com/GregaVrbancic/Phishing-Dataset). D3 has 48 features extracted from 5000 phishing webpages and 5000 legitimate webpages, which were downloaded from January to May 2015 and from May to June 2017. The features were generated and extracted from the URL and webpage structures of each webpage. D3 is available on GitHub (
https://www.kaggle.com/datasets/shashwatwork/phishing-dataset-for-machine-learning/data).
Figure 3a–c summarizes the distribution of phishing and legitimate webpages in the datasets.
5.2. Data Pre-Processing
This step plays a significant role in transforming raw data into a complete, consistent, and accurate form, so that ML algorithms can efficiently learn the data to build robust prediction models [
58,
59]. First, a small number of negative values observed in all the datasets were replaced with null values. We then dropped the features with more than 50% of null values (20 features in D1, 56 in D2, and none in D3). Using a variance threshold of 0.05%, low variance features were dropped in all the datasets (50 features in D1, 29 in D2, and 14 in D3). A substantial percentage of outliers was detected in the datasets (5.9% in D1, 7.1% in D2, and 8.2% in D3). Instead of dropping the outliers, we opted to use ensemble classifiers to counter their effect. To balance the sample size of the datasets for each class label, we randomly selected
N instances for each class in each dataset (i.e.,
N = 25,000 in D1,
N = 30,000 in D2, and
N = 4500, resulting in 50,000 total instances in D1, 60,000 in D2, and 9000 in D3). To ensure consistency of scale across all the features, a standardization method was applied to transform all the feature values in each dataset to a mean of 0 and a standard deviation of 1. In order to reduce variations in the evaluation results to achieve stable scores when splitting the training and testing datasets, we applied a stratified 10-fold cross-validation technique to all the datasets when training and evaluating the classifiers.
5.3. Experimental Results and Discussions
This section reports and discusses the performance of each classifier, in terms of four metrics, for each applied hyperparameter optimization technique and those without optimization. For each result, as displayed in the table subsections below, the classifiers are ranked from best to worst performers by their accuracy scores. First, the hyperparameters for the optimization process were identified.
Table 1 below lists the selected hyperparameters of each classifier and the value range for the optimization process. For consistency of the optimization process across all the techniques, we only selected real-valued parameters, since DE algorithms operate only on solution vectors in continuous space. Also, the most effective parameters of each metaheuristic algorithm and their optimal values recommended by various studies, including Pedersen and Chipperfield [
60], Clerc and Kennedy [
61], Storn and Price [
36], Das and Suganthan [
62], and Al-Sarem, et al. [
46], were identified and adopted in this study. These are summarized in
Table 2 below.
5.3.1. Results of the Ensemble Classifiers with Default Hyperparameters
In the first set of experiments, all six classifiers were trained and evaluated on the D1, D2, and D3 datasets without applying any hyperparameter optimization techniques.
Table 3 presents the results in terms of the performance metrics of the classifiers when applied to datasets D1, D2, and D3.
Figure 4 presents a pictorial comparison of the accuracy scores of each classifier for the datasets. It can be observed that the performance of all the classifiers increased from D1 to D3, with optimal performance achieved with the latter. CatBoost sees the largest increase in accuracy (4.04%) from D1 to D3, whereas ExtraTrees sees the least increase (2.23%), in terms of the same metric. Increases are also observed in the other metrics for all the classifiers, with none showing a decrease in any of the metrics.
With default hyperparameters, XGBoost appears to be the best performer for all the datasets, with accuracy scores of 95.38% in D1, 96.12% in D2, and 97.33% in D3. It also achieved the highest scores in all the other metrics, except the recall score in D2, whereby it was only slightly outperformed by CatBoost, by 0.03%. On the other hand, Gradient Boosting is the worst performer in terms of datasets D1 and D2, with accuracy scores of 92.82% and 94.35%, respectively. In D3, it is the second worst performer, slightly outperforming ExtraTrees, the worst performer by a margin of 0.05%. Gradient Boosting also attained the lowest scores in D1 and D2 across all the other metrics, except the recall in D2, whereas ExtraTrees scores for the other metrics were the lowest in D3. XGBoost, LGBM, and Gradient Boosting maintained their rank positions for datasets D1 and D2, while the other classifiers slightly changed their positions. In D3, however, LGBM and ExtraTrees significantly changed their positions with a performance improvement observed in the former and performance degradation observed in the latter. These major differences between the datasets are likely due to the feature composition difference between D3 and both D1 and D2.
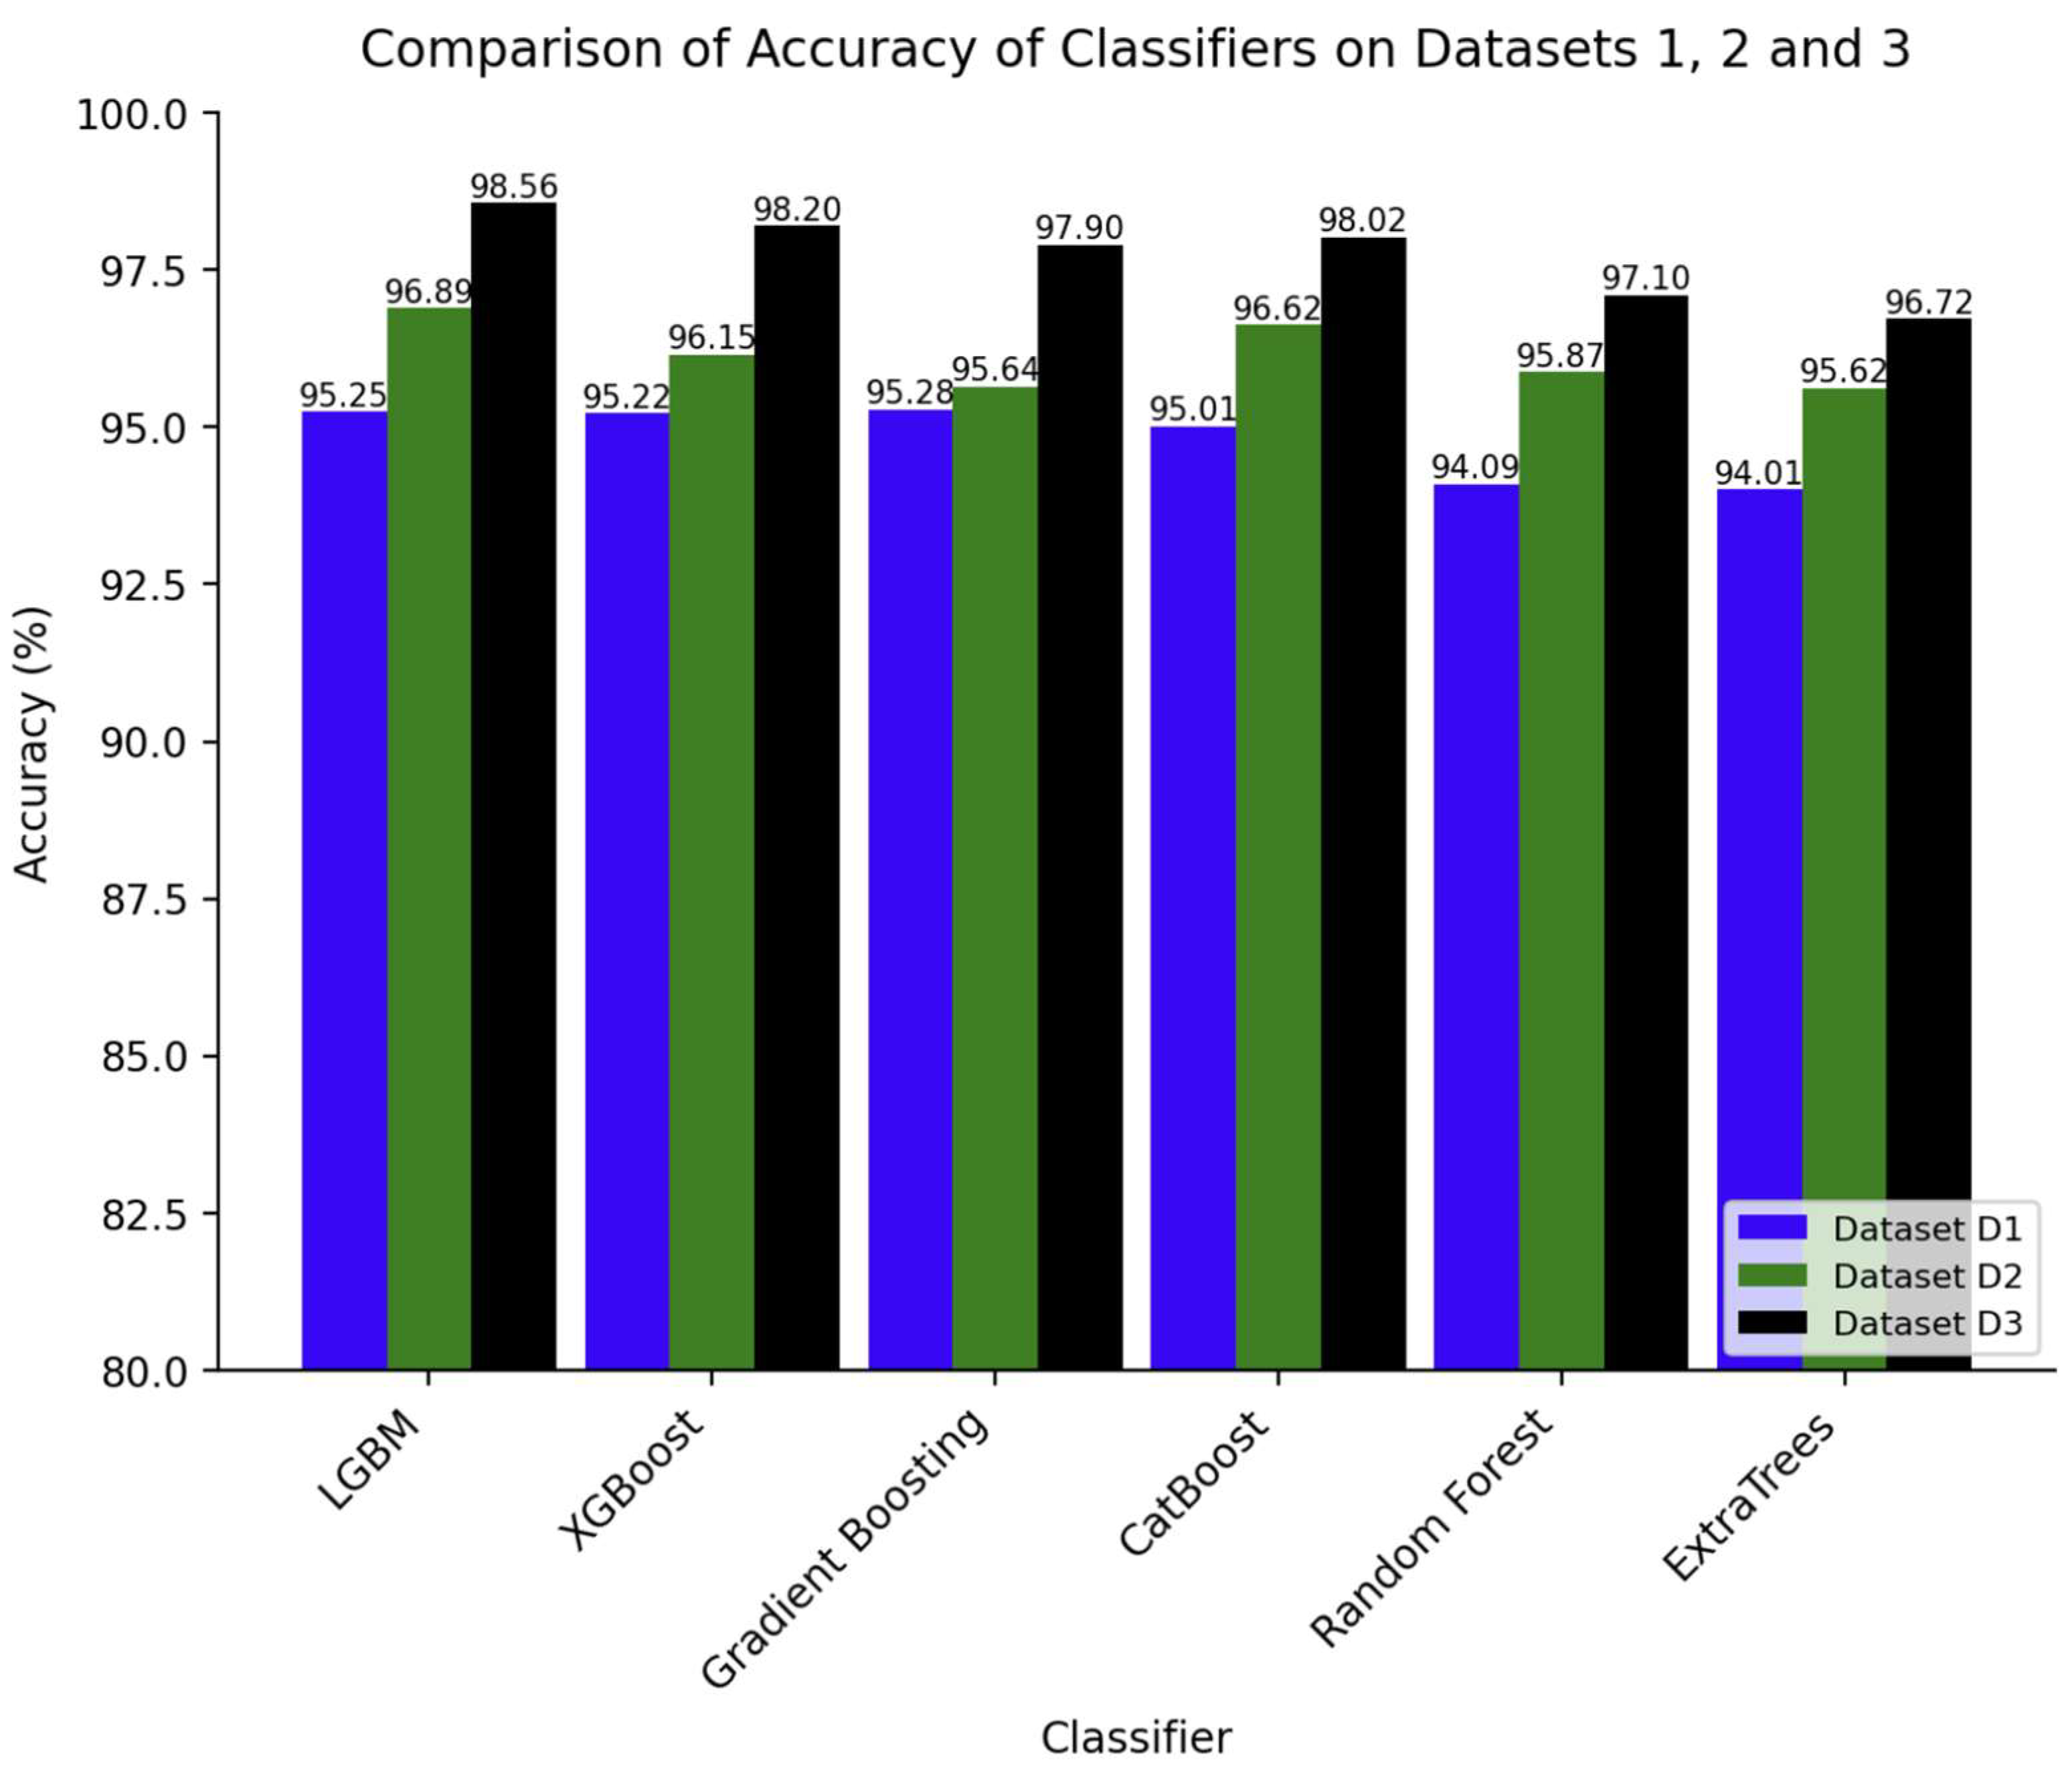
5.3.2. Results of the Ensemble Classifiers with PSO Optimization
In the second set of experiments, each classifier was trained and evaluated with PSO as the hyperparameter optimization technique.
Table 4 presents their performance on the three datasets, while
Figure 5 provides a visualized comparison of the accuracy scores for each classifier on the datasets. Similar to the first set of results, all the classifiers experienced significant gains in their performance across all metrics on D2 and D3 datasets, with all the classifiers attaining the worst and the best performance in D1 and D3, respectively. LGBM was found to be the best classifier in terms of D2 and D3, obtaining the highest accuracy scores of 96.89% and 98.56%, respectively. It also achieved the second-best accuracy of 95.25% in D1, behind Gradient Boosting by a margin of 0.03%. Random Forest and ExtraTrees were found to be the worst performers overall, both achieving the lowest accuracy scores in D1 and D3. XGBoost and CatBoost maintained their second top-tier position in D2 and D3, while they were in the mid-tier position for D1. LGBM attained the largest accuracy gain of 3.31% between D1 and D3, whereas Gradient Boosting obtained the lowest gain of 2.62%. Interestingly, the top three classifiers in all the datasets have a small margin of scores across all the metrics, which is different from the previous results.
5.3.3. Results of the Ensemble Classifiers with DE Optimization
Table 5 shows the results for the third set of experiments with the classifiers’ hyperparameters optimized using DE. Again, there is a significant increase in the scores in regard to all the metrics for each classifier from D1 to D3.
Figure 6 visualizes the accuracy score for each classifier across the datasets. LGBM, Gradient Boosting, and XGBoost achieved the best performance across all the datasets. LGBM was found to attain the highest accuracy score of 96.85% and 98.99% in D1 and D3, respectively, but only achieved the third position in D2, with an accuracy of 96.97%. Again, Random Forest and ExtraTrees were found to yield the worst performance across all the datasets. In terms of accuracy gains between D1 and D3, CatBoost had the largest margin of 3.29%, while LGBM had the lowest margin of 2.14%.
5.3.4. Results of the Ensemble Classifiers with GA Optimization
In regard to GA optimization, LGBM, Gradient Boosting, and XGBoost are again the best performers in all the datasets, attaining the best accuracy scores of 97.97% (in D1), 98.69% (in D2), and 99.47% (in D3), respectively. Gradient Boosting is observed to make the largest gain in accuracy of 2.16%, while LGBM had the smallest gain of 1.27%. The GA, Random Forest, and ExtraTrees yielded the worst performance for all three datasets. Similar to the previous sets of results, all the classifiers experienced significant gains in their performance across all metrics on D2 and D3 datasets. The results are summarized below in
Table 6 and
Figure 7.
5.3.5. Results Analysis and Discussion
In each set of experiments, we observed a persistent rise in the performance of the classifiers across all metrics from D1 to D3. This was an expected trend for datasets D1 and D2, given the substantial difference in dataset sizes between the two datasets with the same features. This concurs with the general observation made by various studies, including the studies by Halevy, et al. [
63] and Domingos [
64] in which they empirically concluded that the performance of ML algorithms generally improves with larger dataset sizes due to the increased diversity and coverage of the data, which enable better generalization and learning of complex patterns. However, the performance in D3 is better than in D1 and D2, although D3 is the smallest dataset in terms of size, by far. This suggests that the selected best features in D3 are far better predictors than those in D1 and D2. Another key observation is the consistency of the performance of the classifiers across the datasets, with LGBM, Gradient Boosting, and XGBoost being the best performers overall. The first two were the top performers in eight sets of experiments, while the latter was the top performer in four sets. Strangely, the first two appeared to be the worst performers in two of the three sets of experiments with default hyperparameters. On the other hand, ExtraTrees and Random Forest were found to be the weakest performers, as they ranked in the lowest positions for the nine sets of experiments.
Regarding the performance comparison between the metaheuristic techniques, all the techniques appear to improve the scores of each classifier for most metrics in all datasets compared to the use of default hyperparameters.
Figure 8a–c visualizes the improvements in accuracy in both datasets. There are a few exceptions, however. For instance, the accuracy scores of XGBoost, Random Forest, and ExtraTrees with PSO in D1 were found to be slightly lower than without optimization, with margins of 0.16%, 0.24%, and 0.34%, respectively. The same technique also reduced the precision scores of XGBoost and LGBM by 0.33% and 0.48%, respectively, and the recall score of the former, by 0.28%. PSO also lowered the f1 score of XGBoost by 0.3% and that of LGBM by 0.02%. In D2, PSO decreased the precision score of XGBoost, ExtraTrees, Random Forest, and LGBM by 0.16%, 0.23%, 0.97%, and 0.59%, respectively. Meanwhile, the recall score of XGBoost and CatBoost were decreased by 0.3% and 0.1%, respectively. Except for Gradient Boosting, the f1 scores of all the classifiers were reduced by slight margins, the largest being 0.62%. Apart from PSO, only DE decreased the performance of some of the classifiers. Specifically, it lowered the f1 score on D2 of ExtraTrees and Random Forest by 0.1% and 0.2%, respectively. Generally, the GA was found to yield the highest scores in all the metrics, outperforming the other metaheuristic techniques. DE is in the second position, with PSO taking the last position.
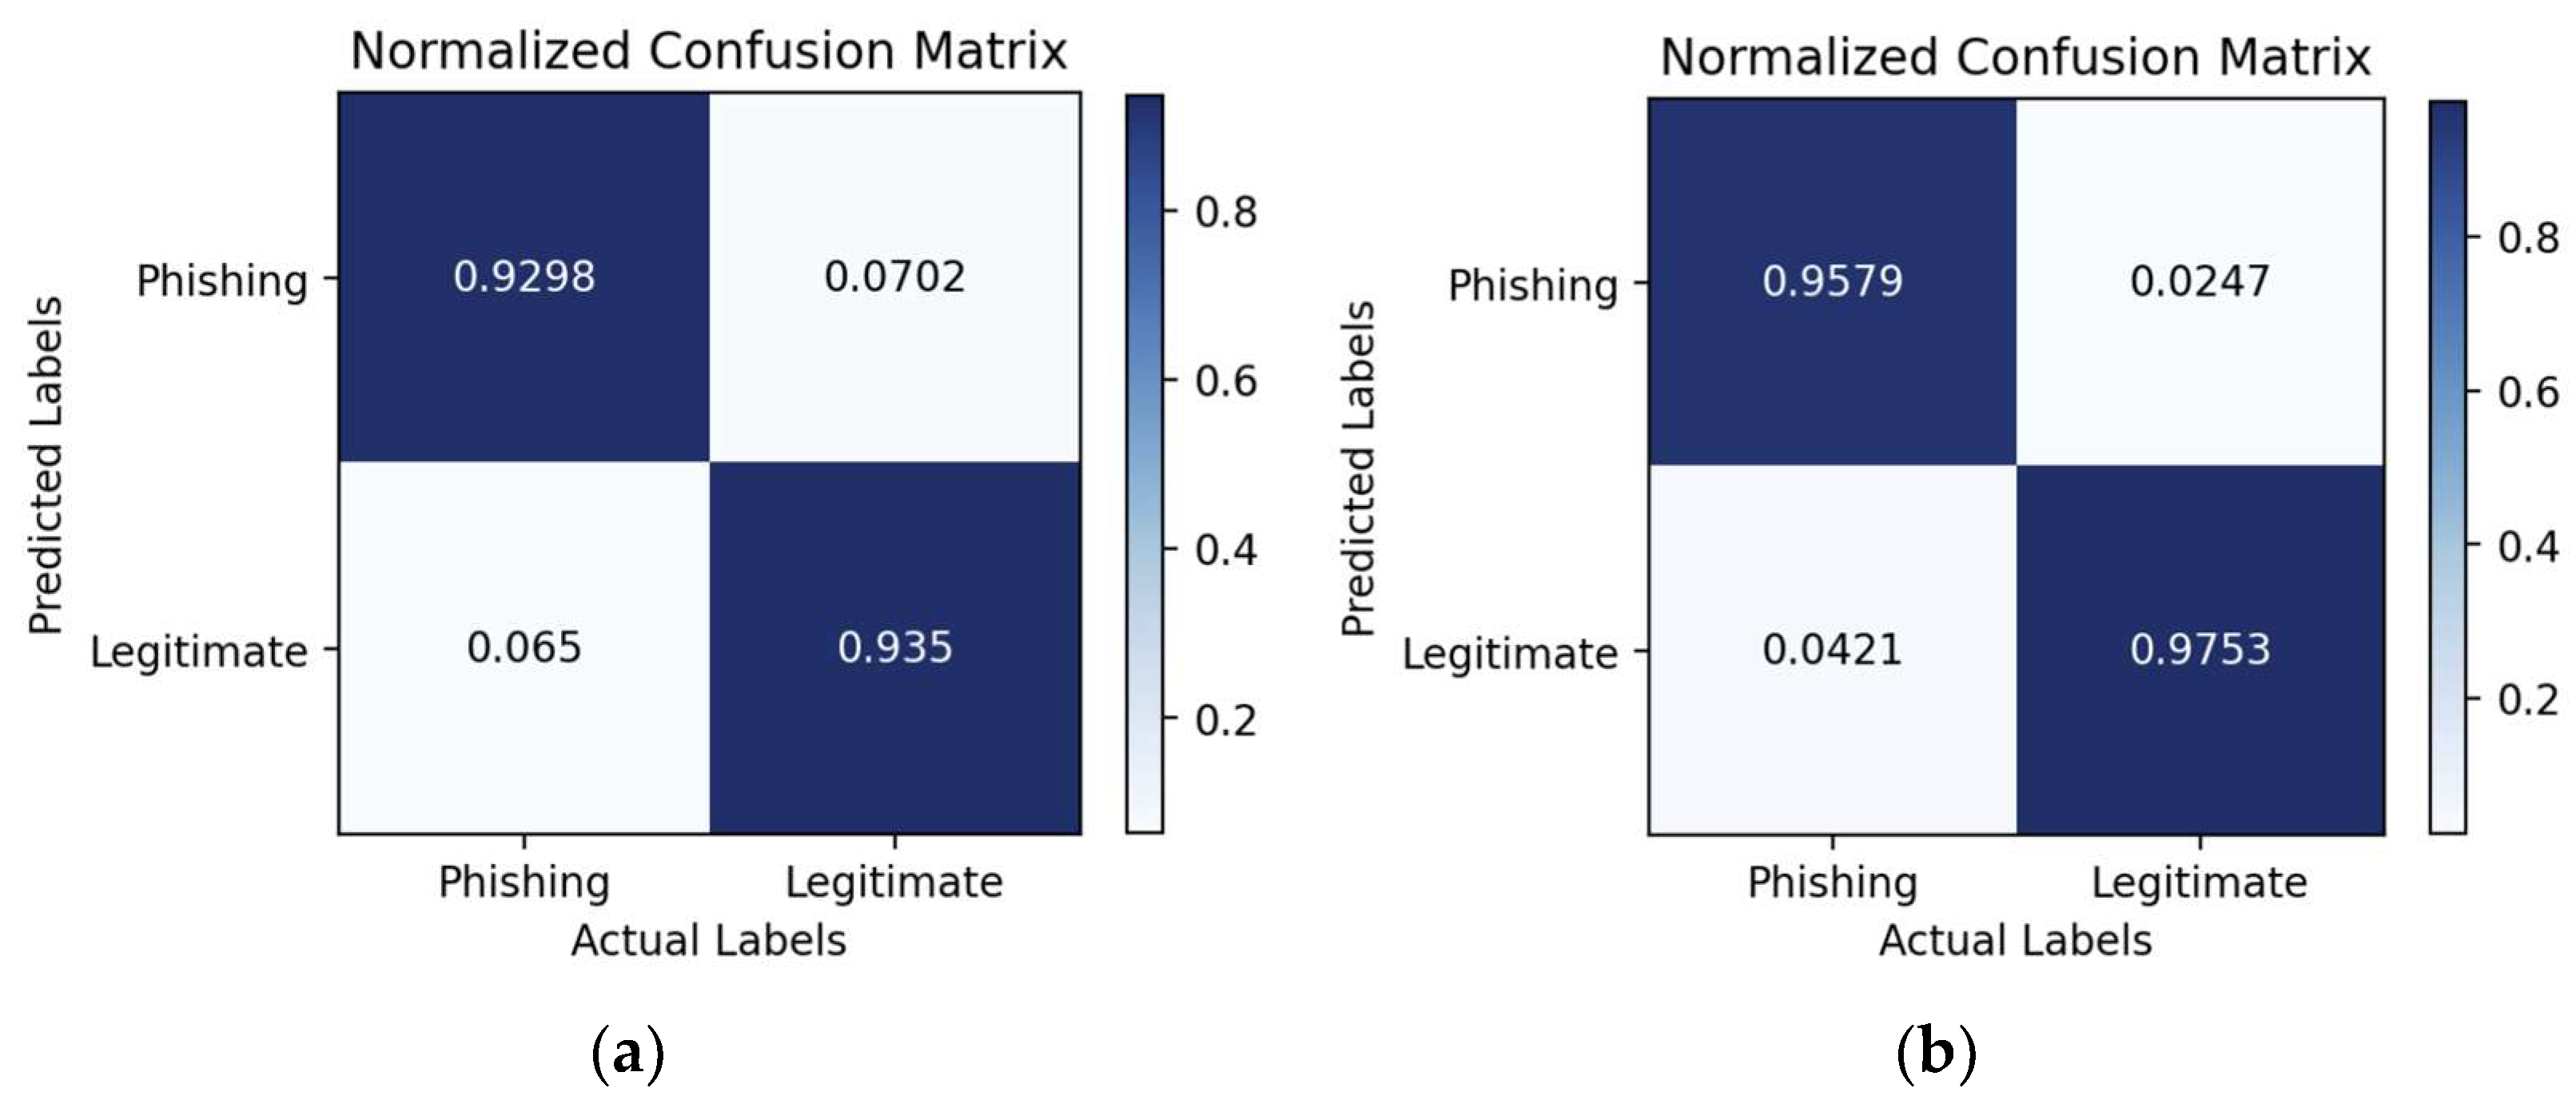
Figure 9,
Figure 10,
Figure 11,
Figure 12,
Figure 13 and
Figure 14 show the confusion matrices of the classifiers when using default hyperparameters and when optimized using GAs on dataset D1. The accuracy scores of all the classifiers in predicting legitimate and phishing websites were improved when using GA optimization, as their overall accuracy scores are reflected in
Figure 8a. Generally, all the classifiers predicted the legitimate websites more accurately than the phishing ones. The highest increase in the accuracy score for predicting legitimate websites was obtained by Gradient Boosting, with a jump of 4.32%. For the prediction of phishing websites, the highest increase of 5.33% was obtained by LGBM. The highest accuracy for predicting a legitimate website with default hyperparameters was obtained by XGBoost with a score of 95.91%, whereas with GA optimization, the same classifier achieved the highest score at 98.67%. XGBoost also achieved the highest accuracy score of 94.85% for predicting phishing websites with default hyperparameters, while LGBM achieved the highest accuracy of 97.39%.
5.3.6. Statistical Significance Tests
Statistically testing the significance of the differences between groups of values is a crucial step in the analysis of experimental data, as it helps to determine whether the observed differences are likely due to chance or if there is a genuine difference between the groups due to the effect of the applied process, in this case, the hyperparameter optimization. As a result, the quantified evidence allows researchers to draw reliable conclusions with no false positives and, thus, be able to confidently identify the process that should be adopted [
65].
Here, we aim to provide statistical evidence of whether each metaheuristic technique has improved the performance (accuracy scores to be used for this analysis) of each classifier over the use of default hyperparameters. To achieve the objective, we applied a paired
t-test [
66] to test our null and alternative hypotheses (
Ho and
Ha, respectively) for each classifier using a significance level (α) of 0.05. The hypotheses are defined as follows:
Table 7, below, shows the results of the paired
t-test in terms of the t-statistic and p-values of each metaheuristic technique in all three datasets over those produced by the default hyperparameters. The results show that the null hypothesis can be rejected in all cases for the GA, four cases in DE, and only one case for PSO (shown with bold text), since their
p-values are lower than the significance level. This confirms that the GA has a genuine impact on the accuracy of all the classifiers, whereas DE has an impact on Random Forest, CatBoost, LGBM, and Gradient Boosting, with no effect on the rest of the classifiers. PSO, however, only impacted the accuracy of LGBM. This implies that only LGBM was impacted by all three techniques, while Random Forest, CatBoost, and Gradient Boosting were only impacted by DE and GA. XGBoost and ExtraTrees, on the other hand, were only impacted by PSO.
In terms of the extent of the impact of the techniques, we observe that the GA has impacted Random Forest, ExtraTrees, and XGBoost the most given that the lowest p-values are achieved (below 0.01). The latter two were also the most impacted compared to others, across all the techniques. Random Forest is the largest beneficiary of DE optimization, by achieving the lowest p-value compared to others. CatBoost and LGBM appear to be the least impacted by both the GA and DE techniques, by attaining the largest p-values.
This test, therefore, concludes that out of the three techniques, the GA is more effective in optimizing the hyperparameters of both bagging and boosting tree-based classifiers, followed by DE and, then, PSO. This supports our observations based on the results presented in
Section 5.3.5.
6. Conclusions
This paper has investigated and compared the effectiveness of nature-inspired metaheuristic techniques for optimizing the hyperparameters of ML models for predicting phishing websites. Three popular nature-inspired metaheuristic techniques, the GA, DE, and PSO, were selected for tuning the hyperparameters of six ensemble classifiers, namely Random Forest, Gradient Boosting, LGBM, XGBoost, CatBoost, and ExtraTrees. Three publicly available datasets, consisting of predictive features extracted from phishing and legitimate websites, were used for the evaluation. The methodology adopted was to train each classifier on each dataset and then tune each of the resulting classifiers using each optimization technique. To establish a baseline for assessing the impact of the techniques on the performance of the classifiers, each classifier was also trained and evaluated with default hyperparameters. Statistical testing of the accuracy scores of all the classifiers optimized with the three techniques on the three datasets was conducted to validate the genuine impact of the techniques over the use of default hyperparameters. The results have shown that the GA was the most effective technique, by significantly improving the accuracy of all the classifiers. It also improved XGBoost and ExtraTrees the most, by achieving the lowest p-values of 0.0019 and 0.0039. DE was the second most effective technique, significantly improving the accuracy of four out of the six classifiers, with Random Forrest being the top beneficiary. It was found that PSO impacted only one classifier, which was LGBM. Overall, GA-optimized Gradient Boosting, LGBM, and XGBoost were found to be the best performers across all the metrics in predicting phishing websites.
It is important to note that these results were obtained using recommended values for the parameters of each metaheuristic technique established by studies in different contexts. It is unknown how the use of different values might have impacted the performance of the techniques in this context and, thus, their ranking. As part of our future work, we aim to evaluate the impact of various values of these parameters on the performance of the techniques using the same datasets. We also intend to extend our study to involve other EAs, swarm intelligence, and physical-inspired metaheuristic techniques, in regard to this problem. Based on our experience, the optimization runtime differs significantly among these techniques. We plan to explore this aspect, along with the performance issue. Despite the success of metaheuristic techniques in optimizing the hyperparameters for ML models in various domains, other traditional hyperparameter optimization techniques including grid search, random search, Bayesian optimization, and hyperband have also yielded good results in many fields. It is vital for future research to incorporate them in similar comparative studies for a comprehensive evaluation of their performance against these modern techniques, in order to establish the most robust and efficient techniques in terms of this problem.


