Article

Exploring Infant Physical Activity Using a Population-Based Network Analysis Approach

by
Rama Krishna Thelagathoti
1,*,
Priyanka Chaudhary
2,*,
Brian Knarr
2,
Michaela Schenkelberg
2,
Hesham H. Ali
1,* and
Danae Dinkel
2,*
1
College of Information Science & Technology, University of Nebraska Omaha, Omaha, NE 68182, USA
2
College of Education, Health and Human Sciences, University of Nebraska Omaha, Omaha, NE 68182, USA
*
Authors to whom correspondence should be addressed.
Analytics 2024, 3(1), 14-29; https://doi.org/10.3390/analytics3010002
Submission received: 7 September 2023 / Revised: 15 December 2023 / Accepted: 25 December 2023 / Published: 31 December 2023
(This article belongs to the Special Issue Feature Papers in Analytics)

Abstract

:
Background: Physical activity (PA) is an important aspect of infant development and has been shown to have long-term effects on health and well-being. Accurate analysis of infant PA is crucial for understanding their physical development, monitoring health and wellness, as well as identifying areas for improvement. However, individual analysis of infant PA can be challenging and often leads to biased results due to an infant’s inability to self-report and constantly changing posture and movement. This manuscript explores a population-based network analysis approach to study infants’ PA. The network analysis approach allows us to draw conclusions that are generalizable to the entire population and to identify trends and patterns in PA levels. Methods: This study aims to analyze the PA of infants aged 6–15 months using accelerometer data. A total of 20 infants from different types of childcare settings were recruited, including home-based and center-based care. Each infant wore an accelerometer for four days (2 weekdays, 2 weekend days). Data were analyzed using a network analysis approach, exploring the relationship between PA and various demographic and social factors. Results: The results showed that infants in center-based care have significantly higher levels of PA than those in home-based care. Moreover, the ankle acceleration was much higher than the waist acceleration, and activity patterns differed on weekdays and weekends. Conclusions: This study highlights the need for further research to explore the factors contributing to disparities in PA levels among infants in different childcare settings. Additionally, there is a need to develop effective strategies to promote PA among infants, considering the findings from the network analysis approach. Such efforts can contribute to enhancing infant health and well-being through targeted interventions aimed at increasing PA levels.

1. Introduction

Physical activity (PA) is known to play an important role in the promotion of healthy development throughout childhood [1,2,3]. PA is associated with a variety of benefits in early childhood, including motor skills and cognitive development [2,3]. Historically, society has thought infants are “active enough” and not in need of efforts to promote PA [4,5]. However, initial evidence suggests that there may be a relationship between movement in infancy and weight [6,7]. For example, one study of 9-month-old infants found an inverse relationship between the amount of time infants spent in unrestricted playtime and waist circumference [8]. Data were collected via questionnaire, and more objective data is needed to further explore factors related to infant movement.
Due to the growing emphasis on the importance of movement behaviors in the early years, in 2019, the World Health Organization developed guidelines for promoting healthy daytime infant movement, including providing 30 min of PA and no more than 1 h in a restraint device (e.g., strollers, highchairs) [9]. Despite these guidelines, research on whether infants are achieving them as well as how their movements may vary based on demographic and other factors (e.g., type of childcare) is limited [10,11]. This is due in large part to the lack of a valid and reliable methodology for assessing infant movement.
Unfortunately, tools and methodology to assess infant PA are limited due to the amount of adult handling (i.e., picked up, carried) and primary reliance on parent self-report [4,5,12,13,14,15]. While accelerometry methodology for the objective assessment of PA in older children is well established, additional research on their use with infants is needed [14,16]. Some existing infant accelerometer methodology has involved using a concurrent activity diary, in which parents report the dominant activity a child participates in during specific increments throughout the day (e.g., every 30 min) to discriminate independent activity time once the accelerometer is returned to the researchers [1,17,18]. A significant limitation of this protocol is that parent-reported periods of independent movement are subject to recall bias, threatening the information’s accuracy [16,19]. Furthermore, existing clinical procedures assess PA levels by observing a short snapshot of physical movements within the same day. The downside of this approach is that a conclusion about the appropriateness of an infant’s movement is drawn using only a single-time instance when a trained observer or clinician is present instead of a more comprehensive observation including an infant’s typical routine. Thus, there is a need to identify a novel method for collecting valid and reliable PA data that can offer a comprehensive understanding of infant activities, eliminating the above-referenced bias in infant PA assessment.
In this study, we have proposed a population-based network analysis approach that leverages mobility data collected from accelerometers worn by infants. Network analysis is a powerful tool for understanding the relationships between different elements in biological systems [2,19,20,21,22]. By representing biological data as a network, it is possible to identify patterns, trends, and relationships that are not easily apparent from the raw data and independent analysis. Our paper presents three significant contributions:
  • The creation of a correlation network graph that effectively detects subgroups that are similar with respect to their PA patterns.
  • An analysis of the PA patterns of each infant, both individually and in comparison to other infants in the group, by incorporating different time intervals, including hour, day, and weekday–weekend.
  • The completion of an enrichment analysis to understand the social and family dynamics of the identified subgroups, such as demographic parameters.
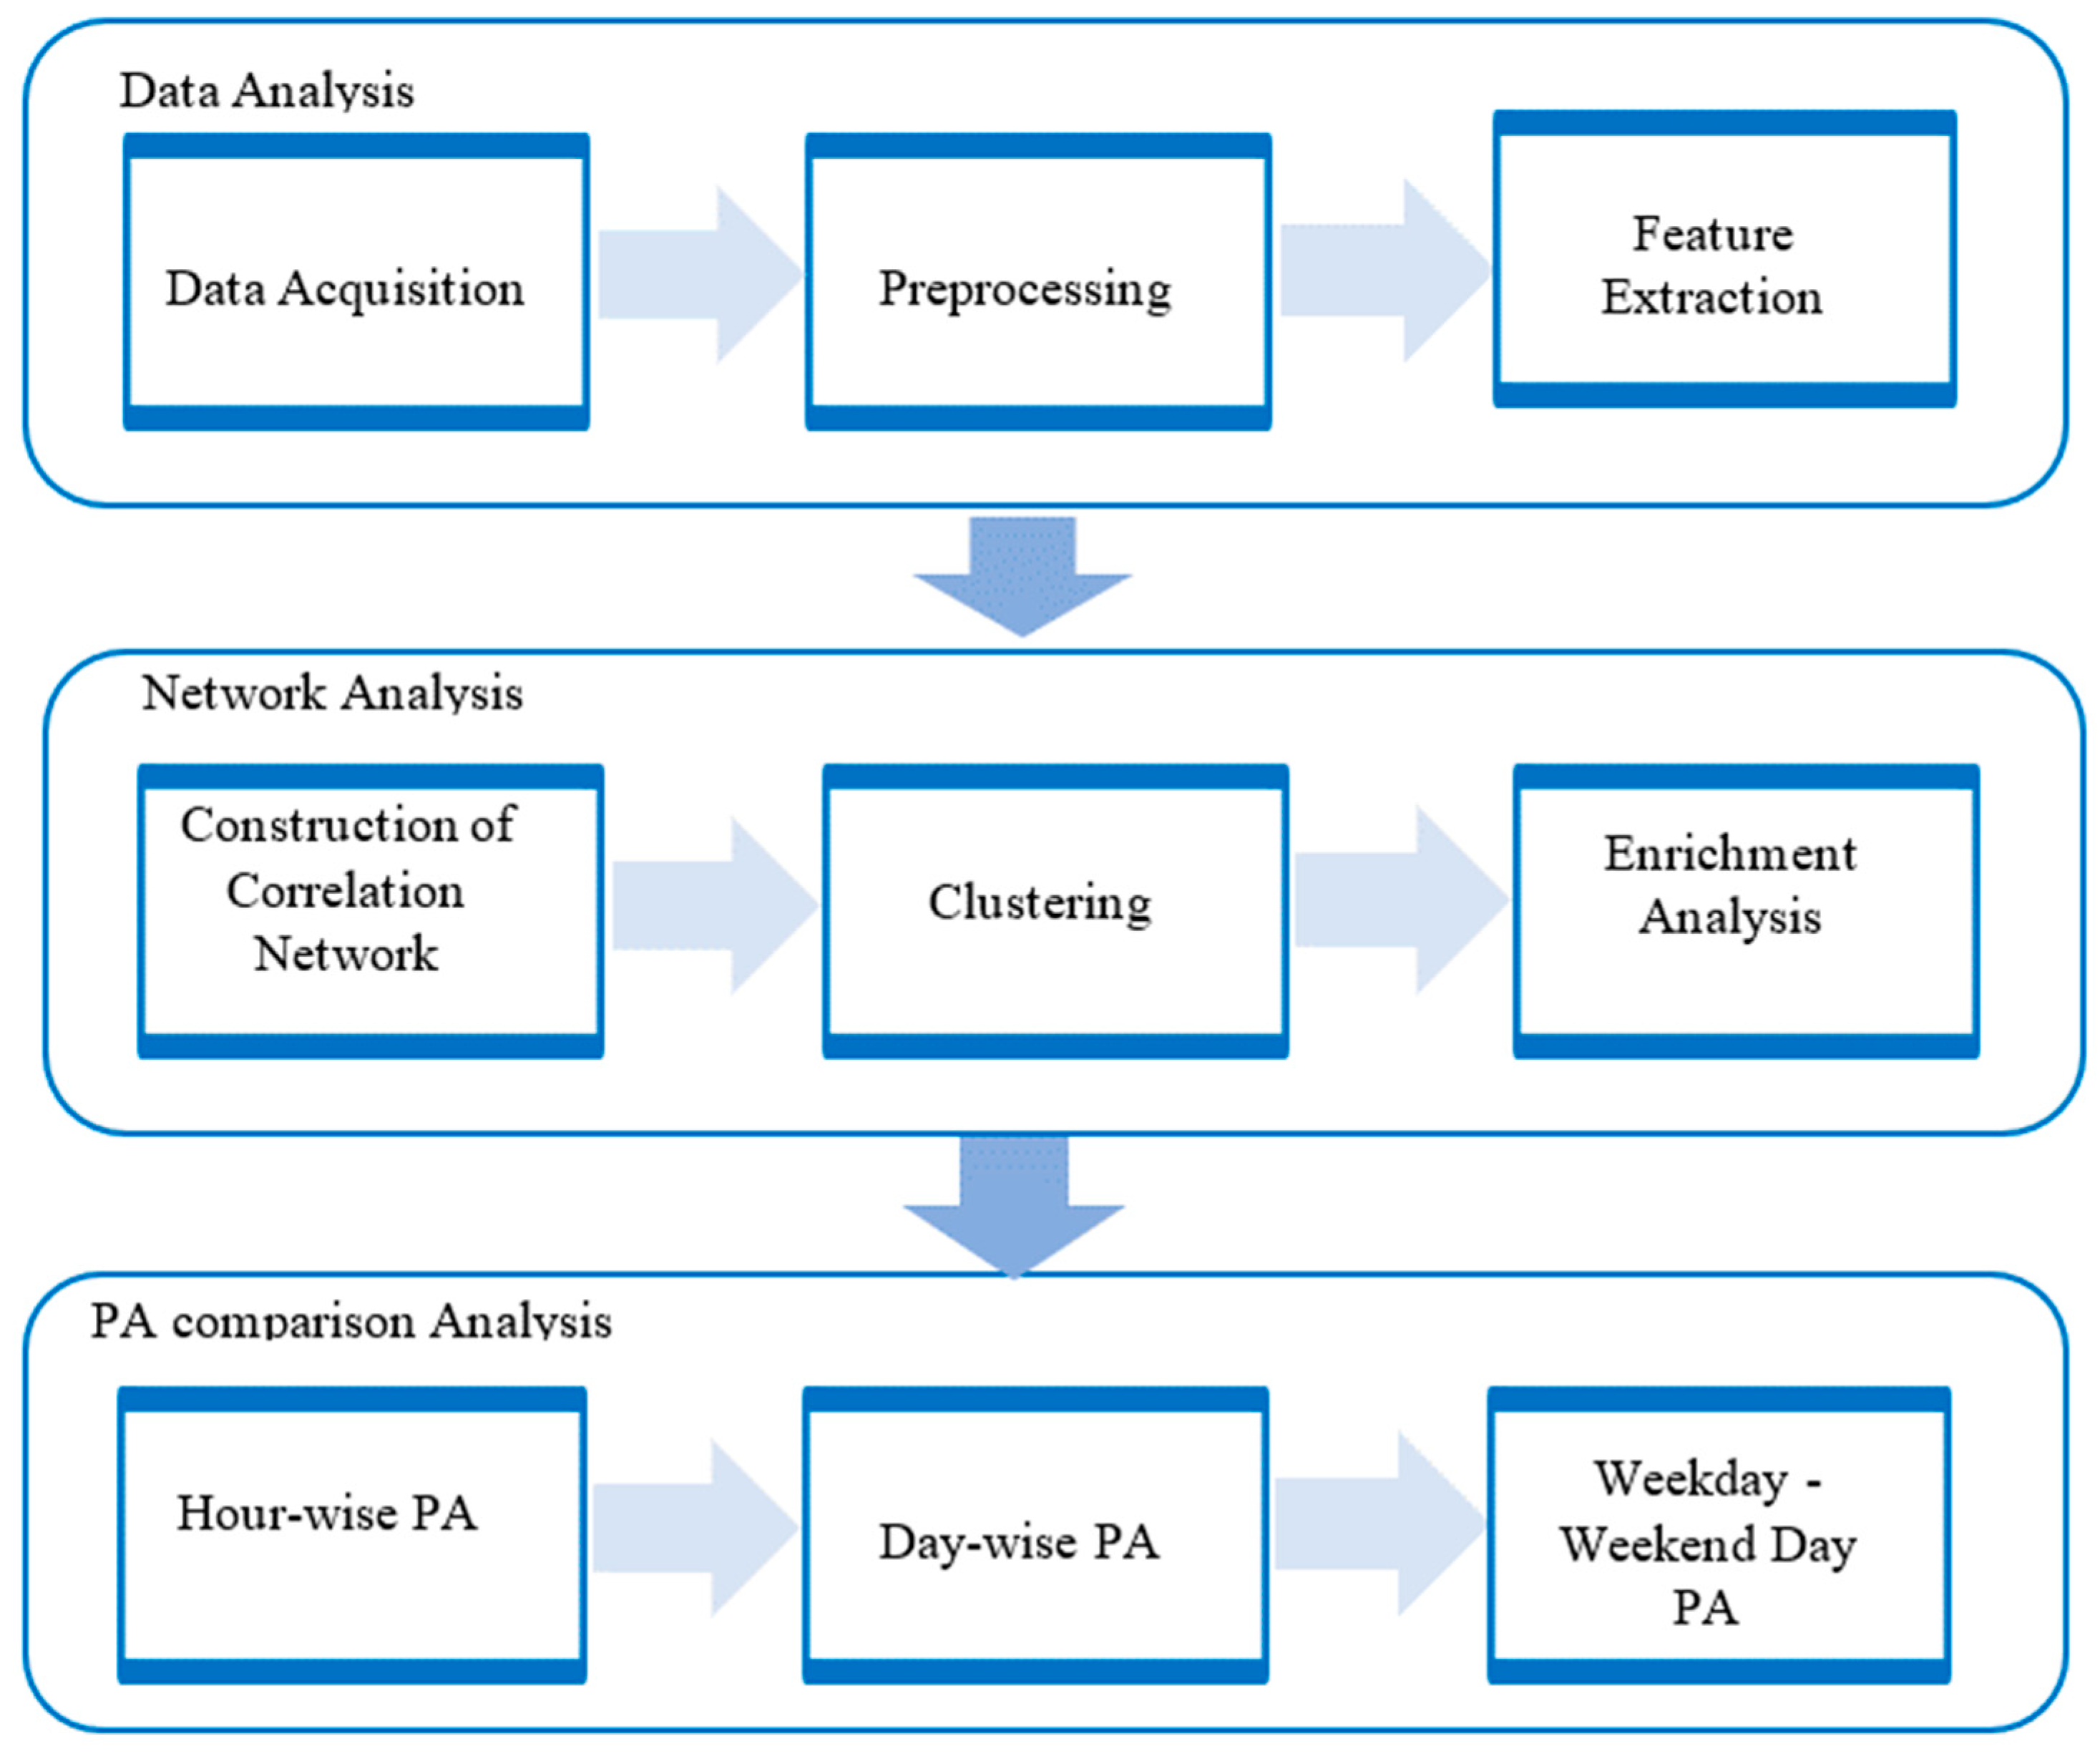
The rest of the manuscript is organized as follows. A detailed methodology is described in Section 2, while Section 3 presents the obtained results. Section 4 presents a discussion of the results. The limitations are explained in Section 5.

2. Methods

The methodology of this study is depicted in Figure 1. It consists of three phases: Data analysis, network analysis, and PA analysis. The initial phase involved the collection of PA data from the infant subjects using wearable ActiGraph GT9X (ActiGraph, Inc., Pensacola, FL, USA) Link accelerometers. The data was then standardized, and outliers were removed to facilitate the extraction of relevant features. In the second phase, a correlation network graph was created by incorporating all of the subjects as nodes (vertices) and their relationships as edges. The correlation between each pair of nodes was determined using the Pearson correlation coefficient [23]. This network was then used to identify clusters that exhibited strong correlations. In addition, the demographic information of the participants was compared across all clusters to determine the overrepresentation of demographic parameters. In the final phase, infant PA levels were analyzed utilizing different time intervals, including hour-wise, day-wise, and weekday–weekend.

2.1. Data Acquisition and Preprocessing

The purpose of this study was to develop a population-based network analysis method to assess infant PA patterns using accelerometer data collected from infants. Study approval was obtained by the University of Nebraska Medical Center Institutional Review Board (IRB# 0631-19EP). Data were collected between May 2021 and June 2022. A sample of 20 healthy infants (6–15 months) and their primary caregivers (e.g., parents) were recruited for the study. To be eligible for the study, infants had to be between 6 and 15 months of age, have no identified developmental abnormalities, be in at least >5th percentile for weight, and have a parent/guardian sign the parental consent form. Further, the caregiver was eligible if they were older than 19 years of age and had an infant 6–15 months of age. Recruitment was accomplished by distributing flyers through social media and email, as well as referrals from previous research participants. Participants who responded to social media posts or e-mails completed a brief screening survey through Qualtrics and were contacted by research personnel via their preferred contact method if eligible (phone call, text, or e-mail) [24]. The referrals were contacted via email or phone call.
The data from the tri-axial accelerometer were collected with a sampling frequency of 100 Hz using a GT9X ActiGraph Link accelerometer [25]. Infants wore 2 accelerometers, one on the right side of the waist and the other on their right ankle. An adjustable elastic belt was used to secure the accelerometer around the waist and an elastic band with the accelerometer placed inside was used for the ankle. The data were recorded in a free-living environment where infants and caregivers were instructed to perform their typical routines for 4 days, including two weekdays and two weekend days. Each sensor produced a raw signal that was stored in the instrument’s internal memory. Also, the accelerometer data generated the intensity of the PA in the X, Y, and Z axes, as well as the vector magnitude. The vector magnitude (VM) was computed automatically by the sensor using the following formula:
V M = X 2 + Y 2 + Z 2
Due to the non-availability of data and the lack of sufficient details, five subjects were removed from the investigation. Therefore, further analysis was carried out with only 15 subjects. For the comfort of subject identification, each subject was assigned a unique ID, K1 through K15. All infant anthropometry measurements were assessed via standardized procedures, including weight, length, head circumference, and waist circumference (4However, as the length parameter is unavailable for multiple infants, it has consequently been excluded from subsequent analyses. In addition, parents’ demographic information was obtained through a demographic survey, which included questions for race/ethnicity, childcare status, primary caregiver’s (mother) employment status, and household income. A summary of demographic information is presented in Table 1.
The data underwent normalization between 0 and 1 using the z-score standardization technique using the following equation:
Z i = ( X i X ¯ ) S
where Xi represents the actual data point from the raw sensor data, X ¯ is the total mean activity, and S is the standard deviation of the total activity. To address outliers, the interquartile range (IQR) property was applied. An outlier is identified if it falls below the first quartile or above the third quartile. Instead of removal, outliers were replaced with either the first or third quartile, depending on their position relative to these quartiles. This process resulted in a normalized dataset that is free from outliers.

2.2. Feature Extraction

The study recorded raw sensor data for a duration of 4 days, including 2 weekdays and 2 weekend days, from 7:00 a.m. to 6:59 p.m. In order to gain a complete understanding of the PA characteristics, PA data were analyzed by considering three different time intervals: Hourly activity to assess short-term patterns, day-wise activity to understand overall daily activity levels, and weekday–weekend days to study differences in activity patterns between the two. Therefore, three types of features were extracted: Hour-wise, day-wise, and weekday–weekend day. These features were derived by segmenting the PA data by an hour, a day, and a combination of weekdays–weekend days, respectively. Moreover, each feature set included ankle and waist data separately. The list of three feature sets is summarized in Table 2. The primary objective of extracting three feature sets from accelerometer data was to analyze the mobility patterns of infants and study their movement behavior relative to their PA levels across multiple time frequencies rather than just observing at a single time scale of time. Hour-wise segmentation of PA data revealed the movement patterns of infants every hour and provided a within-day understanding of their movement. Similarly, day-wise feature sets provided daily motor patterns of infants over four days, allowing for investigation of hour-wise biases in day-wise modeling and vice versa. While every infant may have a unique PA style, those attending childcare and those staying at home under parental care may have different mobility patterns. Hence, the proposed weekday–weekend day features aided in distinguishing the mobility patterns of infants across weekdays and weekend days.

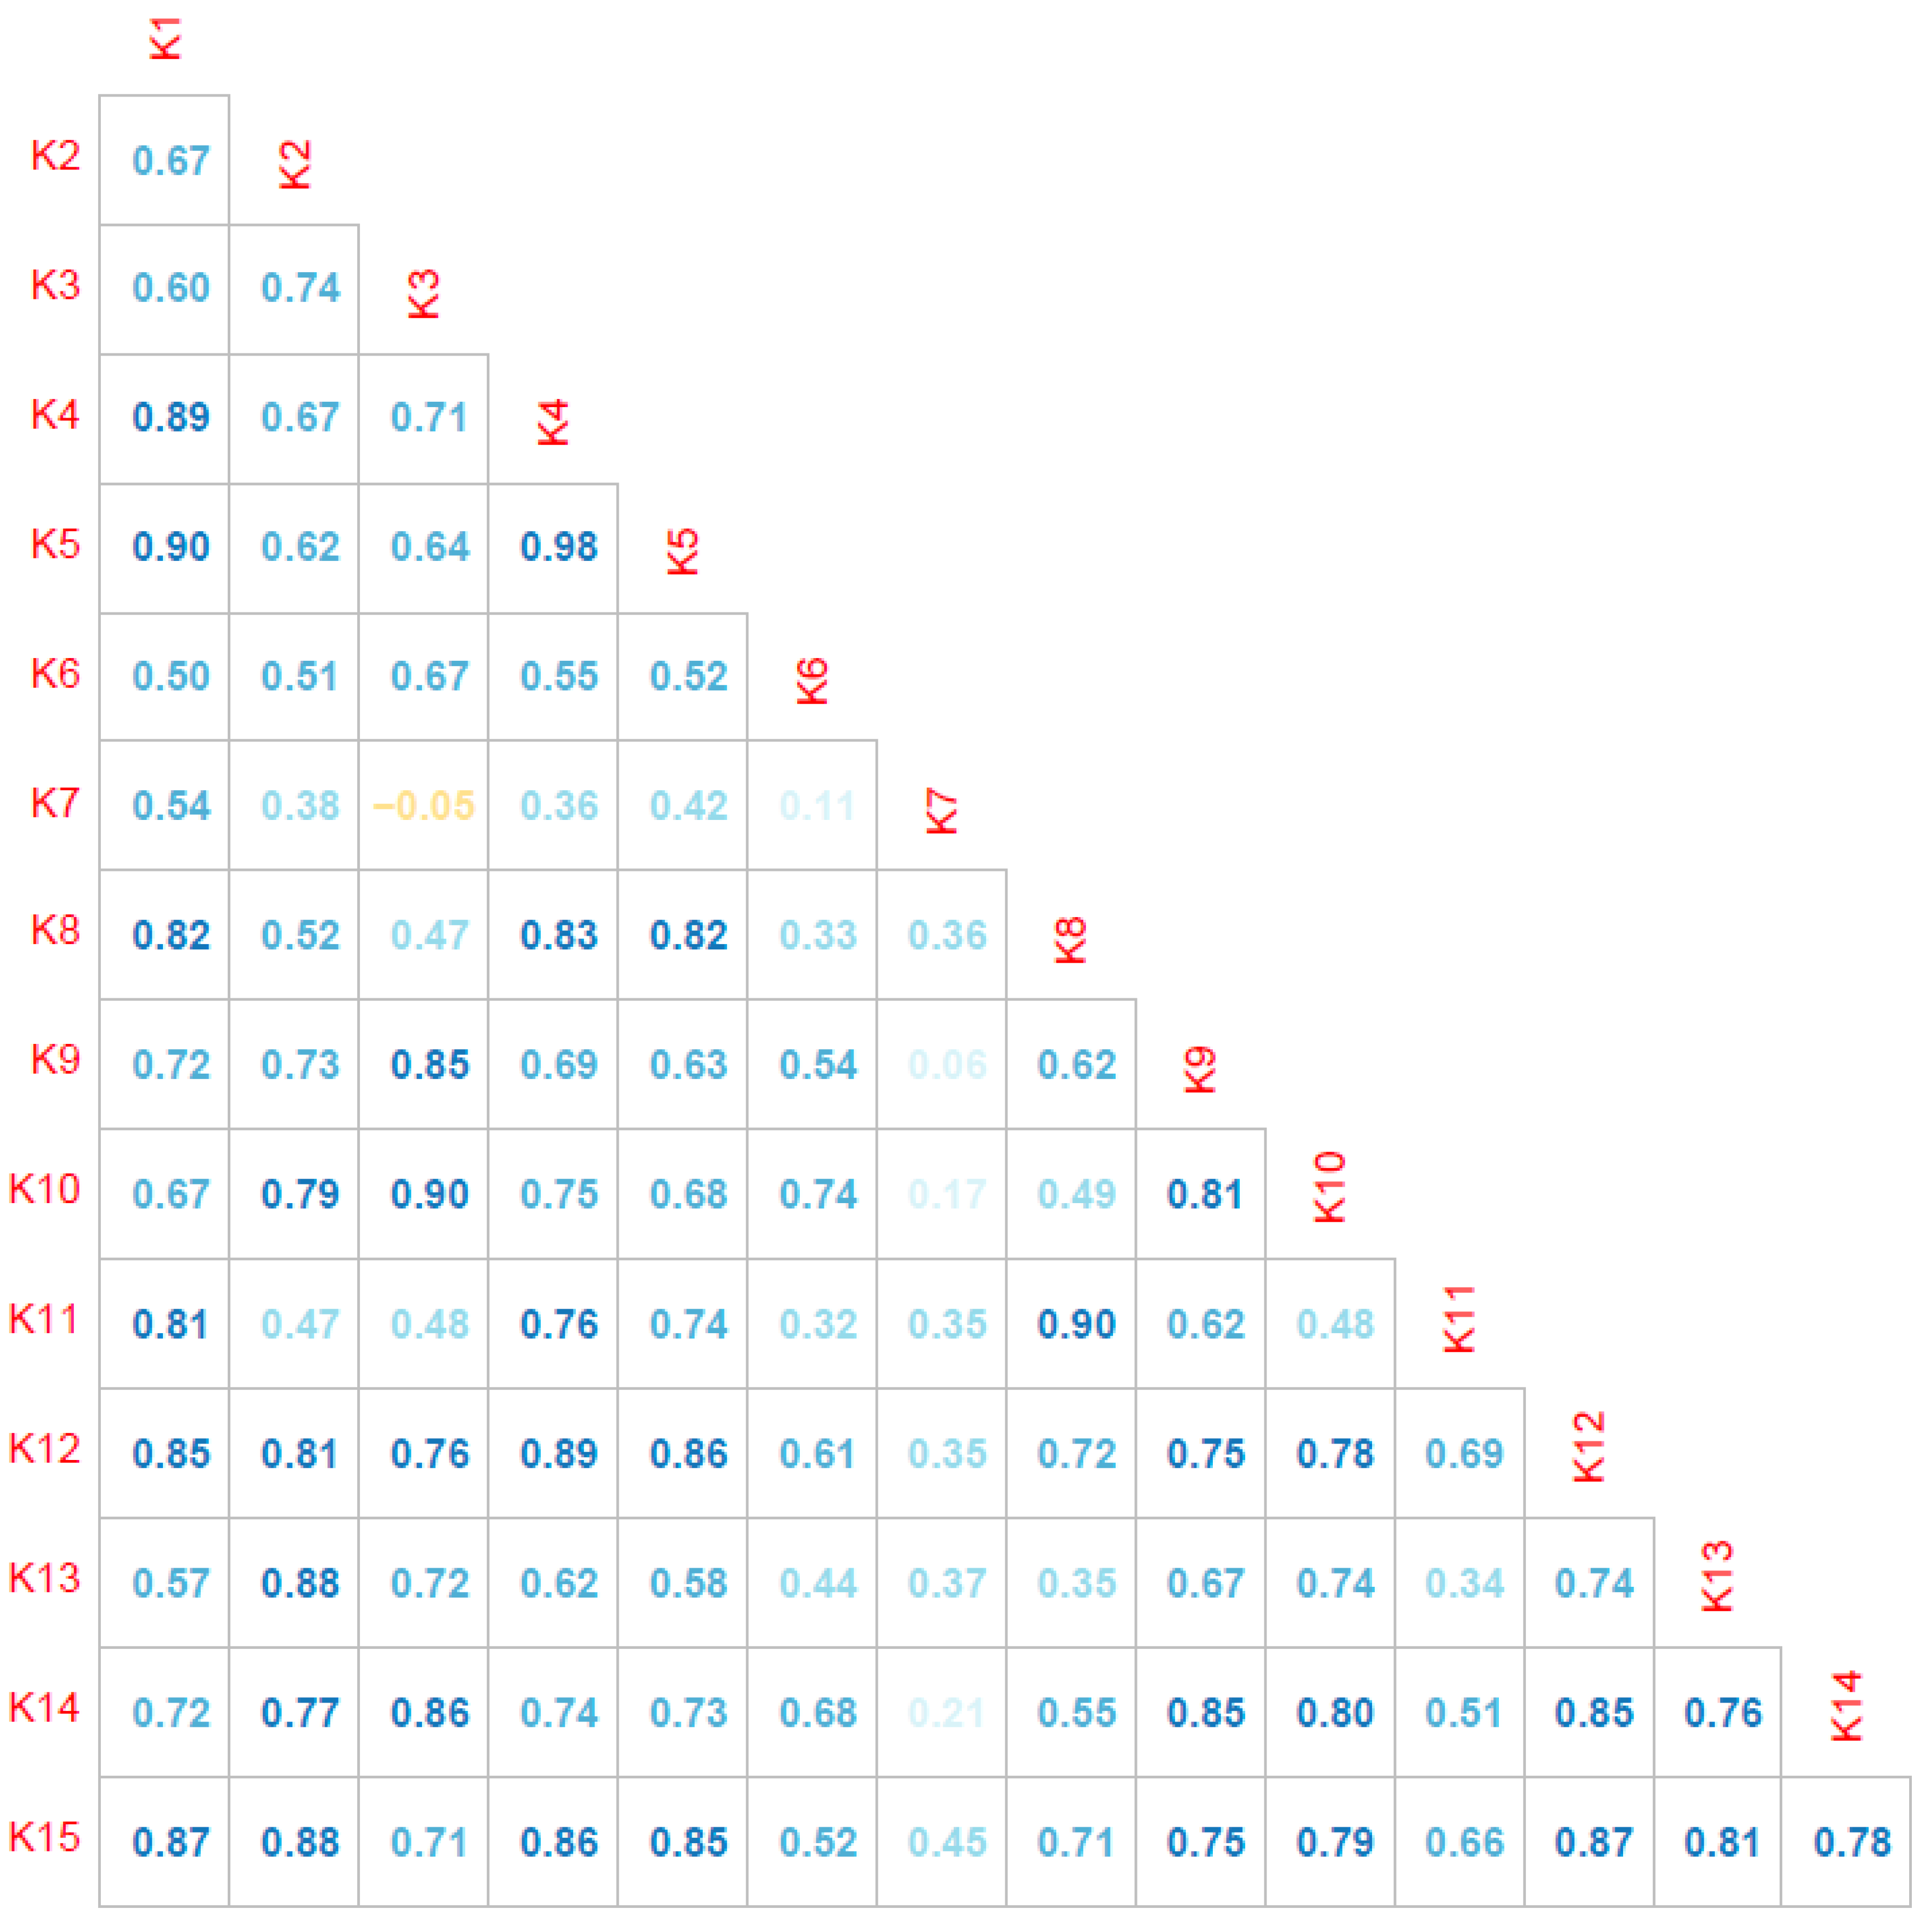
2.3. Network Analysis

A network is a graph G (V, E) in which V = {N} and E = {E1, E2,…, Em} where N is the number of data elements that are represented as nodes in the graph, and each edge in E represents an interrelationship between two nodes (∈V). In this study, the interrelationship is the pair-wise correlation between each pair of participants, which is measured using the Pearson correlation coefficient [23]. By measuring the correlation, a correlation network graph was constructed. A correlation network graph is a subgraph of graph G in which any two nodes (Vx and Vy, where Vx, Vy ∈ V) are connected by an edge if and only if the Pearson pair-wise correlation between Vx and Vy exceeds a certain threshold [21]. In such a scenario, Vx and Vy are said to be positively correlated. Similarly, if neither of the two nodes is connected in the correlation graph, then it implies that there is no relationship between those two nodes.
The construction of the correlation network involves a two-step process. Firstly, pair-wise correlation coefficients are computed between each pair of participants, utilizing the features outlined in Table 2. This process yields an NxN matrix, as shown in Figure 2, where N is the number of participants and each matrix entry signifies the correlation coefficient between the respective participants. The Pearson correlation, typically ranging from −1 to +1, signifies the degree of correlation, with −1 indicating no correlation and +1 denoting perfect positive correlation. Given that the resulting matrix is symmetric (NxN), correlation coefficients above the diagonal mirror those below it. Following this, a threshold “t” is determined by examining the distribution of all correlation values. Subsequently, an adjacency matrix is formulated by setting threshold “t” to the NxN matrix. If a matrix entry is greater than “t”, the entry is replaced with 1; otherwise, it is set to 0. Finally, as the adjacency matrix serves as an abstract representation of a graph, a correlation network is then constructed based on this matrix. Additionally, the detailed construction methodology has been explained elsewhere [21].
In the second step, a group of subjects with similar mobility profiles was identified by employing the Louvain clustering algorithm [26]. The Louvain clustering algorithm is a popular method for community detection in complex networks. Its significance lies in its ability to efficiently identify meaningful groups or communities within large-scale networks, aiding our understanding of network structures, behaviors, and interactions. A cluster is a collection of nodes with similar properties, and clustering is the task of identifying such groups that exhibit similar properties. Often, the terms clustering and community discovery are used interchangeably by the scientific community. In biological networks, clustering or community discovery is a method of classifying the data elements (clusters), wherein members of each group are related through certain characteristics [27].
To illustrate this phenomenon, let us consider a specific scenario. Let there be four individuals, labeled P1 through P4, acting as vertices. The features, denoted as F1 through Fn, are extracted from the raw sensor data collected from these individuals. The initial step in network analysis involves computing pair-wise Pearson correlations using these extracted features. The correlation values are exemplified in Table 3. By representing individuals as vertices and their pair-wise correlations as edge weights, we construct a graph as shown in Figure 3.
In the next phase, a correlation threshold of 0.7 is employed to establish the correlation network. This leads to the formation of the network depicted in Figure 3, wherein edges between P1–P2, P2–P4, and P2–P3 are eliminated. Following this step, a community detection algorithm is applied to identify strongly connected communities within the resulting network. In our example, P1, P3, and P4 constitute a community (marked in orange circle), while P2 is disconnected from the network, as shown in Figure 4. For an in-depth understanding of the construction methodology of the correlation network, readers are referred to a more detailed explanation provided elsewhere [6].
In the context of this study, each participant (N = 15 infants) was represented as a node in the graph, and a positive correlation between a pair of infants was represented with an edge between the pair. The main objective of the network analysis was to identify the groups that are homogeneous and well-separable [19]. It implies that all the subjects in a group contain similar characteristics, while the subjects between the groups are distinguishable. In other words, all of the infants that were categorized into a particular group had similar PA patterns. Conversely, the PA of infants belonging to two different groups was distinct. The advantage of our methodology is that the results were not influenced by a class label or parent annotations. Rather, our study findings were completely driven by mobility data collected from the participants. These data-driven findings enable the analysis of the data inherently. Furthermore, they provide rich insights into the data and allow us to identify natural groups that exhibit similar mobility patterns.
Although clusters were obtained in the previous step, it was necessary to perform an enrichment analysis to compare the over-representation of infants’ demographic information across the derived clusters. The method of enrichment analysis used was a popular tool in gene set enrichment analysis (GSEA) that has been widely used to extract gene expression data and compare similarities across multiple groups [28]. In this method, each demographic parameter was evaluated and analyzed to check whether the parameter was over-represented in a group. In the event that a particular parameter is over-represented in a group, that parameter is said to be enriched for that group. In other words, the subjects within the group were similar concerning the parameter. This might be a useful insight for healthcare professionals to comprehend the behavior of infants belonging to various groups identified in the process.

2.4. PA Analysis

The PA analysis aimed to explore the PA patterns of infants across multiple time intervals and extract meaningful insights by integrating the knowledge from the clusters obtained in network analysis. Thus, to capture infants’ PA behavior across multiple time domains, we segmented the data into three categories: Hour-wise, day-wise, and weekday–weekend, and performed network analysis followed by enrichment analysis for each category. The advantages of using three time intervals were that they capture PA behavior across multiple time domains and minimize the time domain bias to extract rich insights from the network analysis.
In this approach, an infant’s PA was evaluated with respect to its cluster and the other clusters in the network. Furthermore, the overall PA level was analyzed by considering two important parameters: (1) PA patterns between the ankle and waist and (2) intensity of PA. Infants’ PA patterns were analyzed as they were perceived in different time intervals rather than in a single snapshot. This comprehensive approach to studying infant PA behavior can provide a more complete understanding of infants’ mobility patterns, enabling insights into their PA characteristics, and could identify infants who may benefit from interventions to improve their overall health and well-being.

3. Results

This section will present the results of the network analysis performed on infant PA data using three different time intervals: Hour-wise, day-wise, and weekday–weekend day. First, results from the network analysis, including identified communities, are discussed. Figure 5a depicts the generated network graph as well as the communities identified by employing the Louvain clustering algorithm. The box plots in Figure 5b were generated to visualize the distribution of PA levels of the ankle as well as waist among multiple communities identified in the network model. Second, heatmaps shown in Figure 6a–f were utilized to study the ankle and waist PA patterns across three time intervals. Finally, enrichment analysis results are presented in Table 4, which explains the common and contrasting parameters in communities identified in each of the models.

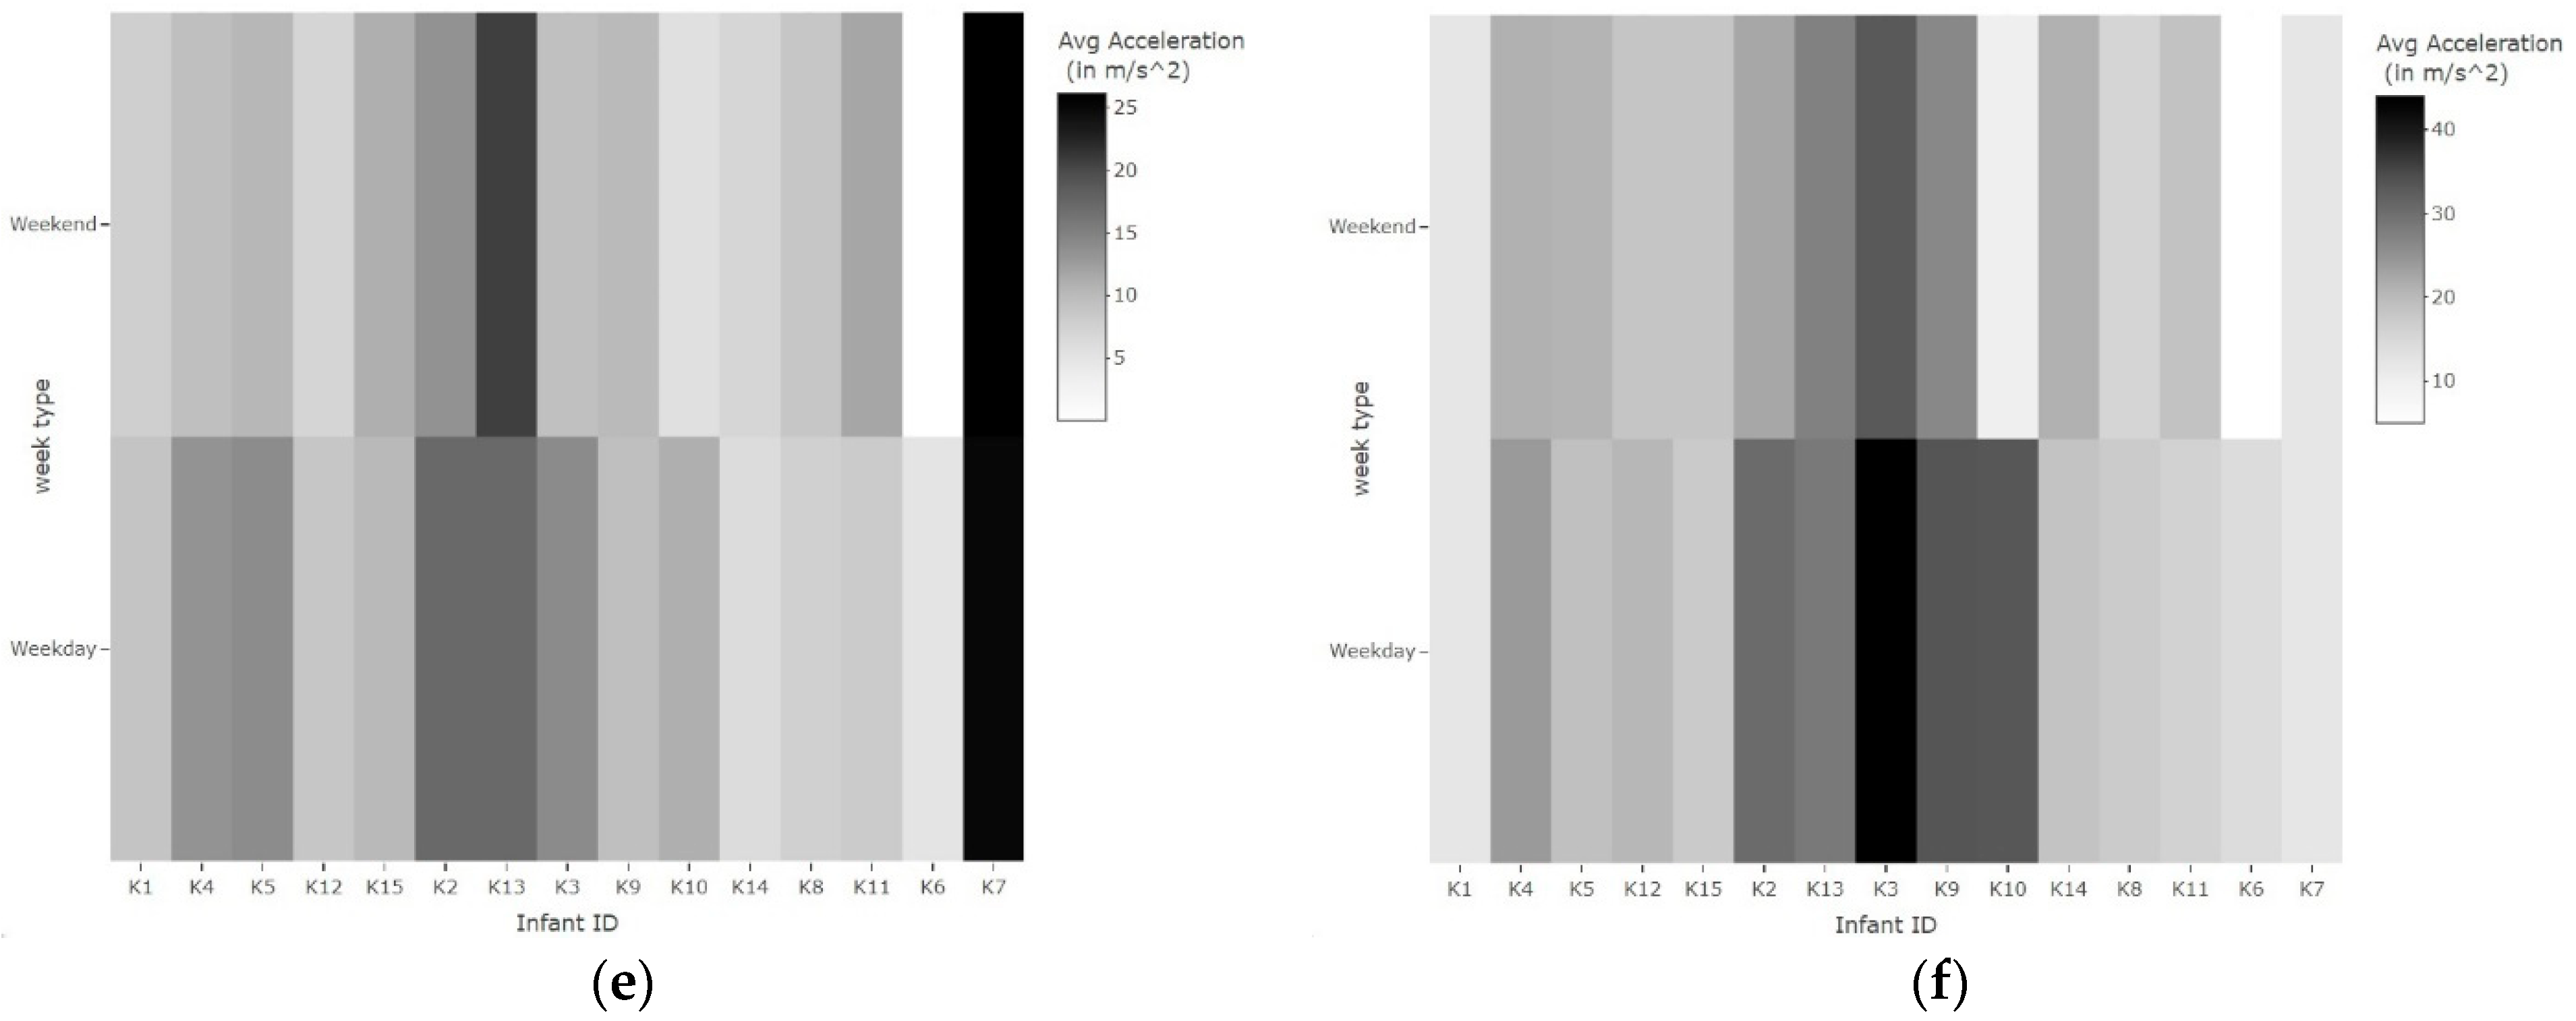
3.1. Physical Activity Analysis

The network graph shown in Figure 5a was obtained by constructing a correlation network graph, followed by employing the Louvain clustering algorithm. In these graphs, 15 infants are denoted as nodes/vertices while the edges represent interrelations between them. In this context, an interrelationship indicated a positive correlation between infants, which was measured by utilizing their PA data. For example, in Figure 5a, the edge between K2 and K13 signifies that they were positively correlated due to their similarity in hourly PA, whereas K7 and K2 were not connected by an edge because they were not correlated. Furthermore, we have employed the Fruchterman–Reingold algorithm to represent each network graph, which allows us to visualize the strength of correlation in the form of distance [2]. The Fruchterman–Reingold algorithm is a force-directed graph drawing algorithm used to visualize graphs and networks in two-dimensional space. It is significant in network analysis and data visualization for its ability to create clear and visually appealing representations of complex network structures, helping researchers and analysts better understand relationships and patterns within the data. Therefore, in the relative space, infants with stronger correlations were closely grouped, whereas infants with weaker correlations were repelled from each other. Isolation from the network and disconnected communities represents stronger separation from the other nodes and communities that were connected to each other.
The analysis results shown in Figure 5a indicate the presence of four distinct communities or clusters within the network, comprising the following nodes: Community 1 (K1, K4, K5, K12, K15), community 2 (K2, K13), community 3 (K3, K9, K10, K14), and community 4 (K8, K11). Notably, community 4 formed a disconnected cluster, while infants K6 and K7 appeared to be isolated from the network. In this study, a community refers to a group of infants exhibiting similar PA patterns, indicating a strong correlation between the infants within the same community when analyzed by hour-wise segmentation. Additionally, nodes K12 and K15 in community 1, K2 in community 2, and K14 in community 3 were identified as boundary nodes, while the other nodes were designated as community nodes, based on prior research [21]. The relationship between nodes within a community was highly robust, with comparable PA behavior. However, high-degree nodes situated on the boundary of a cluster were more susceptible to being classified into neighboring clusters, suggesting a weaker classification into their respective community. Therefore, careful analysis of their PA patterns was essential to differentiate them from the community [29].
From the grouped box plots shown in Figure 5b, we can observe that the ankle PA levels were generally higher than the waist PA levels in all four communities. However, the difference between ankle and waist PA levels varied across the four communities. Community 3 had the largest difference in mean between ankle and waist activity and the largest interquartile range (IQR), indicating a higher level of PA compared to the other groups. Nevertheless, waist activity was much lower than ankle activity. Similarly, Community 2 had a relatively high mean difference, suggesting higher PA levels than Community 1 and 4. Although community 2 exhibited lower variability in overall activity levels, they showed the highest ankle and waist mean compared to other communities. Community 1 had the smallest mean difference, indicating the lowest level of PA among the four groups.
The observed differences in activity levels between waist and ankle in community 3 may be due to differences in environmental factors between childcare and home settings. The ankle box plot of community 3 shown in Figure 5b demonstrates a much higher median and a much wider range than the waist box plot. From the demographic information presented in Table 4, K3, K10, and K14 of community 3 and K2 from community 2 attended childcare. Furthermore, as perceived by the activity patterns shown in Figure 6a–f, most of the infants in community 2 and community 3 were active during the day, including weekdays and weekend days. One possible reason for the higher ankle PA levels among Group 3 individuals who attended childcare was that childcare environments may provide more opportunities for PA compared to home environments. On the other hand, K8 and K11 infants of group 4 exhibited lower PA levels than those of the other communities, indicating a possible reason for their separation from the network. Although group 3′s daily and weekday–weekend day patterns in Figure 6c–f show moderate PA levels, hourly patterns in Figure 6a,b show an absence of activity between 7 a.m. to 9 a.m. and 1 p.m. to 3 p.m. This could be because infants in group 3 might have had different sleep schedules than other infants in the population. Nonetheless, infants in community 1 seemed to have typical PA levels, as there was no evidence to explain their distinct activity patterns.
Infants K7 and K6 were isolated due to distinctive PA characteristics when compared with other infants in the population. Analysis of the day-wise and weekday–weekend day heatmaps depicted in Figure 6c–f indicates that the waist acceleration of infant K7 was significantly higher than ankle acceleration, which was distinct from other infants. Further research may be required to validate the overall PA of infant K7. Infant K6 was also isolated because of the fact that data were only available for K6′s PA for one weekday and almost insignificant activity was recorded on other days, as can be observed from Figure 6c,d.

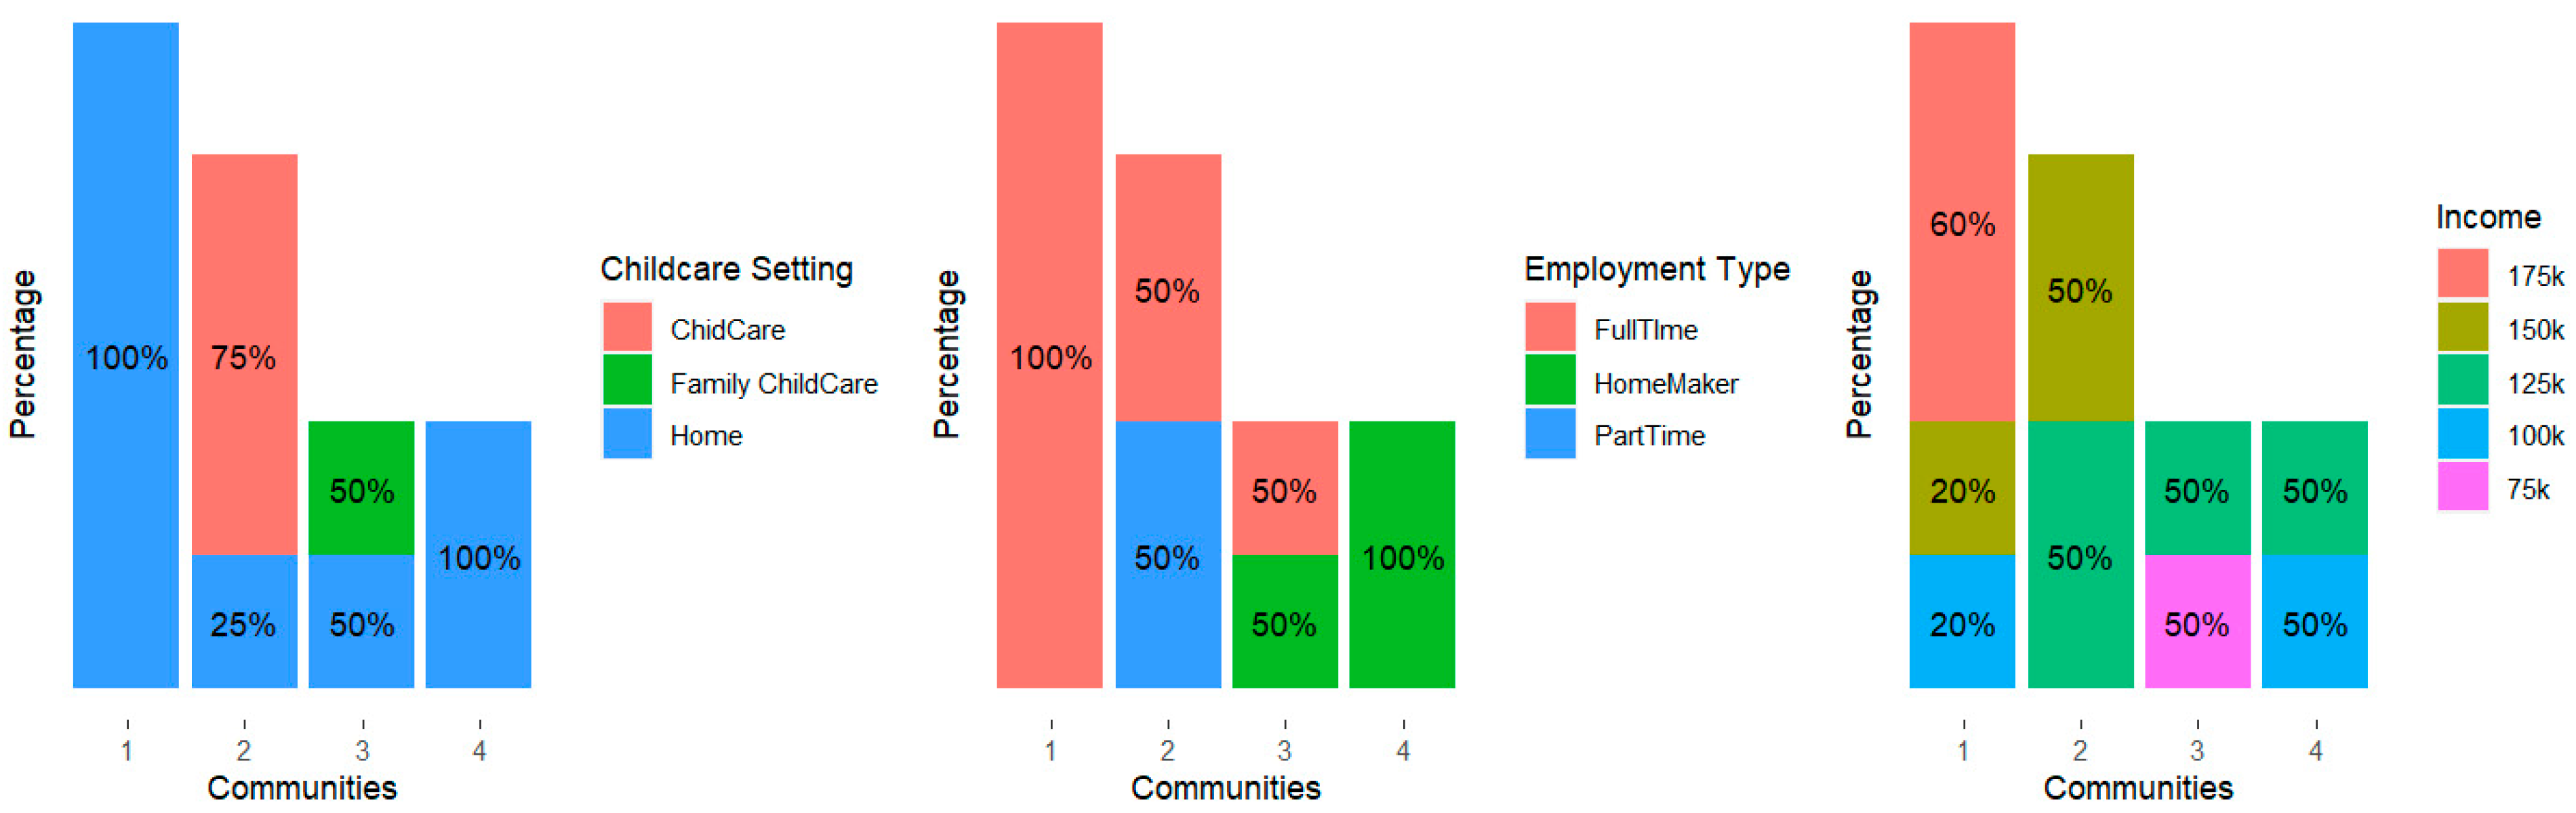
3.2. Enrichment Analysis

Table 4 exhibits the outcomes derived from an enrichment analysis conducted on the network graph, focusing on the prevalence of childcare settings, parental demographic factors, and infant anthropometrics. Infants were categorized based on their community IDs. This tabulation presents two distinct variable types: Categorical variables encompassing childcare settings and parental income and occupation, and numerical variables detailing infant weight, head circumference, and waist circumference. Our methodology uncovered insightful and exclusive findings through this analysis. Figure 7 depicts the distributions of infant weight, head circumference, and waist circumference across the four communities. Additionally, to visually represent parental demographic details and childcare settings across the four communities, we employed barplots in Figure 8. The X-axis delineates communities, while the Y-axis portrays the percentage over-representation of corresponding parameters, encompassing childcare settings, parental income, and employment details. Community 1 is comprised solely of infants receiving parental care at home. All parents within this community were full-time employees, and except for K1, all other infants belonged to the high-income bracket, earning an annual income above USD 150 k. Conversely, in community 2, aside from K9, most infants attended formal childcare centers. Furthermore, all were from high-income households, earning more than USD 125 k annually. Infants K2 and K13 were clustered together, with only K2 attending a family childcare home—a different setting compared to the conventional childcare center, typically comprising a larger group of children based on age and situated in a commercial building. In contrast, a family childcare home tends to have a mixed-age group of children within a residential setting.
Figure 7 presents a comprehensive box plot comparison showcasing the distributions of infant weight, head circumference, and waist circumference across the four communities. The X-axis denotes communities, while the Y-axis signifies each anthropometric parameter. In terms of weight, community 1 displays a wider weight range, with a notable outlier observed at 15.12 kg. Conversely, communities 2, 3, and 4 exhibit narrower interquartile ranges (IQR), indicating more uniform weight distributions among infants within these communities. Regarding head and waist circumferences, community 1 demonstrates a broader range of head circumferences, with an outlier at 19.18 cm. Additionally, as highlighted in Table 4, infant K15 in community 1 displays a higher weight of 15.12 kg compared to other infants, while K12 in the same community exhibits a larger head and waist circumference of 19.18 cm, surpassing other infants’ measurements. Notably, despite their higher weight, head, and waist circumferences, these infants elevated anthropometric measurements do not align with increased physical activity levels. As elucidated earlier, community 2, comprising infants attending childcare facilities, demonstrates higher physical activity levels compared to other communities.

4. Discussion

In this study, we have proposed a methodology that can analyze the PA of infants by processing the raw sensor data captured from wearable sensors in a free-living environment. First, a correlation network graph was constructed. Then the Louvain clustering algorithm was utilized to extract clusters that were closely connected. A cluster represented a group of infants that contained similar activity profiles. In other words, they were strongly similar in their movement behavior. An edge between any two nodes in the graph resembled a positive correlation. It is important to realize that the network was constructed by considering ankle and waist sensor data separately, which allowed the network to reveal significant differences between ankle and waist PA data.
The purpose of incorporating three time intervals was not to compare one feature against another but rather to analyze and comprehend the movement patterns of infants across multiple time domains. Each time interval feature revealed certain useful information that could be effectively utilized in understanding an infant’s PA characteristics. For instance, the raw sensor signal of K6 was detected for only one day, while the remaining three days showed minimal recorded activity. Although this could be attributed to an artifact in the data collection process, this anomaly was only identified upon analyzing PA patterns using day-wise features. Furthermore, network analysis is a group analysis instead of an individual analysis. As similar individual analyses have played a crucial role in the interpretation of a child’s cognitive development and assisted in the early detection of childhood developmental disorders such as autism, this approach could also be helpful in the diagnosis of specific movement disorders [3].
Network analysis brings several implications that can be applied back to the original problem domain. In this study, findings from network analysis can be utilized to understand the overall physical health of infants. For instance, K8 and K11 belong to the lower PA range category compared to other infants. Though the objective of the study was not to determine the appropriateness of the infants’ PA, it may be important to further investigate these differences to understand if these differences relate to other developmental outcomes. Similarly, K7 was peculiar in terms of PA patterns when compared to all other infants in the population of subjects. However, further assessments are needed to understand these differences. In summary, these conclusions may help in future research or interventions aimed at promoting PA in infant care settings.
In the present physical activity (PA) analysis, validation is challenging as there are no ground truth labels related to the subjects—all infants under the study are healthy. However, the robustness of the analysis is substantiated by the outcomes of the enrichment analysis illustrated in Table 4. Notably, a significant portion of infants attending childcare is consolidated into a single community. This observation underscores the methodology’s capability to discern distinctions among infants in diverse childcare settings, showcasing its potential efficacy.

5. Limitations

This analysis has been carried out with a limited sample of 15 infants. Although the methodology has been presented with multiple time frequencies, the limited population sample might be one of the inherent limitations of this study. Future work should acquire PA data from a larger number of infants. In addition, it is possible that the averaging bias might have been introduced while aggregating total time series data into hours. The data has been collected as time series data with an epoch of one second using body-worn wearable sensors. It is essential to combine data into smaller samples by taking the average of the larger sample. Therefore, we do not reject the presence of average bias in the resultant sample.
Another limitation of this study was that the accelerometer data were only captured during daytime hours, from 7 a.m. to 7 p.m., for a total of 12 h. No data were collected during nighttime hours, as the focus of the study was on analyzing daytime PA when infants are typically active. The analysis presented in the study focuses on the PA patterns of the population of infants rather than individual patterns. Thus, it is important to interpret the results within the context of a population study.

6. Conclusions

Adequate PA is one of the most important aspects of early infancy. Analyzing infants’ PA levels is a challenging task since infants have irregular and unpredictable movement patterns, making it difficult to record and analyze their PA levels individually. Furthermore, individual assessment is often biased by visual observation and does not lead to an objective conclusion. In this study, we have developed a population-based network analysis method that can potentially identify infants with various PA levels. Individual analysis in the light of their peers provides rich insights that can be integrated into the diagnosis and treatment of specific movement disorders. The uniqueness of our methodology is that the results were not led by a known group label; rather, they were data driven. Moreover, results were generated by integrating three time factors, including day, hour, and weekday–weekend day. In conclusion, this analysis approach could be used by healthcare professionals to educate parents and caregivers on the importance of providing opportunities for PA in infants’ daily routines. By doing so, they could promote healthy habits and prevent sedentary behavior that can lead to negative health outcomes later in life. For future work, we plan to use machine learning algorithms to predict the various physical activities performed by the infants, and to integrate network analysis and machine learning to provide a comprehensive understanding of infants’ movement behavior. Additionally, future research should collect and analyze sleep data to further enhance our understanding of infants’ health.

Author Contributions

D.D., B.K. and M.S. conceptualization, supervision of data collection and analysis; P.C. data collection; R.K.T. and H.H.A. methodology; R.K.T. software implementation, visualization, validation; R.K.T. and P.C. writing—reviewing and editing the manuscript; H.H.A. supervision of methodology implementation; D.D., B.K., M.S., P.C., R.K.T. and H.H.A. review and editing. All authors have read and agreed to the published version of the manuscript.

Funding

This project was funded by the University of Nebraska Omaha.

Institutional Review Board Statement

The study approval was obtained by the University of Nebraska Medical Center Institutional Review Board (IRB#0631-19-EP).

Informed Consent Statement

Informed consents were obtained from all the participants and infants caregivers/parents in a private setting within the Biomechanics Research Building on the University of Nebraska at Omaha campus. Participants were encouraged to ask questions during the process of consent to ensure all research procedures were well understood. All methods were carried out in accordance with relevant guidelines and regulations.

Data Availability Statement

The data presented in this study are available on request from the corresponding author. The data are not publicly available due to privacy.

Acknowledgments

We would like to thank Oluwaseye Odanye (Paul) for helping us with the data collection and the infants and their caregivers to participate in our research study.

Conflicts of Interest

The authors declare no conflicts of interest.

References

  1. Dutta, A.; Ma, O.; Toledo, M.; Pregonero, A.F.; Ainsworth, B.E.; Buman, M.P.; Bliss, D.W. Identifying free-living physical activities using lab-based models with wearable accelerometers. Sensors 2018, 18, 3893. [Google Scholar] [CrossRef] [PubMed]
  2. Fruchterman, T.M.; Reingold, E.M. Graph drawing by force-directed placement. Softw. Pract. Exp. 1991, 21, 1129–1164. [Google Scholar] [CrossRef]
  3. Thelagathoti, R.K.; Ali, H.H. Quantitative Approaches for Detecting Early Childhood Developmental Disorders using Wireless Sensors and Mobility Data. Int. J. Adv. Life Sci. 2022, 14, 2022. [Google Scholar]
  4. WHO Multicentre Growth Reference Study Group. WHO Child Growth Standards based on length/height, weight and age. Acta Paediatr. 2006, 95, 76–85. [Google Scholar] [CrossRef] [PubMed]
  5. Hauck, J.L.; Zott, G.R.; Felzer-Kim, I.T.; Adkins, C.M. A comparison of low-intensity physical activity, growth, and sleep behavior in 6-month old infants. Infant Behav. Dev. 2018, 53, 18–24. [Google Scholar] [CrossRef] [PubMed]
  6. Warburton, D.E.; Bredin, S.S. Reflections on physical activity and health: What should we recommend? Can. J. Cardiol. 2016, 32, 495–504. [Google Scholar] [CrossRef]
  7. Janssen, I.; LeBlanc, A.G. Systematic review of the health benefits of physical activity and fitness in school-aged children and youth. Int. J. Behav. Nutr. Phys. Act. 2010, 7, 40. [Google Scholar] [CrossRef]
  8. Ketcheson, L.; Pitchford, E.A.; Kwon, H.J.; Ulrich, D.A. Physical activity patterns in infants with and without down syndrome. Pediatr. Phys. Ther. 2017, 29, 200–206. [Google Scholar] [CrossRef]
  9. Hauck, J.L.; Felzer-Kim, I.T.; Gwizdala, K.L. Early movement matters: Interplay of physical activity and motor skill development in infants with Down syndrome. Adapt. Phys. Act. Q. 2020, 37, 160–176. [Google Scholar] [CrossRef]
  10. Reilly, J.J.; Penpraze, V.; Hislop, J.; Davies, G.; Grant, S.; Paton, J.Y. Objective measurement of physical activity and sedentary behaviour: Review with new data. Arch. Dis. Child. 2008, 93, 614–619. [Google Scholar] [CrossRef]
  11. De Vries, S.; Van Hirtum, H.; Bakker, I.; Hopman-Rock, M.; Hirasing, R.; Van Mechelen, W. Validity and reproducibility of motion sensors in youth: A systematic update. Med. Sci. Sports Exerc. 2009, 41, 818. [Google Scholar] [CrossRef] [PubMed]
  12. Trost, S.G.; Mciver, K.L.; Pate, R.R. Conducting accelerometer-based activity assessments in field-based research. Med. Sci. Sports Exerc. 2005, 37, S531. [Google Scholar] [CrossRef] [PubMed]
  13. Cliff, D.P.; Reilly, J.J.; Okely, A.D. Methodological considerations in using accelerometers to assess habitual physical activity in children aged 0–5 years. J. Sci. Med. Sport 2009, 12, 557–567. [Google Scholar] [CrossRef] [PubMed]
  14. Ward, D.S.; Evenson, K.R.; Vaughn, A.; Rodgers, A.B.; Troiano, R.P. Accelerometer use in physical activity: Best practices and research recommendations. Med. Sci. Sports Exerc. 2005, 37 (Suppl. S11), S582–S588. [Google Scholar] [CrossRef] [PubMed]
  15. Radu, L.E.; Făgăraş, S.P.; Vanvu, G. Physical activity index of female university students. Procedia-Soc. Behav. Sci. 2015, 191, 1763–1766. [Google Scholar] [CrossRef]
  16. Van Cauwenberghe, E.; Gubbels, J.; De Bourdeaudhuij, I.; Cardon, G. Feasibility and validity of accelerometer measurements to assess physical activity in toddlers. Int. J. Behav. Nutr. Phys. Act. 2011, 8, 67. [Google Scholar] [CrossRef]
  17. Costa, S.; Barber, S.E.; Cameron, N.; Clemes, S.A. The objective measurement of physical activity and sedentary behaviour in 2–3 year olds and their parents: A cross-sectional feasibility study in the bi-ethnic Born in Bradford cohort. BMC Public Health 2015, 15, 1109. [Google Scholar] [CrossRef]
  18. Johansson, E.; Hagströmer, M.; Svensson, V.; Ek, A.; Forssén, M.; Nero, H.; Marcus, C. Objectively measured physical activity in two-year-old children–levels, patterns and correlates. Int. J. Behav. Nutr. Phys. Act. 2015, 12, 3. [Google Scholar] [CrossRef]
  19. Thelagathoti, R.; Ali, H. A population analysis approach using mobility data and correlation networks for depression episodes detection. Ann Depress. Anxiety 2022, 9, 1112. [Google Scholar]
  20. Rastegari, E.; Azizian, S.; Ali, H. Machine learning and similarity network approaches to support automatic classification of parkinson’s diseases using accelerometer-based gait analysis. In Proceedings of the Hawaii International Conference on System Sciences 2019, Maui, HI, USA, 8–11 January 2019. [Google Scholar]
  21. Thelagathoti, R.K.; Ali, H.H. A Data-Driven Approach for the Analysis of Behavioral Disorders with a Focus on Classification and Severity Estimation. In Proceedings of the 2022 IEEE International Conference on Bioinformatics and Biomedicine (BIBM), Las Vegas, NV, USA, 6–8 December 2022; pp. 821–825. [Google Scholar]
  22. Gosak, M.; Markovič, R.; Dolenšek, J.; Rupnik, M.S.; Marhl, M.; Stožer, A.; Perc, M. Network science of biological systems at different scales: A review. Phys. Life Rev. 2018, 24, 118–135. [Google Scholar] [CrossRef]
  23. Benesty, J.; Chen, J.; Huang, Y. On the importance of the Pearson correlation coefficient in noise reduction. IEEE Trans. Audio Speech Lang. Process. 2008, 16, 757–765. [Google Scholar] [CrossRef]
  24. Qualtrics. Qualtrics Research Suite [Software]. 2022. Available online: http://www.qualtrics.com (accessed on 14 November 2022).
  25. GT9X link: ActiGraph Wearable Devices [Internet]. Available online: https://theactigraph.com/actigraph-link (accessed on 7 July 2023).
  26. De Meo, P.; Ferrara, E.; Fiumara, G.; Provetti, A. Generalized louvain method for community detection in large networks. In Proceedings of the 2011 11th International Conference on Intelligent Systems Design and Applications, Cordoba, Spain, 22–24 November 2011; pp. 88–93. [Google Scholar]
  27. Girvan, M.; Newman, M.E. Community structure in social and biological networks. Proc. Natl. Acad. Sci. USA 2002, 99, 7821–7826. [Google Scholar] [CrossRef] [PubMed]
  28. Subramanian, A.; Tamayo, P.; Mootha, V.K.; Mukherjee, S.; Ebert, B.L.; Gillette, M.A.; Paulovich, A.; Pomeroy, S.L.; Golub, T.R.; Lander, E.S.; et al. Gene set enrichment analysis: A knowledge-based approach for interpreting genome-wide expression profiles. Proc. Natl. Acad. Sci. USA 2005, 102, 15545–15550. [Google Scholar] [CrossRef] [PubMed]
  29. Berahmand, K.; Bouyer, A.; Samadi, N. A new local and multidimensional ranking measure to detect spreaders in social networks. Computing 2019, 101, 1711–1733. [Google Scholar] [CrossRef]
Figure 1. Method overview.
Analytics 03 00002 g001
Figure 2. Correlation coefficient matrix.
Analytics 03 00002 g002
Figure 3. Pair-wise correlation values.
Analytics 03 00002 g003
Figure 4. Correlation network and community detection.
Analytics 03 00002 g004
Figure 5. (a) Network graph and detected communities. (b) Box plots of ankle and waist average acceleration by each community.
Analytics 03 00002 g005
Figure 6. Average Acceleration of each infant. (a) Hour-wise waist acceleration, (b) Hour-wise ankle acceleration, (c) Day-wise waist acceleration, (d) Day-wise waist acceleration, (e) Week-wise waist acceleration, (f) Week-wise ankle acceleration.
Analytics 03 00002 g006aAnalytics 03 00002 g006b
Figure 7. Infant anthropometrics.
Analytics 03 00002 g007
Figure 8. Parents’ demographics.
Analytics 03 00002 g008
Table 1. Demographic information overview.
ParameterValue
Age6–15 months
Gender
  Male 10
  Female 10
Race/Ethnicity
  White 17
  Asian3
Mothers Employment
  Full time11
  Housemaker8
  Part time1
Annual household income
  USD 25,000–75,000 3
  USD 75,000–125,000 7
  USD 125,000–175,000 10
Childcare status
  At home with mother15
  Childcare center/home5
Infant anthropometricsMeanSD
  Infant weight9.21.8
  Head circumference17.80.61
  Waist circumference17.530.95
Table 2. Feature List.
Feature SetFeaturesCountDescription
Hour-wise featuresm_w_7–
m_w_18
12Mean (average) of PA measured from the waist sensor across 4 days for each hour
sd_w_7–sd_w_1812Standard deviation (SD) of PA measured from the waist sensor across 4 days for each hour
m_a_7–
m_a_18
12Mean (average) of PA measured from the ankle sensor across 4 days for each hour
sd_a_7–
sd_a_18
12Standard deviation (SD) of PA measured from the ankle sensor across 4 days for each hour
Total48
Day-wise PA featuresdm_w_1–
dm_w_4
4Mean (average) of PA measured from the waist sensor across 7 a.m. to 18:59 p.m. for each of the 4 days
dsd_w_1–dsd_w_44Standard deviation (SD) of PA measured from the waist sensor across 7 a.m. to 18:59 p.m. for each of the 4 days
dm_a_1–
dm_a_4
4Mean (average) of PA measured from the ankle sensor across 7 a.m. to 18:59 p.m. for each of the 4 days
dsd_a_1–
dsd_a_4
4Standard deviation (SD) of PA measured from the ankle sensor across 7 a.m. to 18:59 p.m. for each of the 4 days
Total16
Weekday–weekend day PA featureswm_w_1–
wm_w_4
4Mean (average) of PA measured from the waist sensor for 2 weekdays and 2 weekends
wsd_w_1–wsd_w_44Standard deviation (SD) of PA measured from the waist sensor for 2 weekdays and 2 weekends
wm_a_1–
wm_a_4
4Mean (average) of PA measured from the ankle sensor for 2 weekdays and 2 weekends
wsd_a_1–wsd_a_44Standard deviation (SD) of PA measured from the ankle sensor for 2 weekdays and 2 weekends
Total16
Table 3. Correlation coefficient values.
Subject IDP1P2P3P4
P100.40.750.7
P20.400.50.55
P30.750.500.9
P40.70.550.90
Table 4. Demographic parameters by community.
IDChildcare SettingParent DemographicsInfant AnthropometricsCommunity ID
Childcare/HomeDuration (Hours)EmploymentIncome (USD)WeightHead
Circumference
Waist
Circumference
K1HomeNAFull-time100 k8.6717.5118.241
K4HomeNAFull-time175 k9.2917.917.581
K5HomeNAFull-time175 k9.1117.6618.611
K12HomeNAFull-time150 k11.1919.1819.181
K15HomeNAFull-time175 k15.1218.516.661
K3Childcare center>40Full-time150 k8.5918.0316.892
K9HomeNAPart-time150 k8.2517.1316.062
K10Childcare center31–40Full-time125 k7.7416.9817.342
K14Childcare center10–20Part-time125 k8.6118.0316.082
K2Family childcare home31–40Full-time125 k8.0517.4518.863
K13HomeNAHousemaker75 k9.4318.6317.683
K8HomeNAHousemaker100 k9.2317.2917.684
K11HomeNAHousemaker125 k8.1517.3317.784
K6Childcare center>40Full-time125 k8.2718.1716.63NA
K7HomeNAHousemaker50 k8.7418.0817.68NA
Disclaimer/Publisher’s Note: The statements, opinions and data contained in all publications are solely those of the individual author(s) and contributor(s) and not of MDPI and/or the editor(s). MDPI and/or the editor(s) disclaim responsibility for any injury to people or property resulting from any ideas, methods, instructions or products referred to in the content.

