Abstract
Stroke is a major cause of death worldwide, resulting from a blockage in the flow of blood to different parts of the brain. Many studies have proposed a stroke disease prediction model using medical features applied to deep learning (DL) algorithms to reduce its occurrence. However, these studies pay less attention to the predictors (both demographic and behavioural). Our study considers interpretability, robustness, and generalisation as key themes for deploying algorithms in the medical domain. Based on this background, we propose the use of random forest for stroke incidence prediction. Results from our experiment showed that random forest (RF) outperformed decision tree (DT) and logistic regression (LR) with a macro F1 score of 94%. Our findings indicated age and body mass index (BMI) as the most significant predictors of stroke disease incidence.
1. Introduction
Cardiovascular disease (CD) is a leading cause of mortality worldwide. In 2019, the World Health Organisation (WHO) reported that CD is responsible for 17.9 million deaths annually, accounting for 32% of all global deaths. Stroke is a significant contributor to cardiovascular disease-related mortality worldwide. Stroke disease accounts for 11% of recorded deaths globally and is the second leading cause of death [1]. Approximately one out of every 20 adults aged 14 and above may be affected by stroke disease [2]. However, the death rate due to stroke varies significantly between countries, with low-income countries experiencing a higher death rate [3]. Stroke disease is a major chronic disability that mainly affects the elderly population of 50 years and older. It is also one of the leading causes of dementia and can result in death if not properly handled [4].
Stroke disease has been extensively studied over time, and its impact has been documented in various studies across the globe. The authors in [5] performed an epidemiological study of stroke disease, mortality, incidence, prevalence, long-term outcome, and cost, which were identified as the different dimensions of stroke burden. Stroke treatment accounts for 2–4% of healthcare expenditure, and this proportion rises to 4% in developed countries. Stroke is the second-most common cause of death worldwide, resulting in the loss of five million lives annually. The death rate due to stroke ranges from 10–12% in western countries, with the average age of victims being around 65 years. Stroke is a critical medical condition that demands immediate medical attention. Thus, early detection and proper management are crucial to minimising stroke deaths. This has spurred researchers in the medical and IT fields to develop sophisticated stroke prediction models to prevent their prevalence and reduce their occurrence.
Recently, deep learning algorithms have shown good performances [6,7,8,9]. However, in the clinical and medical domains, the significance of predictors is vital for medical practitioners to understand how the predictors have contributed to the stroke disease prediction model. This is difficult to achieve with deep learning algorithms as they are black-box models that are complex to interpret by humans. To this end, we propose the use of random forest for stroke disease prediction. The random forest algorithm has been known for its high accuracy in predicting diseases in medical research [10]. Random forest is easy to interpret, fast to train and scale, performs well in complex datasets, and is robust to irrelevant features [11,12,13]. Thus, our main aim is to conduct an experimental comparison of interpretable and robust models for stroke disease prediction. In addition, we will explore the demographic attributes of stroke disease patients to gain in-depth insight. Ultimately, we will make recommendations for stroke disease prevention. The rest of the paper is organised as follows: Section 2 will discuss the literature reviewed to provide background knowledge for this study. Section 3 will formulate the research methodology. Section 4 will present and discuss the results, and Section 5 will present our recommendations and conclusion.
2. Related Work
Amini et al. [14] collected 807 records of healthy and unhealthy subjects with fifty stroke risk factors, such as hyperlipidemia, alcohol intake, and diabetic status, to predict stroke incidence. Their results showed k-nearest neighbour (KNN) and decision tree (DT) performed well with 94% and 95% accuracy, respectively. The authors in [15] compared machine learning approaches, including artificial neural networks (ANN), boosting and bagging, support vector machines (SVM), and random forest (RF), using a dataset of 507 patient records. Similarly, Ref. [16] employed ANN to predict ischemic stroke prognosis. They used 82 diagnosed ischemic stroke patients’ records and achieved an accuracy of 95%. An automated system that could detect ischemic stroke in the early stages was developed in the study of Chin et al. [17] using convolutional neural networks (CNN). The system processed CT images of the brain by removing regions that were not related to the stroke area, then selected patch images and increased them using data augmentation methods. CNN was chosen because of its proven ability to recognise ischemic stroke, and it was trained and tested on 256 patched images. They showed that their model achieved an accuracy of 90%.
In Korea, Cheon et al. [18] used principal component analysis (PCA) to extract pertinent features and employed deep neural networks (DNN) as their classification algorithm. They used medical service utilisation and health behaviour data (which consists of 15,099 observations). They showed that their approach achieved an area under the curve (AUC) value of 83%. Singh et al. [19] utilised 3,577 acute ischemic stroke patients’ records to develop a stroke severity index with a linear regression model and achieved an accuracy of 95%. Kansadub et al. [20] compared Naïve Bayes (NB), DT, and neural networks (NN). Their result showed that DT achieved the highest accuracy of 75%. However, NN was deemed the most effective approach due to its high false positive rate (FP) and low false negative rate (FN). A predictive model for mortality in stroke patients was developed in [21], using a multilayer perceptron (MLP) with six layers. The authors analysed 584 stroke patient records and used MLP to train six neural networks with different prognostic factors such as sex, age, and hypertension. They employed the receiver operating characteristic curve (ROC) to evaluate the performance of MLP and found that quick propagation was the best algorithm with 80.7% accuracy. The ischemic stroke prediction model was developed by [22]. They compared nine classification methods, including random forest, Generalised Linear Model, and CNN. They used a dataset of 37 multiparametric ischemic stroke patients to compare the accuracy of the nine classification methods and found that random forest and CNN had the highest accuracy. Adam et al. [23] applied DT and KNN to 400 ischemic stroke patient records from different Sudanese hospitals. They showed that DT performed significantly better than KNN.
The effectiveness of long-short-term memory (LSTM) for pattern recognition in the multi-label classification of cerebrovascular (stroke) disease was presented in [24]. They obtained a dataset (326,152 observations) from the Department of Medical Service in Thailand. In their study, they compared back propagation neural networks, recurrent neural networks (RNN), and long-short-term recurrent neural networks (LSTM-RNN). The LSTM-RNN model achieved the highest accuracy of 92.79%, while Back Propagation and RNN achieved accuracy rates of 89.12% and 88.28%, respectively. In summary, many studies have deployed several approaches, including deep learning and hybrid algorithms. The approaches have shown good performances [6,7,8]. However, the majority of studies focused on achieving great performances. We argue that interpretability, generalisation, and robustness are important factors in deploying algorithms in clinical and medical domains. This is because practitioners want adequate knowledge and understanding of the predictors that contribute to the stroke disease prediction model. A model that performs well yet can be easily interpreted is considered. Based on this background, our literature review findings suggest three ML algorithms: logistic regression, decision tree, and random forest. In the next section, these algorithms will be discussed further.
3. Methodology
We propose the use of random forest for stroke disease prediction. We performed an experimental comparison of three machine learning algorithms, namely, logistic regression, decision tree, and random forest. We chose the decision tree (DT) as our baseline model. This is because DT has shown great performance in previous studies. Subsequent sections will therefore provide details of the algorithms.
3.1. Machine Learning Algorithms
Machine learning algorithms fall into two main categories: supervised learning and unsupervised learning methods [25]. Supervised learning involves training the model with a subset of the data and testing it on the remaining data to make predictions for new datasets. While unsupervised learning does not require supervision (no labelled dataset is required), For this task, we will focus on supervised machine learning algorithms.
3.2. Logistic Regression
Logistic regression is a technique that builds on the foundation of linear regression. Linear regression is a statistical tool that establishes a relationship between a dependent variable and one or more independent variables . This relationship is represented by an equation in the form of
where is the intercept, are the slopes, are the independent variables, and ε is the error term.
Therefore, the equation for logistic regression, represented as
where is given as:
allows for the measurement of the probability that the dependent variable is independent of the predictor variable , with coefficients , reflecting the influence of . Unlike linear regression, logistic regression accommodates both linear and nonlinear relationships between variables, whether categorical or continuous, and produces binary results. Figure 1 below shows the sigmoid function in logistic regression. The sigmoid shape of its graph can capture linearity, near linearity, and non-linearity.
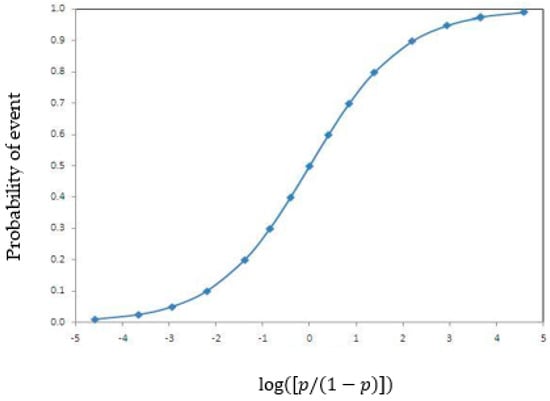
Figure 1.
Logistic regression functions.
3.3. Decision Tree Algorithm
DT is a type of supervised machine learning algorithm that is widely used for analysing multiple variables. It is characterised by its ability to split data into segments or branches. The branches of the decision tree are organised in an upward direction, with the topmost branch representing the outcome. DT has several variants, which include ID3, CART, and CHAID [26]. To obtain DT, Set S is selected as the root node. With each iteration, the unused attributes of S, entropy (H), and Information Gain (IG) are calculated to determine the branches. The Entropy of the set S is given by
where is the sample number of the subset and the attribute value.
The IG is represented by the function Gain(S,A) with respect to the Entropy and is defines as
where the range of attribute A is , and is the subset of set S, equal to the attribute value of attribute v [26]. An illustration of the decision tree algorithm is shown in Figure 2 below.
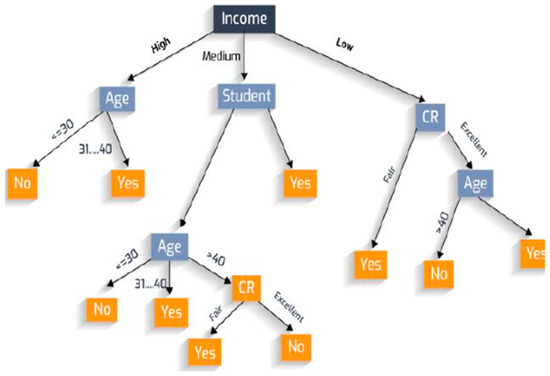
Figure 2.
An illustration of decision tree [26].
3.4. Random Forest
RF is a classification model that integrates multiple tree classifiers. Each tree classifier is created by independently sampling a random vector from the input vector. The classification of an input vector is determined by the collective vote of each tree, selecting the class that receives the highest number of votes [27,28,29,30].
The random forest predictor comprises M randomised regression tree.
Considering the tree in a cluster of trees, the predicted value at every query point x is denoted by , where are the independent random variables and is the training variable [29].
The tree estimate is given by
where is the set of selected data points before tree construction.
is the cell containing x and is the number of points selected before tree construction that fall into . The finite forest estimate as a result of the combination of trees is then represented as
where M can be any size but is limited to computing resources. Figure 3 below provides a representation of the random forest classification, showing the training and classification phases, respectively.
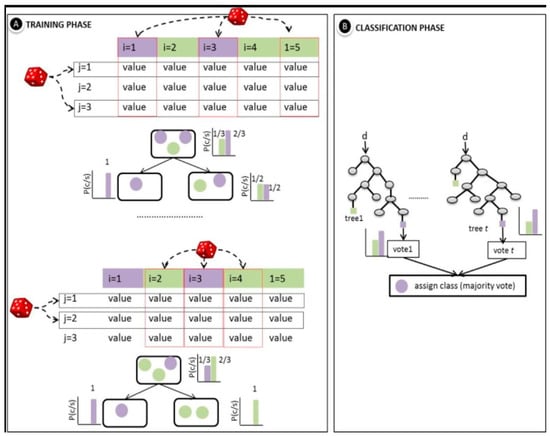
Figure 3.
An illustration of random forest classifier [31].
3.5. Dataset
Our study utilised a dataset obtained from the Kaggle repository consisting of health records collected from various hospitals in Bangladesh by a team of researchers for academic purposes. The data is publicly accessible via https://www.kaggle.com/datasets/fedesoriano/stroke-prediction-dataset (accessed on 15 April 2022). The dataset consists of data from 5110 patients, encompassing ten key attributes that will play a crucial role in the analysis and prediction within this project. These attributes encompass age, sex, hypertension, work type, heart disease, average glucose level, body mass index (BMI), marital status, smoking status, and the occurrence of a previous stroke for each patient. The variables of the dataset and their coding scheme are shown below:
- Sex: This is the sex of the patient: “Male”, “Female” or “Other”.
- Age: age of the patient.
- Hypertension: 0 if the patient doesn’t have hypertension; 1 if the patient has hypertension.
- Heart_Disease: 0 if the patient doesn’t have any heart diseases, 1 if the patient has a heart disease.
- Ever_Married: “No” or “Yes”.
- Work_Type: “children”, “Govt_jov”, “Never_worked”, “Private” or “Self-employed”.
- Residence_Type: “Rural” or “Urban”
- Avg_Glucose_Level: average glucose level in blood
- BMI: body mass index of the patients
- Smoking_Status: The smoking status of the patients: “formerly smoked”, “never smoked”, “smokes” or “Unknown”.
The dataset was pre-processed before training ML algorithms. The wrangled data can be accessed via: https://github.com/fmspecial/Stroke_Prediction/blob/master/Stroke_dataset.csv.
3.6. Evaluation Metrics
To evaluate the prediction results of the random forest model with other models used in this work, such as Logistic regression and DT, different measures such as Accuracy, Precision, Recall, and F1-score were used. The formulas to calculate the values are shown below:
where TP = True positive, TN = True Negative, FP = False Positive, and FN = False Negative [25,32,33].
4. Result
This section presents our results from the exploratory data analysis and the experimental comparison of the classification algorithms.
4.1. Exploratory Data Analysis (EDA)
The data description shows that the proportion of stroke incidence classes is clearly underrepresented, resulting in an imbalance in the dataset, with 95% of the dataset showing no stroke incidence. This can pose a challenge for machine learning algorithms when managing this kind of data [25,34]. As seen in Figure 4 below, a large portion of the “no stroke” data points are not situated near the boundary line.
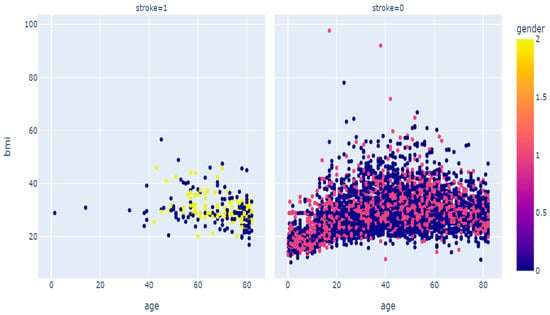
Figure 4.
Scatter diagram of stroke disease.
To address this issue, we oversampled the minority class (i.e., the stroke class). We employed the synthetic minority oversampling technique (SMOTE) for this purpose. SMOTE has been shown to be a reliable rebalancing technique [25,34]. The approach increased the sample size from 5110 to 9722, with the “stroke” class accounting for nearly 50% of the target class. We investigated variables such as age, BMI, and average glucose level for correlation, as shown in Figure 5 below. The correlation matrix reveals a low correlation of 0.17 between average glucose level and BMI. Similarly, age and average glucose level have a slightly low correlation coefficient of 0.24, while age and BMI have the highest correlation coefficient of 0.33. However, the strength-of-association of features is significantly low; hence, it does not impact the prediction, as demonstrated by the correlation matrix.
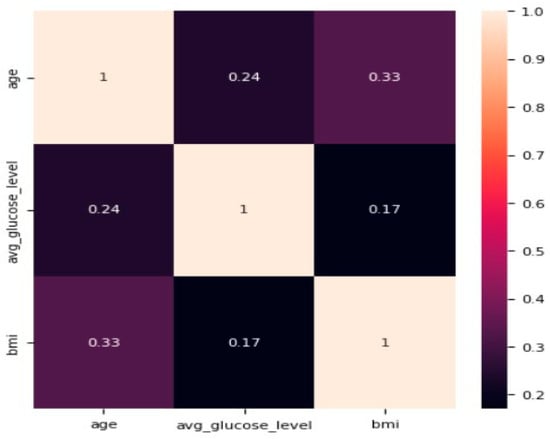
Figure 5.
Correlation matrix for age, average glucose level, and BMI.
The likelihood of stroke disease, based on the 10 attributes used in the study and the results, is discussed in the sections below.
The result from Table 1 shows a slightly higher chance of stroke disease in men compared with women. Patients with hypertension and heart disease also stand a significantly higher chance of stroke compared with patients without the underlying condition.

Table 1.
Stroke disease based on sex and underlying conditions.
From Table 2 above, we deduce that the chance of stroke is significantly higher with the older population, not really affected by BMI values but the chances are highest with BMI > 40. It is significant with the glucose level as it shows a 100% chance with AGL between 270–230.

Table 2.
Likelihood of stroke vs. age and lifestyle.
The results in Table 3 above show that marriage is not significant in predicting stroke; however, married people are at a higher risk. Work type, resident type, and smoking status also have less significance, but having formerly smoked can increase your chances of developing the disease.

Table 3.
Chances of stroke vs. social status.
4.2. Classification Results
We split the dataset into a 70% training set, a 15% testing set, and a 15% validation set. The performance of the models was evaluated based on their ability to accurately identify stroke patients. The false-positive group includes patients who were incorrectly classified as stroke patients, while the false-negative group includes patients who were incorrectly classified as non-stroke patients. The true positive group comprises patients who were accurately identified as stroke patients, while the true negative group encompasses patients who were correctly identified as non-stroke patients. A confusion matrix is typically used to display these four groups and assess the classification accuracy of the different algorithms, with the size of each group compared with the overall dataset. This section will discuss the findings of the research using both the confusion matrix and the ROC curve. In the figures below, the class “true” represents stroke patients, while “false” represents non-stroke patients.
4.2.1. Logistic Regression
Figure 6 below shows the logistic regression classifier was able to correctly identify 692 (47.43%) of the dataset as non-stroke patients and 642 (44%) as stroke patients. The false-positive group only accounted for 2.6% (38) of the dataset, while the false-negative group accounted for 5.96% (87).
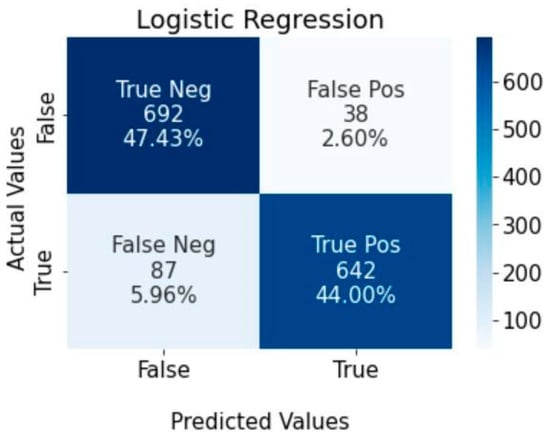
Figure 6.
Confusion matrix for logistic regression algorithm.
4.2.2. Decision Tree
Figure 7 shows the performance of the decision tree classifier in identifying stroke patients. The results show that 44% (642) of the dataset were accurately identified as stroke patients, while 44.83% (654) were identified as non-stroke patients. The false positive group constitutes 5.12% (76), and the false negative group constitutes 5.96%.
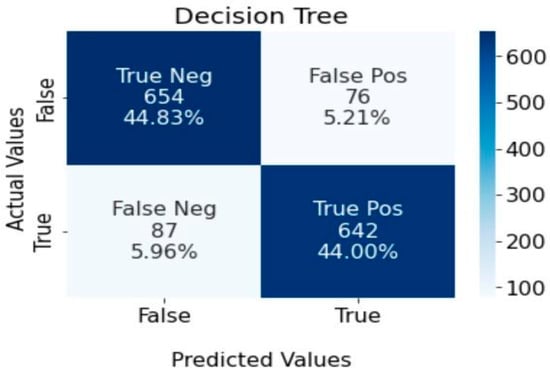
Figure 7.
Confusion matrix for decision tree algorithm.
4.2.3. Random Forest
Figure 8 below indicates that the random forest classifier achieved precise classification results, accurately identifying 46.61% (680) of patients as non-stroke and 47.50% (693) as stroke patients. Nonetheless, there were instances where misclassification occurred, with 3.43% (50) of non-stroke patients and 2.47% (36) of stroke patients being classified incorrectly.
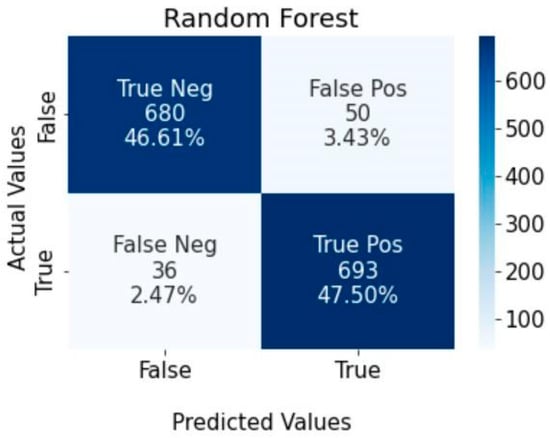
Figure 8.
Confusion matrix for random forest classifier.
4.3. Model Accuracy
The results displayed in Figure 9 below indicate that among the three algorithms, random forest has the highest level of accuracy, followed by logistic regression. It is worth stating that in terms of accuracy, DT showed the lowest performance.
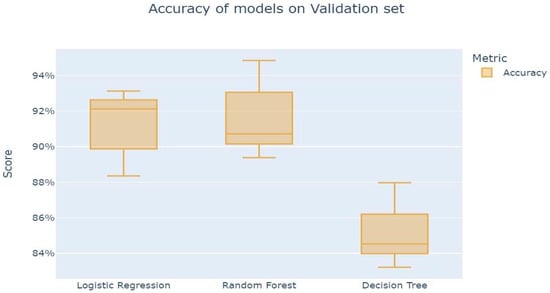
Figure 9.
Accuracy of model on validation set.
4.4. Predictor Importance
We further explore the importance of the predictors in the random forest classifier. From Figure 10 below, we deduce that the importance plot evidences that all variables used in our model are of great importance to having a good prediction model in terms of performance. However, it is worth stating that the plot indicated age and body mass index (BMI) as the two most important predictors in our stroke incidence prediction model.
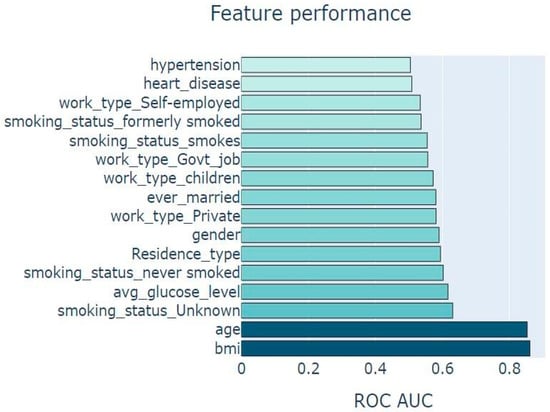
Figure 10.
Chart showing feature importance.
The ROC curves displayed in Figure 11 indicate a smooth plot for all three algorithms, with a sharp increase in the TPR/FPR ratio, which relates to a good predictive outcome. The line of discrimination above the straight line suggests a high level of predictability for all the algorithms, with random forest providing the highest predictive accuracy with a value close to 1(0.979). This is also evidenced in Table 4 below.
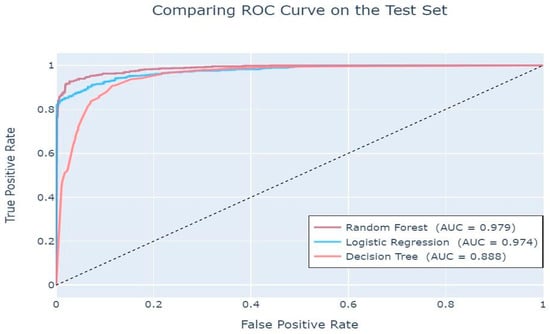
Figure 11.
Area Under Curve (AUC) values.

Table 4.
Evaluation report of the ML algorithms.
These AUC values indicate that all three classifiers have a high probability of distinguishing between negative and positive [32].
4.5. Model Classification Result
As depicted in Table 4 above, the random forest algorithm achieved the highest accuracy of 94.11%, followed by logistic regression with an accuracy rate of 91.43%. On the other hand, decision tree had the lowest accuracy rate of 88.83%. It is noteworthy that while logistic regression exhibited superior precision strength compared with both random forest and decision tree, random forest outperformed both algorithms in terms of recall and sensitivity. Therefore, random forest was ultimately chosen as the most effective machine learning algorithm among the three utilised in this study. Evaluation of the algorithm’s effectiveness revealed that the random forest algorithm surpassed the other two algorithms, attaining an impressive accuracy of 94.11%, compared with decision tree and logistic regression, which had an accuracy of 91.43% and 88.83%, respectively. Most importantly, the F1 score demonstrates a balance between precision and recall. Again, random forest achieved the best macro F1-score of 94%. Thus, our result is consistent with the study [26,28,29,30,31] that showed RF as an off-the-shelf model specifically in the medical domain, where feature importance is significant in terms of interoperability (to patients). Thus, the random forest algorithm was deemed the best predictor for the incidence of stroke.
5. Conclusions
In this paper, we aim to develop a stroke disease prediction model and examine the risk factors for stroke disease. To this end, we compared three ML algorithms (LR, DT, and RF) applied to the Bangladesh health dataset (5110 observations). The dataset used for the analysis was imbalanced, and thus, we used the synthetic minority over-sampling technique (SMOTE) to rebalance the dataset to obtain a result that is generalizable. Our results showed random forest outperformed other models with a macro F1 score of 94%. Furthermore, our findings suggest age and body mass index (BMI) are the leading significant predictors of stroke incidence. Thus, our main contributions can be summarised as follows: We demonstrated the use of random forest (RF) as a SOTA method to predict stroke incidence. We conducted an experimental comparison of interpretable and robust ML algorithms. We provided a comprehensive methodology that is generalizable and robust for stroke disease prediction. In practise, our study is useful to medical practitioners for predicting stroke incidence at an early stage. Also, we demonstrated a workflow that is useful for hospitals to implement as an automated system for early-stage stroke incidence prediction.
In theory, we argued that models that are less complex and precise are beneficial in the medical domain. This is because it provides better results in terms of interpretability. We discussed why techniques that detect the coefficients of predictors are also important in this context. This is because it helps provide background knowledge to improve the predictive power of stroke incidence prediction models. For future work, it is advisable to explore supplementary machine learning algorithms in conjunction with deep learning-based imaging techniques like magnetic resonance imaging (MRI) and computerised tomography (CT) scans. Furthermore, future work can also explore the use of hybrid approaches. For example, the use of XGBoost as an optimised model by assembling learning algorithms such as decision tree and random forest. It is worth stating that our study is limited to Bangladeshi health records. Thus, future work can reproduce our approach and compare it to datasets from different countries.
Author Contributions
Conceptualization, O.Z., O.S. and B.O.; methodology, software, validation, formal analysis, investigation, resources data curation, writing—original draft preparation, writing—review and editing, O.S., O.Z., B.O. and M.O.O.; visualization, supervision, O.S. and B.O.; project administration, B.O., M.O.O. and O.S. All authors have read and agreed to the published version of the manuscript.
Funding
This research received no external funding.
Institutional Review Board Statement
Not applicable.
Informed Consent Statement
Not applicable.
Data Availability Statement
The dataset used in this work is available on Kaggle and GitHub repository https://github.com/fmspecial/Stroke_Prediction/blob/master/Stroke_dataset.csv and the code https://github.com/fmspecial/Stroke_Prediction.
Conflicts of Interest
The authors declare no conflict of interest.
References
- WHO. World Health Organisation. 9 December 2020. Available online: https://www.who.int/news-room/fact-sheets/detail/the-top-10-causes-of-death (accessed on 4 June 2023).
- Mathers, C.D.; Lopez, A.D.; Murray, C.J. The burden of disease and mortality by condition: Data, methods, and results for 2001. In Global Burden of Disease and Risk Factors; Oxford University Press: New York, NY, USA; The World Bank: Washington, DC, USA, 2006; Volume 45. [Google Scholar]
- Rothwell, P.M.; Coull, A.J.; Silver, L.E.; Fairhead, J.F.; Giles, M.F.; Lovelock, C.E.; Redgrave, J.N.E.; Bull, L.M.; Welch, S.J.V.; Cuthbertson, F.C.; et al. Population-based study of event-rate, incidence, case fatality, and mortality for all acute vascular events in all arterial territories (Oxford Vascular Study). Lancet 2005, 366, 1773–1783. [Google Scholar] [CrossRef] [PubMed]
- Roger, V.L.; Go, A.S.; Lloyd-Jones, D.M.; Adams, R.J.; Berry, J.D.; Brown, T.M.; Carnethon, M.R.; Dai, S.; De Simone, G.; Ford, E.S.; et al. Heart disease and stroke statistics—2011 update: A report from the American Heart Association. Circulation 2011, 123, e18–e209. [Google Scholar] [CrossRef] [PubMed]
- Warlow, C.P. Epidemiology of stroke. Lancet 1998, 352, S1–S4. [Google Scholar] [CrossRef]
- Dev, S.; Wang, H.; Nwosu, C.S.; Jain, N.; Veeravalli, B.; John, D. A predictive analytics approach for stroke prediction using machine learning and neural networks. Healthc. Anal. 2022, 2, 100032. [Google Scholar] [CrossRef]
- Elbagoury, B.M.; Vladareanu, L.; Vlădăreanu, V.; Salem, A.B.; Travediu, A.M.; Roushdy, M.I.A. Hybrid Stacked CNN and Residual Feedback GMDH-LSTM Deep Learning Model for Stroke Prediction Applied on Mobile AI Smart Hospital Platform. Sensors 2023, 23, 3500. [Google Scholar] [CrossRef]
- Kaur, M.; Sakhare, S.R.; Wanjale, K.; Akter, F. Early stroke prediction methods for prevention of strokes. Behav. Neurol. 2022, 2022, 7725597. [Google Scholar] [CrossRef] [PubMed]
- Thanka, M.R.; Ram, K.S.; Gandu, S.P.; Edwin, E.B.; Ebenezer, V.; Joy, P. Comparing Resampling Techniques in Stroke Prediction with Machine and Deep Learning. In Proceedings of the 2023 International Conference on Sustainable Computing and Smart Systems (ICSCSS), Coimbatore, India, 14–16 July 2023; IEEE: Piscataway, NJ, USA, 2023; pp. 1415–1420. [Google Scholar]
- Huang, R.; Liu, J.; Wan, T.K.; Siriwanna, D.; Woo, Y.M.P.; Vodencarevic, A.; Chan, K.H.K. Stroke mortality prediction based on ensemble learning and the combination of structured and textual data. Comput. Biol. Med. 2023, 155, 106176. [Google Scholar] [CrossRef]
- Cao, M.; Yin, D.; Zhong, Y.; Lv, Y.; Lu, L. Detection of geochemical anomalies related to mineralization using the Random Forest model optimized by the Competitive Mechanism and Beetle Antennae Search. J. Geochem. Explor. 2023, 249, 107195. [Google Scholar] [CrossRef]
- Dinh, T.P.; Pham-Quoc, C.; Thinh, T.N.; Do Nguyen, B.K.; Kha, P.C. A flexible and efficient FPGA-based random forest architecture for IoT applications. Internet Things 2023, 22, 100813. [Google Scholar] [CrossRef]
- Koohmishi, M.; Azarhoosh, A.; Naderpour, H. Assessing the key factors affecting the substructure of ballast-less railway track under moving load using a double-beam model and random forest method. Structures 2023, 55, 1388–1405. [Google Scholar] [CrossRef]
- Amini, L.; Azarpazhouh, R.; Farzadfar, M.T.; Mousavi, S.A.; Jazaieri, F.; Khorvash, F.; Norouzi, R.; Toghianfar, N. Prediction and control of stroke by data mining. Int. J. Prev. Med. 2013, 4 (Suppl. S2), S245. [Google Scholar]
- Govindarajan, P.; Soundarapandian, R.K.; Gandomi, A.H.; Patan, R.; Jayaraman, P.; Manikandan, R. Classification of stroke disease using machine learning algorithms. Neural Comput. Appl. 2020, 32, 817–828. [Google Scholar] [CrossRef]
- Zhang, S.; Li, X.; Zong, M.; Zhu, X.; Cheng, D. Learning k for knn classification. ACM Trans. Intell. Syst. Technol. 2017, 8, 1–19. [Google Scholar] [CrossRef]
- Chin, C.L.; Lin, B.J.; Wu, G.R.; Weng, T.C.; Yang, C.S.; Su, R.C.; Pan, Y.J. An automated early ischemic stroke detection system using CNN deep learning algorithm. In Proceedings of the 2017 IEEE 8th International Conference on Awareness Science and Technology (iCAST), Taichung, Taiwan, 8–10 November 2017. [Google Scholar]
- Cheon, S.; Kim, J.; Lim, J. The use of deep learning to predict stroke patient mortality. Int. J. Environ. Res. Public Health 2019, 16, 1876. [Google Scholar] [CrossRef]
- Singh, M.S.; Choudhary, P.; Thongam, K. A comparative analysis for various stroke prediction techniques. In Proceedings of the Computer Vision and Image Processing: 4th International Conference, CVIP 2019, Jaipur, India, 27–29 September 2019; Revised Selected Papers, Part II. 2020. [Google Scholar]
- Kansadub, T.; Thammaboosadee, S.; Kiattisin, S.; Jalayondeja, C. Stroke risk prediction model based on demographic data. In Proceedings of the 2015 IEEE 8th Biomedical Engineering International Conference (BMEiCON), Pattaya, Thailand, 25–27 November 2015. [Google Scholar]
- Süt, N.; Çelik, Y. Prediction of mortality in stroke patients using multilayer perceptron neural networks. Turk. J. Med. Sci. 2012, 42, 886–893. [Google Scholar] [CrossRef]
- Maier, O.; Schröder, C.; Forkert, N.D.; Martinetz, T.; Handels, H. Classifiers for ischemic stroke lesion segmentation: A comparison study. PLoS ONE 2015, 10, e0145118. [Google Scholar] [CrossRef] [PubMed]
- Adam, S.Y.; Yousif, A.; Bashir, M.B. Classification of ischemic stroke using machine learning algorithms. Int. J. Comput. Appl. 2016, 149, 26–31. [Google Scholar]
- Chantamit-O.-Pas, P.; Goyal, M. Long short-term memory recurrent neural network for stroke prediction. In Proceedings of the Machine Learning and Data Mining in Pattern Recognition: 14th International Conference, MLDM 2018, New York, NY, USA, 15–19 July 2018; Proceedings, Part I. 2018. [Google Scholar]
- Ogunleye, B.O. Statistical Learning Approaches to Sentiment Analysis in the Nigerian Banking Context. Ph.D. Thesis, Sheffield Hallam University, Sheffield, UK, 2021. [Google Scholar]
- Charbuty, B.; Abdulazeez, A. Classification based on decision tree algorithm for machine learning. J. Appl. Sci. Technol. Trends 2021, 2, 20–28. [Google Scholar] [CrossRef]
- Akbar, W.; Wu, W.P.; Faheem, M.; Saleem, S.; Javed, A.; Saleem, M.A. Predictive analytics model based on multiclass classification for asthma severity by using random forest algorithm. In Proceedings of the 2020 International Conference on Electrical, Communication, and Computer Engineering (ICECCE), Istanbul, Turkey, 12–13 June 2020. [Google Scholar]
- Biau, G.; Scornet, E. A random forest guided tour. TEST 2016, 25, 197–227. [Google Scholar] [CrossRef]
- Sarica, A.; Cerasa, A.; Quattrone, A. Random Forest Algorithm for the Classification of Neuroimaging Data in Alzheimer’s Disease: A Systematic Review. Front. Aging Neurosci. 2017, 9, 329. [Google Scholar] [CrossRef]
- Shanthakumari, R.; Nalini, C.; Vinothkumar, S.; Roopadevi, E.M.; Govindaraj, B. Multi Disease Prediction System using Random Forest Algorithm in Healthcare System. In Proceedings of the 2022 International Mobile and Embedded Technology Conference (MECON), Noida, India, 10–11 March 2022; IEEE: Piscataway, NJ, USA, 2022; pp. 242–247. [Google Scholar]
- Belgiu, M.; Drăguţ, L. Random Forest in remote sensing: A review of applications and future directions. ISPRS J. Photogramm. Remote Sens. 2016, 114, 24–31. [Google Scholar] [CrossRef]
- Shobayo, O.; Saatchi, R.; Ramlakhan, S. Infrared thermal imaging and artificial neural networks to screen for wrist fractures in pediatrics. Technologies 2022, 10, 119. [Google Scholar] [CrossRef]
- Odusami, M.; Maskeliūnas, R.; Damaševičius, R.; Krilavičius, T. Analysis of features of alzheimer’s disease: Detection of early stage from functional brain changes in magnetic resonance images using a finetuned ResNet18 network. Diagnostics 2021, 11, 1071. [Google Scholar] [CrossRef] [PubMed]
- Chawla, N.V.; Bowyer, K.W.; Hall, L.O.; Kegelmeyer, W.P. SMOTE: Synthetic minority over-sampling technique. J. Artif. Intell. Res. 2002, 16, 321–357. [Google Scholar] [CrossRef]
Disclaimer/Publisher’s Note: The statements, opinions and data contained in all publications are solely those of the individual author(s) and contributor(s) and not of MDPI and/or the editor(s). MDPI and/or the editor(s) disclaim responsibility for any injury to people or property resulting from any ideas, methods, instructions or products referred to in the content. |
© 2023 by the authors. Licensee MDPI, Basel, Switzerland. This article is an open access article distributed under the terms and conditions of the Creative Commons Attribution (CC BY) license (https://creativecommons.org/licenses/by/4.0/).
