Article

DARE-SAFE: Denominator-Adjusted Rate Estimates of Substance Adverse Events Frequency Evaluation in Pharmaceuticals and Vaccines

1
Independent Medical Alliance, Washington, DC 20036, USA
2
Open Source Medicine Foundation OÜ, 13517 Tallinn, Estonia
*
Author to whom correspondence should be addressed.
Pharmacoepidemiology 2025, 4(2), 7; https://doi.org/10.3390/pharma4020007
Submission received: 3 February 2025 / Revised: 15 March 2025 / Accepted: 19 March 2025 / Published: 26 March 2025

Abstract

:
Background/Objectives: Controversy exists over the use of passive reporting systems, especially the Vaccine Adverse Event Reporting System, in risk assessment. One limitation of these systems is that adverse event (AE) reporting rates cannot be calculated without knowing the number of shots administered or prescriptions in the case of pharmaceuticals. Adverse event reporting rates can be a factor in a risk assessment, though they should not be solely relied on; they can be used to compare the relative safety profiles of different vaccine products or pharmaceuticals. This study introduces the Denominator-Adjusted Rate Estimates of Substance Adverse Events Frequency Evaluation (DARE-SAFE) method to analyze pharmacovigilance reporting rates for vaccines and common pharmaceuticals. Methods: We calculated reporting rates for the top 250 most prescribed drugs in the US Food and Drug Association (FDA) Adverse Event Reporting System and common vaccines in the Vaccine Adverse Events Reporting System. For vaccines, we used USA Centers for Disease Control (CDC) dose data and OpenVAERS reports. For pharmaceuticals, we utilized prescription data from ClinCalc and FAERS reports for 2022. Results: VAERS reporting rates varied significantly across vaccine types. COVID-19 vaccines showed a 63.0 ± 0.6 times higher rate of VAERS deaths per dose and an 18.95 ± 0.02 times higher rate of total adverse event reports per dose compared to influenza vaccines. The ratio of total VAERS reports to deaths for vaccines was 73 ± 4 to 1 (R2 = 0.94). For pharmaceuticals, the ratio of total adverse event reports to deaths was 26 ± 2 (R2 = 0.46), with a strong correlation between serious adverse events and deaths (ratio 9.1 ± 0.3, R2 = 0.79). Conclusions: DARE-SAFE provides a standardized method for comparing reporting rates across different medical products. The observed differences between vaccines and pharmaceuticals, as well as among different vaccine types, warrant further investigation into reporting practices, actual safety profiles, and potential biases in surveillance systems.

1. Introduction

Post-marketing surveillance utilizing passive reporting carries the caveat that, lacking knowledge on the number of people administered a drug, raw numbers of reports do not reflect actual safety risk. We aim to calculate the reporting rates for the top 250 most prescribed drugs in the US Food and Drug Association’s Adverse Event Reporting System (FAERS), as well as common vaccines in the Vaccine Adverse Events Reporting System (VAERS). While we acknowledge that reporting rates and incidence rates are two different quantities, we believe these data may be valuable as a resource in pharmacovigilance to identify changing trends in reported drug and Vaccine Adverse Events (AEs), while remaining agnostic to the source of the trend, be it in reporting behavior or actual risk.
The use of pharmacovigilance systems has come with caveats to the use of said systems; one is unable to assign causality or to determine rates of AEs from reporting frequencies. The use of any dataset comes with caveats, and VAERS is no different, requiring care in analysis and reporting. While we cannot calculate incidence rates from VAERS reports, it is possible to calculate the reporting rates, given a suitable denominator (number of doses). We make this clarification at the outset. AEs are typically underreported, where more serious and temporally associated events are more likely to be reported, and minor events with a less salient association with vaccination tend to be more underreported (less likely to be reported) [1].
Pharmacovigilance is crucial for monitoring the safety of drugs and vaccines post-marketing. However, passive reporting systems like VAERS and FAERS face limitations, including underreporting and inconsistent reporting practices. Understanding these reporting rates is vital for assessing the relative safety of different medical products.

1.1. The Problem of Inferring Rates in the Vaccine Adverse Event Reporting System

Pharmaceutical drugs are commonly understood to have side effects associated with them. These side effects are measured against their benefits to determine if it is in the patient’s best interest to take a prescription for a drug. By comparison, vaccines are understood to have side effects, ranging from site pain and cold and flu symptoms to severe impairments and death [2], yet outside of special cases of allergy to a component, are almost unanimously determined by medical professionals to be in the patient’s best interest.
Promotion by physicians is encouraged by public health agencies and quality of care programs of medical organizations or insurance providers. This may include financial incentives based on how many people get vaccinated [3,4].
While vaccines can lower the incidence and severity of infectious diseases [5], they may not be appropriate in every case [6]. For a proper comparison of utility with downsides, it is important to quantify levels of risk to compare with benefits [7]. Fear of adverse effects is a prominent reason for vaccine hesitancy [8], and vaccine-hesitant people tend to not be swayed by messaging they perceive as dismissive of safety concerns [9]. Polls of parents show a higher degree of skepticism towards COVID-19 vaccines than other vaccines, such as Measles, Mumps, and Rubella (MMR), commonly used in the childhood vaccination schedule [10]. A comparison of safety profiles may help researchers to address vaccine hesitancy.
It is commonly said that VAERS cannot be used to infer AE rates. While this is technically true, it can provide a helpful estimation. If the number of doses is known, then it is possible to provide the reporting rate per a constant number of doses. This should be considered only a proxy measurement for risk and not an absolute measure, as it does not account for the reporting rate, which may differ between vaccines due to increased salience of pharmacovigilance reporting.
Many factors influence the reporting rate of VAERS reports, though it is widely accepted to be underreported, with reporting rates differing by condition, severity, and salience of the connection with vaccination. While caveats need to be accounted for, this does not mean that VAERS reports per dose is a useless measure, as is often implied. It may be informative of the relative safety of vaccines and should importantly be corroborated by active surveillance tools. In principle, researchers are allowed to access active surveillance data; but in practice, requests can be declined by the agencies acting as custodians for the data.
Some AE rates for vaccines are reported, though our literature search has not revealed data on VAERS reports per dose for major vaccines as a resource. We include these data as a means of comparison of relative reporting rates between vaccines.
If there is a large difference in VAERS reporting rates per dose between vaccines that does not correspond with an actual increased risk of AEs for a given vaccine, it becomes informative to study the factors resulting in the discrepancy. As vaccine AE underreporting is a significant challenge, studying the factors behind greater reporting (as long as reports are truthful) can help pharmacovigilance efforts for current and future vaccines. In the case where differential reporting rates correspond to discrepancies in actual risk, it is important to study the factors driving the increased risk, as this may improve the safety of the vaccination program as a whole. Currently, a lack of standardized methods for comparing reporting rates between different vaccines hampers regulators’ ability to assess and compare safety profiles of vaccines, which DARE-SAFE aims to enable.

1.2. Pharmacovigilance Reporting for Pharmaceutical Drugs

It is less controversial that pharmaceutical drugs have side effects and potential AEs associated with them. However, awareness of pharmacovigilance programs is limited, and AEs are underreported for drugs as well as vaccines [11]. In the below analysis, we reported the crude rates of drug-associated AEs per prescription. We wish to emphasize that the dataset for VAERS reporting rates is different from the dataset we provide for pharmaceutical adverse event reporting rates, and we provide these by prescription, instead of per dose, as is the case for vaccine AEs, i.e., the rates are not directly comparable.
Establishing the VAERS and FAERS reporting rates for vaccines and pharmaceuticals is useful for performing a risk assessment when recommending vaccines or drugs. This may also enable estimations of healthcare usage associated with drugs and pharmaceuticals. This also serves as a potential benchmark for risk prediction using in silico [12], in vitro [13], or in vivo assays [14] for drug toxicity. Successful pharmacovigilance uses many methodologies and synthesizes insights from computational or systems biology prediction of toxic effects, with cell and animal models and lastly clinical and post-surveillance data in humans. DARE-SAFE provides risk estimation from existing pharmacovigilance data, enabling comparisons between the reporting rates of various drugs, which the FAERS dashboard by itself does not provide.

2. Results

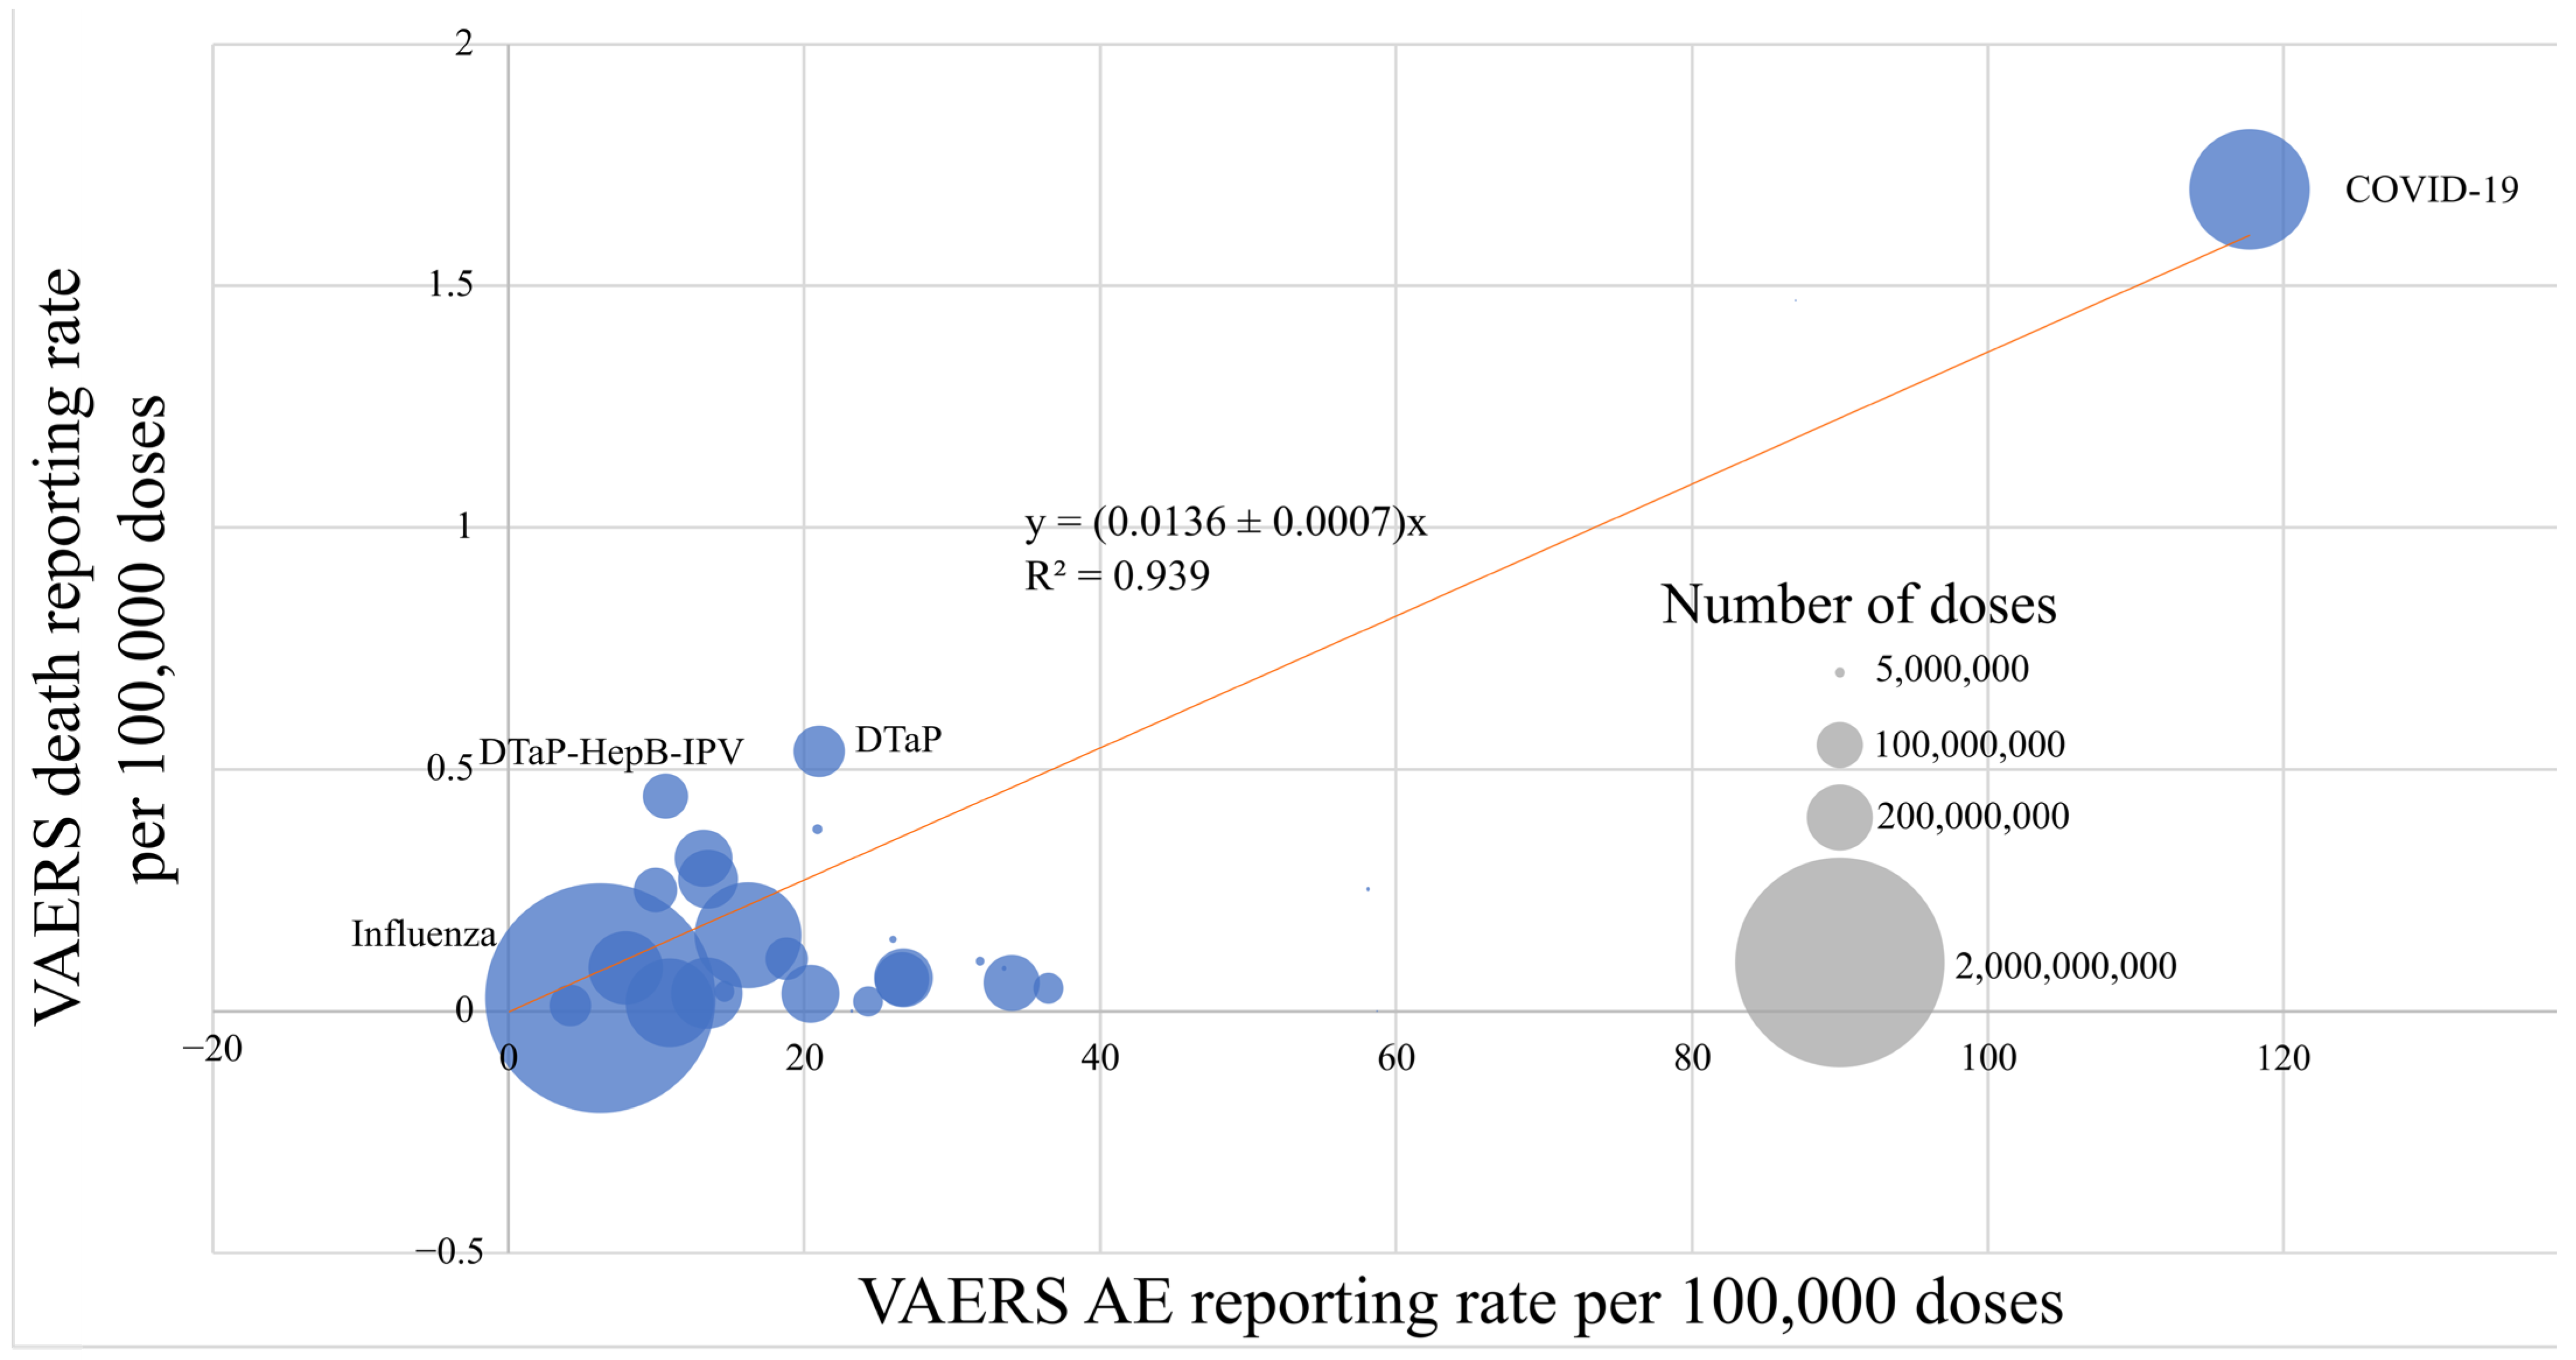
2.1. VAERS Reporting Rates by Vaccine Type

Calculating the VAERS reporting rate per dose produces significant variation in the reporting rates for AEs across vaccine type. Given the possible variation in AE rates, especially for common and non-serious events like site pain and cold/flu symptoms, we examine deaths, finding significant variation per dose as well, with COVID-19 vaccines being considerably more dangerous than other commonly administered vaccines, such as influenza [15].
For COVID-19 vaccines, we observe a 63.0 ± 0.6 times higher rate of VAERS deaths per dose than influenza (Table 1). For total AEs, COVID-19 vaccines have a rate of VAERS reports 18.95 times the influenza rate, consistent with other reported results [15]. These findings suggest differences in vaccine safety and/or reporting practices between the two vaccines.
Using a fixed intercept model and weighting by the number of doses of a given vaccine, the ratio of total reports to deaths is 73 ± 4 (R2 = 0.94) (Figure 1, Table S1).

2.2. VAERS Reporting Rates by COVID-19 Vaccine Manufacturer

Reporting rates for AEs and deaths differ slightly between manufacturers of COVID-19 vaccines (Table 2). While Johnson & Johnson has the highest reporting rate for death, the magnitude of this difference is less when accounting for the Johnson & Johnson vaccine being a single shot compared to the two shots required for Pfizer or Moderna.

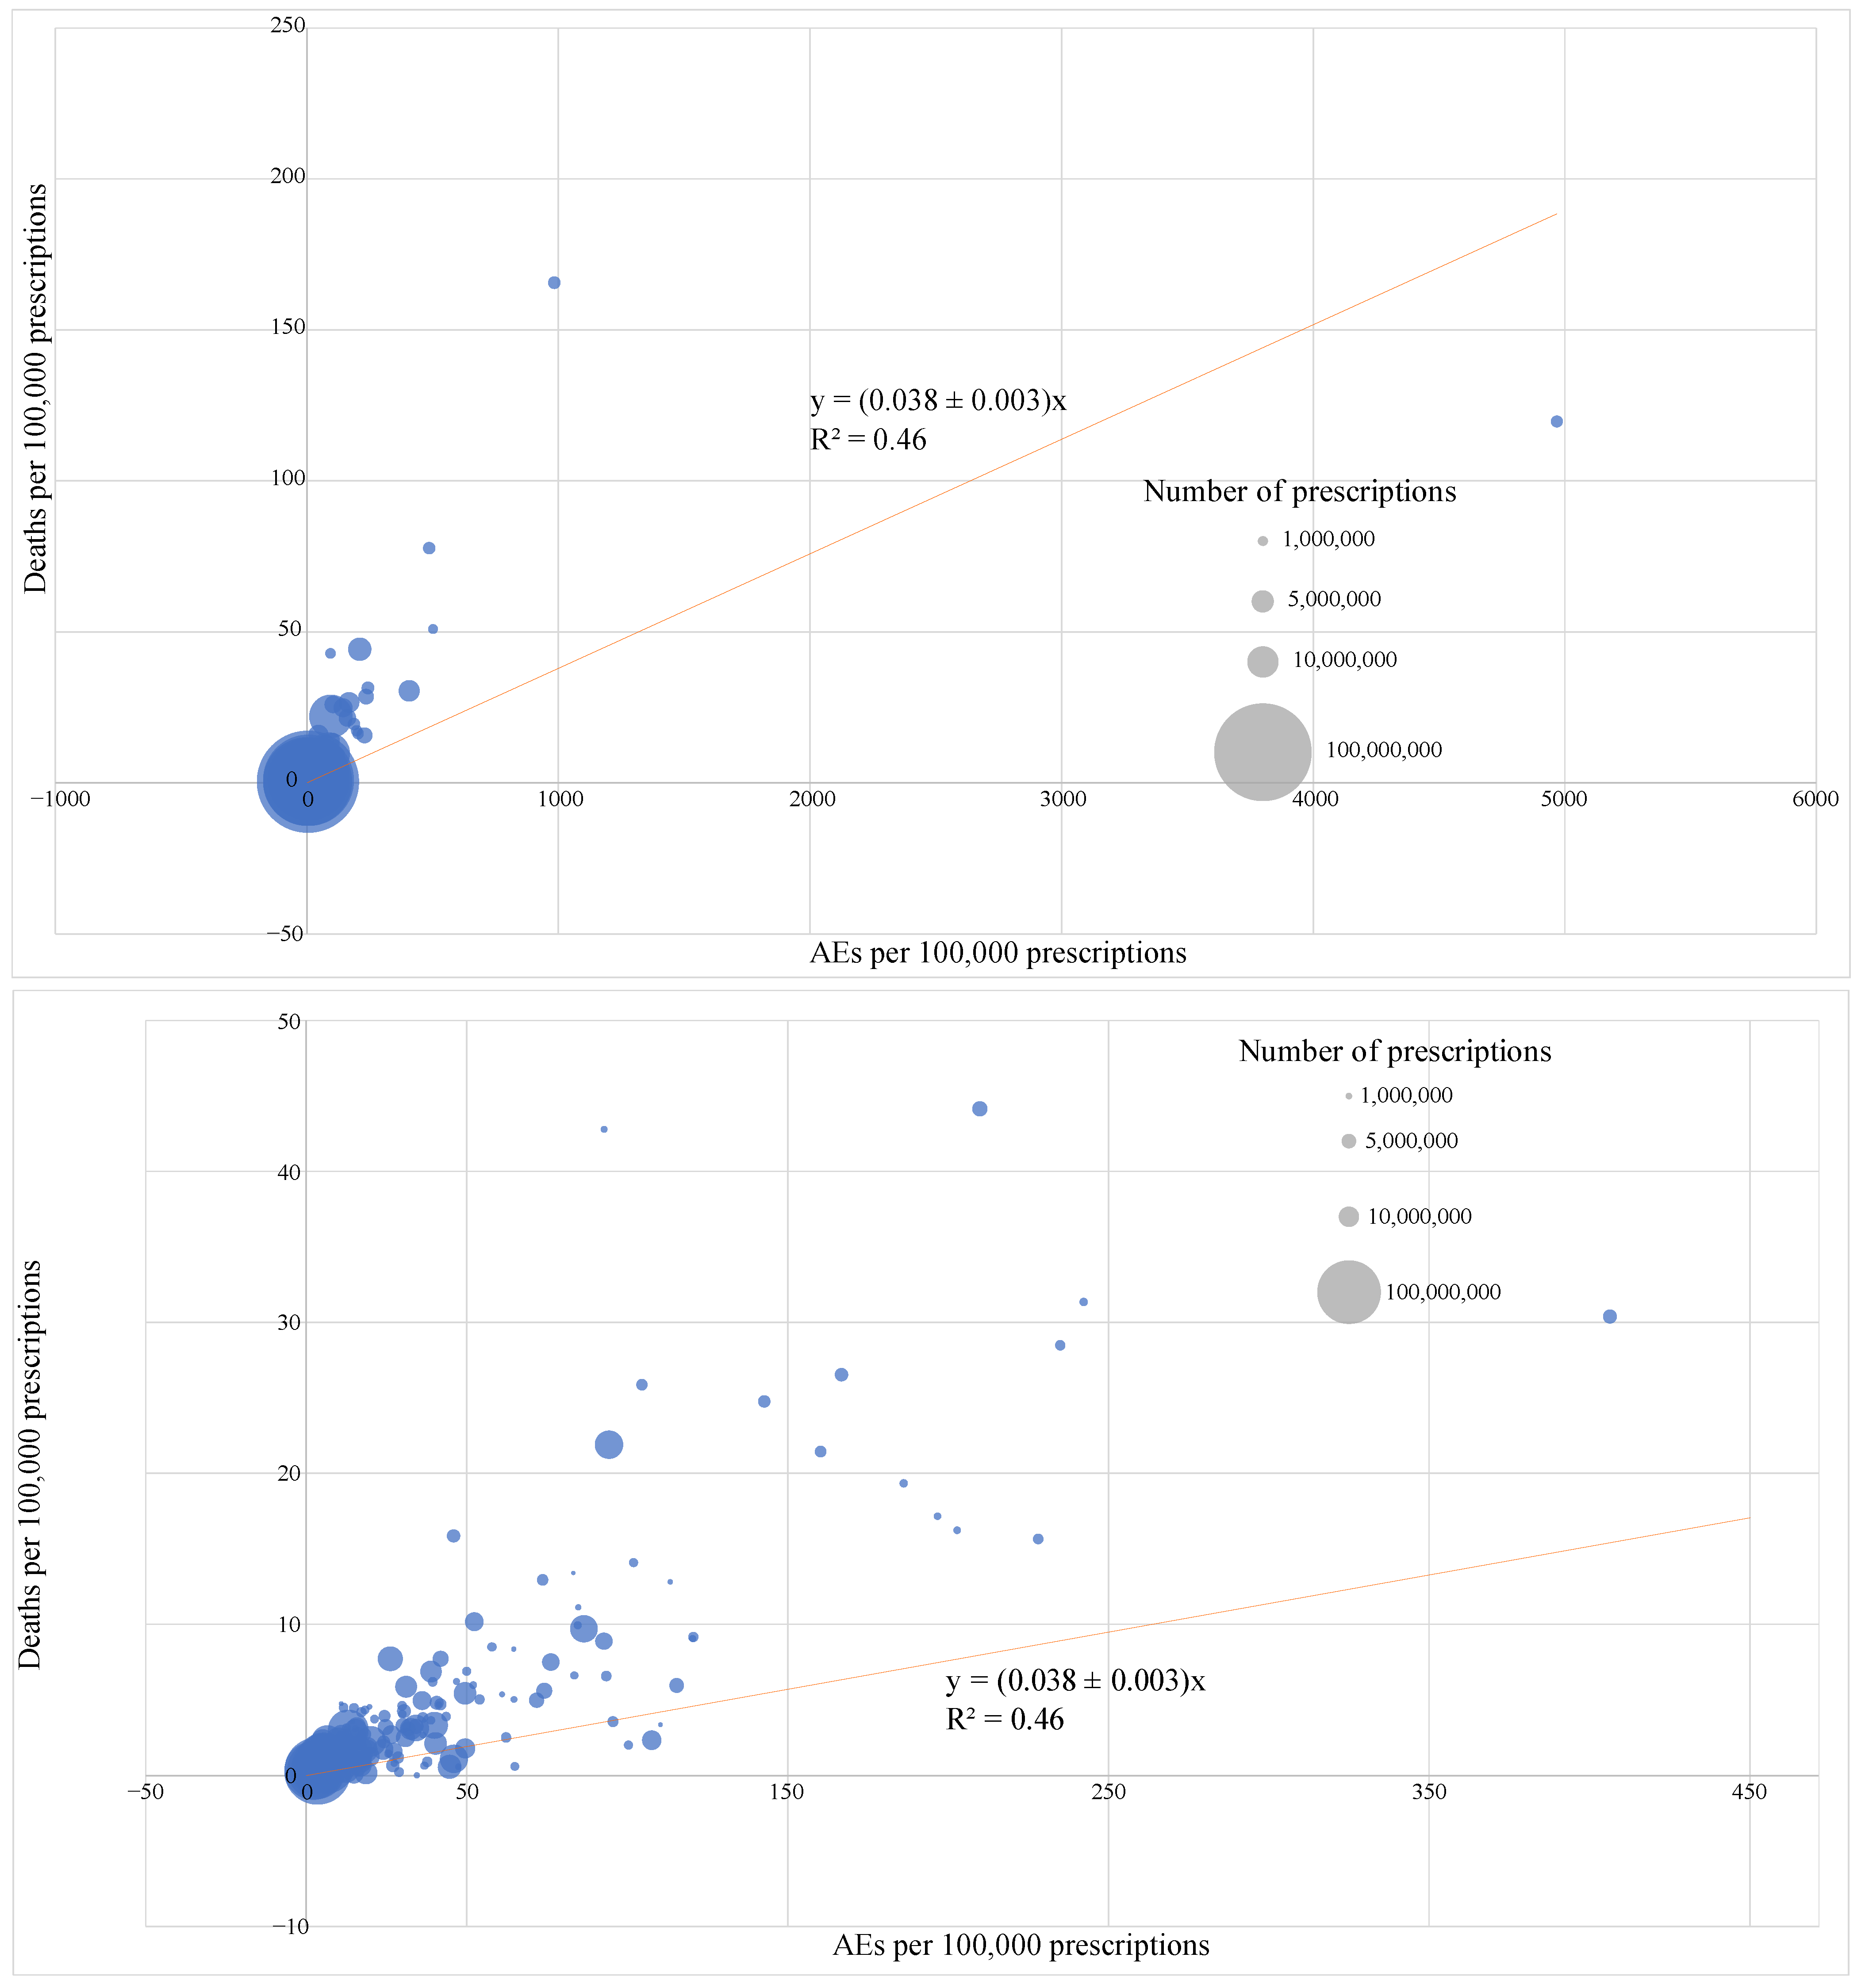
2.3. FAERS Reporting Rates for 250 Most Prescribed Pharmaceuticals in 2022

For the sake of brevity, we have included only the top 10 most prescribed medications in 2022 in Table 3. The full dataset is available in Table S2.
We observe a strong correlation between the reporting rates of AEs and the reporting rates for deaths. Using a fixed intercept model and weighting by the number of prescriptions given, the ratio of AE reports to deaths is 26 ± 2 (R2 = 0.46) (Figure 2, Table S3). Using a fixed intercept model and weighting by the number of prescriptions, the ratio of serious AE reports to deaths is 9.1 ± 0.3 (R2 = 0.79) (Table S4). and the ratio of AEs to SAEs is 2.43 ± 0.07 (R2 = 0.82) (Table S5).

3. Discussion

DARE-SAFE analysis provides a comprehensive examination of AE reporting rates for both vaccines and pharmaceuticals, offering valuable insights into pharmacovigilance data. This study calculates reporting rates for the top 250 most prescribed drugs in FAERS and common vaccines in VAERS.
A key finding of the analysis is the significant variation in VAERS reporting rates across different vaccine types. Notably, COVID-19 vaccines showed considerably higher reporting rates compared to other commonly administered vaccines, such as influenza. The study found that COVID-19 vaccines had a 63.0 ± 0.6 times higher rate of VAERS deaths per dose than influenza vaccines and an 18.95 ± 0.02 times higher rate of total AE reports.
The analysis also revealed a consistent ratio of approximately 70:1 for total VAERS reports to deaths for vaccines. This ratio was determined using a fixed intercept model weighted by the number of VAERS reports, with an R2 value of 0.966, indicating a strong correlation.
For pharmaceuticals, the study examined the FDA Adverse Event Reporting System (FAERS) data for the year 2022. The analysis found a lower ratio of about 43:1 for total AE reports to deaths, compared to the 70:1 ratio observed in vaccines. Additionally, a strong correlation was observed between serious AEs and deaths in pharmaceutical reporting, with a ratio of 9.1 ± 0.3 to 1.
Drug safety requires a multifaceted approach, including passive and active pharmacovigilance, as well as understanding of the drug’s effects. Understanding of a drug’s or vaccine’s effects need not be restricted to mere clinical observation but can include more detailed Omics technologies by monitoring biological parameters including gene expression [22] and drug kinetics and biodistribution [23,24].
These findings underscore the importance of context when interpreting pharmacovigilance data. While DARE-SAFE provides a standardized method for comparing reporting rates, it is crucial to remember that these rates do not directly equate to incidence or causality. The observed differences between vaccines and pharmaceuticals, as well as among different vaccine types, warrant further investigation into reporting practices, actual safety profiles, and potential biases in surveillance systems.
Any passive pharmacovigilance system carries with it the caveat that many of the reports are not verified, and reports cannot be verified as reports are anonymous. Ideally, an analysis would include active surveillance data; active surveillance data, such as with the Vaccine Safety Datalink (VSD), has several advantages, as it follows a group of people for a period of time following vaccination, the amount of doses administered and patients is well known, and rates of AEs can be calculated. However, access to VSD data is limited for scientists outside the CDC and VSD network. However, the VSD only allows the public to access datasets from already published studies, published within the last ten years, and does not provide raw data [25]. Additionally, they provide links to only two published datasets available to the public [26,27], which are both published more than ten years ago (in 2007 and in 2010), meaning that their datasets are inaccessible to the public.

4. Methods

4.1. VAERS Reporting Rates by Vaccine Type

Using numbers of doses in US Centers for Disease Control (CDC) data, we searched the number of VAERS reports for a given vaccine type using the resource OpenVAERS.com, which aggregates reports and provides the numbers of reports for given search terms. Additional filters can filter for deaths. We reported both the total number of reports and the deaths for a given vaccine type for the time period specified by the CDC data, ranging from 1 January 2022 to 31 December 2022, available at [18], accessed 9 January 2025.
We calculated the ratio of reports to deaths by using a linear regression of the relationship between VAERS reports and VAERS deaths. We assume a proportional relationship between the two and choose a fixed intercept (y = 0) model to fit the relationship between total reports and deaths. This is a reasonable assumption, as for a sufficiently large sample size, there will be many nonserious AEs, fewer serious AEs, and yet fewer deaths. Fits are made using the LINEST function in Microsoft® Excel® for Microsoft 365 MSO (Version 2408 Build 16.0.17928.20336) 64-bit.
The advantage of the fixed intercept model is that the slope can be converted to the ratio of AEs to deaths, which may serve as a rough quantification of reporting behavior within a pharmacovigilance database.

4.2. VAERS Reporting Rate by COVID-19 Vaccine Manufacturer

We delineated the VAERS reporting rates by COVID-19 vaccine manufacturer, using numbers of doses (up to 31 December 2022) from reference [19] and VAERS reports using the OpenVAERS [16] feature to filter by vaccine manufacturer for reports up to and including 2022.

4.3. FAERS Reporting Rates by Drug

Data on the number of prescriptions for a given drug per year were obtained through the website https://clincalc.com [20], accessed 9 January 2025. The number of FAERS reports for the year 2022 is found for that same year using the FDA database, available at reference [21], accessed 9 January 2025. FAERS reports are also delineated by serious AEs and deaths.

5. Conclusions

This work presents Denominator-Adjusted Rate Estimates of Substance Adverse Events Frequency Evaluation (DARE-SAFE) for pharmaceuticals and vaccines, which provides values for the pharmacovigilance reporting rates for vaccines and common pharmaceuticals. This resource can be used for risk assessment in prescribing pharmaceuticals or vaccines to individuals and for assessing the expected level of healthcare usage for a given level of medication use.
We calculated a ratio of 73 ± 4 AE reports per death report in VAERS (i.e., for vaccines) and a ratio of AE reports to death reports of 26 ± 2 in FAERS for pharmaceutical drugs. This study also observes significant variation between the reporting rates of 4.18 AEs and 0.0113 deaths per 100,000 doses for the Td vaccine and 118 AEs and 1.70 deaths per 100,000 doses for COVID-19 vaccines (Table 1). COVID-19 vaccines therefore have a 28x elevated rate of AEs and a 150× elevated rate of deaths per shot compared to Td vaccines.
Some variation exists in the VAERS reporting frequency between manufacturers of COVID-19 vaccines, with the AE reporting rate varying between 101 AE reports per 100,000 doses for Pfizer to 901 AE reports per 100,000 doses for NovaVax (Table 2). However, for death reports, NovaVax had no death reports in VAERS, while Johnson & Johnson had the highest rate at 5.77 death reports in VAERS per 100,000 doses. The increased level of AE reports for NovaVax, despite no deaths, could be attributable at least partially to different reporting behaviors. Our survey extends from 1 January 2006 to 31 December 2022, and NovaVax saw very limited use during this time period, representing 0.01% of the total COVID-19 vaccine doses administered in the USA through 31 December 2022, as NovaVax was only approved on 13 July 2022 [28]. One other consideration for the anomalously high rate of VAERS reports for NovaVax is that of the 69,623 doses administered by 31 December 2022 [19] (Table 2), 55,126 (79%) were administered in the context of clinical trials [28], which have more stringent reporting requirements for AEs.
For the most commonly prescribed pharmaceuticals (Table 3 and Table S2), death reporting rates per prescription are correlated (R2 = 0.46) with total AE reporting rates per prescription, with a ratio of 26 ± 2 AEs per death report (Figure 2). Additionally, the ratio of serious AE reports to deaths is 9.1 ± 0.3, and the ratio of AEs to SAEs is 2.43 ± 0.07 (Table S4). As we restricted our analysis to the 250 most prescribed drugs, typically the sample size provided sufficient statistical power.
AE and SAE rates for drugs varied from 0.07 AEs and 0.07 SAEs per 100,000 thyroid prescriptions to 4969 AEs and 1700 SAEs per 100,000 Adalimumab prescriptions, corresponding to relative rates of 71,000 and 24,000 for AEs and SAEs, respectively (Table S2). Thirteen drugs had no deaths associated with them, and five drugs lacked data. The drug with the most death reports was Dexamethasone, with 166 deaths per 100,000 prescriptions.
By publishing the pharmacovigilance reporting rates for common vaccines and pharmaceuticals, this work informs risk assessment, allowing for researchers to better account for AEs when balancing risk and benefit.

Supplementary Materials

The following supporting information can be downloaded at https://www.mdpi.com/article/10.3390/pharma4020007/s1, Table S1. Fitting parameters for a linear, fixed intercept model of VAERS deaths per 100,000 doses vs. VAERS reports per 100,000 doses; Table S2. FAERS reporting rates for 250 most prescribed pharmaceuticals in 2022; Table S3. Fitting parameters for a linear, fixed intercept model of FAERS deaths per 100,000 doses vs. FAERS reports per 100,000 doses; Table S4. Fitting parameters for a linear, fixed intercept model of FAERS deaths per 100,000 doses vs. FAERS SAE reports per 100,000 doses; Table S5. Fitting parameters for a linear, fixed intercept model of FAERS SAEs per 100,000 doses vs. FAERS reports per 100,000 doses.

Author Contributions

M.H. conceptualized the research, performed analysis, and wrote and edited the manuscript. J.V. conceptualized the research and wrote and edited the manuscript. All authors have read and agreed to the published version of the manuscript.

Funding

This research was funded by the Independent Medical Alliance and the Article Processing Charge was funded by the Independent Medical Alliance.

Institutional Review Board Statement

Not applicable.

Informed Consent Statement

Not applicable.

Data Availability Statement

The original contributions presented in this study are included in the article/Supplementary Materials. Further inquiries can be directed to the corresponding author.

Conflicts of Interest

The authors declare no conflicts of interest.

References

  1. García-Abeijon, P.; Costa, C.; Taracido, M.; Herdeiro, M.T.; Torre, C.; Figueiras, A. Factors Associated with Underreporting of Adverse Drug Reactions by Health Care Professionals: A Systematic Review Update. Drug Saf. 2023, 46, 625–636. [Google Scholar] [CrossRef] [PubMed]
  2. Hassan, W.; Kazmi, S.K.; Tahir, M.J.; Ullah, I.; Royan, H.A.; Fahriani, M.; Nainu, F.; Rosa, S.G.V. Global Acceptance and Hesitancy of COVID-19 Vaccination: A Narrative Review. Narra J. 2021, 1, e57. [Google Scholar] [CrossRef] [PubMed]
  3. Staff, N. Strategies to Increase COVID-19 Vaccination Rates in Medicaid Enrollees: Considerations for State Leaders; NASHP: Washington, DC, USA, 2021. [Google Scholar]
  4. Medi-Cal COVID-19 Vaccine Incentive Program Evaluation Report August 29, 2021–March 6, 2022; California Department of Health Care Services: Sacramento, CA, USA, 2024.
  5. Andrews, N.; Tessier, E.; Stowe, J.; Gower, C.; Kirsebom, F.; Simmons, R.; Gallagher, E.; Thelwall, S.; Groves, N.; Dabrera, G.; et al. Duration of Protection against Mild and Severe Disease by COVID-19 Vaccines. N. Engl. J. Med. 2022, 386, 340–350. [Google Scholar] [CrossRef] [PubMed]
  6. Moskalets, O.V.; B, M.O. Validity of medical exemptions from vaccination in persons with allergic disorders. Russ. J. Immunol. 2024, 27, 667–672. [Google Scholar] [CrossRef]
  7. Arlegui, H.; Bollaerts, K.; Salvo, F.; Bauchau, V.; Nachbaur, G.; Bégaud, B.; Praet, N. Benefit–Risk Assessment of Vaccines. Part I: A Systematic Review to Identify and Describe Studies About Quantitative Benefit–Risk Models Applied to Vaccines. Drug Saf. 2020, 43, 1089–1104. [Google Scholar] [CrossRef] [PubMed]
  8. Weinstein, N.; Schwarz, K.; Chan, I.; Kobau, R.; Alexander, R.; Kollar, L.; Rodriguez, L.; Mansergh, G.; Repetski, T.; Gandhi, P.; et al. COVID-19 Vaccine Hesitancy Among US Adults: Safety and Effectiveness Perceptions and Messaging to Increase Vaccine Confidence and Intent to Vaccinate. Public Health Rep. 2024, 139, 102–111. [Google Scholar] [CrossRef] [PubMed]
  9. Decoteau, C.L.; Sweet, P.L. Vaccine Hesitancy and the Accumulation of Distrust. Social. Problems 2024, 71, 1231–1246. [Google Scholar] [CrossRef]
  10. SteelFisher, G.K.; Findling, M.G.; Caporello, H.L.; Stein, R.I. Has COVID-19 Threatened Routine Childhood Vaccination? Insights From US Public Opinion Polls. Health Aff. Forefr. 2023. [Google Scholar] [CrossRef]
  11. Putri, R.A.; Ikawati, Z.; Rahmawati, F.; Yasin, N.M. An Awareness of Pharmacovigilance Among Healthcare Professionals Due to an Underreporting of Adverse Drug Reactions Issue: A Systematic Review of the Current State, Obstacles, and Strategy. Curr. Drug Saf. 2024, 19, 317–331. [Google Scholar] [CrossRef] [PubMed]
  12. Keiser, M.J. In Silico Prediction of Drug Side Effects. In Antitargets and Drug Safety; John Wiley & Sons, Ltd.: Hoboken, NJ, USA, 2015; pp. 19–44. ISBN 978-3-527-67364-3. [Google Scholar]
  13. Skardal, A.; Aleman, J.; Forsythe, S.; Rajan, S.; Murphy, S.; Devarasetty, M.; Pourhabibi Zarandi, N.; Nzou, G.; Wicks, R.; Sadri-Ardekani, H.; et al. Drug Compound Screening in Single and Integrated Multi-Organoid Body-on-a-Chip Systems. Biofabrication 2020, 12, 025017. [Google Scholar] [CrossRef]
  14. Iffland, K.; Grotenhermen, F. An Update on Safety and Side Effects of Cannabidiol: A Review of Clinical Data and Relevant Animal Studies. Cannabis Cannabinoid Res. 2017, 2, 139–154. [Google Scholar] [CrossRef] [PubMed]
  15. Cappelletti-Montano, B.; Demuru, G.; Laconi, E.; Musio, M. A Comparative Analysis on Serious Adverse Events Reported for COVID-19 Vaccines in Adolescents and Young Adults. Front. Public Health 2023, 11, 1145645. [Google Scholar] [CrossRef]
  16. FAQ. Available online: https://openvaers.com/ (accessed on 9 January 2025).
  17. Total COVID-19 Vaccine Doses Administered. Available online: https://ourworldindata.org/grapher/cumulative-covid-vaccinations?country=~USA (accessed on 13 January 2025).
  18. National Vaccine Injury Compensation Program Monthly Statistics Report; Health Resources and Services Administration: Rockville, MD, USA, 2025. Available online: https://www.hrsa.gov/sites/default/files/hrsa/advisory-committees/vaccines/vicp-stats-01-01-25.pdf (accessed on 9 January 2025).
  19. Ritchie, H.; Mathieu, E.; Rodés-Guirao, L.; Appel, C.; Giattino, C.; Ortiz-Ospina, E.; Hasell, J.; Macdonald, B.; Beltekian, D.; Roser, M. Coronavirus Vaccinations. Our World Data 2020. Available online: https://ourworldindata.org/covid-vaccinations (accessed on 9 January 2025).
  20. ClinCalc DrugStats Database. Available online: https://clincalc.com/DrugStats/ (accessed on 9 January 2025).
  21. US Food and Drug Administration. FDA Adverse Event Reporting System (FAERS) Public Dashboard. FDA 2023. Available online: https://www.fda.gov/drugs/fdas-adverse-event-reporting-system-faers/fda-adverse-event-reporting-system-faers-public-dashboard (accessed on 9 January 2025).
  22. Lazar, V.; Zhang, B.; Magidi, S.; Le Tourneau, C.; Raymond, E.; Ducreux, M.; Bresson, C.; Raynaud, J.; Wunder, F.; Onn, A.; et al. A Transcriptomics Approach to Expand Therapeutic Options and Optimize Clinical Trials in Oncology. Ther. Adv. Med. Oncol. 2023, 15, 17588359231156382. [Google Scholar] [CrossRef] [PubMed]
  23. Zulkifli, B.; Fakri, F.; Odigie, J.; Nnabuife, L.; Isitua, C.C.; Chiari, W. Chemometric-Empowered Spectroscopic Techniques in Pharmaceutical Fields: A Bibliometric Analysis and Updated Review. Narra X 2023, 1, 1–16. [Google Scholar] [CrossRef]
  24. Lima, B.S.; Videira, M.A. Toxicology and Biodistribution: The Clinical Value of Animal Biodistribution Studies. Mol. Ther. Methods Clin. Dev. 2018, 8, 183–197. [Google Scholar] [CrossRef]
  25. CDC. Accessing and Using Data from the Vaccine Safety Datalink (VSD). Vaccine Safety Systems. 2024. Available online: https://www.cdc.gov/vaccine-safety-systems/vsd/access-use.html (accessed on 15 March 2025).
  26. Thompson, W.W.; Price, C.; Goodson, B.; Shay, D.K.; Benson, P.; Hinrichsen, V.L.; Lewis, E.; Eriksen, E.; Ray, P.; Vaccine Safety Datalink Team; et al. Early thimerosal exposure and neuropsychological outcomes at 7 to 10 years. N. Engl. J. Med. 2007, 357, 1281–1292. [Google Scholar] [CrossRef] [PubMed]
  27. Price, C.S.; Thompson, W.W.; Goodson, B.; Weintraub, E.S.; Croen, L.A.; Hinrichsen, V.L.; Marcy, M.; Robertson, A.; Eriksen, E.; Lewis, E.; et al. Prenatal and infant exposure to thimerosal from vaccines and immunoglobulins and risk of autism. Pediatrics 2010, 126, 656–664. [Google Scholar] [CrossRef] [PubMed]
  28. Food and Drug Administration. Novavax COVID-19 Vaccine Emergency Use Authorization. 2022. Available online: https://www.fda.gov/media/159902/download (accessed on 2 February 2025).
Figure 1. The relationship between the number of reported AEs to deaths in VAERS. Reporting rates for AEs and deaths for the vaccines in VAERS; bubble size shows the number of doses. The orange line shows the linear fit for the model y = mx, weighted by the number of doses given between 1 January 2006 and 31 December 2022. The fit produces a slope value of 0.0136 ± 0.0007, which corresponds to a ratio of 73 ± 4 AEs per death.
Pharmacoepidemiology 04 00007 g001
Figure 2. Relationship between FAERS reporting rates for AEs and deaths for the top 250 prescribed drugs in the USA. Bubble size represents the number of prescriptions given in 2022. We perform a linear fit to the model y = mx, producing a value for slope of m = 0.038 ± 0.003, consistent with a ratio of AE reports to deaths of 26 ± 2. Top panel. Full range of possible AE rates. Bottom panel, subset focusing solely on drugs with AE rates less than 450 per 100,000.
Pharmacoepidemiology 04 00007 g002
Table 1. Vaccine doses given in the USA and rates of AEs and deaths reported to VAERS. VAERS reports and the number of deaths are taken from reference [16]. * The number of doses for the COVID-19 vaccines is taken from reference [17]. All other values for the number of doses are taken from [18].
Vaccine NameNumber of Doses Distributed (2006–2022)Number of VAERs ReportsVAERS Reporting Rate per 100,000 DosesVAERS DeathsVAERS Deaths Reporting Rate per 100,000 Doses
DT794,77746258.120.252
DTaP122,237,65325,629216560.537
DTaP-Hep B-IPV94,331,585999010.64190.444
DTaP-HiB1,135,47438033.510.0881
DTaP-IPV40,456,384981824.380.0198
DTaP-IPV-HiB89,568,78689069.942240.250
DTaP-IPV-HiB-Hep B2,021,77052626.030.148
DTP0556N/A3N/A
DTP-HiB057N/A2N/A
Hep A+Hep B19,811,507289314.680.0404
Hep B-HiB4,787,457100020.9180.376
Hepatitis A (Hep A)231,034,56530,93013.4850.0368
Hepatitis B (Hep B)248,816,80219,7377.932220.0892
HiB159,451,49321,52613.54350.273
HPV158,878,54142,46426.71090.0686
Influenza2,407,000,000149,5126.216500.0270
IPV85,815,52516,10418.8930.108
Measles135,66011887.021.47
Meningococcal152,565,55331,05020.4540.0354
MMR134,424,33835,74326.6880.0655
MMR-Varicella42,936,44415,66836.5200.0466
Mumps110,7496558.700
OPV0188N/A5N/A
Pneumococcal517,159,90883,53716.28100.157
Rotavirus150,866,65219,89913.24760.316
Rubella422,5489823.200
Td79,443,26333224.1890.0113
Tdap358,134,23739,15310.9590.0165
Tetanus3,838,993122631.940.104
Varicella143,906,02848,86334840.0584
COVID-19663,000,000 *781,075117.711,2881.70
Table 2. AE rates and death rates reported in VAERS by COVID-19 vaccine manufacturers. Dose values are taken from [19], and numbers of VAERS reports are taken from [16].
COVID-19 Vaccine ManufacturerDoses (Cumulative to 31 December 2022 in USA)Number of VAERS ReportsNumber of VAERS Death ReportsVAERS Reporting Rate per 100,000 DosesVAERS Death Reporting Rate per 100,000 Doses
Pfizer/BioNTech395,801,679398,64865301011.65
Moderna248,752,253371,77460561502.43
Johnson & Johnson18,953,65361,26210933235.77
Novavax69,62362709010
Table 3. AE rates and deaths for the ten most commonly prescribed prescription drugs in the USA. Values for the number of prescriptions and patients are from [20] for the year 2022. Numbers of total FAERS reports, serious AEs, and deaths for each medication are taken from FAERS [21]. The full dataset is available in Table S2.
Drug Name Total Prescriptions (2022, Millions) Total Patients (2022, Millions) Total AEs Serious AEs Deaths AEs per 100,000 Prescriptions Serious AEs per 100,000 Prescriptions Deaths per 100,000 Prescriptions AEs per 100,000 Patients Serious AEs per 100,000 Patients Deaths per 100,000 Patients
Atorvastatin 109.583 27.936 383436013053.503.290.2826.423.73.39
Metformin 86.748 19.536 516446316635.955.340.7612.66.831.41
Lisinopril 82.514 20.314 256413872863.111.680.359.697.561.39
Levothyroxine 82.432 18.130 175613702522.131.660.3121.920.74.08
Amlodipine 70.766 17.790 390336827265.525.201.0315.213.52.57
Metoprolol 65.245 15.543 236020964003.623.210.6112.010.80.57
Albuterol 59.075 19.265 230520731093.903.510.199.087.451.19
Losartan 53.556 13.150 11949801572.231.830.2935.131.93.88
Omeprazole 52.133 13.802 484444055369.298.451.0353.242.012.1
Gabapentin 40.141 9.890 52634149119513.110.32.9826.423.73.39
Disclaimer/Publisher’s Note: The statements, opinions and data contained in all publications are solely those of the individual author(s) and contributor(s) and not of MDPI and/or the editor(s). MDPI and/or the editor(s) disclaim responsibility for any injury to people or property resulting from any ideas, methods, instructions or products referred to in the content.

