Article

Impact of Structural Relaxation on Protein–Protein Docking in Large Macromolecular Complexes

by
Raissa Santos de Lima Rosa
1,2,3,
Ana Carolina Silva Bulla
3,
Rafael C. Bernardi
1,2,* and
Manuela Leal da Silva
3,4,*
1
Department of Physics, Auburn University, Auburn, AL 36849, USA
2
Department of Chemistry and Biochemistry, Auburn University, Auburn, AL 36849, USA
3
Programa de Pós-Graduação em Biologia Computacional e Sistemas, Instituto Oswaldo Cruz (FIOCRUZ), Rio de Janeiro 21040-360, RJ, Brazil
4
Instituto de Biodiversidade e Sustentabilidade (NUPEM), Universidade Federal do Rio de Janeiro, Macaé 27965-045, RJ, Brazil
*
Authors to whom correspondence should be addressed.
Appl. Biosci. 2025, 4(4), 48; https://doi.org/10.3390/applbiosci4040048
Submission received: 1 September 2025 / Revised: 3 October 2025 / Accepted: 15 October 2025 / Published: 23 October 2025

Abstract

Protein–protein docking is a cornerstone of computational structural biology, yet its reliability for large, multimeric assemblies remains uncertain. Standard workflows typically include geometry optimization or molecular dynamics equilibration to relieve local strains and improve input quality, but the extent to which these preparatory steps alter docking outcomes has not been systematically evaluated. Here, we address this question using the mitochondrial chaperonin Hsp60, a dynamic double-ring complex essential for protein folding, and MIX, a kinetoplastid-specific protein with unresolved function, as a stress test system. By comparing docking predictions across minimized, equilibrated, and ensemble-refined structures of Hsp60 in three conformational states (apo, ATP-bound, and ATP–Hsp10), we show that structural relaxation profoundly reshapes the docking landscape. Minimization alone often yielded favorable scores but localized binding, while longer MD trajectories exposed alternative sites, including central cavity, equatorial ATP pocket, and apical domain, each consistent with distinct regulatory hypotheses. These findings reveal that docking outcomes are highly sensitive to receptor preparation, especially in complexes undergoing large conformational transitions. More broadly, our study highlights an underappreciated vulnerability of docking pipelines and calls for ensemble-based and dynamics-aware approaches when predicting interactions in large biomolecular machines.

1. Introduction

Protein–protein docking is a widely used computational strategy for predicting biomolecular interactions when experimental structural data are limited or unavailable [1,2,3]. Its accuracy strongly depends on the quality of the input structures, since even small deviations in geometry, steric clashes, or unrealistic bond angles can bias docking poses and scoring [4,5]. To address these issues, a common preparatory step is energy minimization, here defined as a geometry optimization, which relieves steric strain and optimizes side-chain orientations [6,7]. In addition to conventional minimization, real-space refinement methods are increasingly applied to improve structural models, often by integrating experimental data into atomistic representations that preserve stereochemical correctness [8]. Despite their widespread use, the effects of such refinement on docking outcomes, particularly in large multimeric complexes, remain underexplored. In these assemblies, even subtle adjustments of domain arrangements or surface accessibility can alter predicted binding modes and carry both methodological and biological implications [9,10].
Rigid-body docking is particularly sensitive to structural details at the binding interface [11,12]. For large complexes, additional challenges arise from the presence of multiple subunit interfaces, the coexistence of diverse conformational states, and flexibility at scales that exceed the capabilities of many docking algorithms [13,14]. Understanding how minimization influences docking predictions is therefore critical for reliable interpretation, especially when comparing alternative conformations of the same target.
While our study focuses on how different levels of receptor relaxation influence docking predictions, it is distinct from existing ‘dynamics–docking integration’ or ‘ensemble-based docking’ frameworks. For example, strategies such as coarse-grained (CG) molecular dynamics (MD) simulations accelerated by Graphics Processing Units (GPUs) enable efficient modeling of protein–protein interactions in large and complex systems [15,16]. Despite the promising application of this approach in large-scale virtual screening, maintaining atomic-level accuracy can be challenging [17,18].
Classical rigid-body docking programs such as ZDOCK [19], as well as flexible docking platforms like HADDOCK [20] and RosettaDock [21], have proven powerful in cases such as antibody–antigen complexes [22] and enzyme–inhibitor systems [23]. Although flexible docking strategies account for conformational variability by sampling multiple structures from MD trajectories and docking ligands or partners against these ensembles [24,25], the application of all these approaches to very large multimeric complexes remains limited due to computational cost and system size restrictions.
Beyond classical docking workflows, recent advances in macromolecular complex modeling have introduced powerful integrative methods that combine structural prediction with experimental density maps. Examples include ModelAngelo [26], DEMO-EMol, and DEMO-EM2 [27,28], as well as the more recent DiffModeler [29], which leverage cryo-EM data and machine-learning–based refinement to reconstruct highly accurate complex structures. These approaches are particularly valuable when high-resolution density is available to guide model building, allowing for reliable assembly of large complexes. Our study complements these strategies by addressing a different but equally critical problem: cases where no experimental density exists and docking must proceed from modeled structures generated by successful multiple sequence alignment (MSA)-based predictors, such as AlphaFold [30] and DMFold [31], as well as classical homology-based methods like Modeller [32]. Thus, while integrative modeling frameworks aim to exploit experimental data to resolve conformational ambiguity, the present work highlights how structural relaxation alone can influence docking outcomes, providing methodological guidance for systems where experimental data are sparse or absent.
To investigate how standard geometry optimization, MD equilibration, and long MD simulations influence docking outcomes, we chose a large and conformationally complex system in which these problems can be strongly exacerbated. The test system centers on the mitochondrial chaperonin Hsp60, an essential protein folding machine that assembles into a double-ring heptameric complex with a central cavity. Hsp60 is highly dynamic: it alternates between apo, ATP-bound, and ATP–Hsp10 states, each involving large conformational rearrangements of its apical, equatorial, and intermediate domains [33]. These transitions allow Hsp60 to encapsulate unfolded or partially folded polypeptides within its cavity, protect them from aggregation, and promote proper folding through ATP hydrolysis cycles. The scale of these conformational changes, together with the size of the complex itself, makes Hsp60 a prototypical example of a molecular machine that challenges the limits of protein–protein docking methodologies.
MIX, on the other hand, is a kinetoplastid-specific mitochondrial protein whose molecular role remains poorly understood. Previous studies have suggested that MIX interacts with Hsp60 and may play a role in regulating its function [34,35], but the structural basis of this interaction has not been experimentally resolved. Thus, MIX:Hsp60 represents not only a biologically interesting system but also a case where docking can serve as one of the few available approaches to generate structural hypotheses about complex formation.
This system is particularly well-suited for evaluating how structural relaxation steps affect docking predictions for three reasons. First, the MIX:Hsp60 interaction has not been structurally determined, which means that docking predictions cannot be biased by existing structural knowledge and must stand on their own methodological rigor. This uncertainty mirrors many real applications of docking, where predictions must stand on their methodological soundness rather than comparison to experimental complexes. Second, the problem exemplifies the type of biological questions for which docking is commonly used: identifying potential binding partners or interfaces in cases where experimental data are sparse or incomplete. Third, the system is both large and conformationally diverse, with Hsp60 undergoing domain motions of several nanometers during its functional cycle [33]. In such a context, even modest structural relaxation can propagate into significant rearrangements at subunit interfaces, leading to potentially large differences in predicted binding poses.
By focusing on the MIX:Hsp60 complex, our study addresses a critical methodological question: Do docking predictions remain consistent when applied to large, flexible complexes that have been subjected to different levels of structural minimization? It is often suggested that docking predictions may vary significantly depending on whether pre- or post-minimized structures are used as inputs. Yet, ideally, robust docking algorithms should provide consistent results regardless of these preparatory steps. If outcomes diverge, this would highlight an underappreciated vulnerability of docking pipelines, raising important questions about the reliability of these tools in the very systems where they are often most needed. In this way, the MIX:Hsp60 complex offers not only a biologically relevant case but also an opportunity to highlight conditions where protein–protein docking workflows may require closer scrutiny, encouraging further testing rather than assuming results are automatically correct or incorrect.

2. Materials and Methods

Here, we applied a combination of computational biology methods for sequence retrieval, structure prediction, refinement, and docking. An overview of the workflow, including the modeling of MIX and Hsp60 in different conformational states, is summarized in Figure 1.

2.1. Modeling Refinements

To ensure reproducibility and reliability, the amino acid sequences of MIX, Hsp60, and Hsp10 were obtained from TriTrypDB [36], a specialized genomic database for kinetoplastid parasites such as Trypanosoma spp. and Leishmania spp. Structural models were then generated with AlphaFold2 [30] using the ColabFold pipeline [37]. For Hsp60, the monomer was modeled, and for MIX the dimeric form was used. Modeling parameters included 5 relaxation runs (num_relax: 5), no templates (template_mode: none), MMSeq2 for multiple sequence alignment (MSA_mode: MMSeq2 [UniRef+environmental]), and 3 recycling iterations (num_recycle: 3). Final structure relaxation was carried out with the Amber force field (Figure 1a).
The quality of the predicted models was evaluated using AlphaFold’s built-in confidence metrics, namely the Predicted Alignment Error (PAE) and the predicted Local Distance Difference Test (pLDDT) [30,38]. For regions that lacked well-defined secondary or oligomeric structures, additional predictors such as Qwik2D [39] and PsiPred [40] were used to provide further insight into local folding patterns. In the case of MIX, unresolved segments were modeled with AlphaFold2 using the same ColabFold pipeline configuration.
Further refinement was performed using the GalaxyRefine2 server [41] with default parameters. GalaxyRefine optimizes side-chain conformations and performs short MD relaxations. In this line, to ensure the reliability of the modeled structures, a comprehensive validation process was conducted using several structural quality metrics. MolProbity [42] was utilized to assess model quality both globally and locally, using key metrics such as clashscore, which measures steric clashes or close contacts per 1000 atoms in the protein structure. The Ramachandran plot was used in conjunction with MolProbity to evaluate the dihedral angles of amino acid residues and ensure proper backbone geometry [43]. Additionally, the MolProbity score, which incorporates clashscore, side-chain rotamer conformations, and Ramachandran plot evaluation, was considered [44].
The Structure Analysis and Verification Server (SAVES), specifically the Verify 3D module, was employed to assess the compatibility of each protein model with its own amino acid sequence, identifying regions where deviations may occur [45]. Models were considered to pass the Verify 3D assessment when at least 80% of the residues had an averaged 3D-1D score ≥ 0.2. Furthermore, the ERRAT module was used to examine non-bonded atomic interactions [46], with quality being considered acceptable when the overall quality factor was above 50, and high-quality models typically scoring above 80.
To incorporate missing hydrogen atoms, assign Amber charges, and atomic radii to the atoms without introducing salt, the PDB2PQR server [47] was used. Subsequently, APBS [48] calculations were performed using default parameters, considering mitochondrial pH 8 [35,49], to determine surface electrostatic potentials. The electrostatic potential at the surface was visualized in VMD [50] using the pqr files generated, with a color gradient spanning from −5 kT/e (blue) to 0 kT/e (white) to +5 kT/e (red).

2.1.1. Modeling Conformational States

To capture conformational variability inherent to certain protein complexes, comparative modeling was employed, enabling the generation of distinct structural states based on experimentally determined templates. This approach was particularly necessary for Hsp60, which undergoes conformational transitions during its functional cycle.
Modeller v10.5 [51] was used to generate three conformational models of LmjHSP60 based on high-resolution templates: Hsp60apo (PDB ID: 8G7J), Hsp60ATP (PDB ID: 8G7L), and Hsp60ATP-Hsp10 (PDB ID: 8G7N) (Figure 1b). To preserve the native coordination environment, conserved magnesium (Mg2+) and potassium (K+) ions present in the active site of the template structures were retained in the Hsp60ATP and Hsp60ATP-Hsp10 models.
Given the complexity and functional importance of Hsp60 conformational transitions, the modeled states were subjected only to geometry optimization (energy minimization) using NAMD with implicit solvent. The Hsp60apo and Hsp60ATP models were minimized for 1000 steps, whereas the Hsp60ATP–Hsp10 complex required 5000 steps to account for its greater structural complexity. The resulting structures were validated using the same quality metrics applied to the monomeric and dimeric AlphaFold-generated models, ensuring consistency across all states. These minimized conformations were then used as input receptors for docking, so that all subsequent docking analyses were performed on structures that had undergone this standardized minimization step.

2.1.2. Molecular Dynamics Simulations

All HSP60 conformational states were prepared for MD simulation following an identical protocol. Systems were placed in a minimal rectangular box with a 12 Å solvent buffer and solvated with the TIP3P water model [52]. To approximate physiological ionic strength, KCl was added to a final concentration of 0.15 M, and counter-ions were included to neutralize the overall charge. Electrostatic interactions were treated with the particle-mesh Ewald (PME) method for long-range accuracy [53], while a 12 Å cutoff was applied to short-range nonbonded interactions. Pressure was regulated at 1 bar using the Langevin piston algorithm, and temperature was controlled via Langevin dynamics.
Initial system preparation and simulation setup were automated using QwikMD [54]. After system construction, 10,000 steps of energy minimization were performed with a 2 fs integration timestep to relax steric clashes. The minimized systems were then subjected to a 2000-step heating phase in the NVT ensemble, gradually increasing the temperature from 0 K to 310 K, followed by 10 ns of NPT equilibration (2 fs timestep) with positional restraints applied to the ATP ligand. A subsequent 100 ns production run in the NVT ensemble (4 fs timestep) was conducted without restraints, employing group-based positional restraints on the “TOP” and “BOTTOM” domains. These restraints were applied along the z-axis to both domain groups with an exponent of 2 and a force constant of 5 kcal·mol−1·Å−2. Finally, extended sampling was performed through a 500 ns simulation in the NVT ensemble (4 fs timestep), again applying the same group-based positional restraints.
For each conformational state, only a single trajectory was performed, as the goal of this study was not to provide exhaustive sampling of MIX–Hsp60 dynamics, but rather to assess how different levels of structural relaxation (minimization, short equilibration, and extended sampling) influence subsequent docking outcomes.

2.2. Protein-Protein Docking

Protein–protein interaction predictions between MIX and Hsp60 were conducted using the ClusPro server [12,55], which is widely recognized for its capacity to handle large multimeric complexes with minimal pre-processing. Among currently available web-based docking platforms, ClusPro is the only one capable of managing such large multichain assemblies; other servers impose size restrictions that make them unsuitable for systems of this scale. In this study, MIX was defined as the ligand, while Hsp60 was evaluated in three conformational states: Hsp6apo, Hsp60ATP, and Hsp60ATP–Hsp10. ClusPro was chosen for its robustness and reproducibility in rigid-body docking of high-molecular-weight systems, enabling systematic comparisons across all modeled states.
The server outputs models categorized under four energy-based scoring schemes: Balanced, Electrostatic-favored, Hydrophobic-favored, and Van der Waals plus Electrostatics. For each docking run, predictions were ranked by cluster size, which reflects the population density of similar poses in the sampled conformational space, serving as a proxy for docking robustness.

2.3. Analysis

The structural and dynamic properties of the systems were extensively examined through a combination of custom Python 3 and TCL scripts, alongside visualization and analysis tools such as VMD [50,56]. Detailed residue-residue interaction contact maps were generated using VMD integrated with PyContact [57], setting a threshold of 3.5 Å for defining contacts. This allowed for the identification of critical interaction sites within the protein complexes. In addition, VMD coupled with custom TCL scripts and Python packages (including NumPy, MDAnalysis, and Matplotlib) was employed to calculate and visualize root-mean-square deviation (RMSD) profiles. We analyzed structural fluctuations of Hsp60 only across all trajectory frames. Root mean square fluctuation (RMSF) values were calculated per residue using C α  atoms, with a logarithmic normalization applied to reduce the effect of outliers. The normalized values were mapped onto the protein structure in VMD.
Additionally, a conservation analysis was performed using BLASTP against the Non-Redundant (NR) database, applying an E-value cutoff of 0.05 and filtering for sequences with at least 30% query coverage and 30% identity. The results from this analysis were further explored using VMD’s MultiSeq tool, which employs BLOSUM matrices to assess sequence similarity. This tool allowed us to visualize and highlight critical residue pairs identified in the molecular dynamics simulations, providing insights into their evolutionary conservation and functional significance.

3. Results

In this study, we investigated how structural relaxation at different levels influences protein–protein docking outcomes, using the interaction between the mitochondrial chaperonin Hsp60 and the kinetoplastid-specific protein MIX as a case study. Because both proteins are central to mitochondrial biology, but their structural relationship remains unresolved, this system provides an opportunity to examine not only the potential interface between MIX and Hsp60 but also the methodological reliability of docking workflows applied to large and conformationally flexible complexes. Our results are organized in three parts: (i) structural and evolutionary insights into Hsp60 and MIX, (ii) docking analyses across different conformational states and relaxation protocols, and (iii) identification of recurrent interaction sites and mechanistic hypotheses for MIX regulation of Hsp60.

3.1. Structural and Evolutionary Insights Hsp60 and MIX

A common strategy in protein–protein docking studies is to combine structural modeling with evolutionary and bioinformatics analyses in order to guide and contextualize predictions [58,59,60]. Conservation patterns, sequence variability, and structural domain organization can provide important clues about which regions of a protein are most likely to mediate interactions, while also helping to identify features that may be preserved across species [61,62,63,64]. Following this rationale, we first examined the structural organization and evolutionary conservation of Hsp60 and MIX to place the docking results in their proper biological context and to highlight the functional cycle of Hsp60 as the framework in which MIX binding is likely to occur (see Figure 2).
Hsp60 is responsible for various functions, including protein folding, transport, and assembly within the mitochondrial environment [65,66]. The Hsp60 complex is a highly conserved molecular chaperone found across diverse species, playing a crucial role in protein folding. It is composed of two heptameric rings (each chain containing 547 residues) that create a central cavity where substrate proteins undergo conformational changes. Each subunit is structurally divided into apical, intermediate, and equatorial domains, with the co-chaperonin Hsp10 acting as a regulatory “lid” that encloses the folding chamber [34,67]. This process is tightly controlled by ATP hydrolysis, which drives conformational rearrangements necessary for substrate encapsulation and subsequent release of the properly folded protein [68].
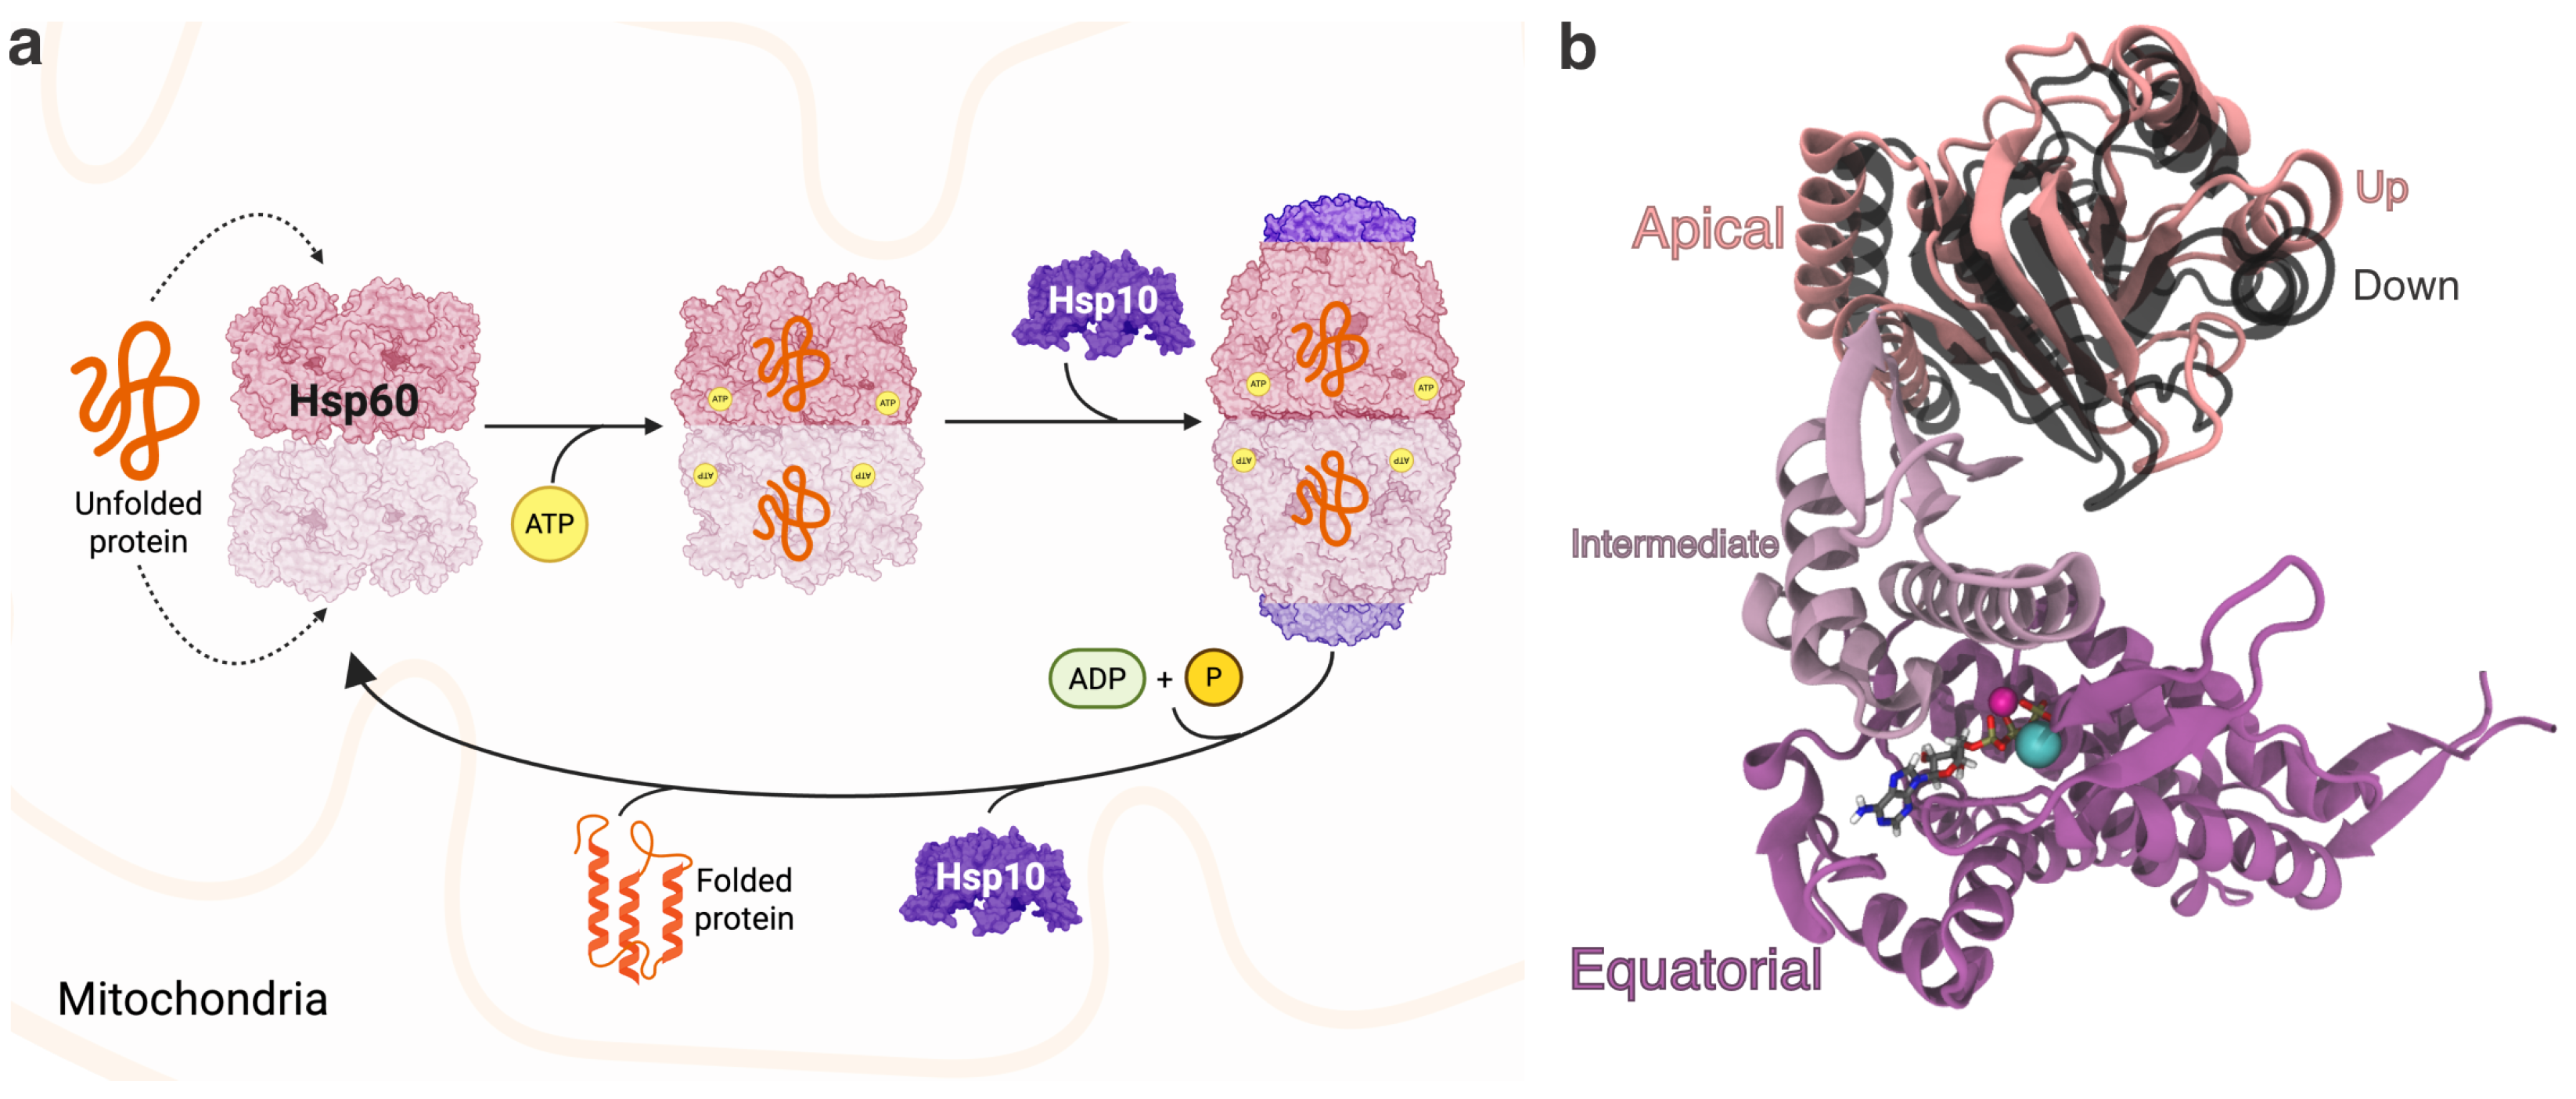
In the cycle’s beginning, HSP60apo forms a relaxed, open conformation. This open state facilitates the entry of client proteins, which are then sequestered in the central cavity (Figure 2a). The apical domains in the apo state are more flexible, providing a less constrained environment that allows substrate binding [33,69]. The arrangement of the apical domains in the apo state may feature a loose pattern. The flexibility and asymmetry of the apo state may enhance the ability of Hsp60 to interact with substrates [33].
Building on the study of Gorman et al. [70], which proposed that chaperonin Hsp60 may interact with MIX, we selected this system as a representative test case of our methodological investigation. MIX has been implicated in mitochondrial functions such as protein processing and oxidative phosphorylation, yet its precise role remains unresolved [35,49], and structural information about a MIX:Hsp60 interface is lacking. The large size and conformational complexity of Hsp60 make it a challenging receptor for docking, providing an ideal setting in which to assess how structural variability at different levels of relaxation influences predictions.
In this context, we extended the sequence comparisons reported by [70] who examined MIX from Trypanosoma brucei (Tb), Leishmania major (Lmj), and Trypanosoma cruzi (Tc), with identities ranging from 75% to 66%. Our analysis further included Leishmania braziliensis, Leishmania infantum (Li), and Leishmania donovani (Ld), revealing identities from 56% (between Tb and Lmj [PDB ID: 3HA4]) to 99% (between Ld and Li) (Table 1, Figure 3a,b). Ref. [70] also suggested that MIX may contain a transmembrane region, highlighted in red in Figure 3a.
Although the crystal structure of Lmj MIX is available (PDB ID: 3HA4), it is incomplete, with missing structural regions (first and last helices showing in Figure 3a). The crystal structure includes residues 56–173 in one chain and 82–170 in the other dimer face. Among the four dimers present in the PDB file, chains F and H were selected as the most complete representatives. To reconstruct the missing regions, we employed the AlphaFold2 pipeline on ColabFold [37] and evaluated the predicted models based on PAE, pLDDT, and iPTM+pTM scores. From these assessments, model number 5 was selected for further refinement using the GalaxyRefine2 server [41]. The final, optimized model is depicted in Figure 3c, with validation parameters provided in the Supplementary Materials—Tables S1 and S2 and Figures S1 and S2.
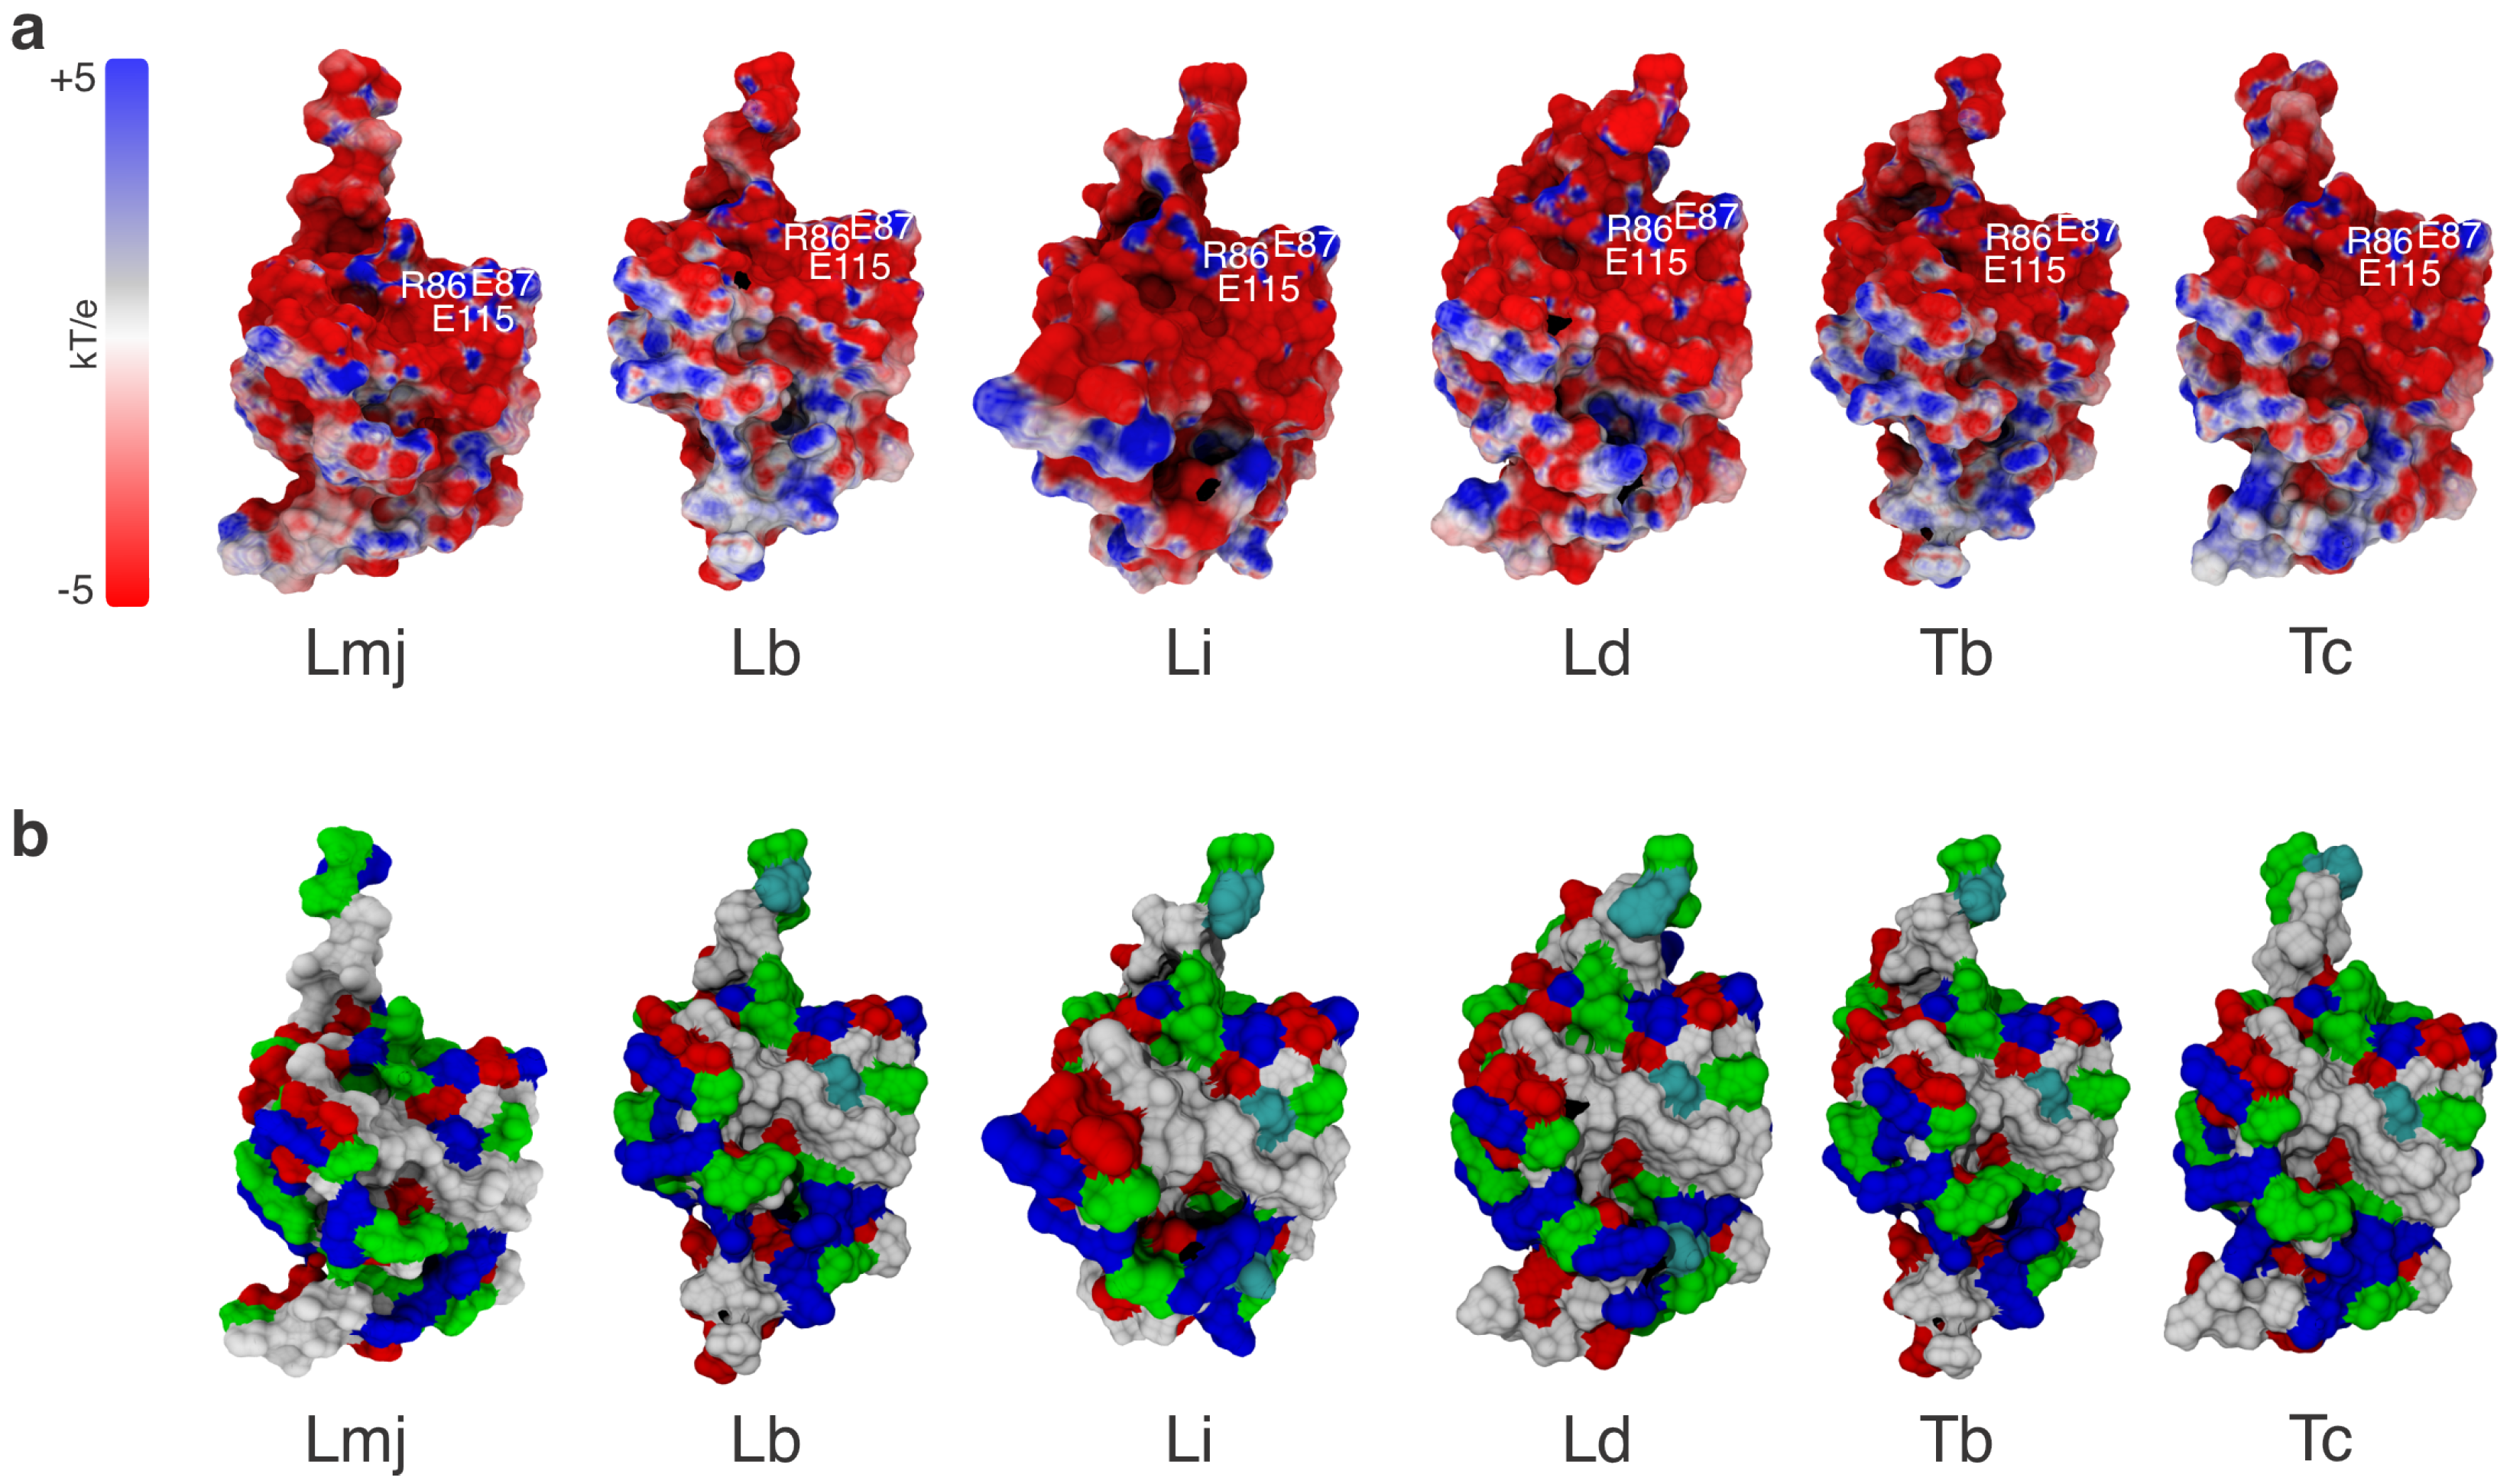
After modeling refinements, we examined whether conserved sequence features were preserved in the structure by analyzing the dimer interface with APBS (pH 8) [35,49] and visualizing with VMD [50,56]. This revealed key electronegative and electropositive regions on the dimer interface (Figure 4a), and a conserved residue-type profile across species (Figure 4b).
Following the MIX pipeline, Hsp60 sequences from TriTrypDB were analyzed with AlphaFold, GalaxyRefine, and validation metrics. Sequence alignments showed high conservation among trypanosomatid Hsp60s, with Li and Ld identical (100%) and Lb and Lmj the most divergent (55.61%) (Table 2). Comparison to human Hsp60 (PDB ID: 8G7N) gave identities ranging from 46.97% (Tb) to 53.03% (Tc). Hsp10 conservation followed a similar evolutionary trend, ranging from 24% (Tb vs. Ld) to 87% (Lmj vs. Lb), with human similarity between 17.50% (Ld) and 45% (Lmj) (Table S3).
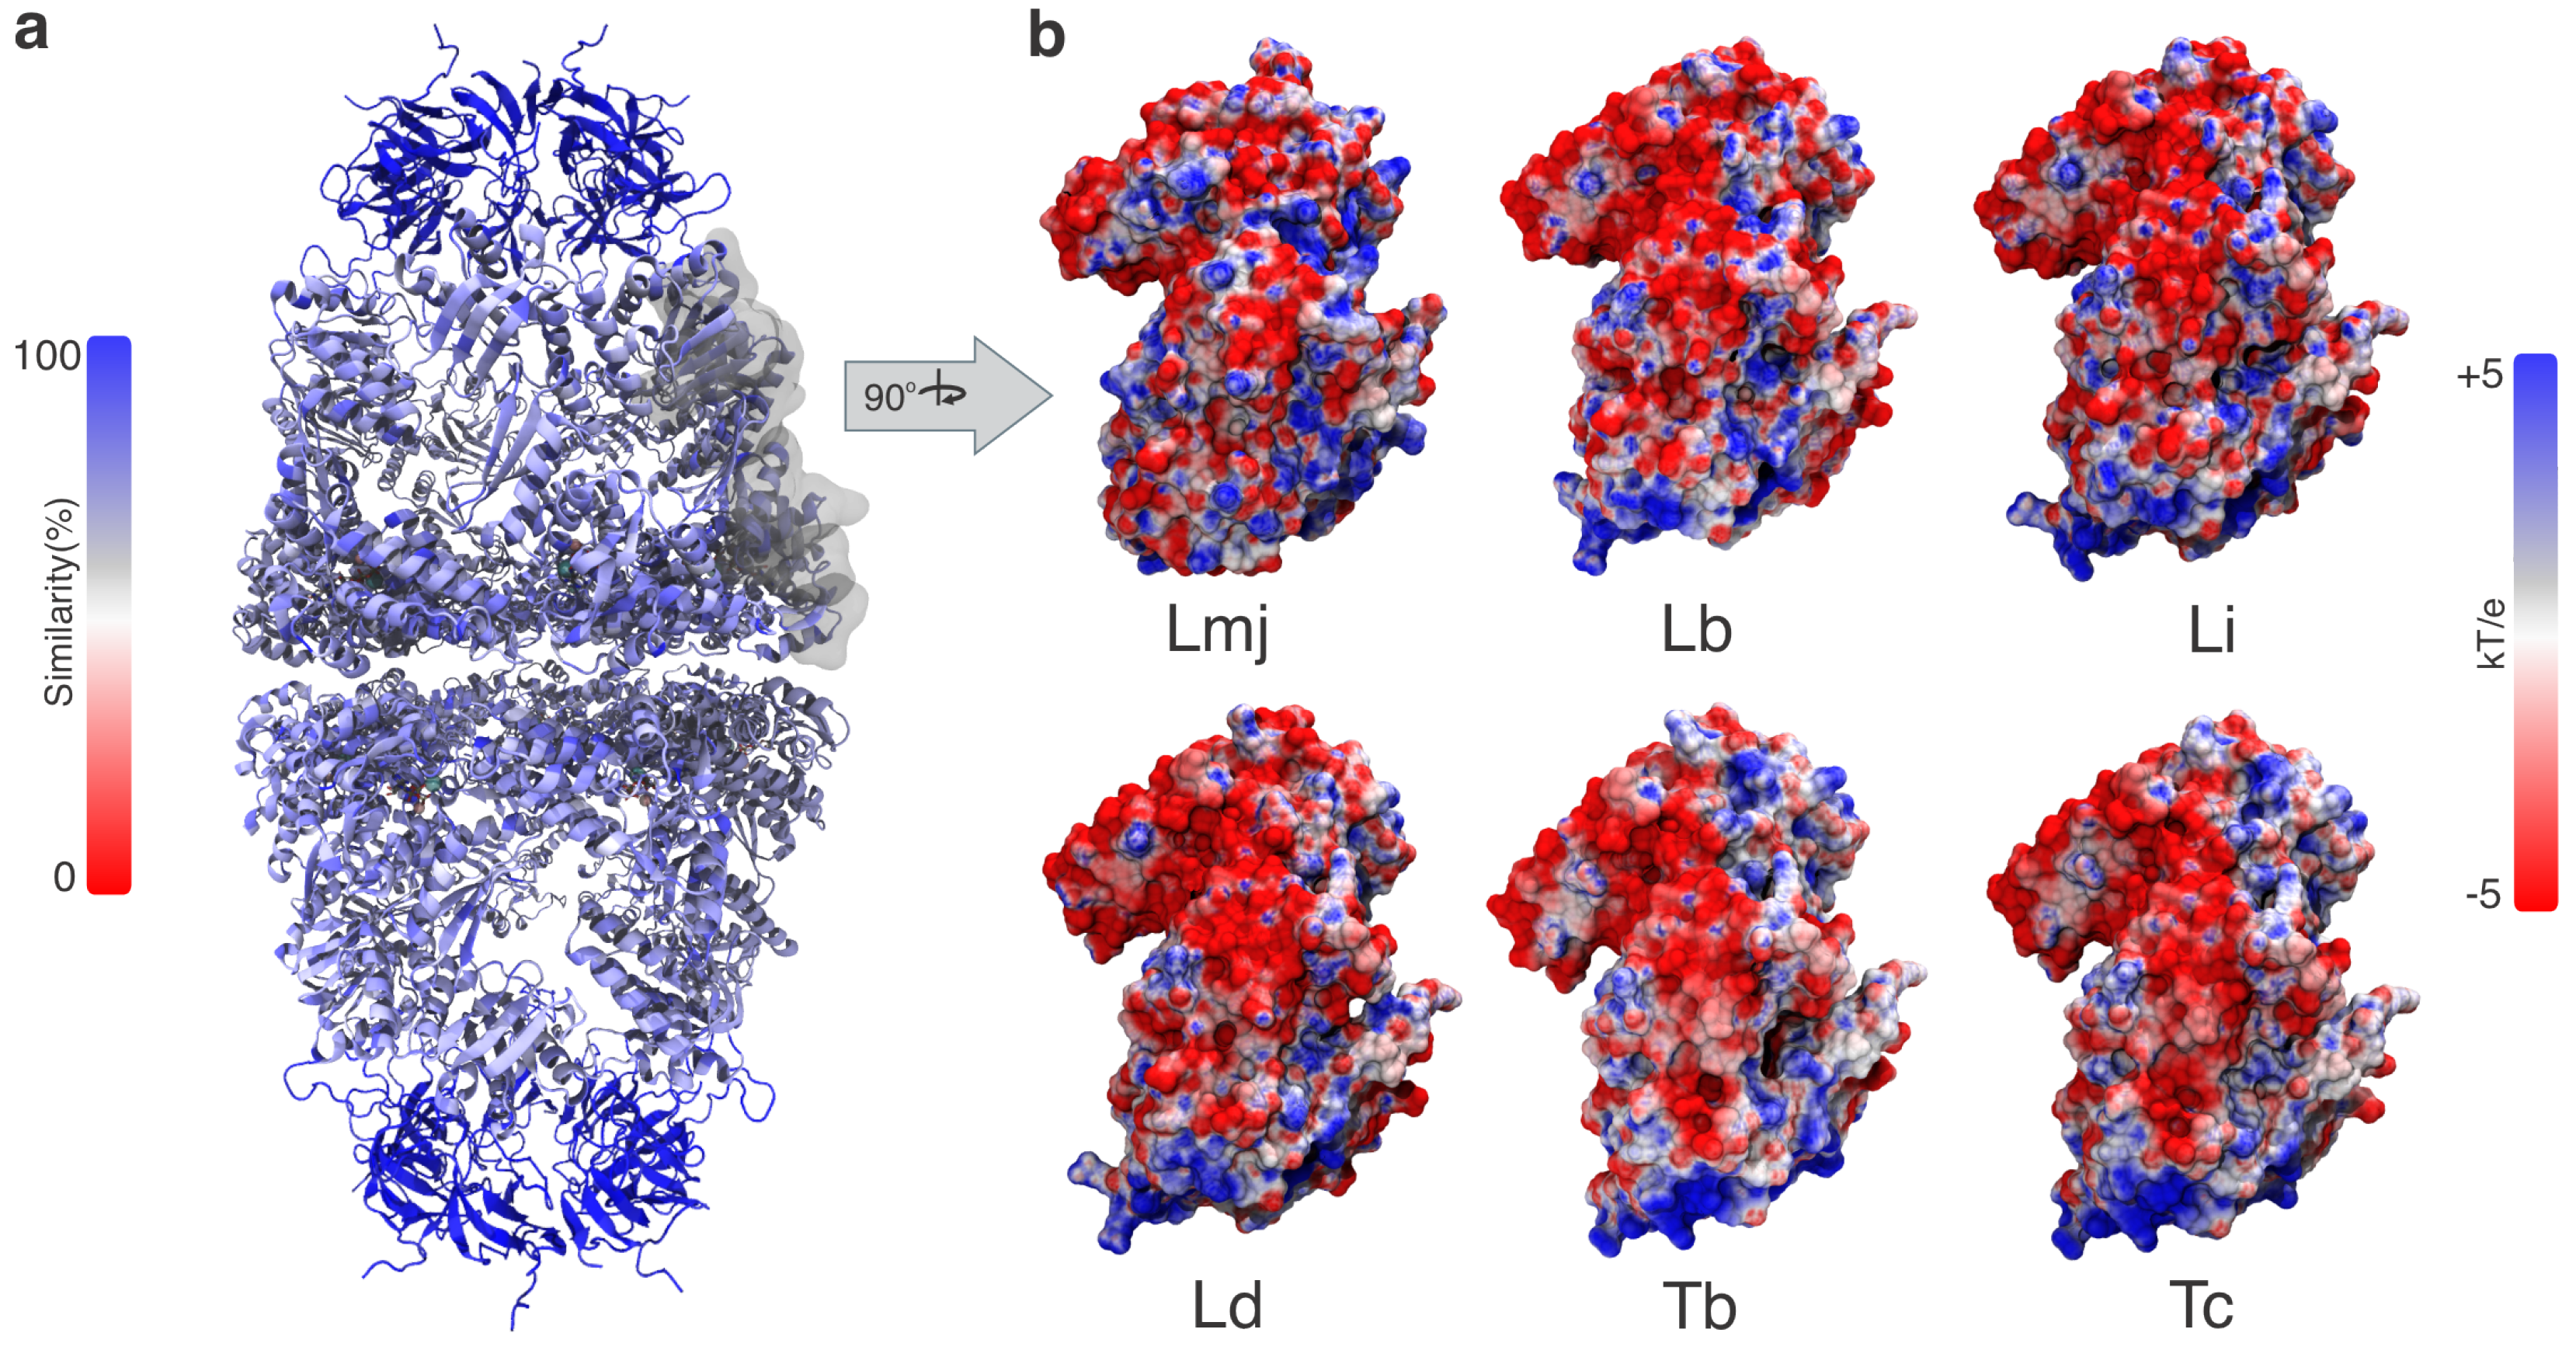
Although our sequence alignment analysis also included comparisons with human Hsp60 and Hsp10 to contextualize evolutionary divergence, here we present only trypanosomatid species, which are the main focus of this study (Figure 5). The structural model highlights the external interface region of Hsp60 as the most likely site of MIX interaction (Figure 5a). Extending this analysis to the electrostatic surface of the same region (Figure 5b) revealed broadly conserved charge distributions, even between divergent species such as Lmj and Lb (52.37% identity), supporting functional preservation despite sequence variability.
Because the crystal structure of MIX is available for L. major (PDB ID: 3HA4) and experimental evidence of its interaction with Hsp60 was reported in the same study [70], we focused our structural analysis on the L. major specie. The three conformational states of Hsp60 were modeled using Modeller [32] with templates 8G7J (apo), 8G7L (ATP-bound), and 8G7N (ATP–Hsp10). Essential Mg2+ and K+ ions were retained in the ATP-bound states to preserve the active site environment. The best models were selected based on validation metrics including RMSD [71], DOPEscore [72], Ramachandran analysis [43], MolProbity Score, and Clash Score [42]. Final refinement was performed by energy minimization in implicit solvent: 1000 steps for the apo and ATP-bound states, and 5000 steps for the larger ATP–Hsp10 complex. Validation metrics pre- and post-minimization are summarized in Table 3.

3.2. Docking Studies of MIX and Hsp60

Validated models of LmjMIX and Hsp60 were used to predict potential interaction regions through protein–protein docking with the ClusPro web server [55]. Hsp60 was analyzed in three conformational states: the apo form (Hsp60apo), the ATP-bound form (Hsp60ATP), and the ATP–Hsp10 complex (Hsp60ATP–Hsp10), with LmjMIX designated as the ligand. To capture structural variability, each state was prepared at three levels of relaxation: (i) minimized (geometry optimization in implicit solvent), (ii) equilibrated (100 ns MD), and (iii) ensemble-refined (500 ns MD). This design enabled a systematic assessment of how structural preparation influences docking predictions.
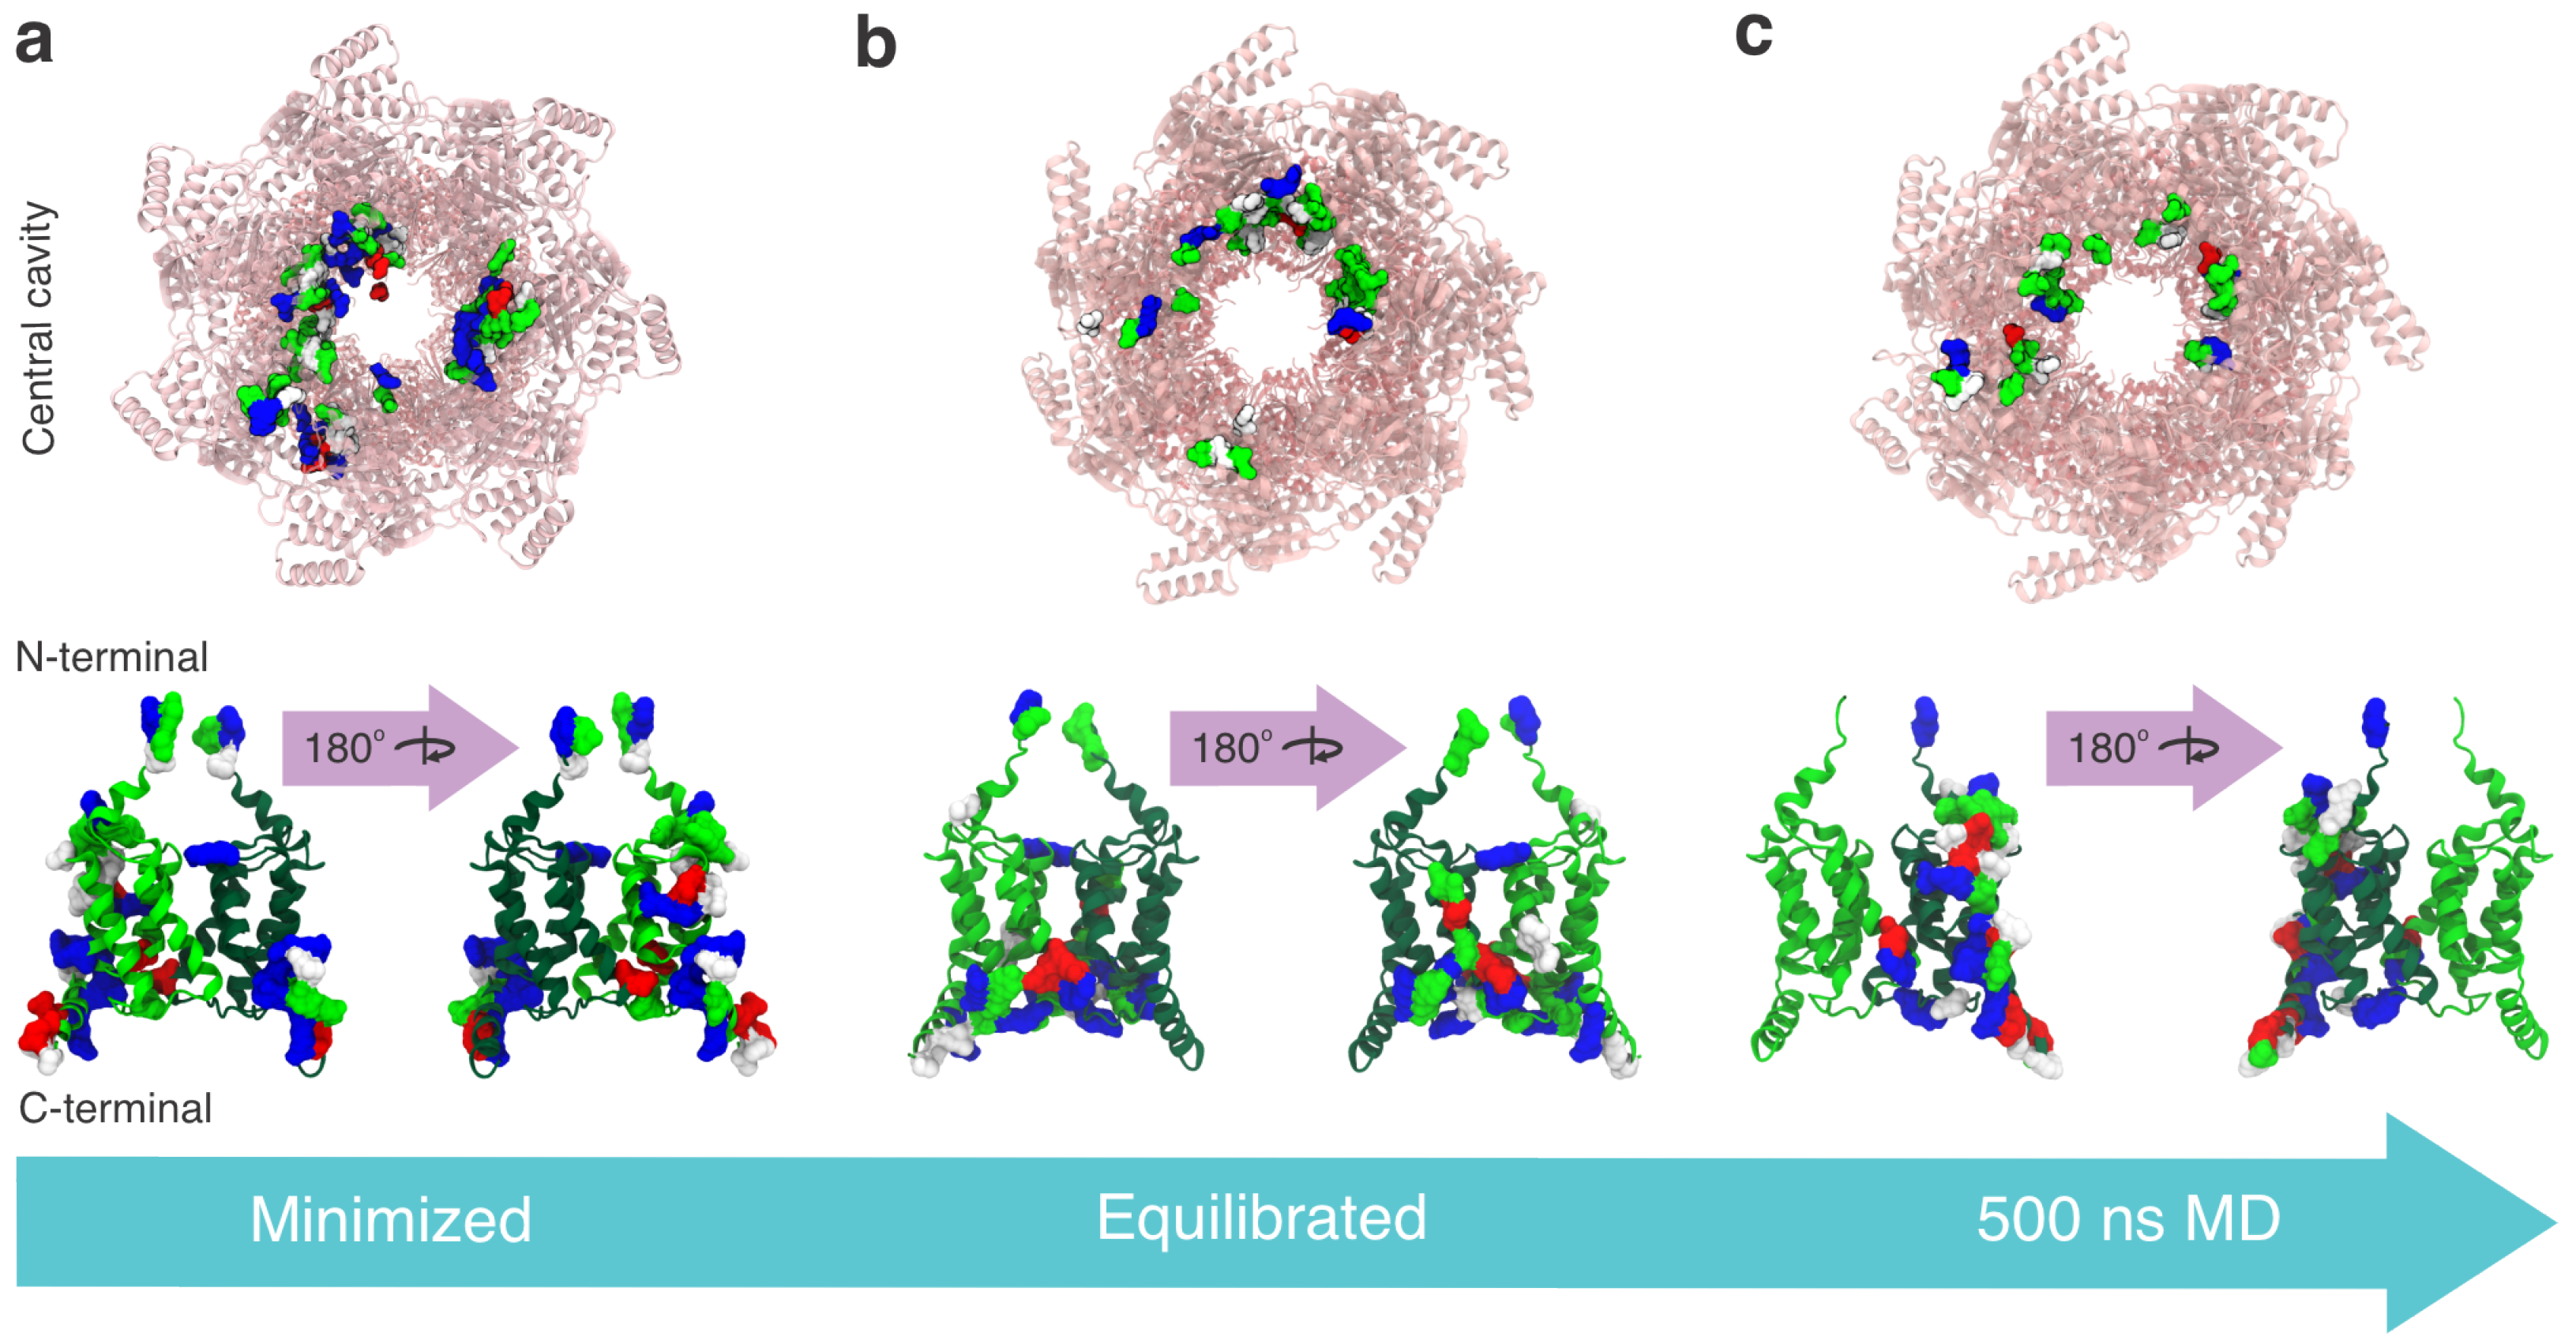
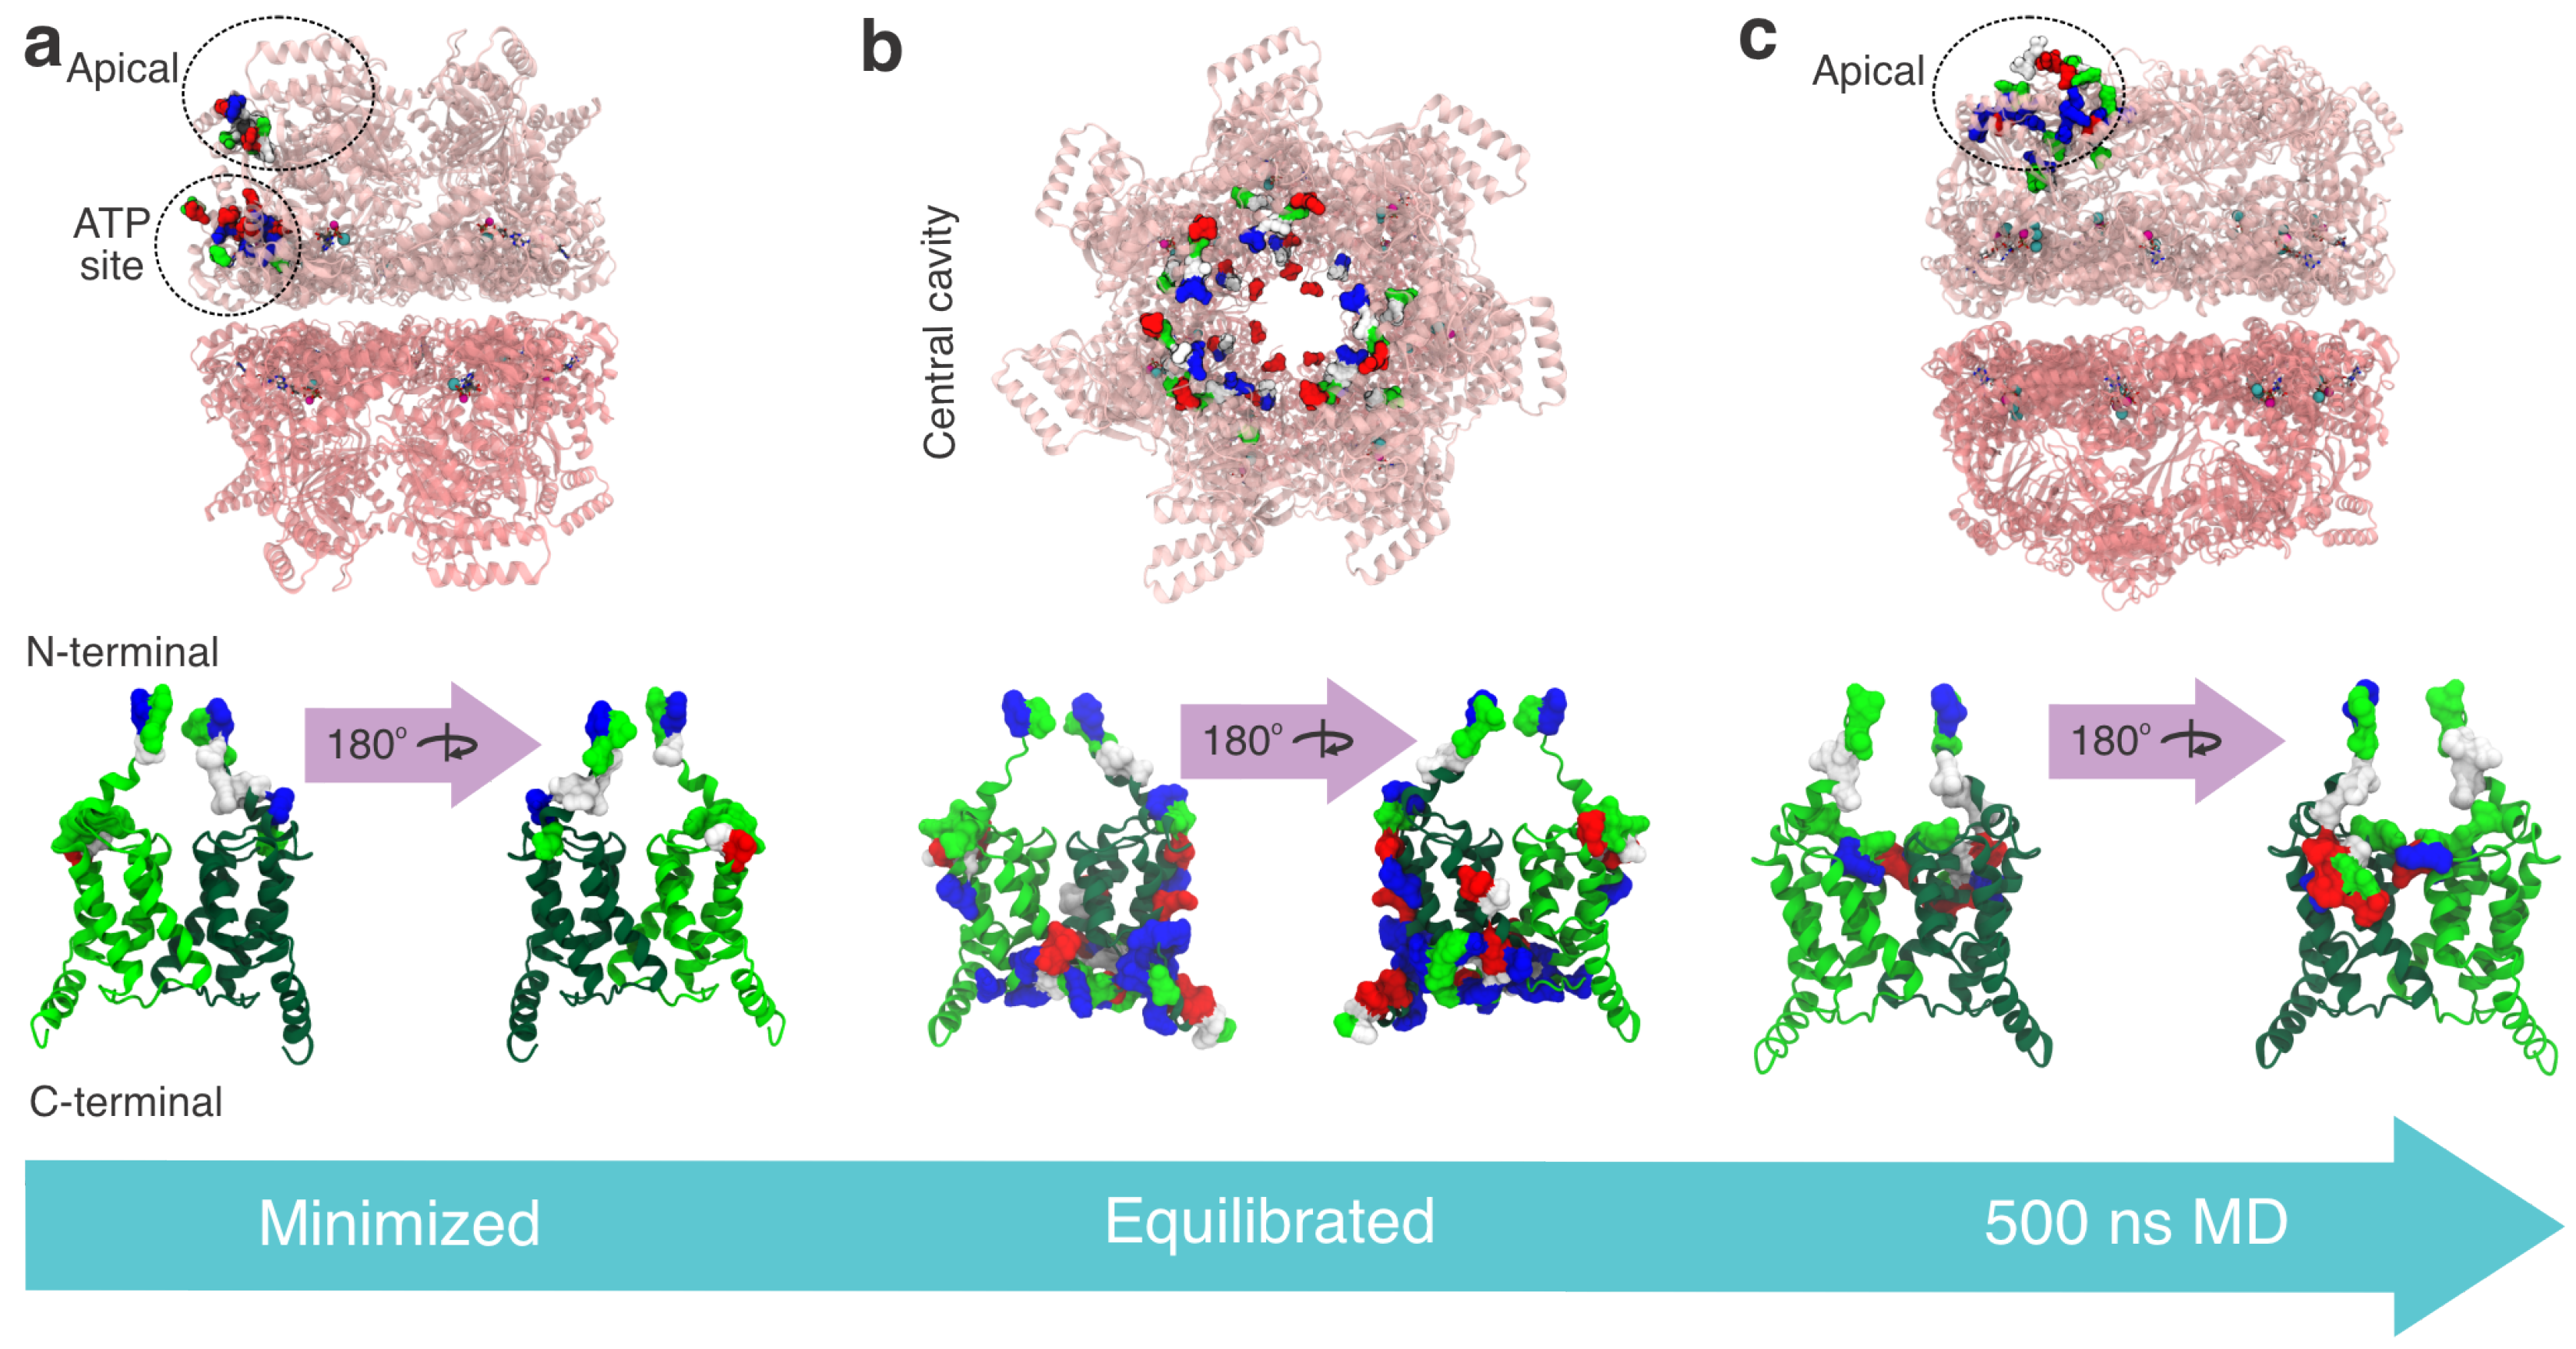
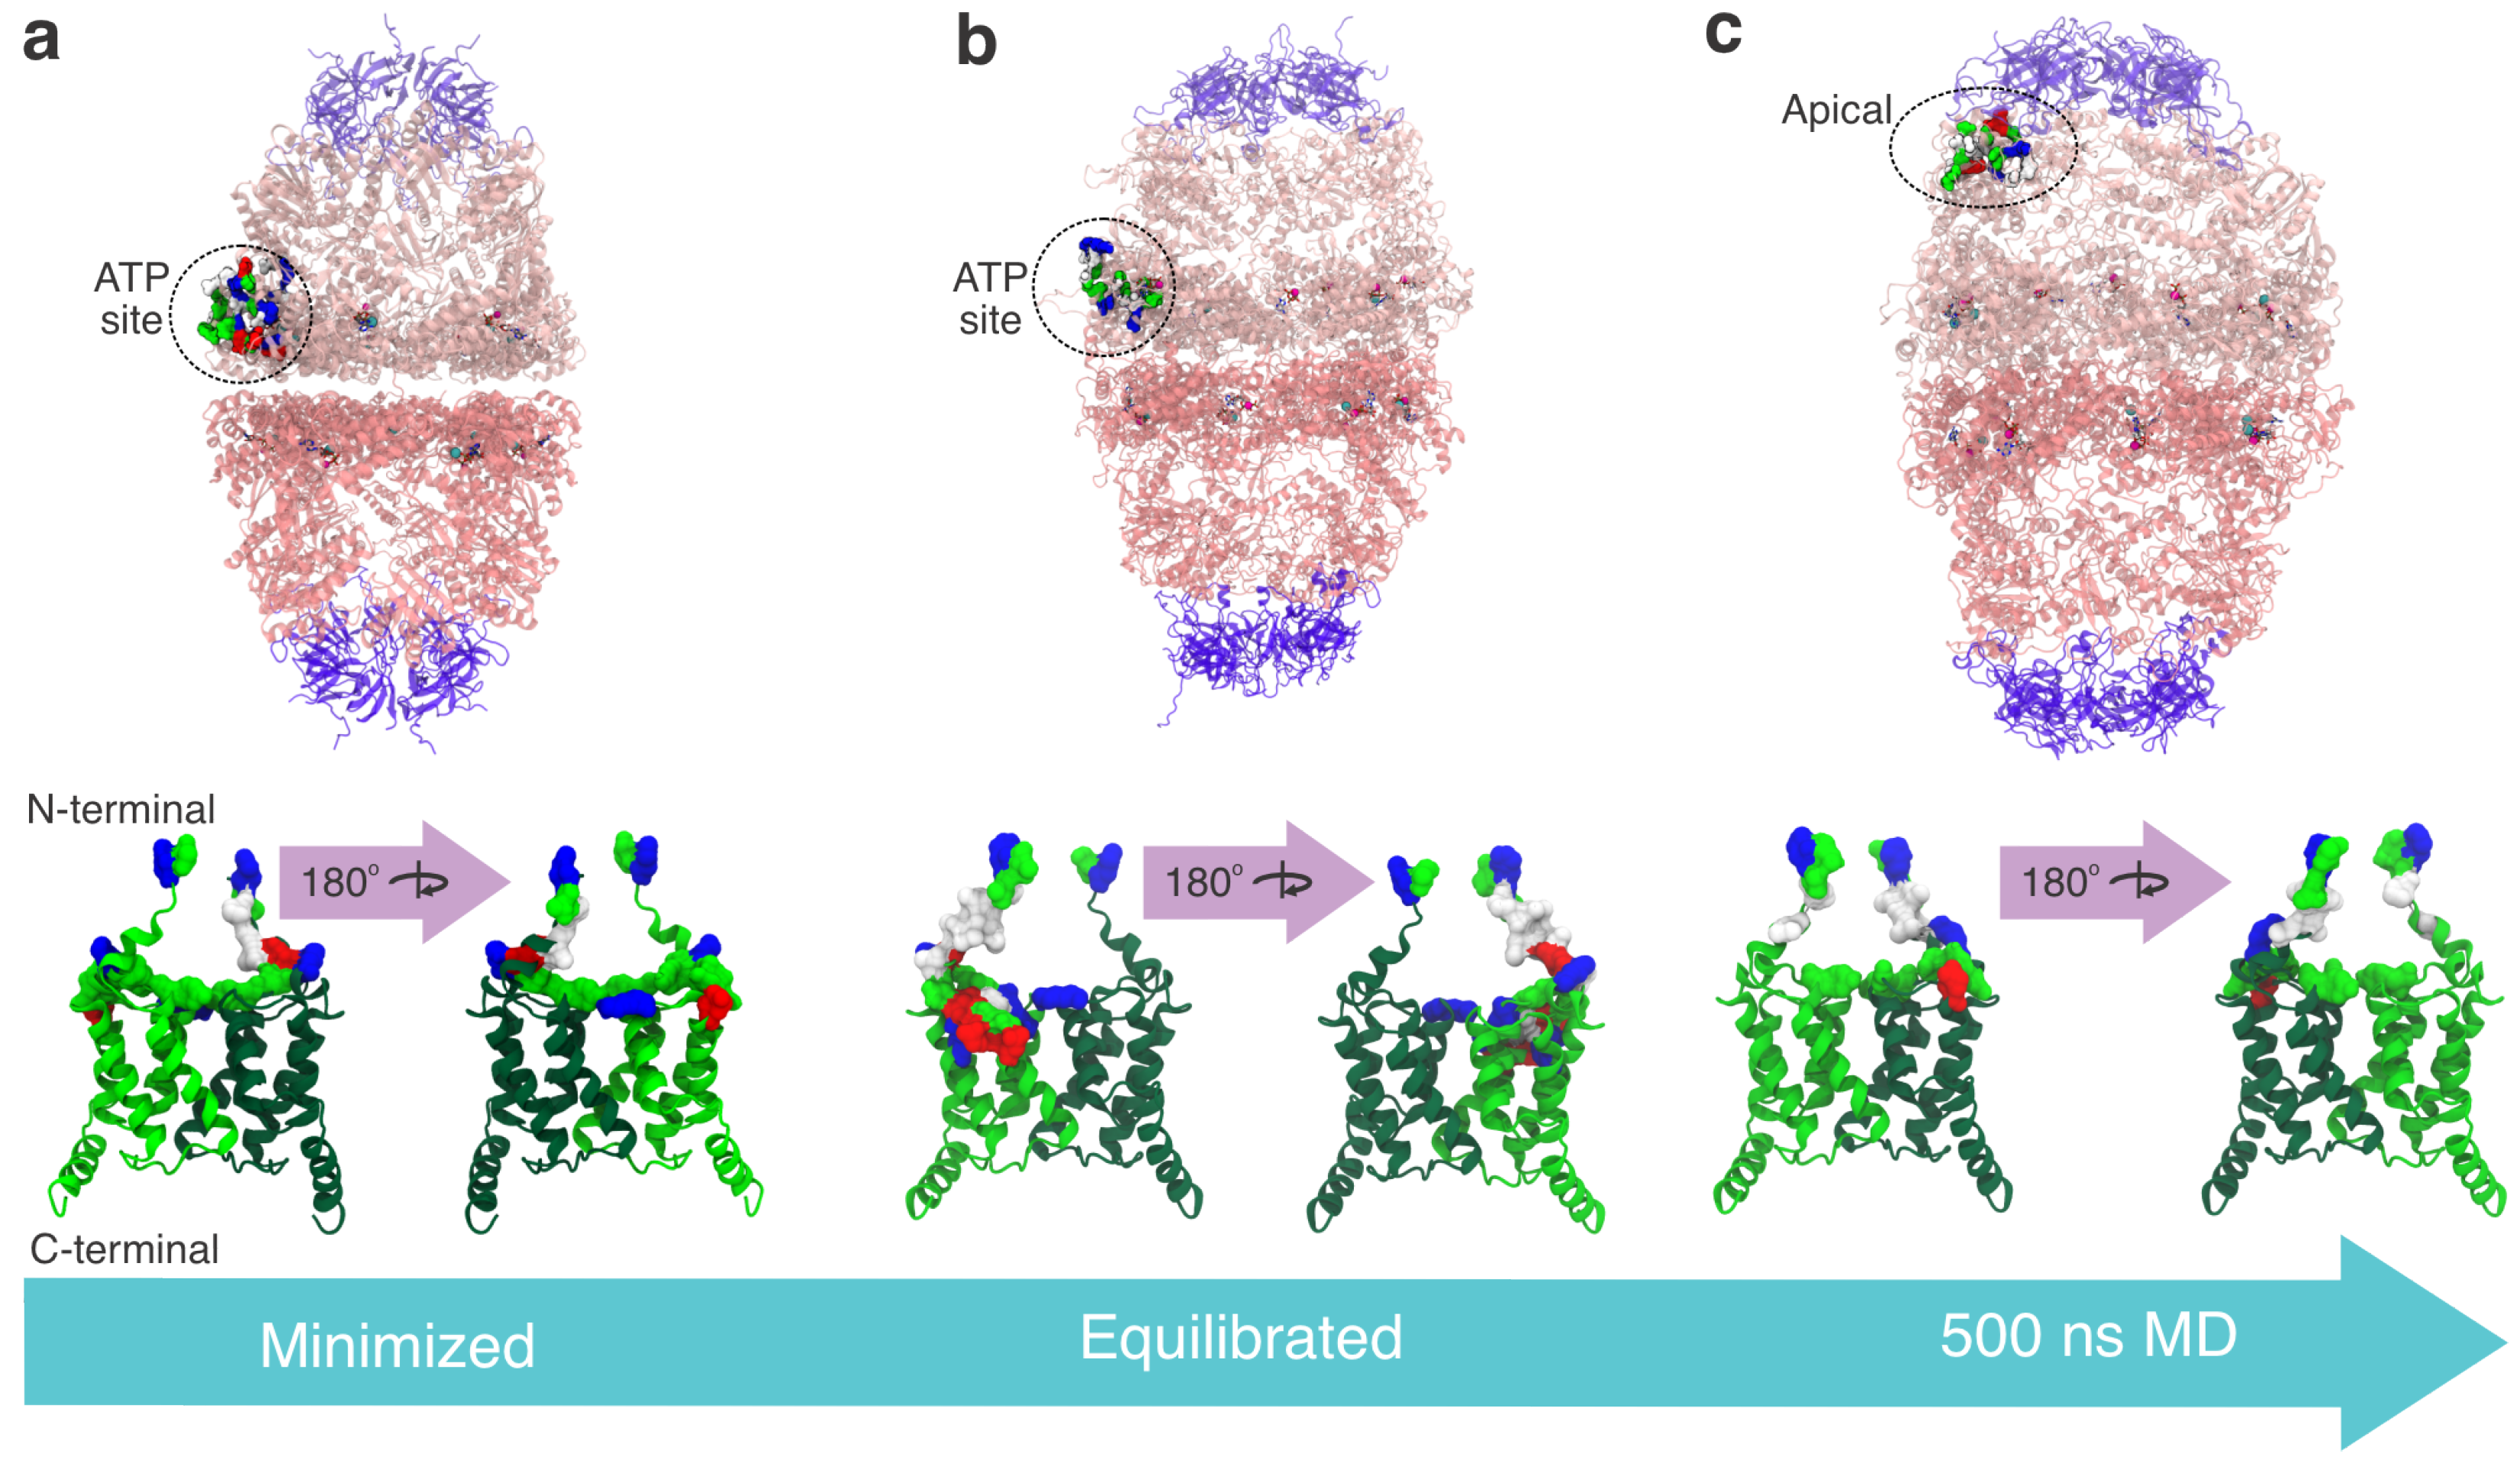
Docking results revealed multiple potential binding modes across all MIX–Hsp60 experiments, reflecting the complexity of predicting interactions in large multimeric assemblies (Figure 6). The outcomes varied markedly with the degree of structural relaxation, even within the same conformational state, underscoring the sensitivity of docking to input preparation. For Hsp60ATP, three distinct binding modes emerged from the minimized, equilibrated, and ensemble-refined models, illustrating how predictions can shift with sampling depth. Some patterns, however, were recurrent. In the Hsp60apo state, central cavity binding was consistently observed, suggesting a robust and biologically plausible interaction. At the same time, the minimized apo model also revealed an alternative binding mode near the ATP site (Figure S3). Similarly, ATP-site binding was detected in two of the three Hsp60ATP–Hsp10 models, supporting its possible functional relevance. After extended 500 ns simulations, however, this preference shifted toward the apical domain, again highlighting how long-timescale relaxation can reshape predicted binding outcomes.
ClusPro does not rank docking models by raw PIPER energies, but rather by cluster size, which reflects the number of similar poses in the sampled landscape [55]. Following this principle, our analysis focused on cluster 0 and cross-protocol pose recurrence, the largest and most populated cluster for each docking run. For transparency, we also report the raw energy scores in Table S4, noting that they are not intended for direct comparison of pose plausibility. Nevertheless, different scores were observed among minimized, 10 ns equilibration, and 500 ns refined structures. This further underscores that docking scores alone have limited reliability in inferring biological plausibility, especially for large, flexible protein complexes.
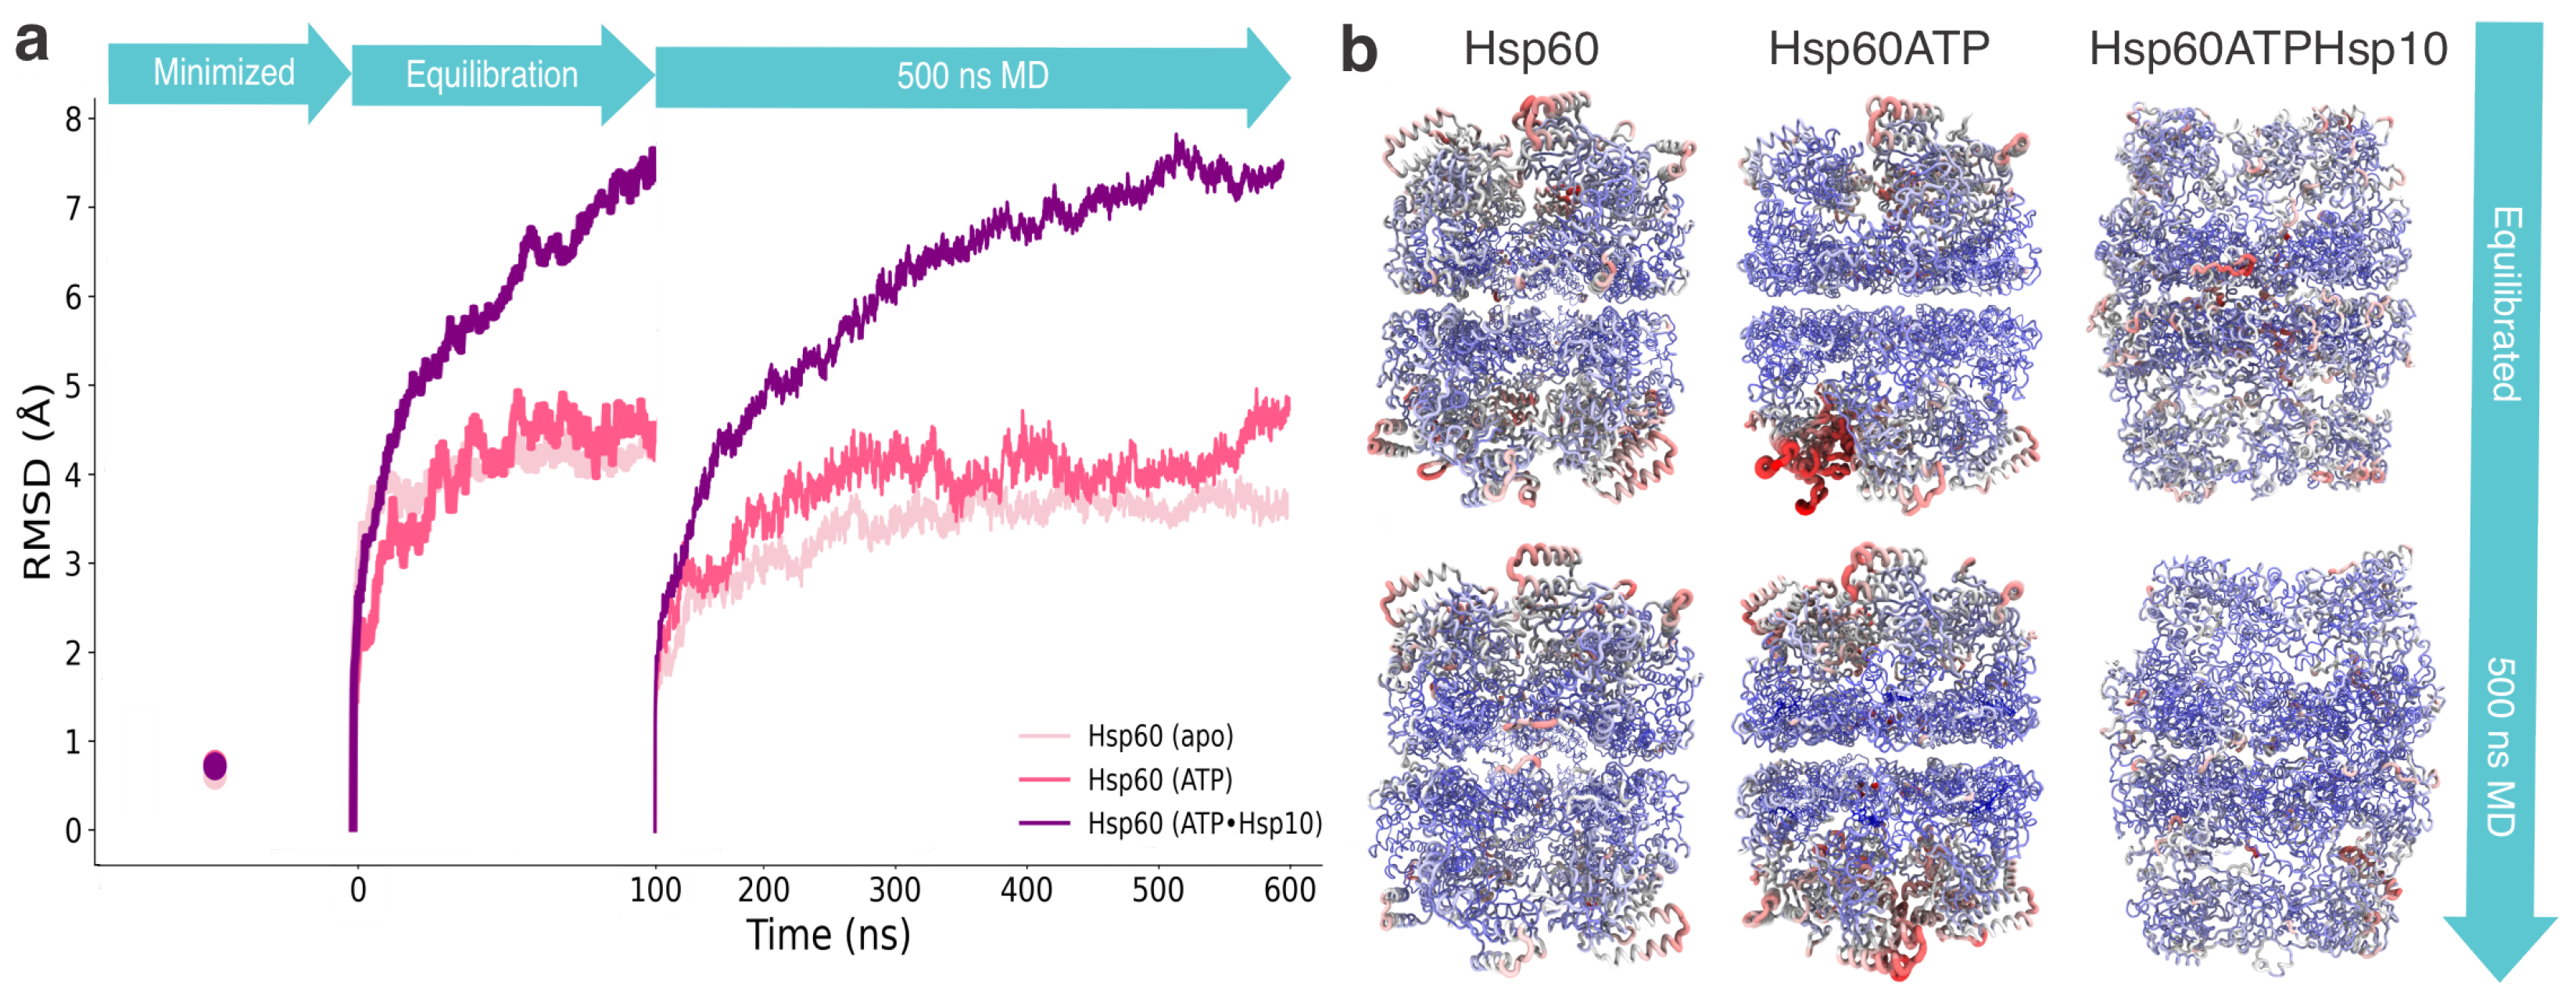
To probe receptor flexibility, we analyzed RMSD values of the Hsp60 heptamer (excluding Hsp10) using VMD. As shown in Table 3 and Figure 7a, RMSDs after minimization remained below 1 Å, confirming local strain relief without global rearrangements. To ensure reproducibility, we defined RMSD stabilization as the point at which RMSD values remained within ±0.5 Å of the mean for at least 20 ns. During equilibration, Hsp60apo and Hsp60ATP stabilized near 4.5 Å, while Hsp60ATP–Hsp10 showed much larger deviations (8 Å), consistent with enhanced flexibility in the absence of a bound client. As showed in Figure 7a, some stabilization occurred within the first 8–10 ns for the systems Hsp60apo and Hsp60ATP, justifying the 10 ns equilibration window. After 500 ns, both Hsp60apo and Hsp60ATP achieved stable conformations around 4.5 Å, while the ATP–Hsp10 complex fluctuated near 8 Å; nonetheless, in the last 50 ns no large RMSD changes were observed in any of the states, indicating that the systems had reached relative stability.
RMSF analysis (Figure 7b) showed that the heptameric core was stable, while the apical  α -helix was most flexible, in agreement with cryo-EM studies [33]. Variability in this helix was greatest in Hsp60ATP, whereas the ATP–Hsp10 complex showed reduced fluctuations, suggesting Hsp10 contributes to system stabilization. Overall, minimization mainly relieved local strain, while longer MD runs enabled broader conformational sampling, especially in the ATP–Hsp10 state. System stability was assessed by comparing averages from 100 ns and 500 ns intervals; when differences were below 10% for most residues, the fluctuations were considered to have stabilized.
Overall, these results show that minimization mainly relieved local strain, while longer simulations allowed broader conformational sampling, especially in the ATP–Hsp10 state. This underscores a key methodological point: minimized structures provide only restricted snapshots, whereas equilibrated or ensemble-refined models capture more physiologically relevant conformations. RMSD analyses confirm that these represent distinct states rather than redundant inputs, highlighting that docking predictions must be interpreted within the context of structural dynamics, particularly for large multimeric proteins like Hsp60.

3.3. Interaction Sites MIX:Hsp60

In the MIX:Hsp60apo state, the primary interaction site was consistently located within the central cavity of Hsp60 (Figure 8). The specific residues involved, however, varied with the level of structural relaxation. In the minimized model, contacts were mostly limited to one MIX chain, with contributions from the N-terminal regions of both chains, suggesting a localized binding pattern (Figure 8a and Figure S4). After 100 ns of equilibration, MIX engaged more extensively, contacting residues at both the dimer interface of MIX and the Hsp60 core, consistent with a broader and potentially more stable interaction network (Figure 8b and Figure S5). Following the 500 ns production run, however, the interaction profile shifted back toward the minimized pattern, with most contacts again concentrated on a single MIX chain (Figure 8c and Figure S6).
Meanwhile, in the MIX:Hsp60ATP state, the minimized structure showed MIX primarily contacting residues within the intermediate and apical domains of Hsp60, with the interaction dominated by its N-terminal extremity (Figure 9a and Figure S7). After 100 ns of equilibration, the binding profile shifted toward the central cavity involving several residues from different chains, similar observed in MIX:Hsp60apo state interactions (Figure 9b and Figure S8). Following the 500 ns production run, the interaction profile shifted once again, displaying greater variability. At this stage, the apical domain of Hsp60 became the primary interaction site, while MIX contacts continued to be concentrated in the N-terminal portion, now including its dimer interface (Figure 9c and Figure S9).
Evaluating the minimized and equilibrated structures of the MIX:Hsp60ATP–Hsp10 complex, the binding profiles were largely similar, with MIX interacting near the ATP-binding site in the equatorial domain of Hsp60 (Figure 10a,b, Figures S10 and S11). In both cases, MIX residues involved in the interaction were concentrated in the N-terminal region. After the 500 ns production run, however, the interaction profile shifted toward the apical domain of Hsp60, while MIX contacts remained predominantly N-terminal (Figure 10c and Figure S12). Taken together, these results show that across all conformational states examined (Hsp60apo, Hsp60ATP, and Hsp60ATP–Hsp10), the N-terminal portion of MIX consistently emerged as a key interaction region, suggesting its potential role as a central mediator of binding.
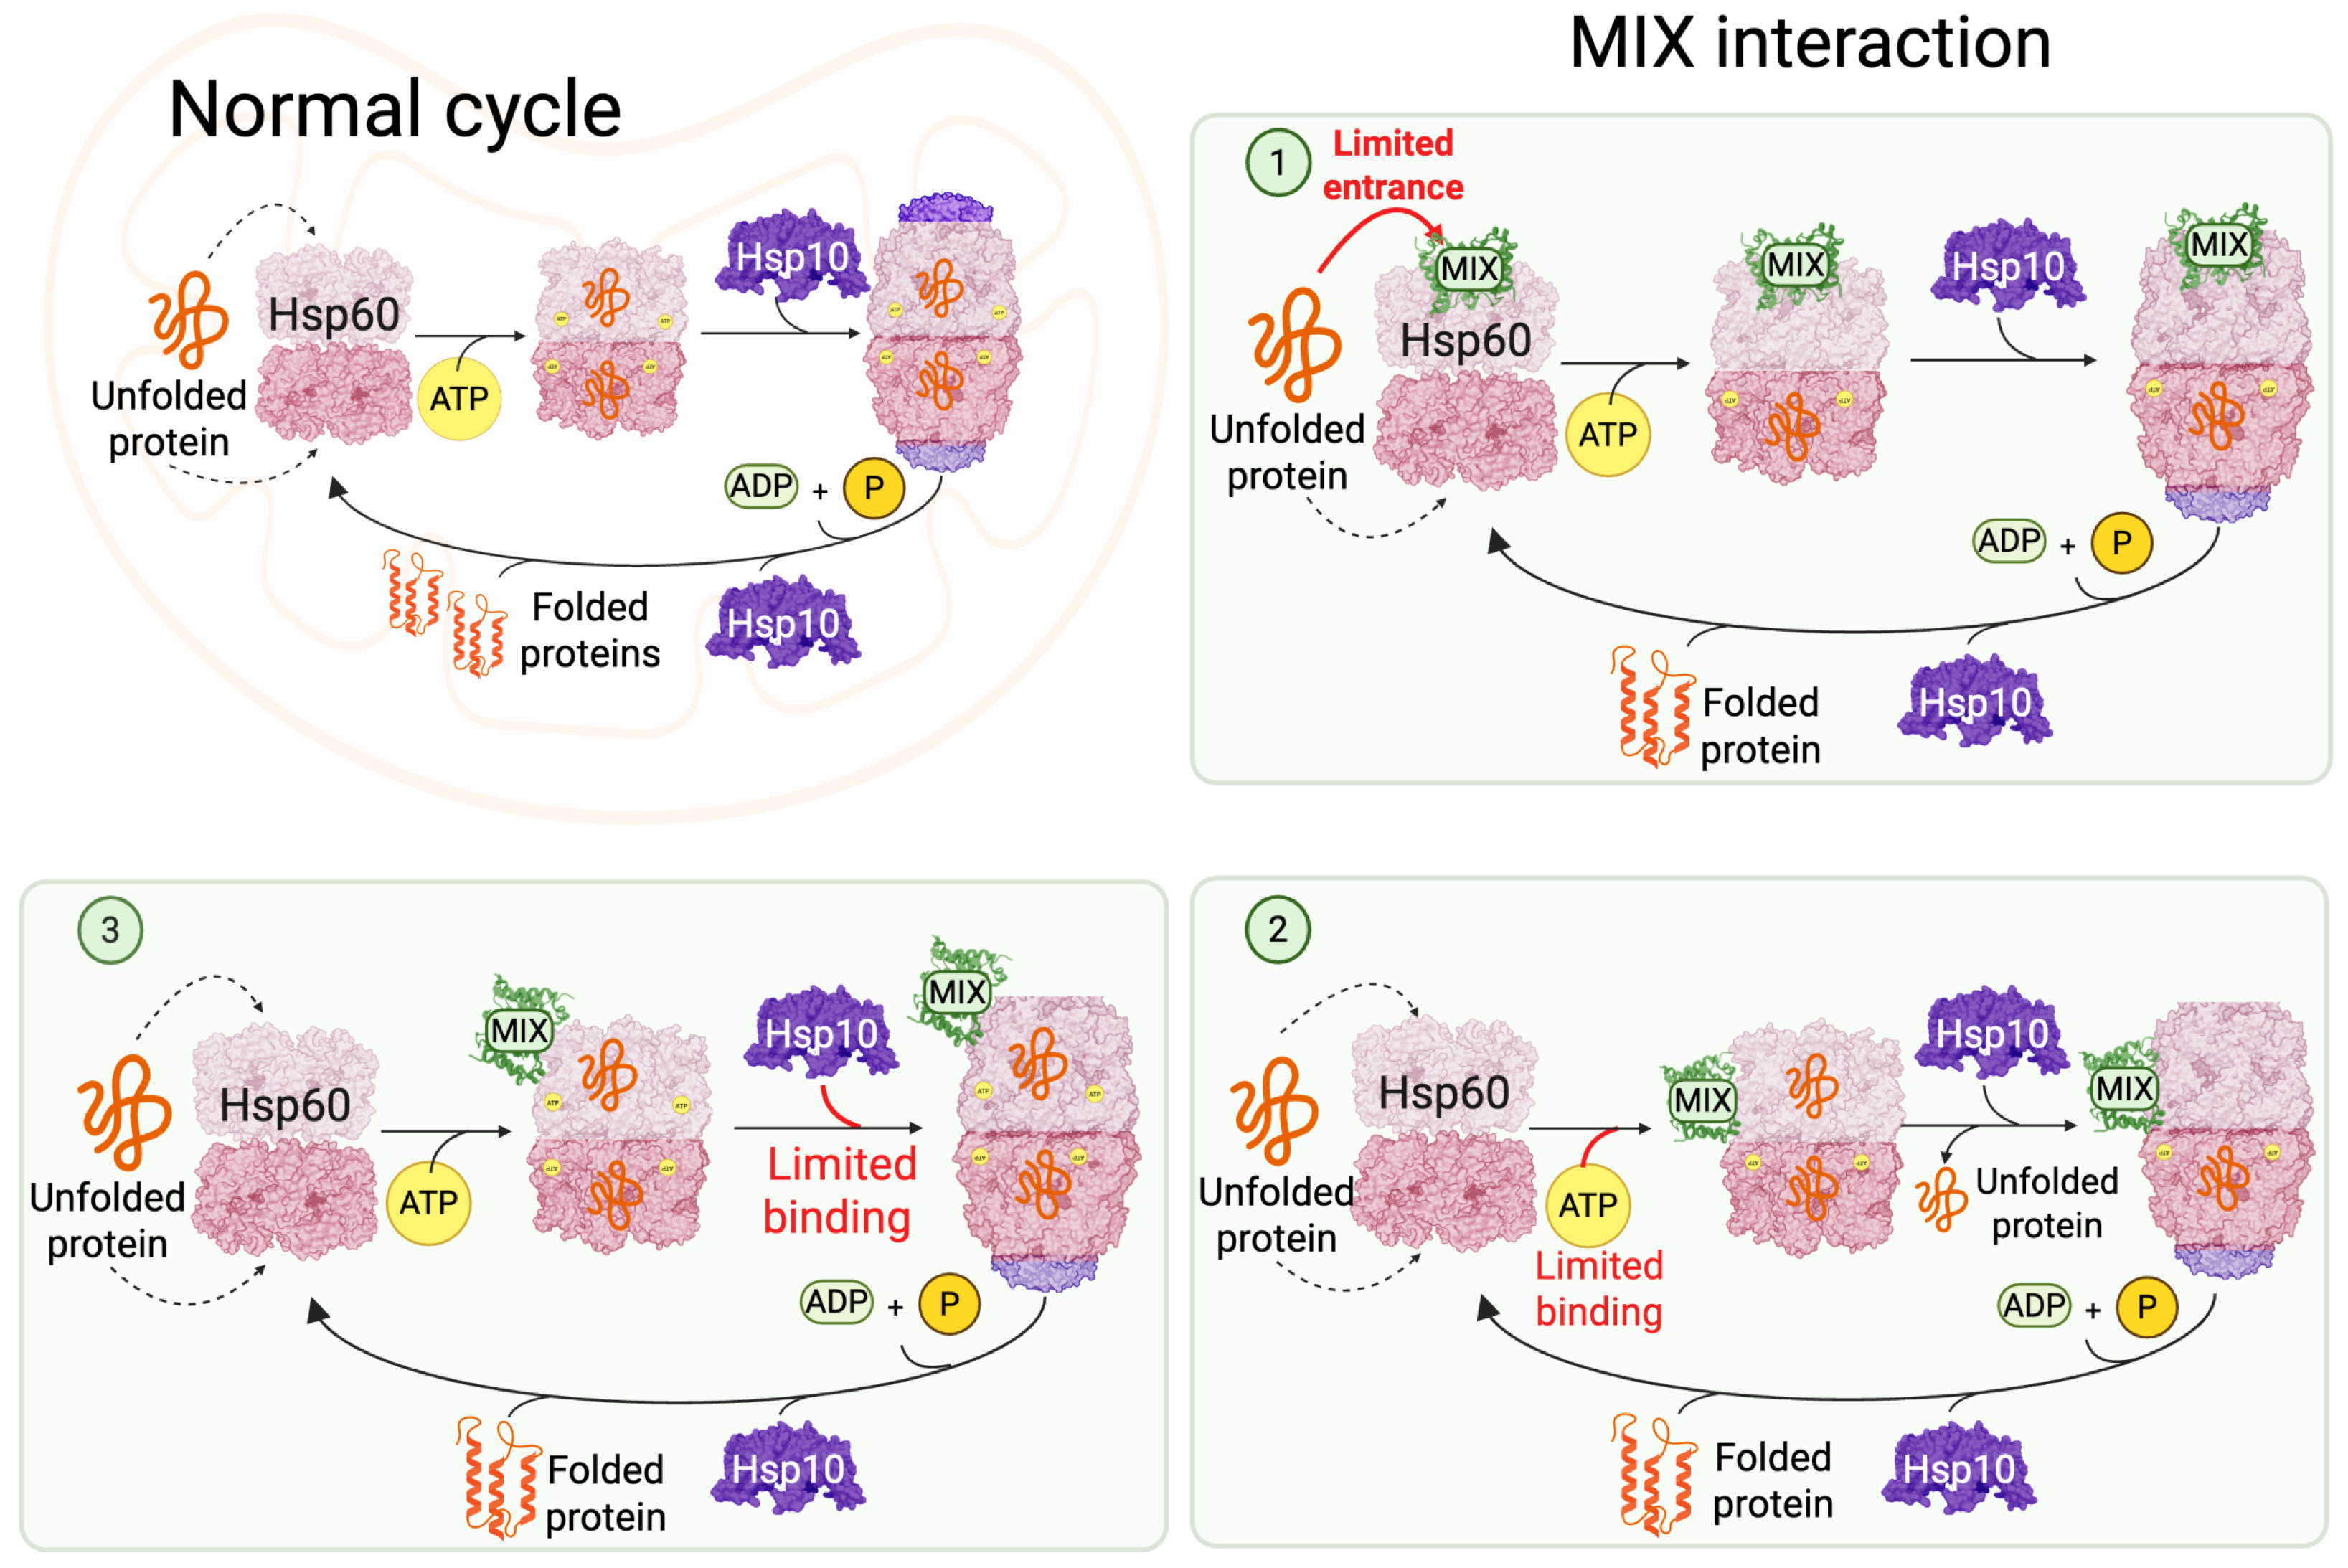
Docking results across the three Hsp60 conformations (Hsp60apo, Hsp60ATP, and Hsp60ATP–Hsp10) revealed several possible MIX binding sites, which can be interpreted as three non-exclusive hypotheses for how MIX may modulate Hsp60 function. First, MIX may transiently occupy the central cavity, restricting or regulating substrate access to the folding chamber. Second, it may bind near the equatorial ATP-binding pocket, fine-tuning nucleotide binding and hydrolysis and thereby controlling the timing of the chaperonin cycle. Third, MIX may associate with the apical domain in the ATP-bound state, competing with Hsp10 and reducing the number of fully closed folding chambers. Together, these hypotheses suggest that MIX could act as a regulator of the Hsp60 folding cycle by balancing substrate entry, ATP-driven cycling, and chamber closure. The schematic in Figure 11 summarizes these mechanisms, illustrating how MIX may intervene at different stages of the Hsp60 functional cycle to influence mitochondrial protein quality control. Moving forward, experimental validation such as mutagenesis of predicted binding residues or biochemical assays of Hsp60 activity in MIX-deficient parasites will be essential to test these models and clarify the regulatory role of MIX.

4. Discussion

Protein–protein interactions are central to biology and disease, making their reliable prediction essential. In bacterial infection, adhesins bind human extracellular matrix proteins in extremely mechanostable forms that enable pathogens to withstand mechanical clearance forces [73,74,75,76]. Similarly, in viral infection, protein–protein recognition constitutes the first step in viral attachment and entry into host cells [77,78,79]. Furthermore, within a single polypeptide chain, intramolecular protein–protein contacts between domains regulate flexibility and signaling, as seen in filamins [80,81,82]. Additionally, protein binding underlies bacterial degradation of biomass, where modular domains coordinate to bind and hydrolyze polysaccharides [83,84]. Even in commensal bacteria, protein–protein recognition drives a myriad of interactions with the host and microbiome [85]. Therefore, mapping binding interfaces is a fundamental challenge, and artificial intelligence methods are now increasingly applied to predict such contacts [11,84,86,87,88]. These examples highlight that the methodological issues explored here—how receptor relaxation influences docking—are directly relevant across many contexts where accurate identification of binding interfaces has profound biological and biomedical implications.
This study investigated whether docking predictions remain consistent when large, flexible complexes are prepared with different levels of structural relaxation. Using MIX and Hsp60 as a stress test, we observed that geometry optimization, short equilibration, and long sampling often yield different docking landscapes, even within the same functional state of the receptor. In practical terms, receptor preparation was not a neutral preprocessing step but a major determinant of predicted binding modes, consistent with the broader sensitivity of rigid-body docking to interfacial sterics, backbone strain, and side-chain orientations [5,89]. This stands in contrast to many smaller or single-chain targets where docking tends to converge more reliably [90,91], and it underscores the particular challenge posed by multimeric assemblies that undergo large conformational transitions [33].
By contrast, in systems where the binding interface is more rigid and undergoes minimal conformational rearrangement, rigid-body docking benchmarks appear to be sufficient to achieve satisfactory results without additional relaxation steps [12]. For example, benchmarking studies have shown that protein–protein pairs such as the double bromodomain with the histone chaperone ASF1, cysteine desulfurase IscS with the sulfur transferase TusA, and the recombinational repair protein RecR with DNA repair protein RecO can be accurately modeled using rigid-body docking alone, without the need for extensive MD-based refinement [12,92]. Consistent with this, ClusPro performs particularly well on enzyme-containing targets, where 51 of the 88 complexes (57.9%) achieved acceptable or better models within the top 10 predictions, compared to 19 of the 40 antibody–antigen complexes (50%) [12]. Thus, the appropriate level of relaxation depends on the system: rigid systems can be adequately represented by minimized structures, whereas flexible systems require deeper sampling or ensemble-based approaches to ensure biologically meaningful predictions.
Three methodological themes emerged from our results. First, while minimized models frequently yielded more favorable docking scores than equilibrated or ensemble-refined inputs, these differences should not be interpreted as indicators of correctness. ClusPro’s scoring function is not designed to rank the biological plausibility of docking models but rather to cluster and organize poses [55]. Our observations therefore highlight the broader caution, emphasized by the ClusPro developers themselves, that docking scores alone are insufficient to identify the most plausible binding mode, particularly in large assemblies where plausible but false-positive poses can readily arise [93,94,95]. Second, recurrent interaction patterns, such as central cavity binding in apo Hsp60 or ATP-site and apical-domain engagement in nucleotide-bound states, suggest that certain hypotheses are more robust to preparatory differences. Third, RMSD and RMSF analyses confirmed that minimized, equilibrated, and long-sampled receptors represent distinct conformational states rather than redundant inputs, particularly in the ATP–Hsp10 state, explaining why docking outcomes shifted with deeper sampling [33]. These observations emphasize that docking should be interpreted in the context of receptor dynamics rather than as a property of a single static snapshot.
Enhanced sampling methods in molecular dynamics provide a natural path forward for addressing these challenges. Approaches such as replica exchange, metadynamics, or steered simulations can accelerate exploration of conformational space and identify binding-relevant states that are rarely visited in conventional trajectories [96]. Indeed, advances in high-performance computing now make it possible to simulate very large macromolecular complexes, involving millions of atoms, and analyze their conformational landscapes at biologically meaningful timescales [97]. Integrating docking with enhanced sampling and ensemble strategies therefore offers a promising direction for generating predictions that are both robust and biologically relevant.
An additional consideration is the methodological constraints of current docking platforms. We employed ClusPro because it can reproducibly handle very large complexes without requiring predefined interfaces, whereas other widely used tools remain limited by system size or chain number. HADDOCK, for example, imposes a chain limitation (≤20 chains) [20]; RosettaDock’s public server restricts targets to ∼600 residues [21]; and ZDOCK’s benchmark set, though extensive with 176 complexes, only reached as far as the H5N1 influenza virus hemagglutinin hexamer as its largest case [19]. Similarly, AlphaFold-Multimer struggles with very large mitochondrial assemblies, particularly those containing transmembrane segments, often yielding low-confidence models requiring experimental validation [98,99].
By contrast, ClusPro is uniquely scalable, providing robust rigid-body docking predictions for large multimeric systems. Moreover, comparative studies with smaller targets demonstrate that ClusPro’s outputs can align with experimental validation: for example, Gomes et al. [11] showed that among three docking programs tested for PD-L1:Affibody interactions, ClusPro identified the orientation later confirmed as most stable by MD refinement. In this sense, the MIX–Hsp60 system serves as a stress test that underscores the broader methodological limitation: receptor relaxation and conformational variability critically shape docking predictions, and this impact grows with increasing system size and flexibility.
Finally, the broader applicability of this approach must be considered. The necessity and impact of structural relaxation are highly system-dependent: for small or rigid complexes, rigid-body docking alone may be sufficient, whereas for large, multimeric assemblies with extensive conformational transitions, the choice of relaxation protocol becomes a major determinant of predicted binding sites. Likewise, sampling timescales impose practical limits—short MD runs may relieve local strain but fail to capture domain-level motions, while long trajectories are computationally demanding and still cannot fully explore the conformational landscape. Future work should therefore integrate docking with complementary experimental and computational methods. Furthermore, mutagenesis studies can directly probe the predicted interaction sites, while fitting docking poses into cryo-EM density maps using tools such as VESPER [100], DEMO-EMfit [101], or Situs [102] can provide an independent validation framework. These strategies will be particularly important for large, flexible complexes where docking predictions are inherently sensitive to receptor dynamics.
In summary, structural relaxation strongly shapes docking predictions in large multimeric assemblies, influencing both the identity and consistency of predicted binding sites. MIX and Hsp60 served here as a representative stress test, showing how outcomes diverge depending on receptor preparation. For Hsp60, MIX could plausibly bind in the cavity, at the ATP pocket, or at the apical domain depending on conformational state, offering testable hypotheses for future biochemical validation. More broadly, this work shows that structural preparation is not a background detail but a central determinant of docking reliability. Robust predictions will require ensemble approaches, enhanced sampling, and integration with experimental validation, ensuring that docking continues to provide meaningful insight into the vast array of biological processes governed by protein–protein binding.

Supplementary Materials

The following supporting information can be downloaded at: https://www.mdpi.com/article/10.3390/applbiosci4040048/s1, Figure S1: pLDDT distribution across models; Figure S2: pLDDT distribution for the selected LmjMIX model; Figure S3: MIX:Hsp60apo side binding mode; Figure S4: MIX:Hsp60apo contact heatmap, minimized structure; Figure S5: MIX:Hsp60apo contact heatmap, equilibrated structure; Figure S6: MIX:Hsp60apo contact heatmap, ensemble-refined structure; Figure S7: MIX:Hsp60ATP contact heatmap, minimized structure; Figure S8: MIX:Hsp60ATP contact heatmap, equilibrated structure; Figure S9: MIX:Hsp60ATP contact heatmap, ensemble-refined structure; Figure S10: MIX:Hsp60ATP-Hsp10 contact heatmap, minimized structure; Figure S11: MIX:Hsp60ATP-Hsp10 contact heatmap, equilibrated structure; Figure S12: MIX:Hsp60Hsp60ATP-Hsp10 contact heatmap, ensemble-refined structure; Table S1: LmjMIX AlphaFold validation metrics; Table S2: MIX additional structural model validation; Table S3: Hsp10 alignment matrix (%); Table S4: ClusPro docking results for MIX:Hsp60.

Author Contributions

R.S.d.L.R. performed bioinformatics analyses and molecular dynamics simulations, and wrote the manuscript. A.C.S.B. conducted bioinformatics analyses and contributed to manuscript writing. R.C.B. and M.L.d.S. supervised analyses and contributed to manuscript writing. All authors have read and agreed to the published version of the manuscript.

Funding

This research was supported by the National Science Foundation (Grant MCB-2143787) awarded to RCB. RSLR received funding from the Brazilian Federal Agency for Support and Evaluation of Graduate Education (CAPES) through the CAPES-FIOCRUZ/PrInt program (No. 01/2022). ACSB was supported by a PhD scholarship from CAPES (No. 88887.801809/2023-00) and by FAPERJ (Grant E-26/201.641/2025). MLS was supported by the National Council for Scientific and Technological Development (CNPq), Brazil, and by FAPERJ (Grant 211.398/2019). Computational resources were provided by Auburn University through start-up funds for RCB.

Institutional Review Board Statement

Not applicable.

Informed Consent Statement

Not applicable.

Data Availability Statement

All data supporting the findings of this study are described in detail within the Section 2 of the manuscript. Additional datasets generated and analyzed during the current work are available from the corresponding author upon reasonable request.

Acknowledgments

The authors thank the Instituto Nacional de Metrologia, Qualidade e Tecnologia (INMETRO) for providing essential infrastructure support to the Computational Biology Research Group. We also acknowledge the institutional support from Auburn University and FIOCRUZ, which contributed to the development of this work.

Conflicts of Interest

The authors declare no conflicts of interest.

Abbreviations

The following abbreviations are used in this manuscript:
ATPAdenosine triphosphate
Hsp10Heat shock protein 10
Hsp60Heat shock protein 60
LbrLeishmania braziliensis
LdLeishmania donovani
LiLeishmania infantum
LmjLeishmania major
Mixmt protein X
MDMolecular dynamic
RMSDRoot-mean-square deviation
TbTrypanosoma brucei
TcTrypanosoma cruzi
VMDVisual Molecular Dynamics

References

  1. Maheshwari, S.; Brylinski, M. Across-proteome modeling of dimer structures for the bottom-up assembly of protein-protein interaction networks. BMC Bioinform. 2017, 18, 257. [Google Scholar] [CrossRef]
  2. Launay, G.; Simonson, T. Homology modelling of protein-protein complexes: A simple method and its possibilities and limitations. BMC Bioinform. 2008, 9, 427. [Google Scholar] [CrossRef] [PubMed]
  3. Rosa, R.S.; Leal da Silva, M.; Bernardi, R.C. Atomistic Insights into gp82 Binding: A Microsecond, Million-Atom Exploration of Trypanosoma cruzi Host-Cell Invasion. Biochemistry 2025, 64, 2476–2488. [Google Scholar] [CrossRef]
  4. Porter, K.A.; Desta, I.; Kozakov, D.; Vajda, S. What method to use for protein–protein docking? Curr. Opin. Struct. Biol. 2019, 55, 1–7. [Google Scholar] [CrossRef]
  5. Harmalkar, A.; Gray, J.J. Advances to tackle backbone flexibility in protein docking. Curr. Opin. Struct. Biol. 2021, 67, 178–186. [Google Scholar] [CrossRef]
  6. Wu, J.; Jonniya, N.A.; Hirakis, S.P.; Olivieri, C.; Veglia, G.; Kornev, A.P.; Taylor, S.S. Role of the αC-β4 loop in protein kinase structure and dynamics. eLife 2024, 12, RP91980. [Google Scholar] [CrossRef]
  7. Wang, C.; Schueler-Furman, O.; Baker, D. Improved side-chain modeling for protein–protein docking. Protein Sci. 2005, 14, 1328–1339. [Google Scholar] [CrossRef]
  8. Goh, B.C.; Hadden, J.A.; Bernardi, R.C.; Singharoy, A.; McGreevy, R.; Rudack, T.; Cassidy, C.K.; Schulten, K. Computational methodologies for real-space structural refinement of large macromolecular complexes. Annu. Rev. Biophys. 2016, 45, 253–278. [Google Scholar] [CrossRef] [PubMed]
  9. May, A.; Zacharias, M. Accounting for global protein deformability during protein–protein and protein–ligand docking. Biochim. Biophys. Acta BBA Proteins Proteom. 2005, 1754, 225–231. [Google Scholar] [CrossRef]
  10. Kapoor, K.; Thangapandian, S.; Tajkhorshid, E. Extended-ensemble docking to probe dynamic variation of ligand binding sites during large-scale structural changes of proteins. Chem. Sci. 2022, 13, 4150–4169. [Google Scholar] [CrossRef] [PubMed]
  11. Gomes, D.E.; Yang, B.; Vanella, R.; Nash, M.A.; Bernardi, R.C. Integrating dynamic network analysis with AI for enhanced epitope prediction in PD-L1: Affibody interactions. J. Am. Chem. Soc. 2024, 146, 23842–23853. [Google Scholar] [CrossRef]
  12. Desta, I.T.; Porter, K.A.; Xia, B.; Kozakov, D.; Vajda, S. Performance and its limits in rigid body protein-protein docking. Structure 2020, 28, 1071–1081. [Google Scholar] [CrossRef] [PubMed]
  13. Melquiond, A.S.; Karaca, E.; Kastritis, P.L.; Bonvin, A.M. Next challenges in protein–protein docking: From proteome to interactome and beyond. Wiley Interdiscip. Rev. Comput. Mol. Sci. 2012, 2, 642–651. [Google Scholar] [CrossRef]
  14. Vakser, I.A. Challenges in protein docking. Curr. Opin. Struct. Biol. 2020, 64, 160–165. [Google Scholar] [CrossRef]
  15. Ocetkiewicz, K.M.; Czaplewski, C.; Krawczyk, H.; Lipska, A.G.; Liwo, A.; Proficz, J.; Sieradzan, A.K.; Czarnul, P. Multi-GPU UNRES for scalable coarse-grained simulations of very large protein systems. Comput. Phys. Commun. 2024, 298, 109112. [Google Scholar] [CrossRef]
  16. Ocetkiewicz, K.M.; Czaplewski, C.; Krawczyk, H.; Lipska, A.G.; Liwo, A.; Proficz, J.; Sieradzan, A.K.; Czarnul, P. UNRES-GPU for physics-based coarse-grained simulations of protein systems at biological time-and size-scales. Bioinformatics 2023, 39, btad391. [Google Scholar] [CrossRef]
  17. Yue, Y.; Li, S.; Cheng, Y.; Wang, L.; Hou, T.; Zhu, Z.; He, S. Integration of molecular coarse-grained model into geometric representation learning framework for protein-protein complex property prediction. Nat. Commun. 2024, 15, 9629. [Google Scholar] [CrossRef]
  18. Baaden, M.; Marrink, S.J. Coarse-grain modelling of protein–protein interactions. Curr. Opin. Struct. Biol. 2013, 23, 878–886. [Google Scholar] [CrossRef] [PubMed]
  19. Pierce, B.G.; Wiehe, K.; Hwang, H.; Kim, B.H.; Vreven, T.; Weng, Z. ZDOCK server: Interactive docking prediction of protein–protein complexes and symmetric multimers. Bioinformatics 2014, 30, 1771–1773. [Google Scholar] [CrossRef] [PubMed]
  20. Honorato, R.V.; Trellet, M.E.; Jiménez-García, B.; Schaarschmidt, J.J.; Giulini, M.; Reys, V.; Koukos, P.I.; Rodrigues, J.P.; Karaca, E.; van Zundert, G.C.; et al. The HADDOCK2. 4 web server for integrative modeling of biomolecular complexes. Nat. Protoc. 2024, 19, 3219–3241. [Google Scholar] [CrossRef]
  21. Lyskov, S.; Gray, J.J. The RosettaDock server for local protein–protein docking. Nucleic Acids Res. 2008, 36, W233–W238. [Google Scholar] [CrossRef]
  22. Sircar, A.; Gray, J.J. SnugDock: Paratope structural optimization during antibody-antigen docking compensates for errors in antibody homology models. PLoS Comput. Biol. 2010, 6, e1000644. [Google Scholar] [CrossRef]
  23. Alam, N.; Schueler-Furman, O. Modeling peptide-protein structure and binding using Monte Carlo sampling approaches: Rosetta FlexPepDock and FlexPepBind. In Modeling Peptide-Protein Interactions: Methods and Protocols; Springer: New York, NY, USA, 2017; pp. 139–169. [Google Scholar]
  24. Cavasotto, C.N.; Kovacs, J.A.; Abagyan, R.A. Representing receptor flexibility in ligand docking through relevant normal modes. J. Am. Chem. Soc. 2005, 127, 9632–9640. [Google Scholar] [CrossRef]
  25. Cavasotto, C.N. Normal mode-based approaches in receptor ensemble docking. In Computational Drug Discovery and Design; Springer: New York, NY, USA, 2011; pp. 157–168. [Google Scholar]
  26. Jamali, K.; Käll, L.; Zhang, R.; Brown, A.; Kimanius, D.; Scheres, S.H. Automated model building and protein identification in cryo-EM maps. Nature 2024, 628, 450–457. [Google Scholar] [CrossRef] [PubMed]
  27. Zhang, Z.; Cai, Y.; Zhang, B.; Zheng, W.; Freddolino, L.; Zhang, G.; Zhou, X. EM2: Assembling protein complex structures from cryo-EM maps through intertwined chain and domain fitting. Brief. Bioinform. 2024, 25, bbae113. [Google Scholar] [CrossRef] [PubMed]
  28. Zhang, Z.; Xu, L.; Zhang, S.; Peng, C.; Zhang, G.; Zhou, X. EMol: Modeling protein-nucleic acid complex structures from cryo-EM maps by coupling chain assembly with map segmentation. Nucleic Acids Res. 2025, 53, W228–W237. [Google Scholar] [CrossRef]
  29. Wang, X.; Zhu, H.; Terashi, G.; Taluja, M.; Kihara, D. DiffModeler: Large macromolecular structure modeling for cryo-EM maps using a diffusion model. Nat. Methods 2024, 21, 2307–2317. [Google Scholar] [CrossRef]
  30. Jumper, J.; Evans, R.; Pritzel, A.; Green, T.; Figurnov, M.; Ronneberger, O.; Tunyasuvunakool, K.; Bates, R.; Žídek, A.; Potapenko, A.; et al. Highly accurate protein structure prediction with AlphaFold. Nature 2021, 596, 583–589. [Google Scholar] [CrossRef]
  31. Zheng, W.; Wuyun, Q.; Li, Y.; Zhang, C.; Freddolino, L.; Zhang, Y. Improving deep learning protein monomer and complex structure prediction using DeepMSA2 with huge metagenomics data. Nat. Methods 2024, 21, 279–289. [Google Scholar] [CrossRef] [PubMed]
  32. Webb, B.; Sali, A. Comparative protein structure modeling using MODELLER. Curr. Protoc. Bioinform. 2016, 54, 5–6. [Google Scholar] [CrossRef]
  33. Braxton, J.R.; Shao, H.; Tse, E.; Gestwicki, J.E.; Southworth, D.R. Asymmetric apical domain states of mitochondrial Hsp60 coordinate substrate engagement and chaperonin assembly. Nat. Struct. Mol. Biol. 2024, 31, 1848–1858. [Google Scholar] [CrossRef]
  34. Caruso Bavisotto, C.; Alberti, G.; Vitale, A.M.; Paladino, L.; Campanella, C.; Rappa, F.; Gorska, M.; Conway de Macario, E.; Cappello, F.; Macario, A.J.; et al. Hsp60 post-translational modifications: Functional and pathological consequences. Front. Mol. Biosci. 2020, 7, 95. [Google Scholar] [CrossRef] [PubMed]
  35. Zíková, A.; Panigrahi, A.K.; Uboldi, A.D.; Dalley, R.A.; Handman, E.; Stuart, K. Structural and functional association of Trypanosoma brucei MIX protein with cytochrome c oxidase complex. Eukaryot. Cell 2008, 7, 1994–2003. [Google Scholar] [CrossRef]
  36. Aslett, M.; Aurrecoechea, C.; Berriman, M.; Brestelli, J.; Brunk, B.P.; Carrington, M.; Depledge, D.P.; Fischer, S.; Gajria, B.; Gao, X.; et al. TriTrypDB: A functional genomic resource for the Trypanosomatidae. Nucleic Acids Res. 2010, 38, D457–D462. [Google Scholar] [CrossRef] [PubMed]
  37. Mirdita, M.; Schütze, K.; Moriwaki, Y.; Heo, L.; Ovchinnikov, S.; Steinegger, M. ColabFold: Making protein folding accessible to all. Nat. Methods 2022, 19, 679–682. [Google Scholar] [CrossRef] [PubMed]
  38. Varadi, M.; Anyango, S.; Deshpande, M.; Nair, S.; Natassia, C.; Yordanova, G.; Yuan, D.; Stroe, O.; Wood, G.; Laydon, A.; et al. AlphaFold Protein Structure Database: Massively expanding the structural coverage of protein-sequence space with high-accuracy models. Nucleic Acids Res. 2022, 50, D439–D444. [Google Scholar] [CrossRef] [PubMed]
  39. Zimmermann, L.; Stephens, A.; Nam, S.Z.; Rau, D.; Kübler, J.; Lozajic, M.; Gabler, F.; Söding, J.; Lupas, A.N.; Alva, V. A completely reimplemented MPI bioinformatics toolkit with a new HHpred server at its core. J. Mol. Biol. 2018, 430, 2237–2243. [Google Scholar] [CrossRef]
  40. McGuffin, L.J.; Bryson, K.; Jones, D.T. The PSIPRED protein structure prediction server. Bioinformatics 2000, 16, 404–405. [Google Scholar] [CrossRef]
  41. Lee, G.R.; Won, J.; Heo, L.; Seok, C. GalaxyRefine2: Simultaneous refinement of inaccurate local regions and overall protein structure. Nucleic Acids Res. 2019, 47, W451–W455. [Google Scholar] [CrossRef]
  42. Williams, C.J.; Headd, J.J.; Moriarty, N.W.; Prisant, M.G.; Videau, L.L.; Deis, L.N.; Verma, V.; Keedy, D.A.; Hintze, B.J.; Chen, V.B.; et al. MolProbity: More and better reference data for improved all-atom structure validation. Protein Sci. 2018, 27, 293–315. [Google Scholar] [CrossRef]
  43. Ramachandran, G.N.; Ramakrishnan, C.; Sasisekharan, V. Stereochemistry of polypeptide chain configurations. J. Mol. Biol. 1963, 7, 95–99. [Google Scholar] [CrossRef]
  44. Chen, V.B.; Arendall, W.B.; Headd, J.J.; Keedy, D.A.; Immormino, R.M.; Kapral, G.J.; Murray, L.W.; Richardson, J.S.; Richardson, D.C. MolProbity: All-atom structure validation for macromolecular crystallography. Acta Crystallogr. Sect. D Biol. Crystallogr. 2010, 66, 12–21. [Google Scholar] [CrossRef]
  45. Lüthy, R.; Bowie, J.U.; Eisenberg, D. Assessment of protein models with three-dimensional profiles. Nature 1992, 356, 83–85. [Google Scholar] [CrossRef]
  46. Colovos, C.; Yeates, T.O. Verification of protein structures: Patterns of nonbonded atomic interactions. Protein Sci. 1993, 2, 1511–1519. [Google Scholar] [CrossRef]
  47. Dolinsky, T.J.; Nielsen, J.E.; McCammon, J.A.; Baker, N.A. PDB2PQR: An automated pipeline for the setup of Poisson–Boltzmann electrostatics calculations. Nucleic Acids Res. 2004, 32, W665–W667. [Google Scholar] [CrossRef]
  48. Jurrus, E.; Engel, D.; Star, K.; Monson, K.; Brandi, J.; Felberg, L.E.; Brookes, D.H.; Wilson, L.; Chen, J.; Liles, K.; et al. Improvements to the APBS biomolecular solvation software suite. Protein Sci. 2018, 27, 112–128. [Google Scholar] [CrossRef] [PubMed]
  49. Uboldi, A.D.; Lueder, F.B.; Walsh, P.; Spurck, T.; McFadden, G.I.; Curtis, J.; Likic, V.A.; Perugini, M.A.; Barson, M.; Lithgow, T.; et al. A mitochondrial protein affects cell morphology, mitochondrial segregation and virulence in Leishmania. Int. J. Parasitol. 2006, 36, 1499–1514. [Google Scholar] [CrossRef] [PubMed]
  50. Humphrey, W.; Dalke, A.; Schulten, K. VMD: Visual molecular dynamics. J. Mol. Graph. 1996, 14, 33–38. [Google Scholar] [CrossRef]
  51. Sali, A.; Blundell, T. Comparative protein modelling by satisfaction of spatial restraints. J. Mol. Biol. 1993, 234, 779. [Google Scholar] [CrossRef] [PubMed]
  52. Jorgensen, W.L.; Chandrasekhar, J.; Madura, J.D.; Impey, R.W.; Klein, M.L. Comparison of simple potential functions for simulating liquid water. J. Chem. Phys. 1983, 79, 926–935. [Google Scholar] [CrossRef]
  53. Darden, T.; York, D.; Pedersen, L. Particle mesh Ewald: An N log (N) method for Ewald sums in large systems. J. Chem. Phys. 1993, 98, 10089–10092. [Google Scholar] [CrossRef]
  54. Ribeiro, J.V.; Bernardi, R.C.; Rudack, T.; Stone, J.E.; Phillips, J.C.; Freddolino, P.L.; Schulten, K. QwikMD—Integrative molecular dynamics toolkit for novices and experts. Sci. Rep. 2016, 6, 26536. [Google Scholar] [CrossRef]
  55. Kozakov, D.; Hall, D.R.; Xia, B.; Porter, K.A.; Padhorny, D.; Yueh, C.; Beglov, D.; Vajda, S. The ClusPro web server for protein–protein docking. Nat. Protoc. 2017, 12, 255–278. [Google Scholar] [CrossRef]
  56. Spivak, M.; Stone, J.E.; Ribeiro, J.; Saam, J.; Freddolino, P.L.; Bernardi, R.C.; Tajkhorshid, E. VMD as a platform for interactive small molecule preparation and visualization in quantum and classical simulations. J. Chem. Inf. Model. 2023, 63, 4664–4678. [Google Scholar] [CrossRef]
  57. Scheurer, M.; Rodenkirch, P.; Siggel, M.; Bernardi, R.C.; Schulten, K.; Tajkhorshid, E.; Rudack, T. PyContact: Rapid, customizable, and visual analysis of noncovalent interactions in MD simulations. Biophys. J. 2018, 114, 577–583. [Google Scholar] [CrossRef]
  58. Barreto, C.A.; Baptista, S.J.; Preto, A.J.; Matos-Filipe, P.; Mourao, J.; Melo, R.; Moreira, I. Prediction and targeting of GPCR oligomer interfaces. Prog. Mol. Biol. Transl. Sci. 2020, 169, 105–149. [Google Scholar] [PubMed]
  59. Parate, S.; Rampogu, S.; Lee, G.; Hong, J.C.; Lee, K.W. Exploring the binding interaction of Raf kinase inhibitory protein with the N-terminal of C-Raf through molecular docking and molecular dynamics simulation. Front. Mol. Biosci. 2021, 8, 655035. [Google Scholar] [CrossRef]
  60. Li, Y.; Mohanty, S.; Nilsson, D.; Hansson, B.; Mao, K.; Irbäck, A. When a foreign gene meets its native counterpart: Computational biophysics analysis of two PgiC loci in the grass Festuca ovina. Sci. Rep. 2020, 10, 18752. [Google Scholar] [CrossRef] [PubMed]
  61. Gomes, P.S.; Gomes, D.E.; Bernardi, R.C. Protein structure prediction in the era of AI: Challenges and limitations when applying to in silico force spectroscopy. Front. Bioinform. 2022, 2, 983306. [Google Scholar] [CrossRef] [PubMed]
  62. Xu, Q.; Dunbrack, R.L., Jr. ProtCID: A data resource for structural information on protein interactions. Nat. Commun. 2020, 11, 711. [Google Scholar] [CrossRef]
  63. Shoemaker, B.A.; Panchenko, A.R.; Bryant, S.H. Finding biologically relevant protein domain interactions: Conserved binding mode analysis. Protein Sci. 2006, 15, 352–361. [Google Scholar] [CrossRef]
  64. Alsop, J.D.; Mitchell, J.C. Interolog interfaces in protein–protein docking. Proteins Struct. Funct. Bioinform. 2015, 83, 1940–1946. [Google Scholar] [CrossRef] [PubMed]
  65. Wang, L.; Xu, X.; Jiang, Z.; You, Q. Modulation of protein fate decision by small molecules: Targeting molecular chaperone machinery. Acta Pharm. Sin. B 2020, 10, 1904–1925. [Google Scholar] [CrossRef]
  66. Cheng, M.Y.; Hartl, F.U.; Martin, J.; Pollock, R.A.; Kalousek, F.; Neuper, W.; Hallberg, E.M.; Hallberg, R.L.; Horwich, A.L. Mitochondrial heat-shock protein hsp60 is essential for assembly of proteins imported into yeast mitochondria. Nature 1989, 337, 620–625. [Google Scholar] [CrossRef]
  67. Ansari, M.Y.; Mande, S.C. A glimpse into the structure and function of atypical type I chaperonins. Front. Mol. Biosci. 2018, 5, 31. [Google Scholar] [CrossRef]
  68. Hayer-Hartl, M.K.; Martin, J.; Hartl, F.U. Asymmetrical interaction of GroEL and GroES in the ATPase cycle of assisted protein folding. Science 1995, 269, 836–841. [Google Scholar] [CrossRef]
  69. Syed, A.; Zhai, J.; Guo, B.; Zhao, Y.; Wang, J.C.Y.; Chen, L. Cryo-EM structure and molecular dynamic simulations explain the enhanced stability and ATP activity of the pathological chaperonin mutant. Structure 2024, 32, 575–584. [Google Scholar] [CrossRef]
  70. Gorman, M.A.; Uboldi, A.D.; Walsh, P.J.; Tan, K.S.; Hansen, G.; Huyton, T.; Ji, H.; Curtis, J.; Kedzierski, L.; Papenfuss, A.T.; et al. Crystal structure of the Leishmania major MIX protein: A scaffold protein that mediates protein–protein interactions. Protein Sci. 2011, 20, 1060–1068. [Google Scholar] [CrossRef] [PubMed]
  71. Sternberg, M.J.; Gabb, H.A.; Jackson, R.M.; Moont, G. Protein-protein docking: Generation and filtering of complexes. In Protein Structure Prediction: Methods and Protocols; Humana Press: Totowa, NJ, USA, 2000; pp. 399–415. [Google Scholar]
  72. Shen, M.y.; Sali, A. Statistical potential for assessment and prediction of protein structures. Protein Sci. 2006, 15, 2507–2524. [Google Scholar] [CrossRef] [PubMed]
  73. Gomes, P.S.; Forrester, M.; Pace, M.; Gomes, D.E.; Bernardi, R.C. May the force be with you: The role of hyper-mechanostability of the bone sialoprotein binding protein during early stages of Staphylococci infections. Front. Chem. 2023, 11, 1107427. [Google Scholar] [CrossRef]
  74. Chantraine, C.; Gomes, P.S.F.C.; Mathelié-Guinlet, M.; Gomes, D.E.B.; Zheng, Z.; Clowry, J.; Turley, M.B.; Irvine, A.D.; Geoghegan, J.A.; Bernardi, R.C.; et al. Ultrastrong Staphylococcus aureus adhesion to Human Skin: Calcium as a key regulator of noncovalent interactions. Sci. Adv. 2025, 11, eadu7457. [Google Scholar] [CrossRef]
  75. Klemm, P.; Schembri, M.A. Bacterial adhesins: Function and structure. Int. J. Med. Microbiol. 2000, 290, 27–35. [Google Scholar] [CrossRef]
  76. Foster, T.J.; Geoghegan, J.A.; Ganesh, V.K.; Höök, M. Adhesion, invasion and evasion: The many functions of the surface proteins of Staphylococcus aureus. Nat. Rev. Microbiol. 2014, 12, 49–62. [Google Scholar] [CrossRef]
  77. dos Santos Natividade, R.; Koehler, M.; Gomes, P.S.; Simpson, J.D.; Smith, S.C.; Gomes, D.E.; de Lhoneux, J.; Yang, J.; Ray, A.; Dermody, T.S.; et al. Deciphering molecular mechanisms stabilizing the reovirus-binding complex. Proc. Natl. Acad. Sci. USA 2023, 120, e2220741120. [Google Scholar] [CrossRef]
  78. Zhang, Q.; Rosa, R.S.; Ray, A.; Durlet, K.; Dorrazehi, G.M.; Bernardi, R.C.; Alsteens, D. Probing SARS-CoV-2 membrane binding peptide via single-molecule AFM-based force spectroscopy. Nat. Commun. 2025, 16, 6. [Google Scholar] [CrossRef] [PubMed]
  79. Iannacone, M.; Guidotti, L.G. Immunobiology and pathogenesis of hepatitis B virus infection. Nat. Rev. Immunol. 2022, 22, 19–32. [Google Scholar] [CrossRef]
  80. Seppälä, J.; Bernardi, R.C.; Haataja, T.J.; Hellman, M.; Pentikäinen, O.T.; Schulten, K.; Permi, P.; Ylänne, J.; Pentikäinen, U. Skeletal dysplasia mutations effect on human filamins’ structure and mechanosensing. Sci. Rep. 2017, 7, 4218. [Google Scholar] [CrossRef] [PubMed]
  81. Jain, M.; Weber, A.; Maly, K.; Manjaly, G.; Deek, J.; Tsvyetkova, O.; Stulić, M.; Toca-Herrera, J.L.; Jantsch, M.F. A-to-I RNA editing of Filamin A regulates cellular adhesion, migration and mechanical properties. FEBS J. 2022, 289, 4580–4601. [Google Scholar] [CrossRef]
  82. Johnson, J.; González-Morales, N. Computational Screening of Filamin Mechanical Binding Proteins using AlphaFold2. Biochem. Cell Biol. 2025, 103, 1–11. [Google Scholar] [CrossRef] [PubMed]
  83. Cann, I.; Pereira, G.V.; Abdel-Hamid, A.M.; Kim, H.; Wefers, D.; Kayang, B.B.; Kanai, T.; Sato, T.; Bernardi, R.C.; Atomi, H.; et al. Thermophilic degradation of hemicellulose, a critical feedstock in the production of bioenergy and other value-added products. Appl. Environ. Microbiol. 2020, 86, e02296-19. [Google Scholar] [CrossRef]
  84. Melo, M.C.; Bernardi, R.C. AI Uncovers the Rapid Activation of Catch-Bonds under Force. J. Chem. Theory Comput. 2025; online ahead of print. [Google Scholar] [CrossRef]
  85. Wang, T.; Ahmad, S.; Cruz-Lebrón, A.; Ernst, S.E.; Olivos Caicedo, K.Y.; Jeong, Y.; Binion, B.; Mbuvi, P.; Dutta, D.; Fernandez-Materan, F.V.; et al. An expanded metabolic pathway for androgen production by commensal bacteria. Nat. Microbiol. 2025, 10, 1084–1098. [Google Scholar] [CrossRef] [PubMed]
  86. Yang, B.; Gomes, D.E.; Liu, Z.; Santos, M.S.; Li, J.; Bernardi, R.C.; Nash, M.A. Engineering the Mechanical Stability of a Therapeutic Complex between Affibody and Programmed Death-Ligand 1 by Anchor Point Selection. ACS Nano 2024, 18, 31912–31922. [Google Scholar] [CrossRef]
  87. Lim, H.; Cankara, F.; Tsai, C.J.; Keskin, O.; Nussinov, R.; Gursoy, A. Artificial intelligence approaches to human-microbiome protein–protein interactions. Curr. Opin. Struct. Biol. 2022, 73, 102328. [Google Scholar] [CrossRef]
  88. Kim, D.N.; McNaughton, A.D.; Kumar, N. Leveraging artificial intelligence to expedite antibody design and enhance antibody–antigen interactions. Bioengineering 2024, 11, 185. [Google Scholar] [CrossRef]
  89. Cockell, S.J.; Oliva, B.; Jackson, R.M. Structure-based evaluation of in silico predictions of protein–protein interactions using Comparative Docking. Bioinformatics 2007, 23, 573–581. [Google Scholar] [CrossRef]
  90. Bayarsaikhan, B.; Zsidó, B.Z.; Börzsei, R.; Hetényi, C. Efficient Refinement of Complex Structures of Flexible Histone Peptides Using Post-Docking Molecular Dynamics Protocols. Int. J. Mol. Sci. 2024, 25, 5945. [Google Scholar] [CrossRef] [PubMed]
  91. Kato, K.; Nakayoshi, T.; Kurimoto, E.; Oda, A. Molecular dynamics simulations for the protein–ligand complex structures obtained by computational docking studies using implicit or explicit solvents. Chem. Phys. Lett. 2021, 781, 139022. [Google Scholar] [CrossRef]
  92. Vreven, T.; Moal, I.H.; Vangone, A.; Pierce, B.G.; Kastritis, P.L.; Torchala, M.; Chaleil, R.; Jiménez-García, B.; Bates, P.A.; Fernandez-Recio, J.; et al. Updates to the integrated protein–protein interaction benchmarks: Docking benchmark version 5 and affinity benchmark version 2. J. Mol. Biol. 2015, 427, 3031–3041. [Google Scholar] [CrossRef]
  93. Santos, L.H.; Ferreira, R.S.; Caffarena, E.R. Integrating molecular docking and molecular dynamics simulations. In Docking Screens for Drug Discovery; Springer: New York, NY, USA, 2019; pp. 13–34. [Google Scholar]
  94. Sahu, S.N.; Pattanayak, S.K. Molecular docking and molecular dynamics simulation studies on PLCE1 encoded protein. J. Mol. Struct. 2019, 1198, 126936. [Google Scholar] [CrossRef]
  95. Vidal-Limon, A.; Aguilar-Toalá, J.E.; Liceaga, A.M. Integration of molecular docking analysis and molecular dynamics simulations for studying food proteins and bioactive peptides. J. Agric. Food Chem. 2022, 70, 934–943. [Google Scholar] [CrossRef] [PubMed]
  96. Bernardi, R.C.; Melo, M.C.; Schulten, K. Enhanced sampling techniques in molecular dynamics simulations of biological systems. Biochim. Biophys. Acta BBA Gen. Subj. 2015, 1850, 872–877. [Google Scholar] [CrossRef]
  97. Perilla, J.R.; Goh, B.C.; Cassidy, C.K.; Liu, B.; Bernardi, R.C.; Rudack, T.; Yu, H.; Wu, Z.; Schulten, K. Molecular dynamics simulations of large macromolecular complexes. Curr. Opin. Struct. Biol. 2015, 31, 64–74. [Google Scholar] [CrossRef]
  98. Bryant, P.; Pozzati, G.; Zhu, W.; Shenoy, A.; Kundrotas, P.; Elofsson, A. Predicting the structure of large protein complexes using AlphaFold and Monte Carlo tree search. Nat. Commun. 2022, 13, 6028. [Google Scholar] [CrossRef]
  99. Hegedűs, T.; Geisler, M.; Lukács, G.L.; Farkas, B. Ins and outs of AlphaFold2 transmembrane protein structure predictions. Cell. Mol. Life Sci. 2022, 79, 73. [Google Scholar] [CrossRef]
  100. Han, X.; Terashi, G.; Christoffer, C.; Chen, S.; Kihara, D. VESPER: Global and local cryo-EM map alignment using local density vectors. Nat. Commun. 2021, 12, 2090. [Google Scholar] [CrossRef] [PubMed]
  101. Cai, Y.; Zhang, Z.; Xu, X.; Xu, L.; Chen, Y.; Zhang, G.; Zhou, X. Fitting atomic structures into Cryo-EM maps by coupling deep learning-enhanced map processing with global-local optimization. J. Chem. Inf. Model. 2025, 65, 3800–3811. [Google Scholar] [CrossRef] [PubMed]
  102. Wriggers, W.; Milligan, R.A.; McCammon, J.A. Situs: A package for docking crystal structures into low-resolution maps from electron microscopy. J. Struct. Biol. 1999, 125, 185–195. [Google Scholar] [CrossRef]
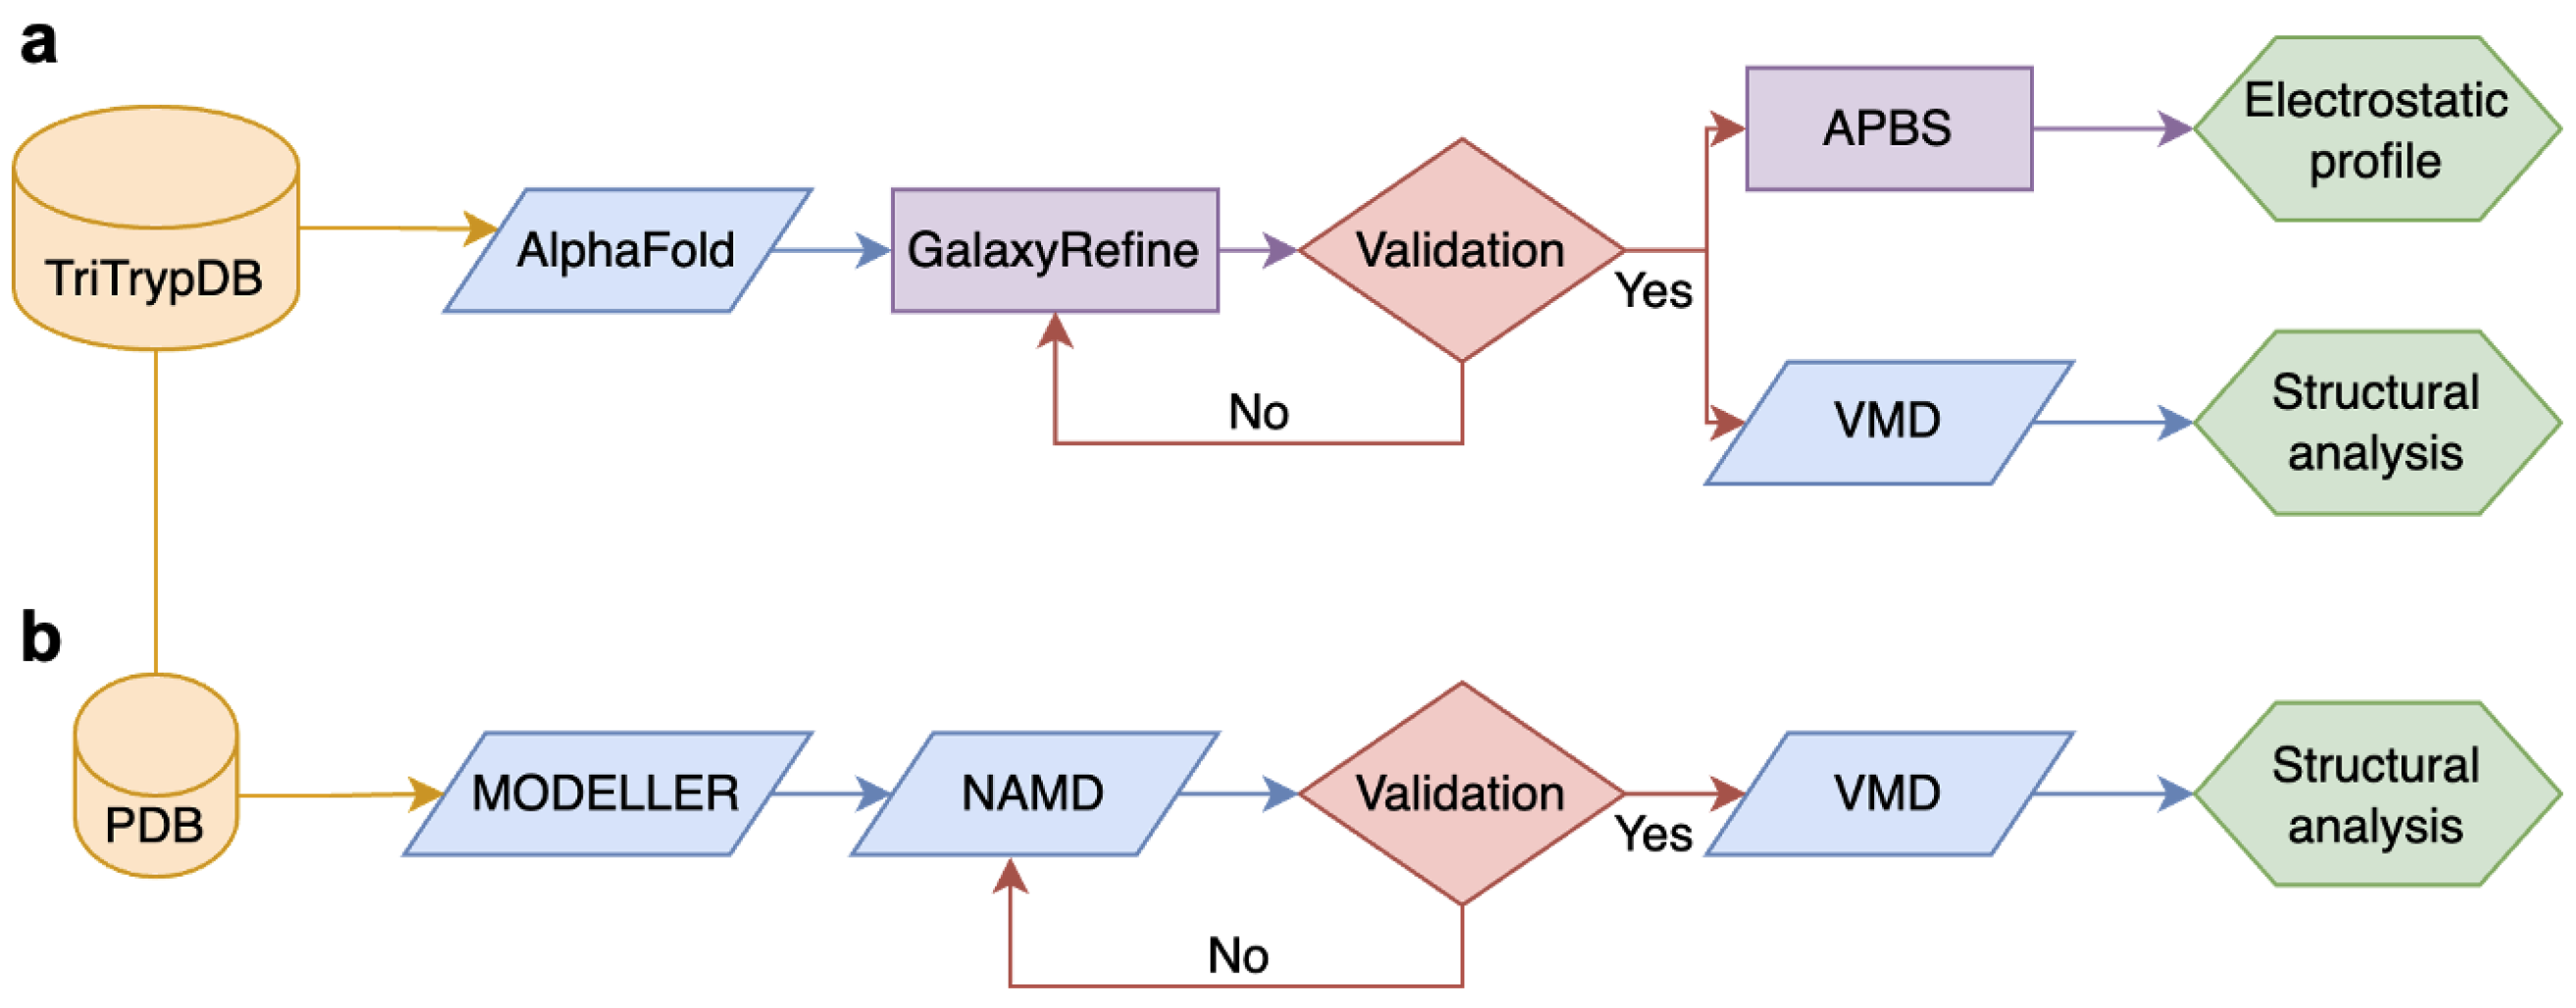
Figure 1. Schematic overview of the structural modeling pipeline. (a) Workflow for modeling MIX and monomeric states of Hsp60. (b) Workflow for modeling the heptameric double-ring considering different conformational states of Hsp60.
Applbiosci 04 00048 g001
Figure 2. Hsp60 mechanism and domain organization. (a) Mechanism of Hsp60 action. An unfolded protein enters the apo state, after which ATP binding triggers conformational changes, allowing Hsp10 to bind to the apical domain of Hsp60. The substrate protein undergoes folding, and ATP is hydrolyzed, releasing Pi and ADP. This induces another conformational change in Hsp60, leading to the dissociation of Hsp10 and the release of the folded protein. Hsp60 then resets, preparing for the next cycle. (b) Domain organization of Hsp60. The apical domain is shown in light pink, adopting the ‘up’ conformation after ATP binding and the ‘down’ conformation in black before ATP binding. The intermediate domain is depicted in light violet, while the equatorial domain appears in violet. ATP is bound to the equatorial domain and is represented in stick form with carbon atoms in gray, and ions are shown in van der Waals representation, where Mg2+ is pink and K+ is cyan.
Applbiosci 04 00048 g002
Figure 3. MIX sequence and structural analysis. (a) Alignment of MIX sequences from trypanosomatids with L. major (PDB ID: 3HA4), with  α -helices (cylinders) and  β -sheets (arrows) superimposed. The predicted transmembrane helix (red) is omitted in (b). Dimerization residues are highlighted in yellow; mutations P157L and N158K in pink and blue. (b) L. major MIX structure colored by sequence similarity (MultiSeq, BLOSUM60; red = 0%, blue = 100%). (c) AlphaFold-complemented MIX model, secondary structures in green scale, dimerization residues in yellow, mutations in pink/blue.
Applbiosci 04 00048 g003
Figure 4. MIX dimer interface residues profile. (a) Electrostatic profile (pH 8, −5 to +5 kT/e) of the dimer interface region, with R86, E87, and E115 indicated. (b) Same view as (a), colored by residue type: non-polar (white), basic (blue), acidic (red), polar (green).
Applbiosci 04 00048 g004
Figure 5. Hsp60 sequential and structural details. (a) Structural conservation evaluation of Hsp60ATP-Hsp10 across species. The MultiSeq VMD tool was used to align and color the sequences based on BLOSUM60, with red representing 0% similarity and blue representing 100%. The region shown in gray on the surface corresponds to the part depicted in (b), rotated 90 degrees. (b) Electrostatic profile analysis of the structure at pH 8, with a range from −5 kT/e to 5 kT/e on the scale.
Applbiosci 04 00048 g005
Figure 6. MIX:Hsp60 docking results. (a) Result for minimized structure. (b) Result for equilibrated structure and in (c) for ensemble-refined structure. MIX chain A is represented in dark green and chain B in light green. Hsp60 is represented in pink scale and Hsp10 in purple scales.
Applbiosci 04 00048 g006
Figure 7. RMSD and per-residue flexibility of Hsp60 subunits during MD simulations. (a) RMSD values during equilibration and the 500 ns production run, calculated relative to frame 0. (b) RMSF values computed from the C α  atoms of Hsp60 chains after backbone alignment. Blue regions represent residues with minimal structural variation (rigid), whereas red regions indicate residues with higher flexibility.
Applbiosci 04 00048 g007
Figure 8. Interaction profile of Hsp60 in the apo (ATP-free) state with MIX. (a) Minimized structure: residues at the binding interface are shown in Van der Waals representation and colored by residue type; the corresponding contact heatmap (cutoff 3.5 Å) displays MIX residues on the y-axis and Hsp60 residues on the x-axis. (b) Equilibrated structure (100 ns) and (c) ensemble-refined structure (500 ns).
Applbiosci 04 00048 g008
Figure 9. Interaction profile of Hsp60ATP state with MIX. (a) Minimized structure: residues at the binding interface are shown in Van der Waals representation and colored by residue type; the corresponding contact heatmap (cutoff 3.5 Å) displays MIX residues on the y-axis and Hsp60 residues on the x-axis. (b) Equilibrated structure (100 ns) and (c) ensemble-refined structure (500 ns).
Applbiosci 04 00048 g009
Figure 10. Interaction profile of Hsp60ATP–Hsp10 state with MIX. (a) Minimized structure: residues at the binding interface are shown in Van der Waals representation and colored by residue type; the corresponding contact heatmap (cutoff 3.5 Å) displays MIX residues on the y-axis and Hsp60 residues on the x-axis. (b) Equilibrated structure (100 ns) and (c) ensemble-refined structure (500 ns).
Applbiosci 04 00048 g010
Figure 11. MIX:Hsp60 interaction hypotheses. Schematic representation of the Hsp60 chaperonin cycle and proposed MIX binding modes. In the apo state, unfolded proteins enter the central cavity, followed by ATP binding, which induces conformational changes and allows Hsp10 to attach to the apical domains. Substrates fold inside the cavity, ATP is hydrolyzed, and subsequent conformational changes release both Hsp10 and the folded protein. Three MIX interaction hypotheses are proposed: (1) central cavity binding, where MIX regulates substrate entry; (2) equatorial ATP-site binding, where MIX modulates ATP binding/hydrolysis and cycle timing; and (3) apical-domain binding, where MIX competes with Hsp10, decreasing the number of fully formed folding chambers.
Applbiosci 04 00048 g011
Table 1. MIX alignment matrix (%).
LbrLiLdTbTc3HA4
Lbr1009493687375
Li9410099677377
Ld9399100667276
Tb6867661008356
Tc7373728310060
3HA47577765660100
Lbr = LbrM.08.0970:mRNA; Li = LINF_080016900-T1; Ld = LdBPK_081110.1.1; Tb = Tb927.5.3040:mRNA; Tc = TcCLB.510173.70:mRNA; 3HA4 = Leishmania major PDB entry.
Table 2. Hsp60 alignment matrix (%).
LbLiLdTbTcLmjHs
Lb10097.4797.4784.8553.0352.3747.89
Li97.4710010084.8555.8655.4448.07
Ld97.4710010084.8555.8655.4448.07
Tb84.8584.8584.8510055.5054.5546.97
Tc56.0455.8655.8655.5010074.2453.03
Lmj55.6155.4455.4454.5574.2410052.37
Hs47.8948.0748.0746.9753.0352.37100
Lb = LbrM.32.2030; Li = LINF_320024300; Ld = LdBPK_321940.1; Tb = Tb927.11.15040; Tc = TcCLB.507641.290; Lmj = LmjF.36.2020; Hs = PDBid 8G7N.
Table 3. Validation metrics for Hsp60 models in different conformational states.
MetricHsp60apoHsp60ATPHsp60ATP-Hsp10
Template8G7J8G7L8G7N
Template Resolution (Å)3.402.502.70
RMSD (Template → Pre-Mini) (Å)0.2280.3320.485
RMSD (Template → Post-Mini) (Å)0.6190.7550.727
DOPE Score−398,109.16−791,101.88−621,065.00
MolProbity Score1.640.742.35
ClashScore1.50.773.95
Poor Rotamers (%)4.80.267.93
Ramachandran Analysis
Favored (%)96.598.6792.1
Allowed (%)99.410098.1
Disallowed (%)0.5601.88
Note: RMSD (Template → Pre-Mini) = RMSD with Modeller results and template; RMSD (Template → Post-Mini) = RMSD after minimization relative to the template.
Disclaimer/Publisher’s Note: The statements, opinions and data contained in all publications are solely those of the individual author(s) and contributor(s) and not of MDPI and/or the editor(s). MDPI and/or the editor(s) disclaim responsibility for any injury to people or property resulting from any ideas, methods, instructions or products referred to in the content.