Article

AssayBLAST: A Bioinformatic Tool for In Silico Analysis of Molecular Multiparameter Assays

1
Leibniz Institute of Photonic Technology (IPHT), 07745 Jena, Germany
2
InfectoGnostics Research Campus, 07743 Jena, Germany
3
Institute for Medical Microbiology and Virology, Dresden University Hospital, 01307 Dresden, Germany
4
Institute of Physical Chemistry, Friedrich-Schiller University, 07743 Jena, Germany
5
Leibniz Institute of Photonic Technology, Member of the Research Alliance “Leibniz Health Technologies” and The Leibniz Centre for Photonics in Infection Research (LPI), 07747 Jena, Germany
*
Author to whom correspondence should be addressed.
Appl. Biosci. 2025, 4(2), 18; https://doi.org/10.3390/applbiosci4020018
Submission received: 20 December 2024 / Revised: 30 January 2025 / Accepted: 26 February 2025 / Published: 1 April 2025

Abstract

:
Accurate primer and probe design is essential for molecular applications, including PCR, qPCR, and molecular multiparameter assays like microarrays. The novel software tool AssayBLAST addresses this need by simulating interactions between oligonucleotides and target sequences. AssayBLAST handles large sets of primer and probe sequences simultaneously and supports comprehensive assay designs by allowing users to identify off-target binding, calculate melting temperatures, and ensure strand specificity, a critical but often overlooked aspect. AssayBLAST performs two optimized BLAST-based searches for each primer or probe sequence, checking the forward and reverse strands for off-target interactions and strand-specific binding accuracy. The results are compiled into a mapping table containing binding sites, mismatches, and strand orientation, allowing users to validate large sets of oligonucleotides across predefined custom databases for a complete and optimal theoretical assay design. AssayBLAST was evaluated against experimental Staphylococcus aureus microarray data, achieving 97.5% accuracy in predicting probe–target hybridization outcomes. This high accuracy demonstrates the method’s effectiveness in reliably using BLAST hits and mismatch counts to predict microarray results. AssayBLAST provides a reliable, scalable solution for in silico primer and probe validation, effectively supporting large-scale assay designs and optimizations. Its accurate prediction of hybridization outcomes demonstrates its utility in enhancing the efficiency and reliability of molecular assays.

1. Introduction

The ability of primer and probe oligonucleotides to bind specifically and stringently to target DNA in a given diagnostic sample is a crucial element of molecular applications such as PCR, qPCR, isothermal amplification reactions, and molecular assays like DNA microarrays [1,2,3,4]. Every primer and probe design should include a method to validate the designed oligonucleotides in silico before spending resources on wet lab experiments and to ensure their success. A tool suitable for the task of verifying entire assays should enable the simulation of interactions with user-provided target genomes, identify potential off-target bindings, calculate melting temperatures (Tm) [5], and detect mutations in target sequences that could reduce the specificity and sensitivity of primers and probes. Additionally, the tool should streamline the creation of BLAST databases, execute BLAST searches efficiently, analyze mismatches between target genomes, and provide oligos to help users analyze the binding capabilities of their designed oligo sets against a custom target database [6]. One often neglected aspect of primer and probe design is the strand specificity of the oligos. Primers and probes can only function as intended if the direction is correct. In the case of designing amplification oligos for a qPCR, the forward primer and probe have to be designed on the forward strand, and the reverse primer has to be designed on the reverse complementary sequence [1]. When designing only one primer for linear amplification and a probe for a DNA microarray-based assay [7,8], if the probe is on the forward strand, the primer must be located downstream of the probe on the reverse complementary strand [9]. Most primer evaluation tools like PrimerEvalPy [10] or the Integrated DNA Technologies OligoAnalyzer (accessed 23 November 2024; available at https://www.idtdna.com/pages/tools) do not check for this important attribute. None of the currently available tools are designed to handle large sets of primers and probes, as they are used in more complex assay designs. Furthermore, the tool should address strand specificity by performing two BLAST searches: one using all primers and probes in the direction provided and another using their reverse complementary sequences. This approach accounts for database entries with unknown orientations.
The AssayBLAST pipeline combines the results of the two BLAST searches, a forward and a reverse complementary search, into a comprehensive result matrix table [11]. This table should include all hits, mismatch counts, and the positions of the BLAST hits, enabling users to quickly verify whether the primer and probe combinations are found on the correct strands and to identify any nonspecific bindings. The “Basic Local Alignment Search Tool”—in short, BLAST—was developed by Stephen F. Altschul et al. in 1990 [11] and has since been a widely used tool for rapid sequence comparisons. BLAST searches offer a rapid and efficient way to perform imprecise text searches for short sequences, such as primers and probes, within large genomic datasets, making BLAST an ideal tool for detecting the presence of target sequences in user-provided genomes. The ability to detect hits with multiple mismatches is crucial, especially for analyzing the off-target binding of oligonucleotides. The numerous parameters that adjust BLAST’s search properties enable precise customization to meet specific requirements.
To show that BLAST hits can reliably predict the outcomes of hybridization experiments, we compared the AssayBLAST predictions for 704 oligos from a previous study against a database of 12 known S. aureus sequences with the results of their corresponding microarray experiments.

2. Materials and Methods

2.1. AssayBLAST Architecture

The AssayBLAST program is written in Python (version 3.7+), and its function can be divided into four steps: (1) creating a BLAST database with target sequences or genomes provided by the user; (2) a forward and a separate reverse complement BLAST search optimized for short-sequence BLASTS with the oligo sequences provided by the user; (3) filtering and analyzing the analysis hits based on the user’s mismatch thresholds; and (4) Generating results in different formats, including detailed BLAST search results in XML format, a text file with the alignments of matches containing mismatches, and the final overview mapping TSV matrix table. The table contains the sequences used for the BLAST search, Tm values, the number of mismatches of all the hits, and the positions of the hits in the genome. Note: Genomes and oligos of interest must be provided in FASTA format.

2.2. BLAST Search Adaptations

The AssayBLAST tool uses an optimized BLAST search-based approach to find all matches of short oligo sequences in a custom database. It is written in Python and uses the already established Biopython [12] and NCBI BLAST+ [11,13] packages. The following parameters were adjusted to adapt the BLAST search to the short oligo sequences:
-
dust = ’no’—Disables the filtering of low complexity regions so as not to miss possible binding sites.
-
word_size = 7—Reducing the word size is crucial for detecting short sequences and makes BLAST more sensitive to short, exact matches.
-
Gapopen = 10 and gapextend = 6—The gap penalties have been adjusted to prioritize hits without gaps, as primers and probes are strongly affected by them.
-
E-value = 1000—An e-value of 1000 ensures that all bindings are found, not just the best ones.
-
Reward = 5 and penalty = -4—The high reward value of 5 favors exact matches, which are critical for detecting short oligos. The penalty of −4 discourages mismatches, as they can significantly affect the binding efficiency.
-
Strand = ‘plus’—This parameter ensures that only one strand of the genome is searched and enables a second search with the reverse complementary sequences to differentiate binding strands safely.
-
max_target_seqs = 50,000—The maximum number of returns is very high to ensure that all potential binding sites within a genome are captured.

2.3. AssayBLAST User Parameters

The only two required arguments are -g, --genome: this takes a glob pattern to match the input genomes in FASTA format and -q, --queries: with the path to the query FASTA file containing the primer and/or probe sequences. The output of the query sequences is in the same order as provided. Therefore, it is advised, but not mandatory, that the input sequences have the following pattern per target sequence: forward primer/probe/reverse primer.
The optional parameters -d, --db_name; -o, --output; -c, --tsv_output; -a, --alignments_output; -mh, --multi_hits_output; and -db, --db_dir specify the names or directories of the programs output.
-m, --max_mismatches defines the maximum number of mismatches considered to be printed to the output .tsv file (default: 4).
-cc, --concatenate is a feature used for multiple input genomes or genome files containing multiple sequences, such as contigs from roughly assembled illumine data. The default value is ‘False’, resulting in a unique row in the output .tsv file for every target sequence. For high-quality input genomes divided into chromosomes or plasmids, for example, this allows us to easily see the origin of the target sequence. If set to ‘true’, the sequences of every provided FASTA are concatenated into one ‘super contig’, resulting in exactly one target per input file.
-k, --keep_blast_db: Instead of building a new BLAST database for every run, this parameter allows the program to use an existing one.

2.4. DNA Microarray Data

The microarray experiments were conducted using a genotyping DNA microarray-based assay specific for the analysis of Staphylococcus aureus strains, following an established protocol detailed previously [14]. The original primer and probe set, published and accessible in Supplementary File S1 of Citation [15], was later updated with additional primers and probes from a subsequent study [16]. The sequences of twelve S. aureus strains used as an example for a BLAST database were also previously published [17]. The S. aureus strains were selected to ensure diverse representation of the targets included in the DNA microarray analysis. A more detailed explanation including a descriptive graphic of the microarray experiments can be found in Supplement_1, Figure S1.

2.5. Binary Data Classification

To compare in vitro microarray results with in silico predictions from AssayBLAST, the intensity values were classified as positive or negative based on a fixed threshold of 0.5. It is important to recognize that this threshold is highly assay-specific and may vary based on the methodology and dataset. While diagnostic applications would ideally use individualized thresholds for each probe, such detailed adjustments were beyond the scope of this study.
The interpretation of the AssayBLAST results for the microarray primers and probes followed a different approach. The following criteria were used to classify BLAST hits and their respective mismatch counts as positive or negative: all BLAST hits with two or fewer mismatches were considered valid. For each probe, we verified whether there was a corresponding primer binding on the reverse strand within the proximity of 100 nucleotides. This proximity check ensures that the target region of the probe is amplified by a complementary primer, providing a double-stringency validation. If a probe, as well as a primer, were identified that both bind with two or fewer mismatches, the result was classified as positive. Only primers matching the probe in the genome of interest were analyzed. This classification into positive and negative outcomes enables a direct comparison between the in silico predictions from AssayBLAST and the in vitro results from the microarray assay, allowing for analysis using various statistical metrics.
For the qPCR primers and probes, the interpretation of the AssayBLAST results differed slightly from that of the microarray primers and probes. This difference arises because qPCR relies on two forward and one reverse primer for exponential amplification, whereas linear amplification for the microarrays uses a single primer. A result was considered positive if a forward and reverse primer were found within 250 nucleotides of a probe, with no more than two mismatches. All other cases were classified as negative.

2.6. qPCR Data

To assess the performance of the AssayBLAST results compared to another assay type, qPCR experiments were conducted, and the outcomes were analyzed. A total of 25 primer and probe pairs were tested using 14 Staphylococcus aureus strains and one Staphylococcus epidermidis strain. Details on these strains can be found in a previous publication [18], with a complete list of the 15 strains provided in Table S1 of this paper’s Supplement. The referenced publication also describes the qPCR procedure in detail. Primer and probe design were carried out using the ConsensusPrime pipeline (v. 1.0.) [19]. For all 375 comparisons, a dilution series with n = 2 replicates was performed. The qPCR result was considered positive if a signal appeared before a cycle threshold of 39 at the highest initial DNA concentration of 10,000 GE/μL; otherwise, it was interpreted as negative, as described in the aforementioned publication [19].

2.7. Statistical Analysis

The performance was evaluated by using the interpreted microarray results as the ground truth and comparing them with the interpreted outcomes from the AssayBLAST analysis to derive counts for true positive (TP), true negative (TN), false positive (FP), and false negative (FN) results. Using these counts, we calculated the following metrics: accuracy = (TP + TN)/(total population), precision = TP/(TP + FP), sensitivity = TP/(TP + FN), specificity = TN/(FP + TN), and F1 score = 2TP/(2TP + FP + FN). Accuracy represents the proportion of total correct predictions among all the predictions. Precision is the percentage of predicted positives that are actual positives, indicating the reliability of positive predictions. Sensitivity is the proportion of actual positives that are correctly identified, measuring the completeness of the positive predictions. Specificity is the proportion of actual negatives, indicating ArrayBLAST’s effectiveness in avoiding false positive predictions. F1 Score indicates the harmonic mean of precision and sensitivity, providing a balanced metric for the completeness of positive predictions while avoiding false positive predictions. The metrics were computed using Scikit-learn [20] for Python.

3. Results

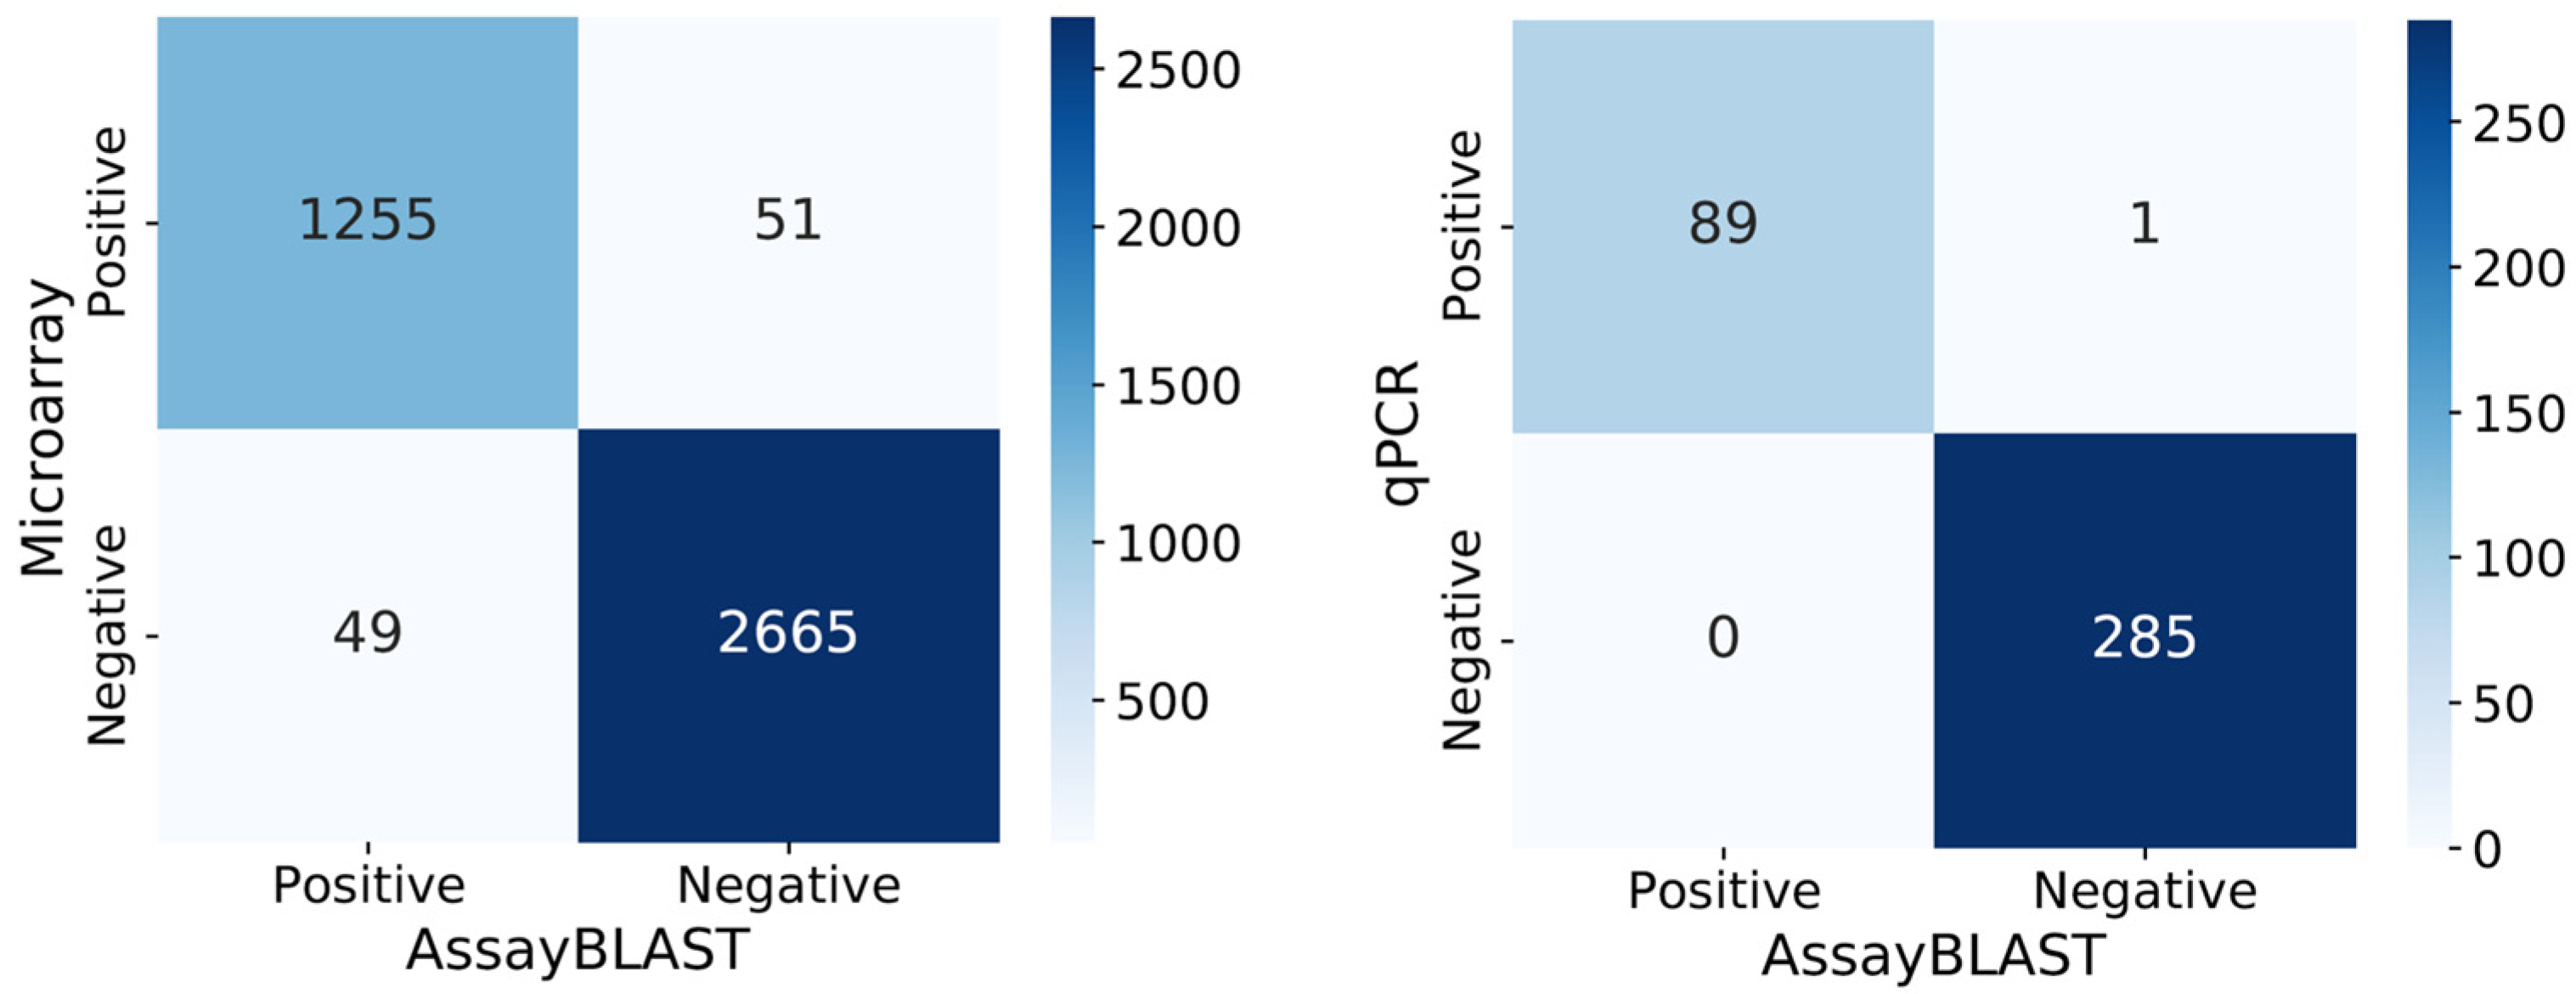
3.1. Analysis of the AssayBLAST and Microarray Results

Twelve different S. aureus strains were analyzed with 335 probes on the microarray and their sequences in silico, resulting in 4020 comparable experiments. The comparison of the positively and negatively classified data from AssayBLAST and the microarray experiments can be visualized in a confusion matrix, as seen in Figure 1. The confusion matrix compares the predicted and measured values. It shows the number of TP, TN, FP, and FN statements. The 4020 comparisons can be categorized as follows: TP = 1255, TN = 2665, FP = 49, and FN = 51. These values give an accuracy of 97.5%, a specificity of 98.2%, a precision of 96.2%, a sensitivity of 96.1%, and an F1 value of 96.2%. These values apply when AssayBLAST results with two or fewer mismatches are considered positive and a threshold of 0.5 is used to classify microarray experiments as positive or negative. Changing these two parameters will also change the ratios in the confusion matrix and the results of the calculated metrics. The metrics were also calculated for other possible parameter combinations and are compared with each other in Table 1. The combination of two or fewer accepted mismatches and a microarray detection threshold of 0.5 was selected for the final results, as it provided a balanced distribution of false positives and false negatives. It is important to note that the values determined are specific to the assay used in the comparison. Other threshold values may be relevant, depending on the user’s question and the assay used.
For this reason, the AssayBLAST pipeline does not interpret the results but presents them in a clear table and leaves interpretation to the user. An excerpt from the output table summarizing the BLAST results can be seen in Table 2. The columns with the interpreted results are not part of the AssayBLAST output and were added to make the comparison between AssayBLAST analysis and microarray experimental results more comprehensible.

3.2. Analysis of the Mismatch Count and Microarray Intensity Thresholds

In order to analyze the influence of the parameters used for classification, the metrics described above were calculated and compared for different threshold values. The results in Table 1 show only minor variations between the metrics used, depending on the parameters showing that the BLAST hits method is very good and robust for predicting the outcome of a microarray experiment. The results in Table 1 clearly show that the two me-trics, precision and sensitivity, are indirectly proportional. If the parameters are chosen to be more restrictive, i.e., fewer accepted mismatches or a higher threshold for the intensity of the microarray, the precision of the results increases but the sensitivity decreases. In other words, there are fewer false positives but more false negatives, highlighting that the choice of parameters must always be appropriate to the requirements of the assay to be analyzed.

3.3. Analysis of the AssayBLAST and qPCR Results

The comparison between AssayBLAST predictions and qPCR laboratory results demonstrates an almost perfect agreement, as illustrated in the right confusion matrix of Figure 1. The analysis achieved an accuracy of 99.7%, a precision of 100%, a sensitivity of 99.9%, a specificity of 100%, and an F1-score of 99.4%. The only false positive prediction occurred with the gapA primers and probe in the Staphylococcus epidermidis strain. While AssayBLAST did not detect a hit that met the positive criteria, the qPCR result was still interpreted as positive. This discrepancy is likely due to the cross-reactivity of the primers with a related allele of the gapA gene in S. epidermidis, for which the primers were not originally designed.

4. Discussion

AssayBLAST is a specialized computational tool designed to improve the theoretical combined with the practical validation of primers and probes used in different molecular assays, including PCR and qPCR, by addressing both strand specificity and large-scale oligonucleotide handling. Through dual BLAST searches, AssayBLAST uniquely validates forward and reverse strand binding, a critical aspect often overlooked by other primer design tools. This strand-specific approach ensures that primers and probes bind only to intended target regions, minimizing off-target interactions that could compromise assay accuracy.
Validated against Staphylococcus aureus DNA microarray analysis data, AssayBLAST achieved 97.5% accuracy and 96.2% precision in predicting hybridization outcomes (used parameter: two mismatches, 0.5 signal intensity). Such high accuracy in detecting correct binding orientations and potential mismatches makes it valuable for applications where false positives or negatives can be critical. To minimize false positive predictions, the mismatch threshold should be set lower. For instance, AssayBLAST achieves a precision of 99.4% with a mismatch threshold of one; see Table 1. Conversely, if avoiding false negative predictions is more critical, a higher mismatch threshold is recommended. At a threshold of three, AssayBLAST attains a sensitivity of 97.2%, although this also increases the number of false positives. A mismatch threshold of two provides a more balanced trade-off between false positive and false negative predictions (the discussed values are compared to a 0.5 signal intensity). It is precisely this dependency on the AssayBLAST results that requires a fundamental understanding of the assay being tested and its requirements. The comparison between AssayBLAST and qPCR results further validates the method’s reliability and highlights the pipeline’s value for quality control in assay design.
The values in Figure 1, with a constant mismatch count of two and a steadily increasing interpretation threshold for the microarray results, show how important a correct interpretation of the intensity values provided by the array is for its evaluation. A low interpretation threshold of 0.1 for classifying array results as positive may lead to increased false positive results. Because this number is not included in the calculation of the precision, the value of 98.2% is the highest at this threshold. However, the false array values hurt the sensitivity, which is reflected in the low value of 90.4%. Since the F1-score is also understood as a combination of precision and sensitivity, the F1-score also drops to 94.1%. If the threshold is set higher, the number of false positive array results decreases, resulting in fewer false negative predictions, which improves sensitivity. This directly results in a better F1-score, which reaches its maximum of 96.2 at the microarray interpretation thresholds of 0.5 and 0.6. If the threshold is increased even further to 0.7, false negative classifications occur in the array results, which leads to a significant reduction in precision. It is always important to remember that the threshold parameter only influences the interpretation of the microarray results and is irrelevant to evaluating the results generated by the AssayBLAST pipeline.
AssayBLAST can be used for a variety of other assay methods. The requirements for the sequences to be tested vary depending on the method used. For instance, in PCR-based assays, a low mismatch tolerance is essential to ensure high specificity and prevent the amplification of off-target sequences, which could compromise the accuracy of the results. However, in hybridization-based assays such as Southern blot [3] or FISH [21,22], the tolerance for mismatches may be slightly higher, as these methods rely on probe binding under defined conditions that can accommodate minor sequence variations without significantly affecting detection.
Similarly, depending on the assay, the acceptable distance between primers and probes or the probe-to-target binding stability (e.g., melting temperature, Tm) must be adjusted. qPCR [23] assays, for instance, require primers and probes to bind closely and with high affinity to ensure robust signal generation. Conversely, in microarray-based experiments, the design can tolerate more variation in probe placement due to the array’s capacity for parallel analysis. The resilience of hybridization-based assays to temperature fluctuations is due to the ability to reduce the temperature during hybridization until the desired sequences bind, even with a higher number of mismatches [24]. In this case, the likelihood of cross-reactions and nonspecific binding is much lower than in nonlinear amplification methods like PCR. In PCR-based amplification, nonspecific binding can lead to the exponential amplification of false amplicons, resulting in a false positive result [25]. However, during microarray hybridization, lowering the temperature does not amplify faulty bindings and, therefore, does not lead to a high risk of false positives.
Thresholds for signal interpretation also vary by assay. In Northern blotting [26,27] or microarrays, the signal intensity cutoff must account for the assay’s inherent noise and variability in hybridization efficiency. In contrast, PCR-based methods often use stricter binary interpretations (e.g., presence or absence of amplification).
The parameters of the BLAST algorithm must also be adapted to the sequence type and the length of the analyzed oligos to ensure proper search results.
Overall, parameter adjustments must align with the assay’s intended application, balancing sensitivity, specificity, and practicality. For high-throughput or diagnostic assays, stringent thresholds reduce false positives, while research-focused methods may prioritize flexibility to accommodate broader experimental conditions.
AssayBLAST’s efficient BLAST database management, ability to concatenate sequences into ‘supercontigs’, and structured output make it highly scalable for complex, high-throughput workflows. The locally executable code avoids the digital obsolescence of unmaintained web services and grants the highest data security possible, as no data uploads are required. The code is publicly available for inspection, further development, and/or adaptations.
AssayBLAST’s diverse capabilities make it suitable for various assay-based analyses. These include, for example, the validation of primers and probes used in large-scale diagnostic panels, such as those employed in pathogen screening or genetic testing. It also enables the analysis of mutations and polymorphisms through the targeted detection of mismatches, which is crucial in cancer genomics and personalized medicine. AssayBLAST’s ability to process large sets of primers and probes makes it ideal for working with metagenomic environmental samples. Data protection is a key consideration in all these applications and may be a limitation for web-based tools. AssayBLAST, however, is run locally and on a user-provided databases, ensuring privacy and addressing any concerns about data security. The publicly available source code further supports this by allowing users to modify and develop their pipelines for oligonucleotide quality control.
Although AssayBLAST offers broad applicability, additional features can further enhance its functionality. One such extension is the prediction of a secondary structure formation. Another planned feature is the automated assessment of interactions between corresponding primers and probes. However, this would require more precise input specifications to ensure clear name-based associations between query oligonucleotides. Additionally, the number of mismatches between a probe and its target sequence could be leveraged to predict the expected signal intensity in microarrays. In addition, the tool’s user-friendliness can be further improved, for example, by implementing it in a conda package for installation. Publishing the source code via GitHub (https://github.com/mcollatz/assayBLAST) is a significant advantage, as it allows uncomplicated interactions between developers and users.
In conclusion, AssayBLAST offers a scalable, precise, and strand-specific solution for validating oligonucleotide-based assays, filling an essential gap in molecular assay design and ensuring efficiency and reliability in large-scale assay development.

Supplementary Materials

The following supporting information can be downloaded at https://www.mdpi.com/article/10.3390/applbiosci4020018/s1, AssayBLAST_Supplement.docx, blast_results.tsv, microarray_results.txt, and primer_and_probe.fasta.

Author Contributions

M.C. implemented the pipeline and wrote the manuscript. E.M. performed the microarray experiments. S.D.B., M.R., S.M. and R.E. helped with the conceptual development and definition of the requirements. All authors have read and agreed to the published version of the manuscript.

Funding

ADA (13GW0456C: BMBF): Adaptable Decentralized Diagnostics for Veterinary and Human Medicine.

Institutional Review Board Statement

Not applicable.

Informed Consent Statement

Not applicable.

Data Availability Statement

The source code of AssayBLAST is available on GitHub (https://github.com/mcollatz/assayBLAST, accessed on 28 February 2025), and the result files of the analysis are available in the Supplementary Materials.

Conflicts of Interest

The authors declare no conflicts of interest.

References

  1. Mullis, K.B. The unusual origin of the polymerase chain reaction. Sci. Am. 1990, 262, 56–65. [Google Scholar] [CrossRef]
  2. Guatelli, J.C.; Whitfield, K.M.; Kwoh, D.Y.; Barringer, K.J.; Richman, D.D.; Gingeras, T.R. Isothermal, in vitro amplification of nucleic acids by a multienzyme reaction modeled after retroviral replication. Proc. Natl. Acad. Sci. USA 1990, 87, 1874–1878. [Google Scholar] [CrossRef]
  3. Southern, E.M. Detection of specific sequences among DNA fragments separated by gel electrophoresis. J. Mol. Biol. 1975, 98, 503–517. [Google Scholar] [CrossRef] [PubMed]
  4. Hassibi, A.; Vikalo, H.; Riechmann, J.L.; Hassibi, B. Real-time DNA microarray analysis. Nucleic Acids Res. 2009, 37, e132. [Google Scholar] [CrossRef] [PubMed]
  5. Panjkovich, A.; Norambuena, T.; Melo, F. dnaMATE: A consensus melting temperature prediction server for short DNA sequences. Nucleic Acids Res. 2005, 33 (Suppl. 2), W570–W572. [Google Scholar] [CrossRef]
  6. Taylor, S.C.; Nadeau, K.; Abbasi, M.; Lachance, C.; Nguyen, M.; Fenrich, J. The ultimate qPCR experiment: Producing publication quality, reproducible data the first time. Trends Biotechnol. 2019, 37, 761–774. [Google Scholar] [CrossRef] [PubMed]
  7. Cook, S.A.; Rosenzweig, A. DNA microarrays: Implications for cardiovascular medicine. Circ. Res. 2002, 91, 559–564. [Google Scholar] [CrossRef]
  8. Bumgarner, R. Overview of DNA microarrays: Types, applications, and their future. Curr. Protoc. Mol. Biol. 2013, 101, 22.1.1–22.1.11. [Google Scholar] [CrossRef]
  9. Rodríguez, A.; Rodríguez, M.; Córdoba, J.J.; Andrade, M.J. Design of primers and probes for quantitative real-time PCR methods. In PCR Primer Design; Springer: Berlin/Heidelberg, Germany, 2015; pp. 31–56. [Google Scholar] [CrossRef]
  10. Vázquez-González, L.; Regueira-Iglesias, A.; Balsa-Castro, C.; Vila-Blanco, N.; Tomás, I.; Carreira, M.J. PrimerEvalPy: A tool for in-silico evaluation of primers for targeting the microbiome. BMC Bioinform. 2024, 25, 189. [Google Scholar] [CrossRef]
  11. Altschul, S.F.; Gish, W.; Miller, W.; Myers, E.W.; Lipman, D.J. Basic local alignment search tool. J. Mol. Biol. 1990, 215, 403–410. [Google Scholar] [CrossRef]
  12. Chapman, B.; Chang, J. Biopython: Python tools for computational biology. ACM Sigbio Newsl. 2000, 20, 15–19. [Google Scholar] [CrossRef]
  13. Camacho, C.; Coulouris, G.; Avagyan, V.; Ma, N.; Papadopoulos, J.; Bealer, K.; Madden, T.L. BLAST+: Architecture and applications. BMC Bioinform. 2009, 10, 421. [Google Scholar] [CrossRef] [PubMed]
  14. Monecke, S.; Jatzwauk, L.; Weber, S.; Slickers, P.; Ehricht, R. DNA microarray-based genotyping of methicillin-resistant Staphylococcus aureus strains from Eastern Saxony. Clin. Microbiol. Infect. 2008, 14, 534–545. [Google Scholar] [CrossRef]
  15. Monecke, S.; Coombs, G.; Shore, A.C.; Coleman, D.C.; Akpaka, P.; Borg, M.; Chow, H.; Ip, M.; Jatzwauk, L.; Jonas, D.; et al. A field guide to pandemic, epidemic and sporadic clones of methicillin-resistant Staphylococcus aureus. PLoS ONE 2011, 6, e17936. [Google Scholar] [CrossRef]
  16. Monecke, S.; Gavier-Widen, D.; Mattsson, R.; Rangstrup-Christensen, L.; Lazaris, A.; Coleman, D.C.; Shore, A.C.; Ehricht, R. Detection of mecC-positive Staphylococcus aureus (CC130-MRSA-XI) in diseased European hedgehogs (Erinaceus europaeus) in Sweden. PLoS ONE 2013, 8, e66166. [Google Scholar] [CrossRef]
  17. Monecke, S.; Roberts, M.C.; Braun, S.D.; Diezel, C.; Müller, E.; Reinicke, M.; Linde, J.; Joshi, P.R.; Paudel, S.; Acharya, M.; et al. Sequence analysis of novel Staphylococcus aureus lineages from wild and captive macaques. Int. J. Mol. Sci. 2022, 23, 11225. [Google Scholar] [CrossRef]
  18. Collatz, M.; Reinicke, M.; Diezel, C.; Braun, S.D.; Monecke, S.; Reissig, A.; Ehricht, R. ConsensusPrime—A Bioinformatic Pipeline for Efficient Consensus Primer Design—Detection of Various Resistance and Virulence Factors in MRSA—A Case Study. BioMedInformatics 2024, 4, 1249–1261. [Google Scholar] [CrossRef]
  19. Collatz, M.; Braun, S.D.; Monecke, S.; Ehricht, R. ConsensusPrime—A Bioinformatic Pipeline for Ideal Consensus Primer Design. BioMedInformatics 2022, 2, 637–642. [Google Scholar] [CrossRef]
  20. Pedregosa, F.; Varoquaux, G.; Gramfort, A.; Michel, V.; Thirion, B.; Grisel, O.; Blondel, M.; Prettenhofer, P.; Weiss, R.; Dubourg, V.; et al. Scikit-learn: Machine learning in Python. J. Mach. Learn. Res. 2011, 12, 2825–2830. [Google Scholar]
  21. Gall, J.G.; Pardue, M.L. Formation and detection of RNA-DNA hybrid molecules in cytological preparations. Proc. Natl. Acad. Sci. USA 1969, 63, 378–383. [Google Scholar] [CrossRef]
  22. Pardue, M.L.; Gall, J.G. Molecular hybridization of radioactive DNA to the DNA of cytological preparations. Proc. Natl. Acad. Sci. USA 1969, 64, 600–604. [Google Scholar] [CrossRef] [PubMed]
  23. Nurmi, J.; Wikman, T.; Karp, M.; Lövgren, T. High-performance real-time quantitative RT-PCR using lanthanide probes and a dual-temperature hybridization assay. Anal. Chem. 2002, 74, 3525–3532. [Google Scholar] [CrossRef] [PubMed]
  24. Mueckstein, U.; Leparc, G.G.; Posekany, A.; Hofacker, I.; Kreil, D.P. Hybridization thermodynamics of NimbleGen microarrays. BMC Bioinform. 2010, 11, 35. [Google Scholar] [CrossRef] [PubMed]
  25. Naqib, A.; Jeon, T.; Kunstman, K.; Wang, W.; Shen, Y.; Sweeney, D.; Hyde, M.; Green, S.J. PCR effects of melting temperature adjustment of individual primers in degenerate primer pools. PeerJ 2019, 7, e6570. [Google Scholar] [CrossRef]
  26. Alwine, J.C.; Kemp, D.J.; Stark, G.R. Method for detection of specific RNAs in agarose gels by transfer to diazobenzyloxymethyl-paper and hybridization with DNA probes. Proc. Natl. Acad. Sci. USA 1977, 74, 5350–5354. [Google Scholar] [CrossRef]
  27. Thomas, P.S. Hybridization of denatured RNA and small DNA fragments transferred to nitrocellulose. Proc. Natl. Acad. Sci. USA 1980, 77, 5201–5205. [Google Scholar] [CrossRef]
Figure 1. The left confusion matrix of the interpreted predictions versus the DNA microarray results shows a high agreement between the true positive and true negative results. The selected thresholds for data classification achieve a balanced trade-off between false positive and false negative outcomes, marking an optimal point between precision and sensitivity. The right confusion matrix shows the comparison to the qPCR results and shows an almost perfect agreement between the prediction and experimental results, with only one false positive case.
Applbiosci 04 00018 g001
Table 1. The results of the different metrics are shown as dependent on varying accepted mismatch (mm) counts and microarray interpretation thresholds. They range from an accepted mismatch count of one to three at varying thresholds. A stronger green color indicates a better performance of the metric for the parameters used, while white indicates the lowest values. The color scale must be considered individually for each metric, with green representing the highest value and white the lowest.
mm count/Threshold:1/0.31/0.51/0.72/0.12/0.22/0.32/0.42/0.52/0.62/0.72/0.83/0.33/0.5
Accuracy97.0%97.7%96.9%96.0%96.9%97.4%97.4%97.5%97.6%96.0%96.0%95.9%95.3%
Specificity99.9%99.7%97.6%99.1%99.0%98.8%98.4%98.2%98.1%95.6%95.6%95.4%94.3%
Precision99.8%99.4%94.5%98.2%97.9%97.5%96.8%96.2%95.9%90.5%90.5%91.3%89.2%
Sensitivity91.2%93.5%95.4%90.4%93.0%94.6%95.2%96.1%96.5%97.0%97.0%96.8%97.2%
F1-Score95.3%96.4%95.0%94.1%95.4%96.0%96.0%96.2%96.2%93.6%93.6%94.0%93.0%
Table 2. The table shows an excerpt from the blast_result.tsv table for the lukF primer and the corresponding probe (for the complete table, see Supplement Table S1). The table contains two columns each for the primer and sample. One is for the forward BLAST search, and one is for the backward search. The fact that the oligos only appear in one of the two columns corresponds to the expectation. The rows contain the results of the BLAST search (displayed as the number of mismatches within the corresponding binding site, with the latter provided in brackets) for one genome each. The query oligos are sometimes found in the forward or the reverse column because the sequenced and assembled genomes are present in random directions. For the microarray assay to work, the probe must be on the opposite strand than the corresponding primer. This results in the pattern that both hits occur only in the adjacent or outer columns. The two columns, ‘Interpreted result’ and ‘Microarray result’, were added to compare the statements of the theoretical experiments of the tool with the measured laboratory values. For the theoretical experiments, a positive result is assumed if there is a primer and a probe with less than two mismatches in the different BLAST search directions. Since this is the case for all genomes, the results were interpreted as positive everywhere. A threshold value of 0.5 was used to statistically compare the theoretically interpreted results with the measured values from the microarray experiment. All values greater than or equal to 0.5 were interpreted as positive and all smaller values as negative.
GenBank Accession No.primer_lukF_11b_forwardprimer_lukF_11b_revcompprobe_lukF_10_forwardprobe_lukF_10_revcompInterpreted Theoretical ResultMicroarray Signal
Intensity
Interpreted Microarray Result
CP102974 0 (pos: 1913864–1913881)0 (pos: 1913835–1913860) positive0.82positive
CP1029611 (pos: 784154–784171) 2 (pos: 784175–784200)positive0.48negative
CP102972-9730 (pos: 796245–796262) 0 (pos: 796266–796291)positive0.81positive
CP102960 0 (pos: 1931674–1931691)0 (pos: 1931645–1931670) positive0.81positive
CP102971 0 (pos: 254183–254200)0 (pos: 254154–254179) positive0.81positive
CP102970 0 (pos: 287837–287854)0 (pos: 287808–287833) positive0.78positive
CP102959 0 (pos: 1940682–1940699)0 (pos: 1940653–1940678) positive0.82positive
CP102968-969 0 (pos: 1889784–1889801)0 (pos: 1889755–1889780) positive0.81positive
CP1029580 (pos: 2344146–2344163) 0 (pos: 2344167–2344192)positive0.79positive
CP1029670 (pos: 2388703–2388720) 0 (pos: 2388724–2388749)positive0.8positive
CP1029570 (pos: 2204112–2204129) 0 (pos: 2204133–2204158)positive0.8positive
CP102956 0 (pos: 1942449–1942466)0 (pos: 1942420–1942445) positive0.81positive
Disclaimer/Publisher’s Note: The statements, opinions and data contained in all publications are solely those of the individual author(s) and contributor(s) and not of MDPI and/or the editor(s). MDPI and/or the editor(s) disclaim responsibility for any injury to people or property resulting from any ideas, methods, instructions or products referred to in the content.

