1. Introduction
Lung cancer remains a leading cause of cancer-related mortality worldwide, accounting for significant morbidity and mortality [
1]. A critical challenge in addressing this burden is the asymptomatic nature of early-stage lung cancer, which often leads to delayed diagnosis and poor survival rates [
2]. Early detection through routine lung cancer screening has shown promise in reducing mortality [
3]; however, this process heavily relies on the expertise of radiologists to analyze low-dose computed tomography (LDCT) scans [
4], a task that is both time-consuming and prone to inter-observer variability [
5].
Advancements in artificial intelligence (AI) and deep learning have paved the way for computer-aided diagnosis (CADx) systems, which aim to support radiologists by providing automated, accurate, and efficient image analysis [
6]. In particular, 3D convolutional neural networks (3D CNNs) [
7] have emerged as a powerful tool for processing volumetric medical imaging data, offering the ability to learn complex spatial relationships and subtle patterns indicative of pulmonary nodules. Despite these advancements, existing CADx systems often face challenges such as imbalanced datasets, overfitting, and computational inefficiencies, particularly when handling the large volume of data in LDCT scans.
To address these challenges, a dynamic patch-based extraction pipeline was developed to efficiently handle large CT volumes while maintaining the accuracy and robustness of the training process. Instead of processing entire CT scans, this method extracts 3D patches from the LDCT data during training. These patches, representing smaller focused regions of the CT volume, are generated online at the start of each training epoch, ensuring diversity across iterations and mitigating overfitting. The patch extraction process incorporates a probabilistic sampling strategy, emphasizing patches containing nodules while ensuring diversity by including non-nodule regions. This approach dynamically balances the inclusion of nodule-specific data and background regions, enabling the comprehensive learning of spatial features while reducing potential biases. By extracting patches online at the start of each training epoch, this method ensures varied and representative training samples without the need to pre-store large datasets, significantly optimizing memory usage and processing efficiency.
To further enhance the robustness of the model, advanced data augmentation techniques were employed within the 3D space during training. These transformations include random flips, affine adjustments, elastic deformations, and voxel swaps, which simulate the variability inherent in clinical data and expand the diversity of the training dataset. Each augmentation is applied stochastically, ensuring variability in the training samples presented to the network. For validation and testing datasets, only patch extraction was performed, preserving their integrity for unbiased model evaluation.
The proposed approach also integrates HighRes3DNet [
8], a specialized 3D CNN architecture inspired by residual networks (ResNet), which leverages residual connections to improve gradient flow and facilitate the learning of complex features from volumetric data. Originally applied in tasks such as brain segmentation in fMRI [
9,
10] and multi-organ segmentation [
11], its integration into this work extends its utility to pulmonary nodule segmentation in low-dose CT scans.
This work advances current research by introducing a novel dynamic training approach and a deep learning architecture previously unexplored in the pulmonary nodule segmentation domain for low-dose CT (LDCT) scans. By combining dynamic patch extraction, effective augmentation strategies, and a robust 3D CNN architecture, this system demonstrates a significant advancement in automated pulmonary nodule segmentation. Using the LIDC-IDRI database [
12] as the primary dataset, the experiments achieved a Dice coefficient of 82.65% for nodule segmentation on the test set, showcasing the potential of our approach in improving the precision and efficiency of lung cancer screening. Additionally, for this work, an extensive exploratory data analysis (EDA) was conducted on the LIDC-IDRI database to thoroughly investigate its characteristics, and the findings from this analysis are comprehensively reported to support and inform our proposed methodology.
This paper outlines the methodologies and techniques employed in this study, including data preprocessing, dynamic patch extraction, network architecture, and training strategies. By addressing key limitations in current CADx systems [
13], this work highlights the potential of deep learning to significantly improve the precision and efficiency of lung cancer screening, offering a valuable tool to support radiologists in clinical decision-making and, ultimately, enhance patient outcomes.
The rest of the paper is structured as follows.
Section 2 presents the related work, while in
Section 3, the materials and methods are highlighted. In
Section 4, the experimental results are presented. Finally, in
Section 5, we discuss the findings of this study and in
Section 6 the conclusions are given.
2. Related Work
The field of pulmonary nodule segmentation in 3D CT scans has seen significant advancements over the years, with numerous approaches leveraging deep learning and semantic segmentation techniques [
14,
15,
16]. A comprehensive review of 3D lung nodule segmentation methodologies up to 2023 was presented in an earlier work [
17], which provided a detailed analysis of state-of-the-art techniques, challenges, and future directions in this domain.
Table 1 provides a summary of the most promising works reported in this review. Building on this foundation, the current section aims to extend the scope by highlighting key advancements and relevant studies published in 2024. This approach ensures a holistic understanding of the evolving landscape, bridging prior developments with the latest innovations in 3D pulmonary nodule segmentation.
Recent three-dimensional approaches to pulmonary nodule segmentation have demonstrated significant progress through various network architectures. The foundational work by Tang et al. [
18] introduced a 3D DCNN achieving a DSC of 83.10%, establishing early benchmarks for volumetric segmentation. Building upon this foundation, more sophisticated architectures emerged, such as the Deep Residual U-Net [
19], which achieved a DSC of 87.5% by incorporating residual connections in a 3D framework, though notably requiring manual input from radiologists to initialize the segmentation process. This semi-automated approach, while achieving good results, highlights the continued reliance on expert intervention in some advanced segmentation systems. Notable advancements in 3D architectures include Kido et al.’s [
20] Nested Three-Dimensional Fully Connected Convolutional Network, which processed 128 × 128 × 64 volumes to achieve a DSC of 84.5%, and Qiu et al.’s [
21] 3D U-Net based approach, which utilized a 64 × 64 × 32 input dimension to attain a DSC of 82.48%.
Luo et al.’s DAS-Net [
22] implemented a dual attention mechanism with a 3D shadow mapping layer, processing 16 × 128 × 128 volumes to achieve a DSC of 92.05%. A different approach was taken by Yang et al. [
23], who explored the potential of 3D GANs with a 64 × 64 × 32 input size, though achieving a more modest DSC of 80.74%. These advancements demonstrate the evolution of 3D architectures from basic convolutional approaches to more sophisticated designs incorporating attention mechanisms and specialized architectural elements.
More recent innovations have focused on incorporating advanced architectural elements into 3D frameworks, leading to substantial performance improvements. One notable approach is the incorporation of custom attention mechanisms as observed in [
22]. For instance, in [
24], the authors propose an enhanced V-Net architecture that integrates an attention mechanism to improve performance. This model, tested on the LIDC-IDRI dataset, incorporates pixel threshold separation and an attention mechanism, achieving a Dice coefficient of 94.7% and 81.1% based on the public datasets LUNA16 and LNDb, respectively. This approach enhances the segmentation of small nodules by enabling the model to focus on critical regions, thus refining the boundary delineation.
Another study that used attention mechanisms is [
25] by Liu J. et al., which combined multiscale 3D coordinate attention with edge enhancement techniques. The model, evaluated on both the LIDC-IDRI and LUNA16 datasets, achieved a Dice coefficient of 87.5%, demonstrating the effectiveness of the attention mechanism in focusing on essential spatial regions and improving segmentation boundaries, particularly for challenging nodules with unclear edges.
In addition to attention mechanisms, ensemble methods have proven effective in improving segmentation accuracy. Rikhari H. et al. [
26] explored the use of an ensemble of multiple 3D U-Net models. This approach, evaluated on the LIDC-IDRI and NSCLC-Radiomics datasets, achieved a Dice coefficient of 84%. The ensemble method improves robustness, particularly in noisy or low-quality scans, demonstrating that combining models enhances the overall segmentation performance.
Another significant advancement is the use of multi-branch architectures. A study by Jiang W. et al. [
27] introduced a dual-branch framework that incorporates prior anatomical knowledge to guide the segmentation process. Evaluated on multiple datasets, including LUNA16, Multi-thickness Slice Image dataset, LIDC, and UniToChest, the model achieved Dice similarity coefficients of 86.89%, 75.72%, 84.12%, and 80.74%, respectively. This approach particularly excels in cases with overlapping nodules or low contrast, where traditional models often face challenges, demonstrating its robustness across diverse and challenging datasets.
Another study [
28] also employed a dual-branch architecture using 3D convolutional neural networks and explored the application of attention to enhance feature extraction and improve segmentation accuracy. The proposed model integrates attention layers to focus on critical regions within CT scans, addressing challenges such as small nodule detection and boundary delineation. While the use of attention mechanisms is promising, this study does not report Dice similarity metrics, limiting direct performance comparison with other methods.
The study [
29] by Xu X. et al. proposes a 2.5D lung nodule segmentation model that enhances edge feature extraction and fuses intra- and inter-slice information. Key innovations include a dual-branch feature fusion module (DFFM) and reverse attention context module (RACM), alongside central pooling to retain relevant features. Evaluated on 1186 nodules from the LUNA16 dataset, the model achieved a mean Dice similarity coefficient (mDSC) of 84.57%, demonstrating robust segmentation accuracy comparable to inter-radiologist agreement, with only a 0.74% difference. The method also offers faster processing than traditional 3D approaches.
In the realm of residual networks, ref. [
30] introduced a multi-stride residual 3D U-Net model that captures features at different scales and benefits from residual connections to enhance feature extraction. Evaluated on the LUNA16 dataset, the model achieved a Dice coefficient 83.47%, making it particularly effective in detecting smaller nodules.
In summary, these studies demonstrate significant advancements in lung nodule segmentation. Approaches such as attention mechanisms, ensemble models, multi-branch architectures, and residual networks, have proven effective, with Dice coefficients generally ranging from 80 to ~95%. These models, evaluated on popular datasets like LIDC-IDRI and LUNA16, highlight the ongoing efforts to improve the accuracy and robustness of lung nodule segmentation, particularly in challenging CT scans.
3. Methodology
This study aims to design and implement an automated pipeline for the segmentation of pulmonary nodules in low-dose CT scans. At the core of this approach is the hypothesis that a semantic segmentation model, specifically a 3D ResNet architecture, can be effectively trained using transfer learning to generate pixel-level predictions of nodules within 3D CT scan patches. Leveraging the outputs of this model enables the construction of precise masks that delineate nodule areas, facilitating robust and accurate segmentation.
This hypothesis forms the foundation of our methodology, wherein the challenges of processing volumetric data and extracting meaningful features from complex medical images are systematically addressed. The proposed framework involves preprocessing CT scans to dynamically extract 3D patches, training a semantic segmentation model on these patches, and applying the model to predict nodule regions with high spatial accuracy. This approach integrates advanced data augmentation techniques and a probabilistic sampling strategy to enhance model generalizability while maintaining computational efficiency.
Validating this hypothesis demonstrates the capability of 3D Res-Net-based architectures to address the complexities of lung nodule segmentation, paving the way for enhanced automation in lung cancer screening workflows.
3.1. Deep Learning Architecture
In this work, the HighRes3DNet [
8] architecture, an advanced model specifically designed to address the complexities of three-dimensional medical imaging data, was utilized for the task of semantic segmentation. This architecture excels at extracting intricate spatial features, making it highly suitable for delineating pulmonary nodule structures within volumetric low-dose CT scans.
Built on the foundational principles of residual connections, the HighRes3DNet effectively addresses the common challenges of training deep networks, such as vanishing gradients, by enabling smoother gradient flow across layers. This design facilitates the construction of deep network structures capable of learning complex anatomical and functional features directly from raw 3D data. HighRes3DNet’s capacity to learn rich and robust feature representations makes it exceptionally suited to segmenting intricate and complex structures in medical imaging data.
A key innovation of this architecture is its use of brain parcellation as a pretext task during auxiliary training. This approach demonstrates the model’s capacity to learn meaningful and transferable representations from 3D neuroimaging data. By leveraging brain parcellation to refine its ability to distinguish fine-grained features, the network achieves superior performance on its primary task, including the segmentation of nodules in CT scans. This representation learning approach underscores the flexibility and adaptability of HighRes3DNet for diverse medical imaging challenges.
In summary, the 3D HighRes3DNet architecture represents an innovative solution for semantic segmentation tasks, leveraging ResNet principles to build a compact, efficient, and powerful framework for volumetric data analysis. Its capacity to automatically extract anatomical details and adapt pretext learning strategies establishes it as an ideal model for precise and accurate pulmonary nodule segmentation in lung cancer screening.
3.2. LIDC-IDRI Database
For this experiment, the LIDC-IDRI (Lung Image Database Consortium image collection) [
12], an open source and widely utilized database, was employed. Understanding the nature of the data is crucial before defining the experiment protocol, and thus it is important to explore and comprehend its structure and format. The literature reveals that numerous studies have leveraged the publicly available LIDC-IDRI database or its Kaggle competition subset, LUNA16 [
31], while others have chosen to utilize private datasets.
The LIDC-IDRI database is a comprehensive international resource consisting of diagnostic and lung cancer screening thoracic CT scans with annotated lesions. It was developed through collaboration among seven academic centers and eight medical imaging companies, resulting in a collection of 1018 cases. Each case includes clinical thoracic CT scans and XML files documenting the results of a two-phase annotation process performed by experienced thoracic radiologists. This unique annotation process, which includes independent and unblinded-read phases, ensures robust and thorough nodule classification.
To extract the relevant information and labels from the LIDC-IDRI database for this analysis, the pylidc Python package [
32] (version 0.2.3) was used, which enabled the efficient loading of CT scans and corresponding metadata. Instead of using the LUNA16 subset [
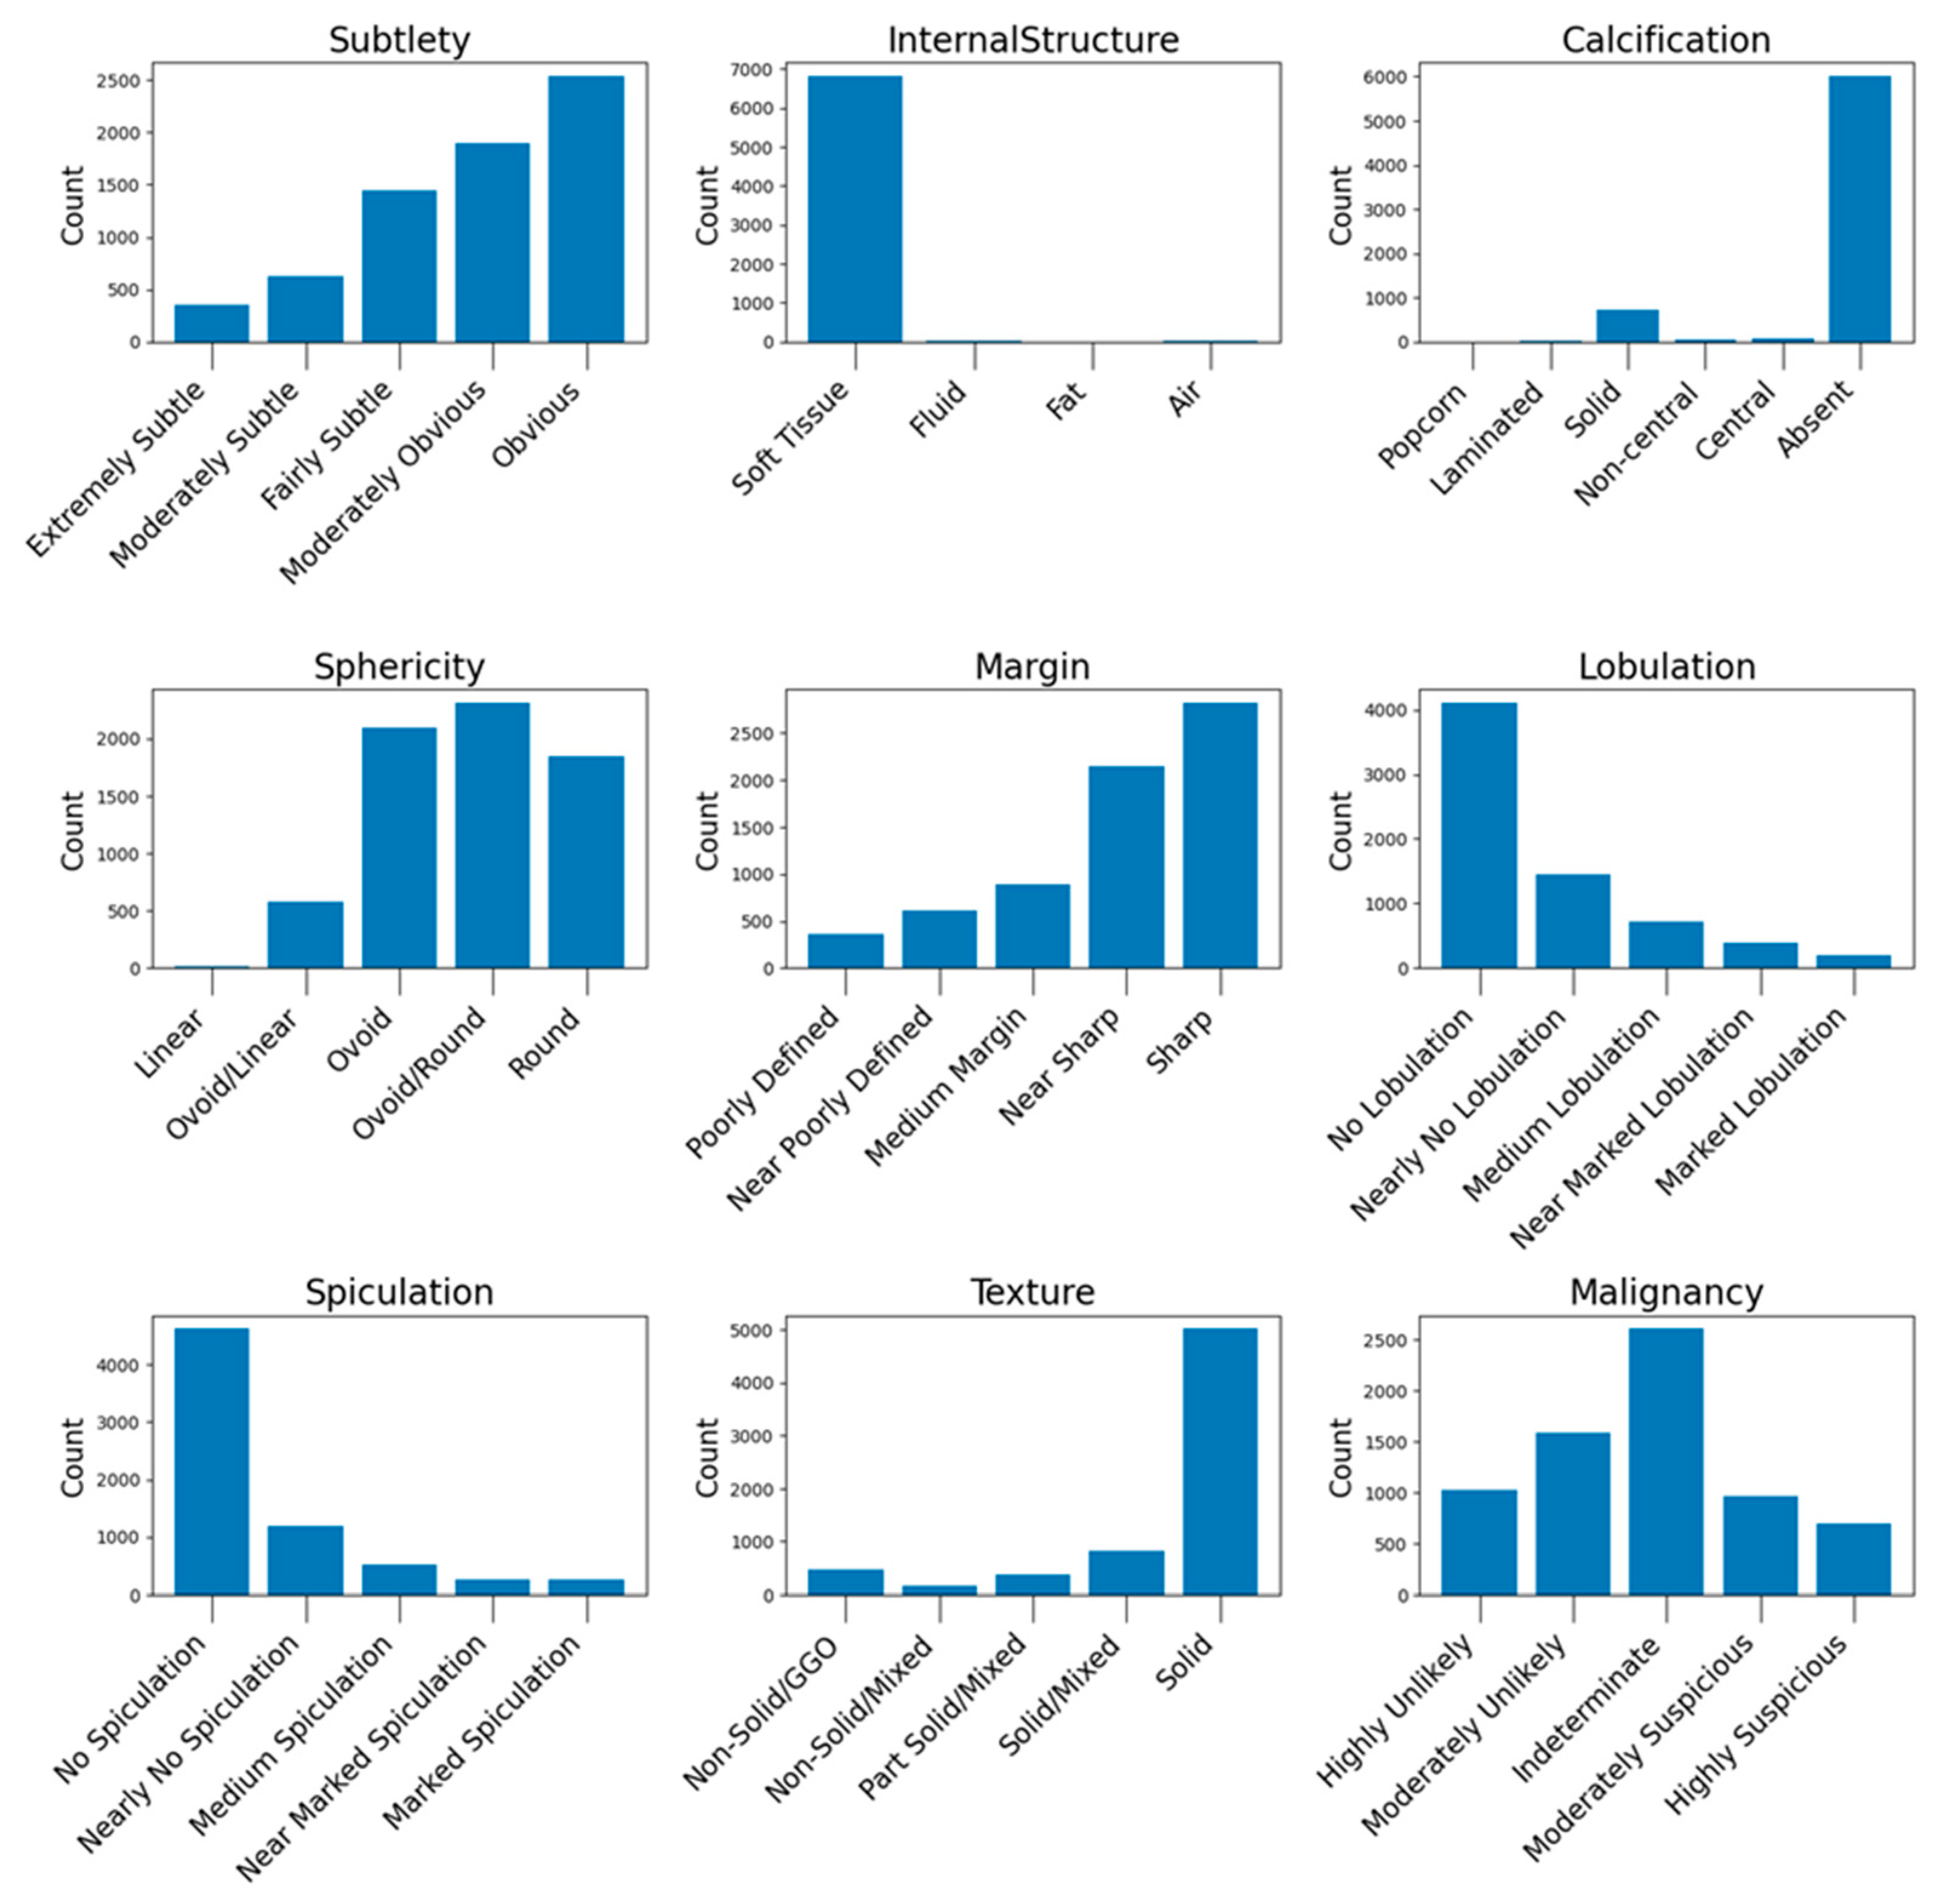
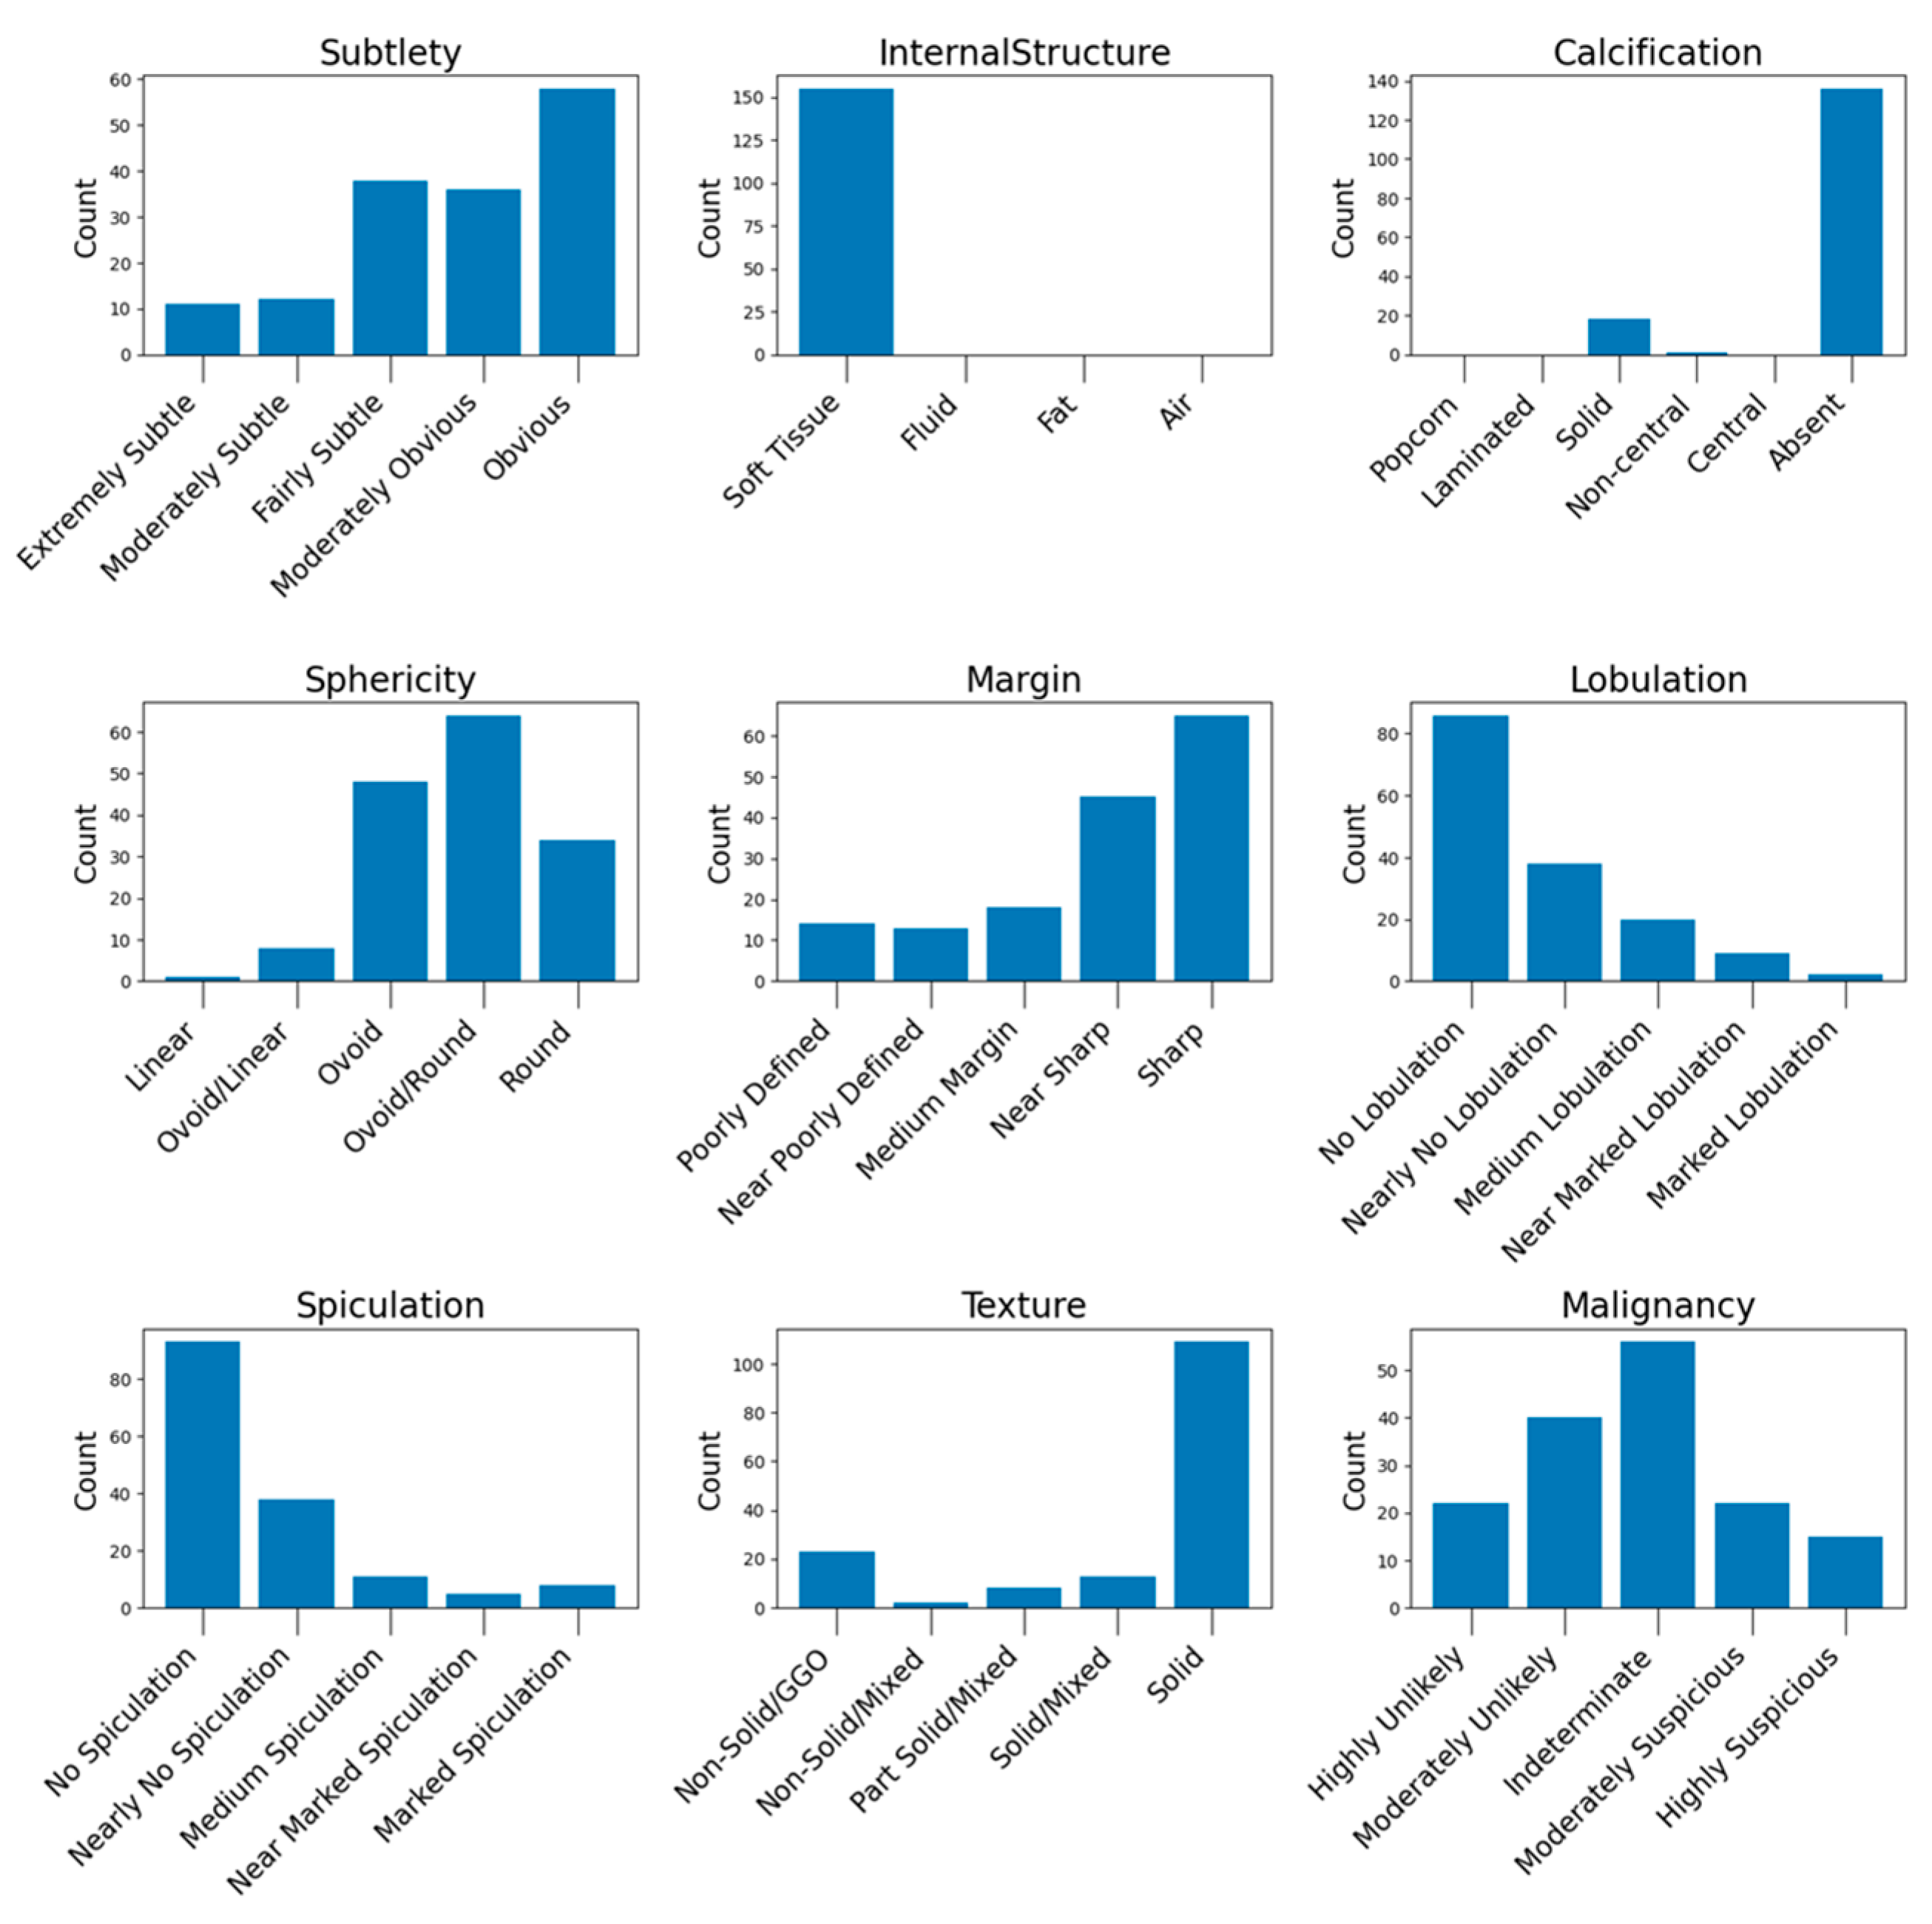
31], as in other studies, a comprehensive analysis was performed on the complete dataset to gain useful insights about the sample variance and balance of this database. The result of the exploratory data analysis (EDA) is included in
Appendix A.1, where useful counts and insights derived from the dataset are presented.
3.3. Data Preprocessing
In this experiment, several preprocessing steps were performed to prepare the data for training both semantic segmentation models and classification models. The preprocessing was carried out at two levels: the scan level and the nodule level.
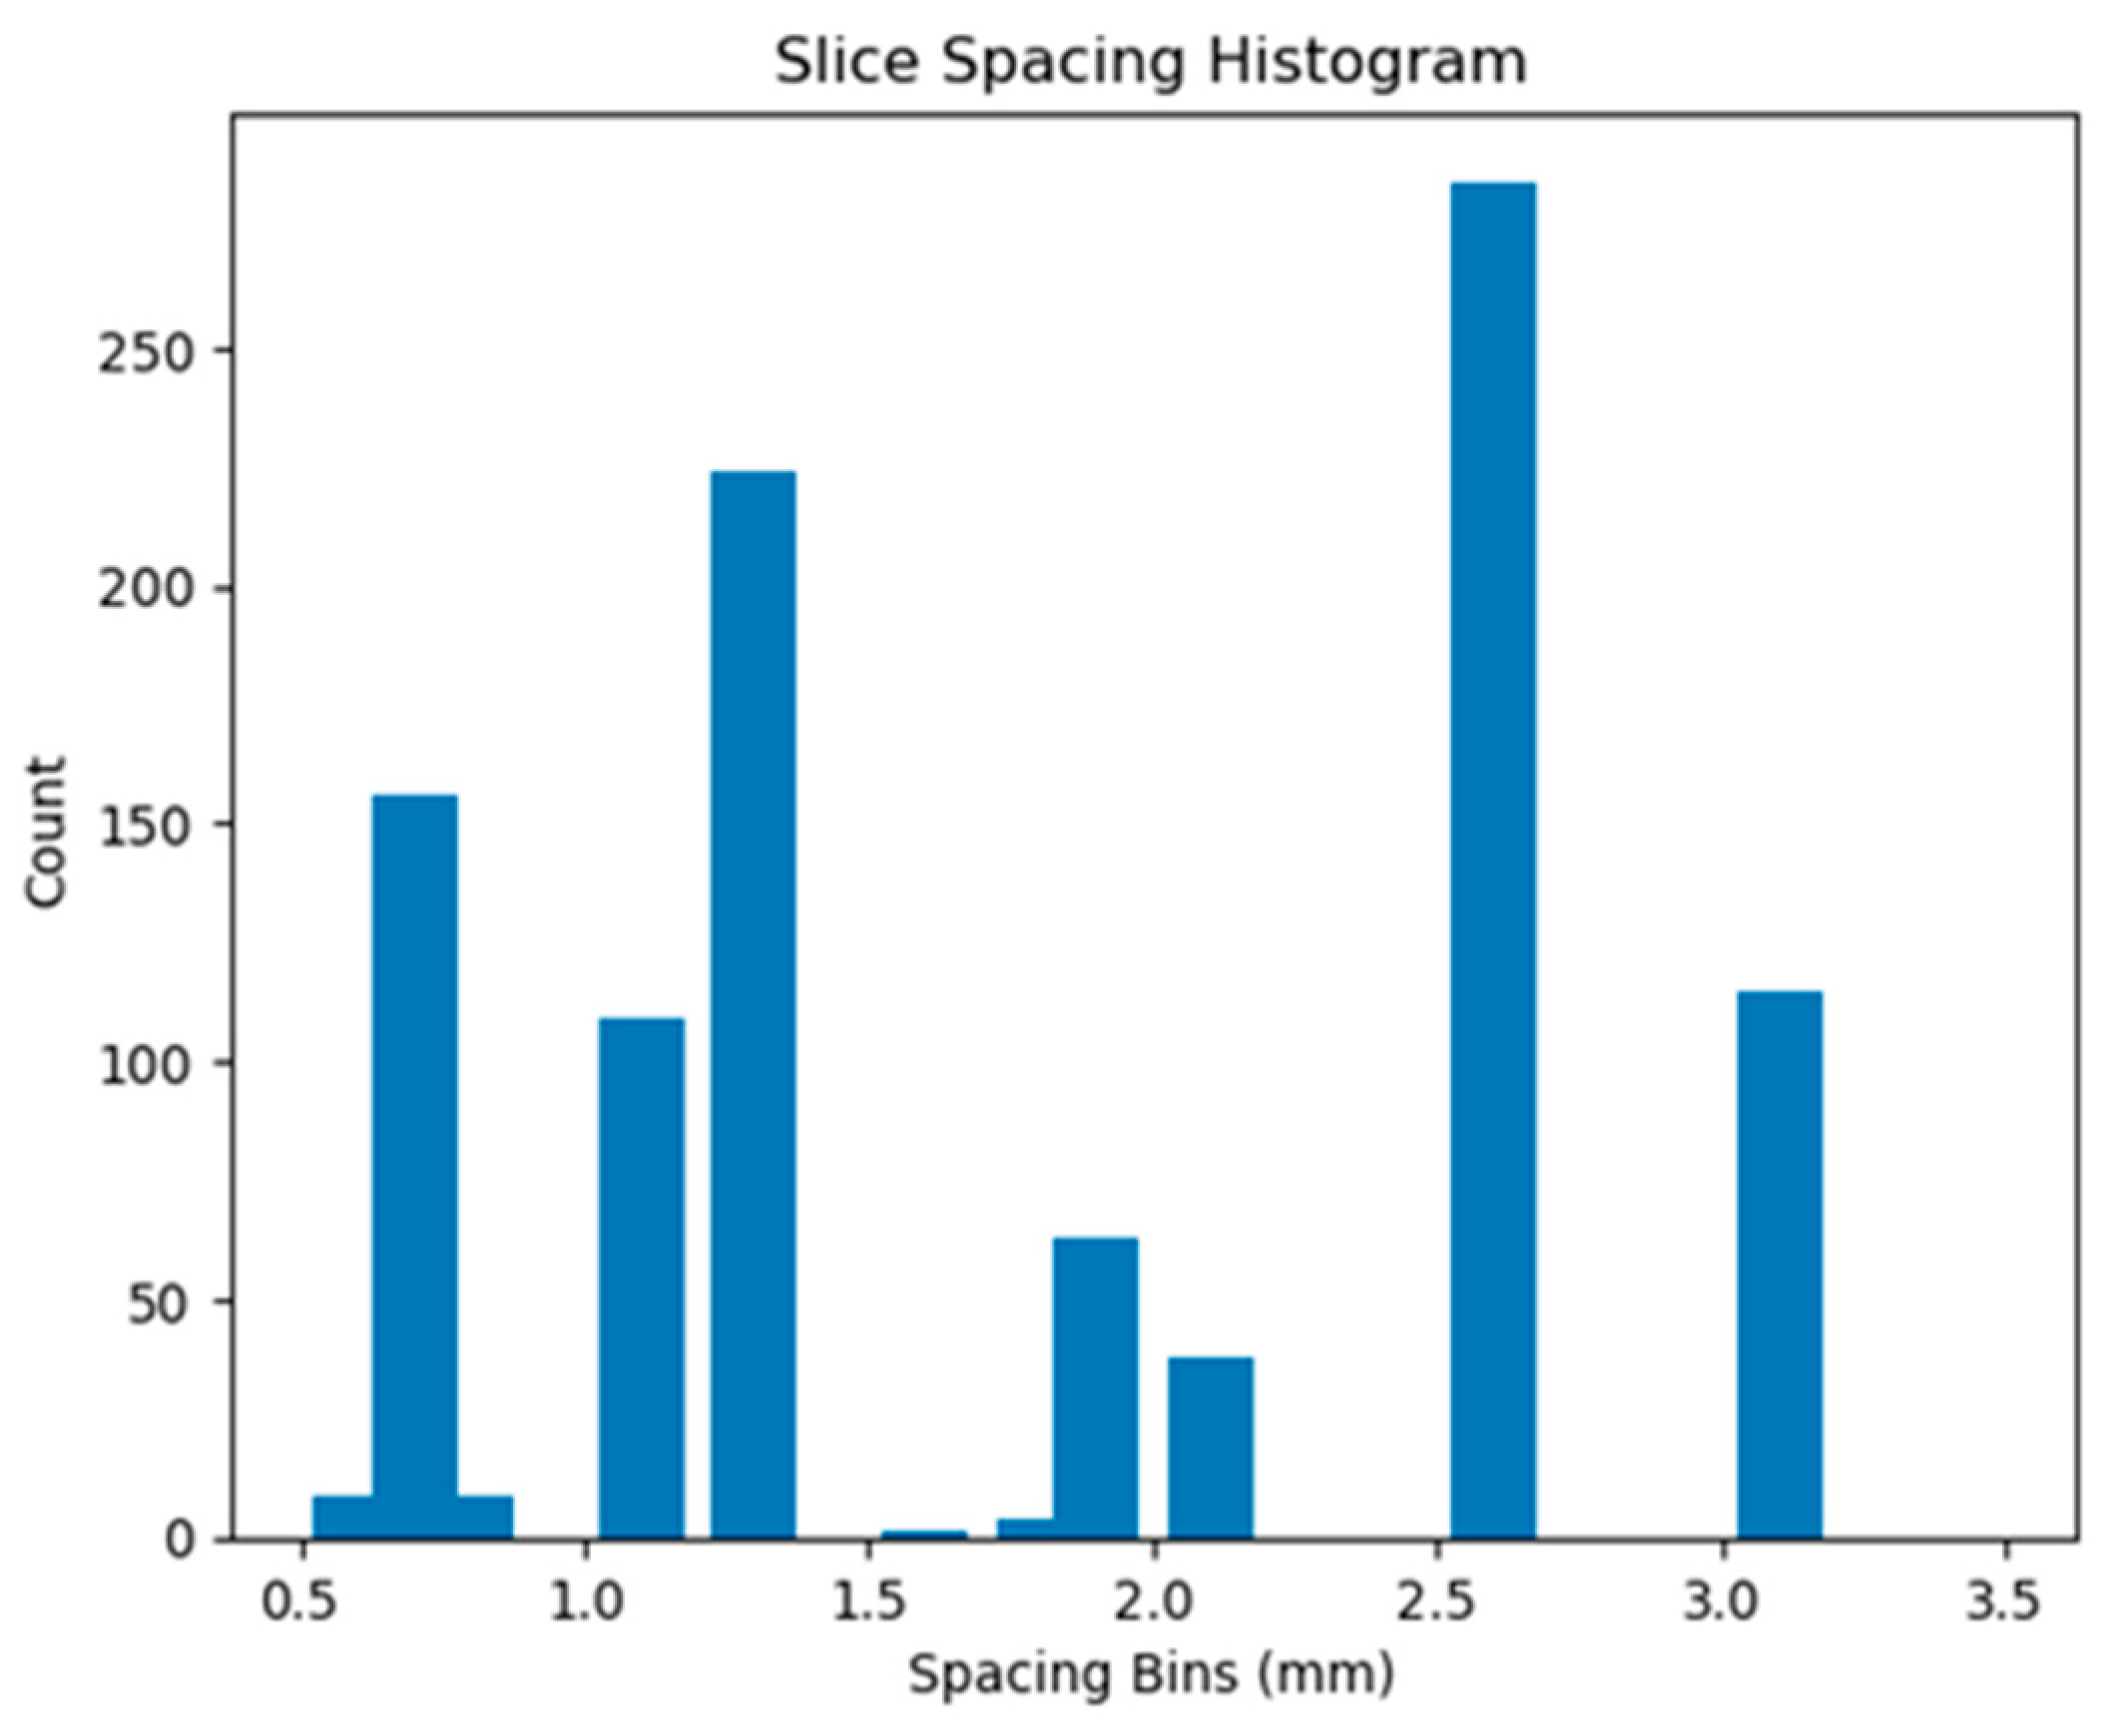
At the scan level, CT scans with a slice thickness greater than 2.5 mm were filtered out to ensure uniformity in the dataset. Then, the CT scan values were converted to Hounsfield Units (HU) [
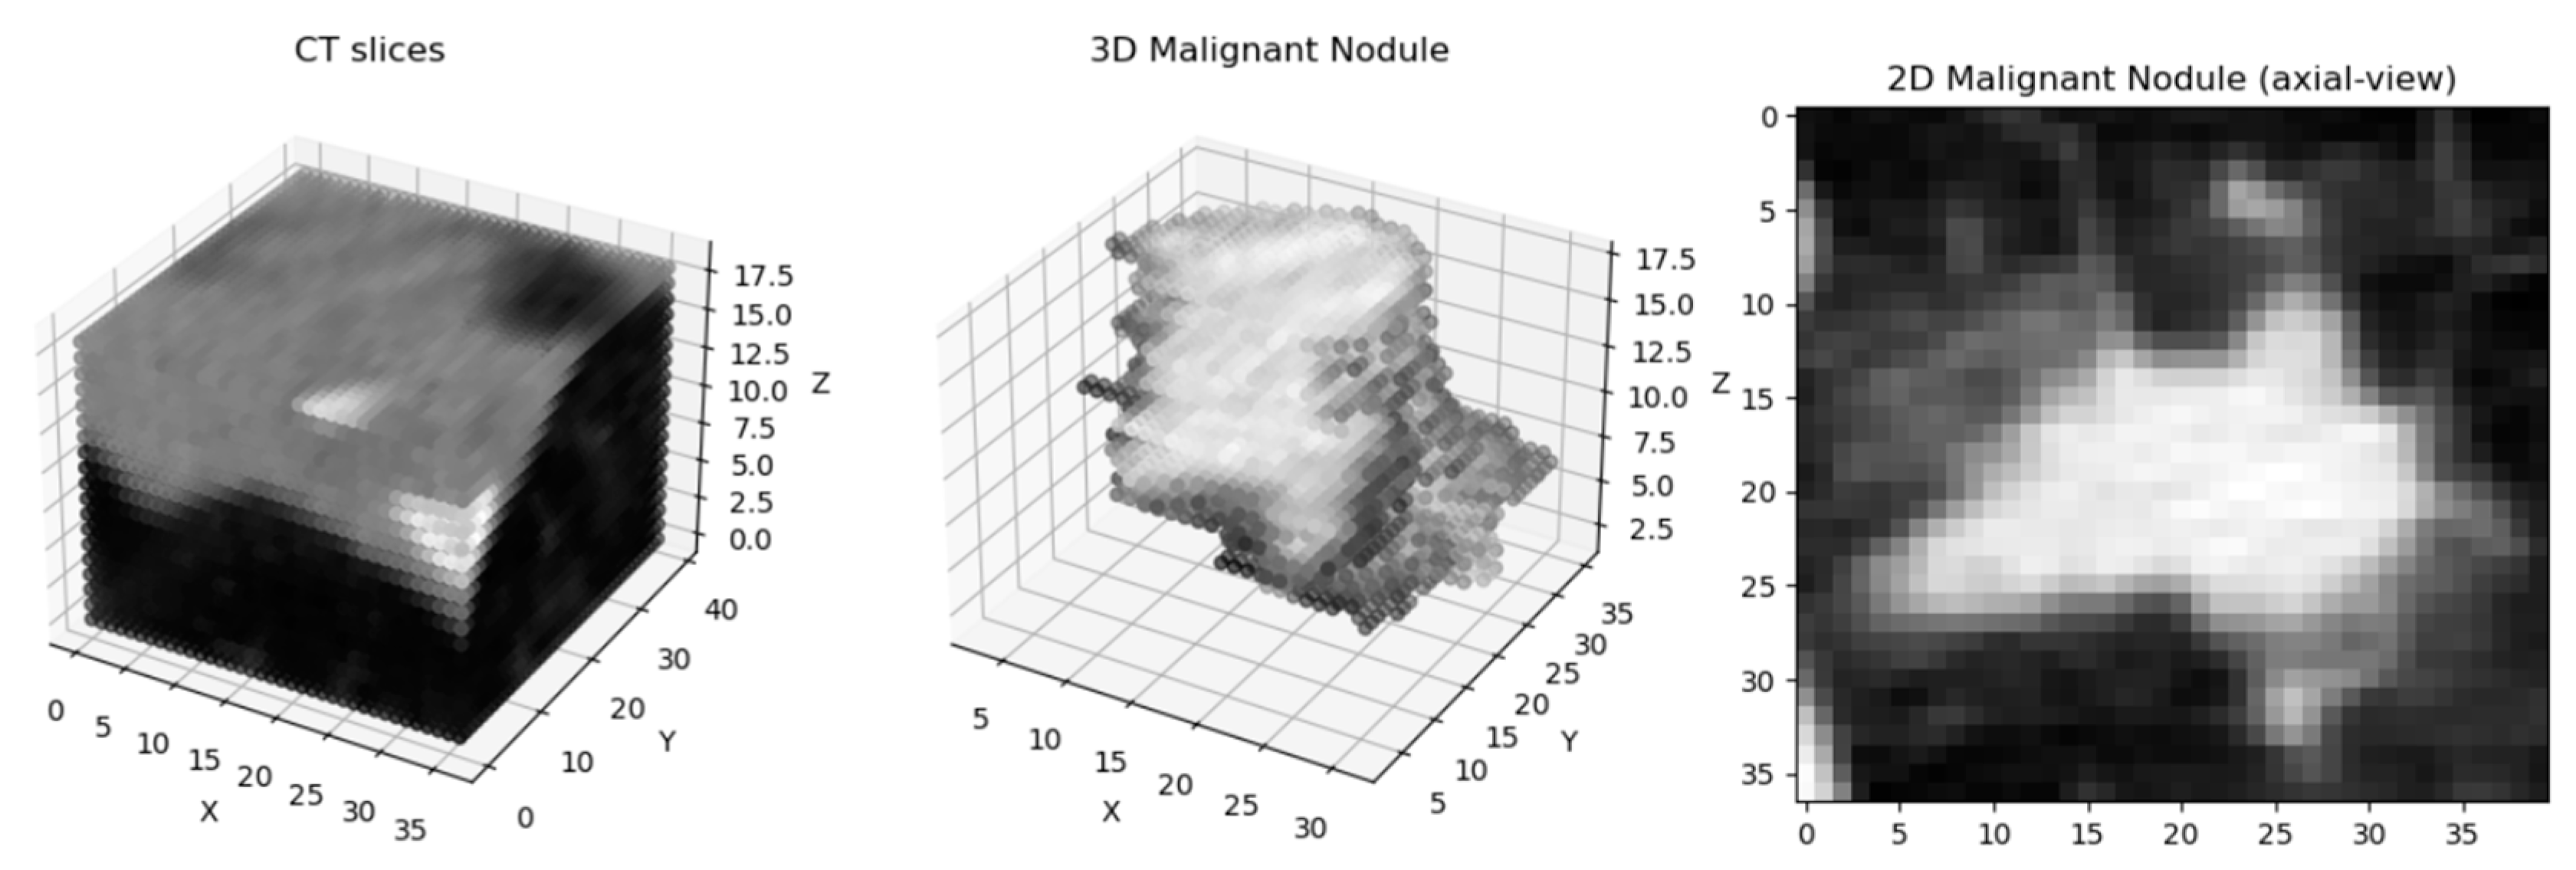
33], which is essential for standardizing the intensity values across scans. To ensure consistent voxel spacing, both the CT scan and corresponding mask were resampled to a uniform spacing of 1 × 1 × 1 mm, based on the pixel spacing and slice thickness. Following this, the data were normalized to a range between −1 and 1 to prepare them for model training. The resampled volumes and masks were then saved as Nifti images for easy access and manipulation during the training process. The following figure (
Figure 1) demonstrates a preprocessed nodule sample:
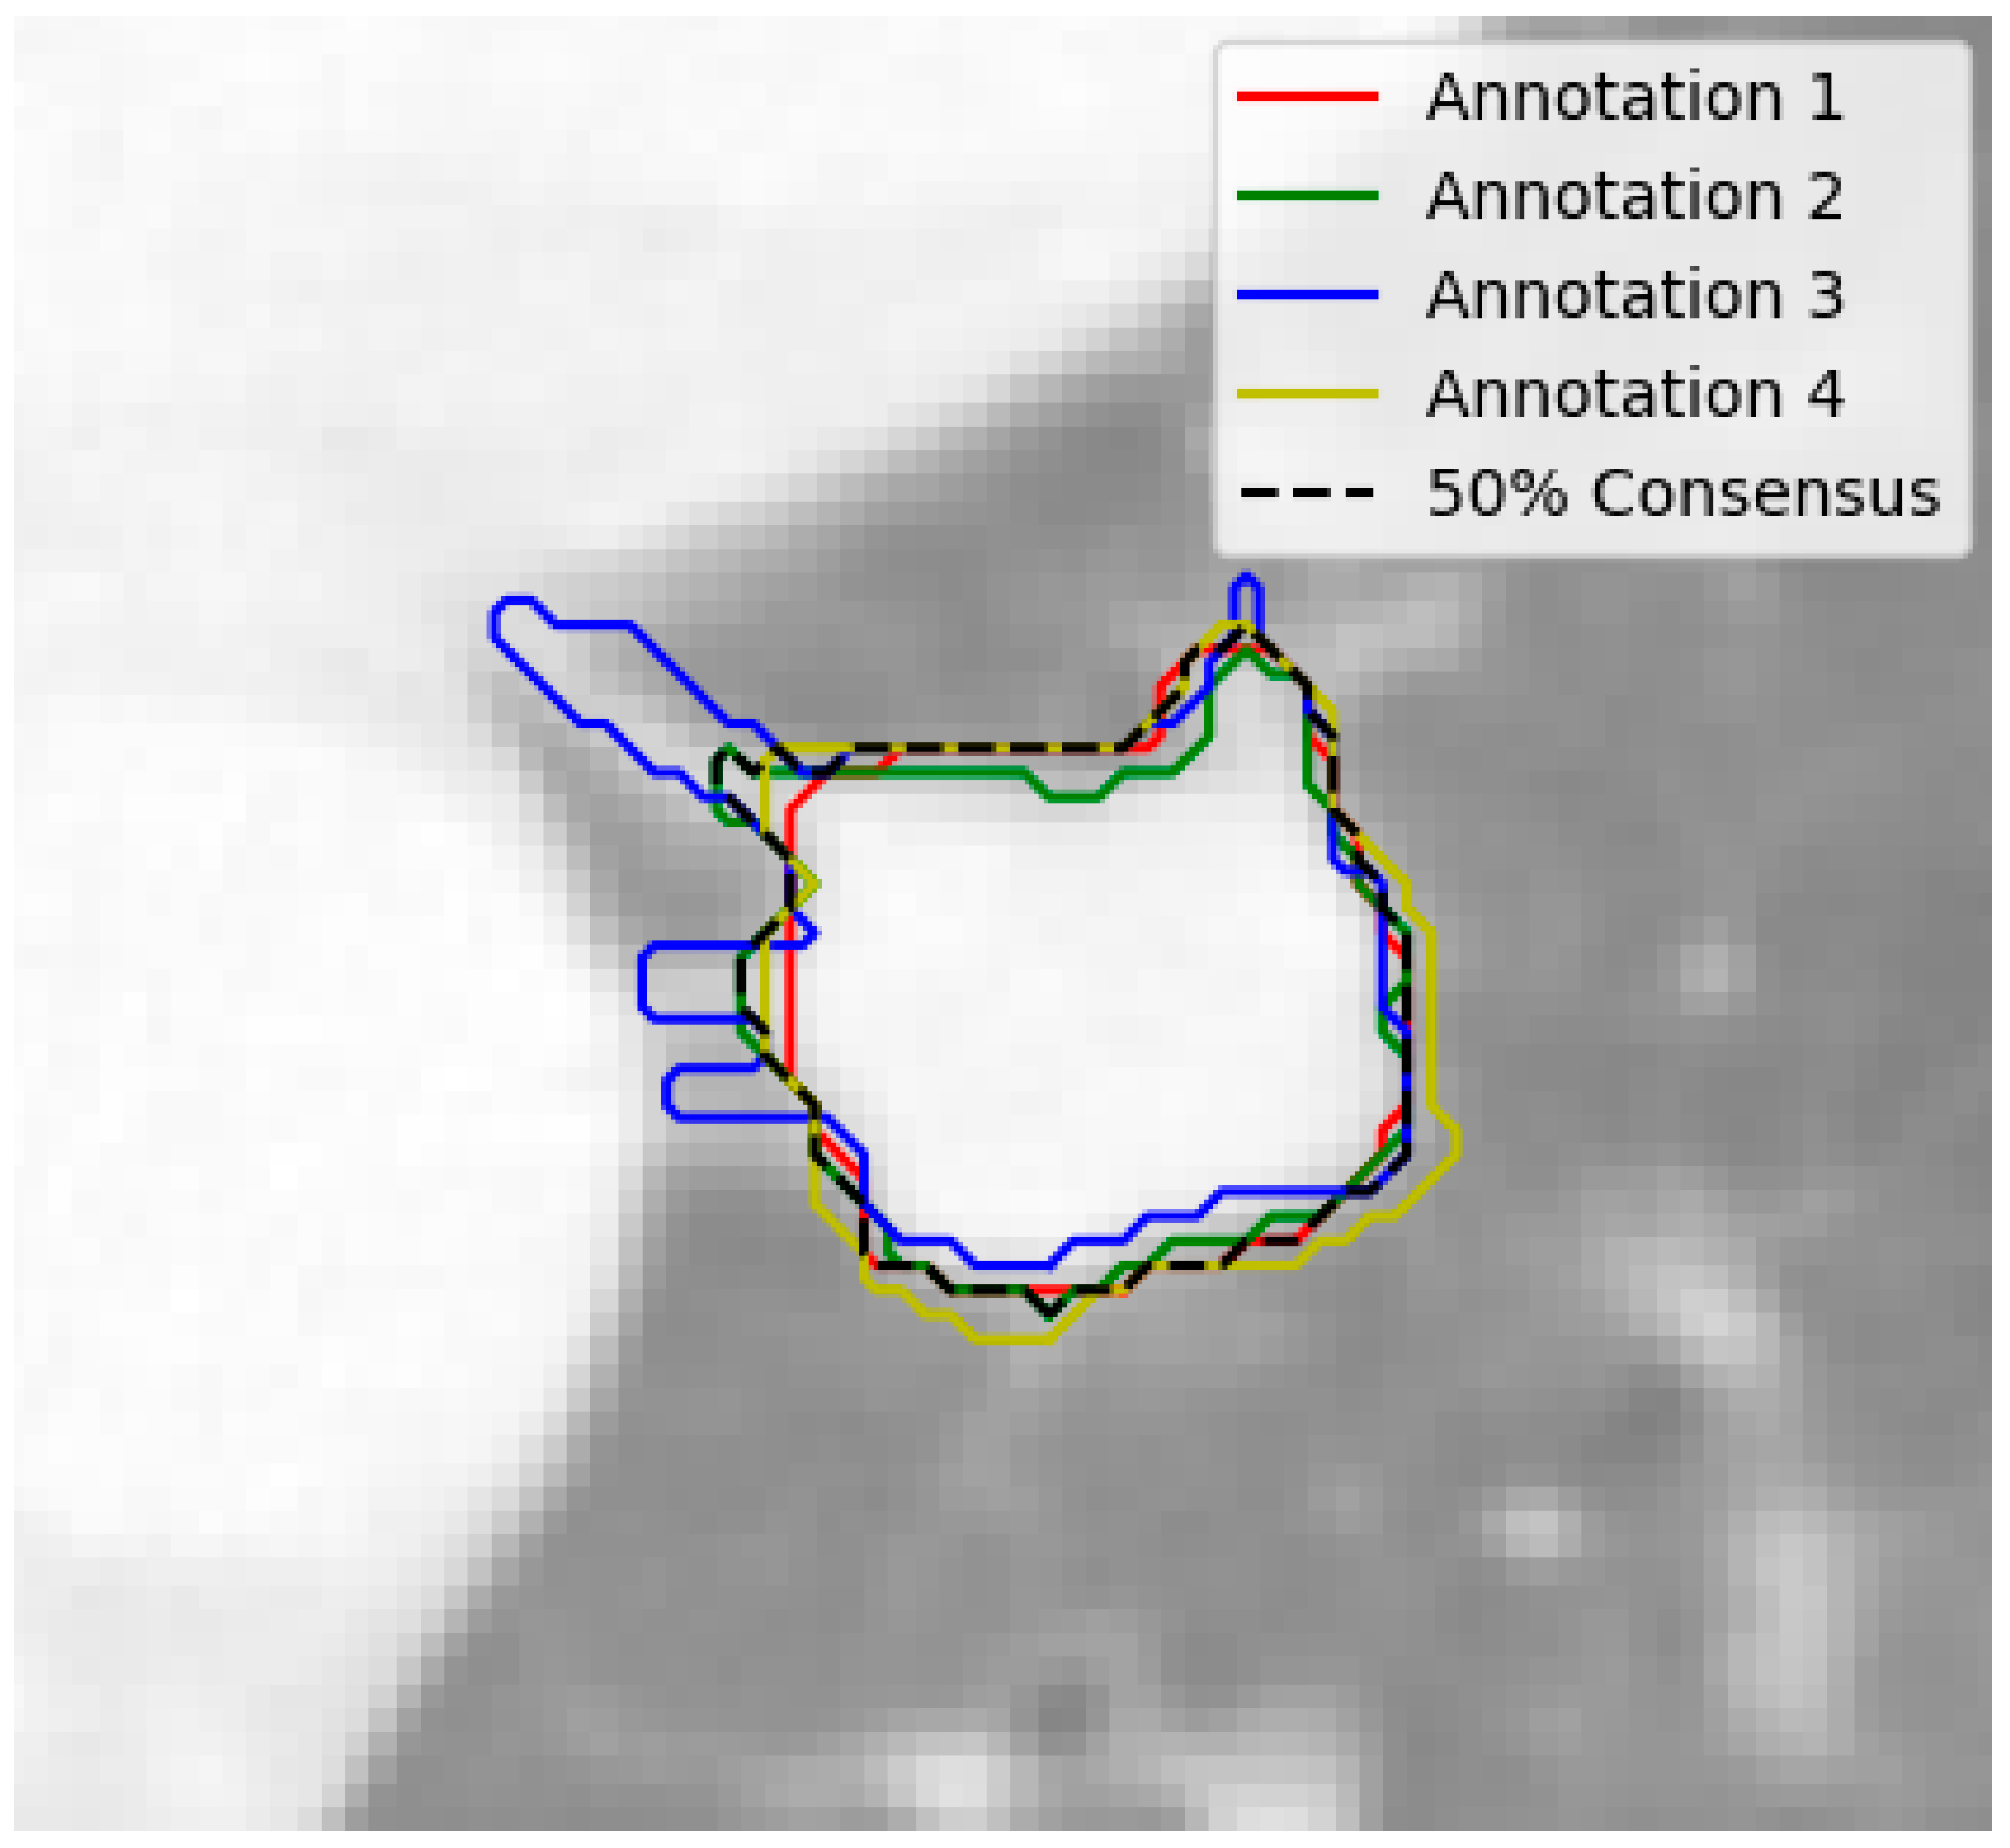
At the nodule level, the nodules with fewer than 3 annotations or those with a diameter smaller than 3 mm were filtered out, ensuring that only relevant and adequately annotated nodules were included. The remaining nodules were grouped based on their position, using a built-in function from the pylidc package. In order to handle the varying nodule annotations, consensus nodule masks were extracted by combining all of the individual masks annotated by radiologists. A 50% consensus threshold was applied, and the masks were averaged to create a final, representative mask for each nodule as seen in
Figure 2.
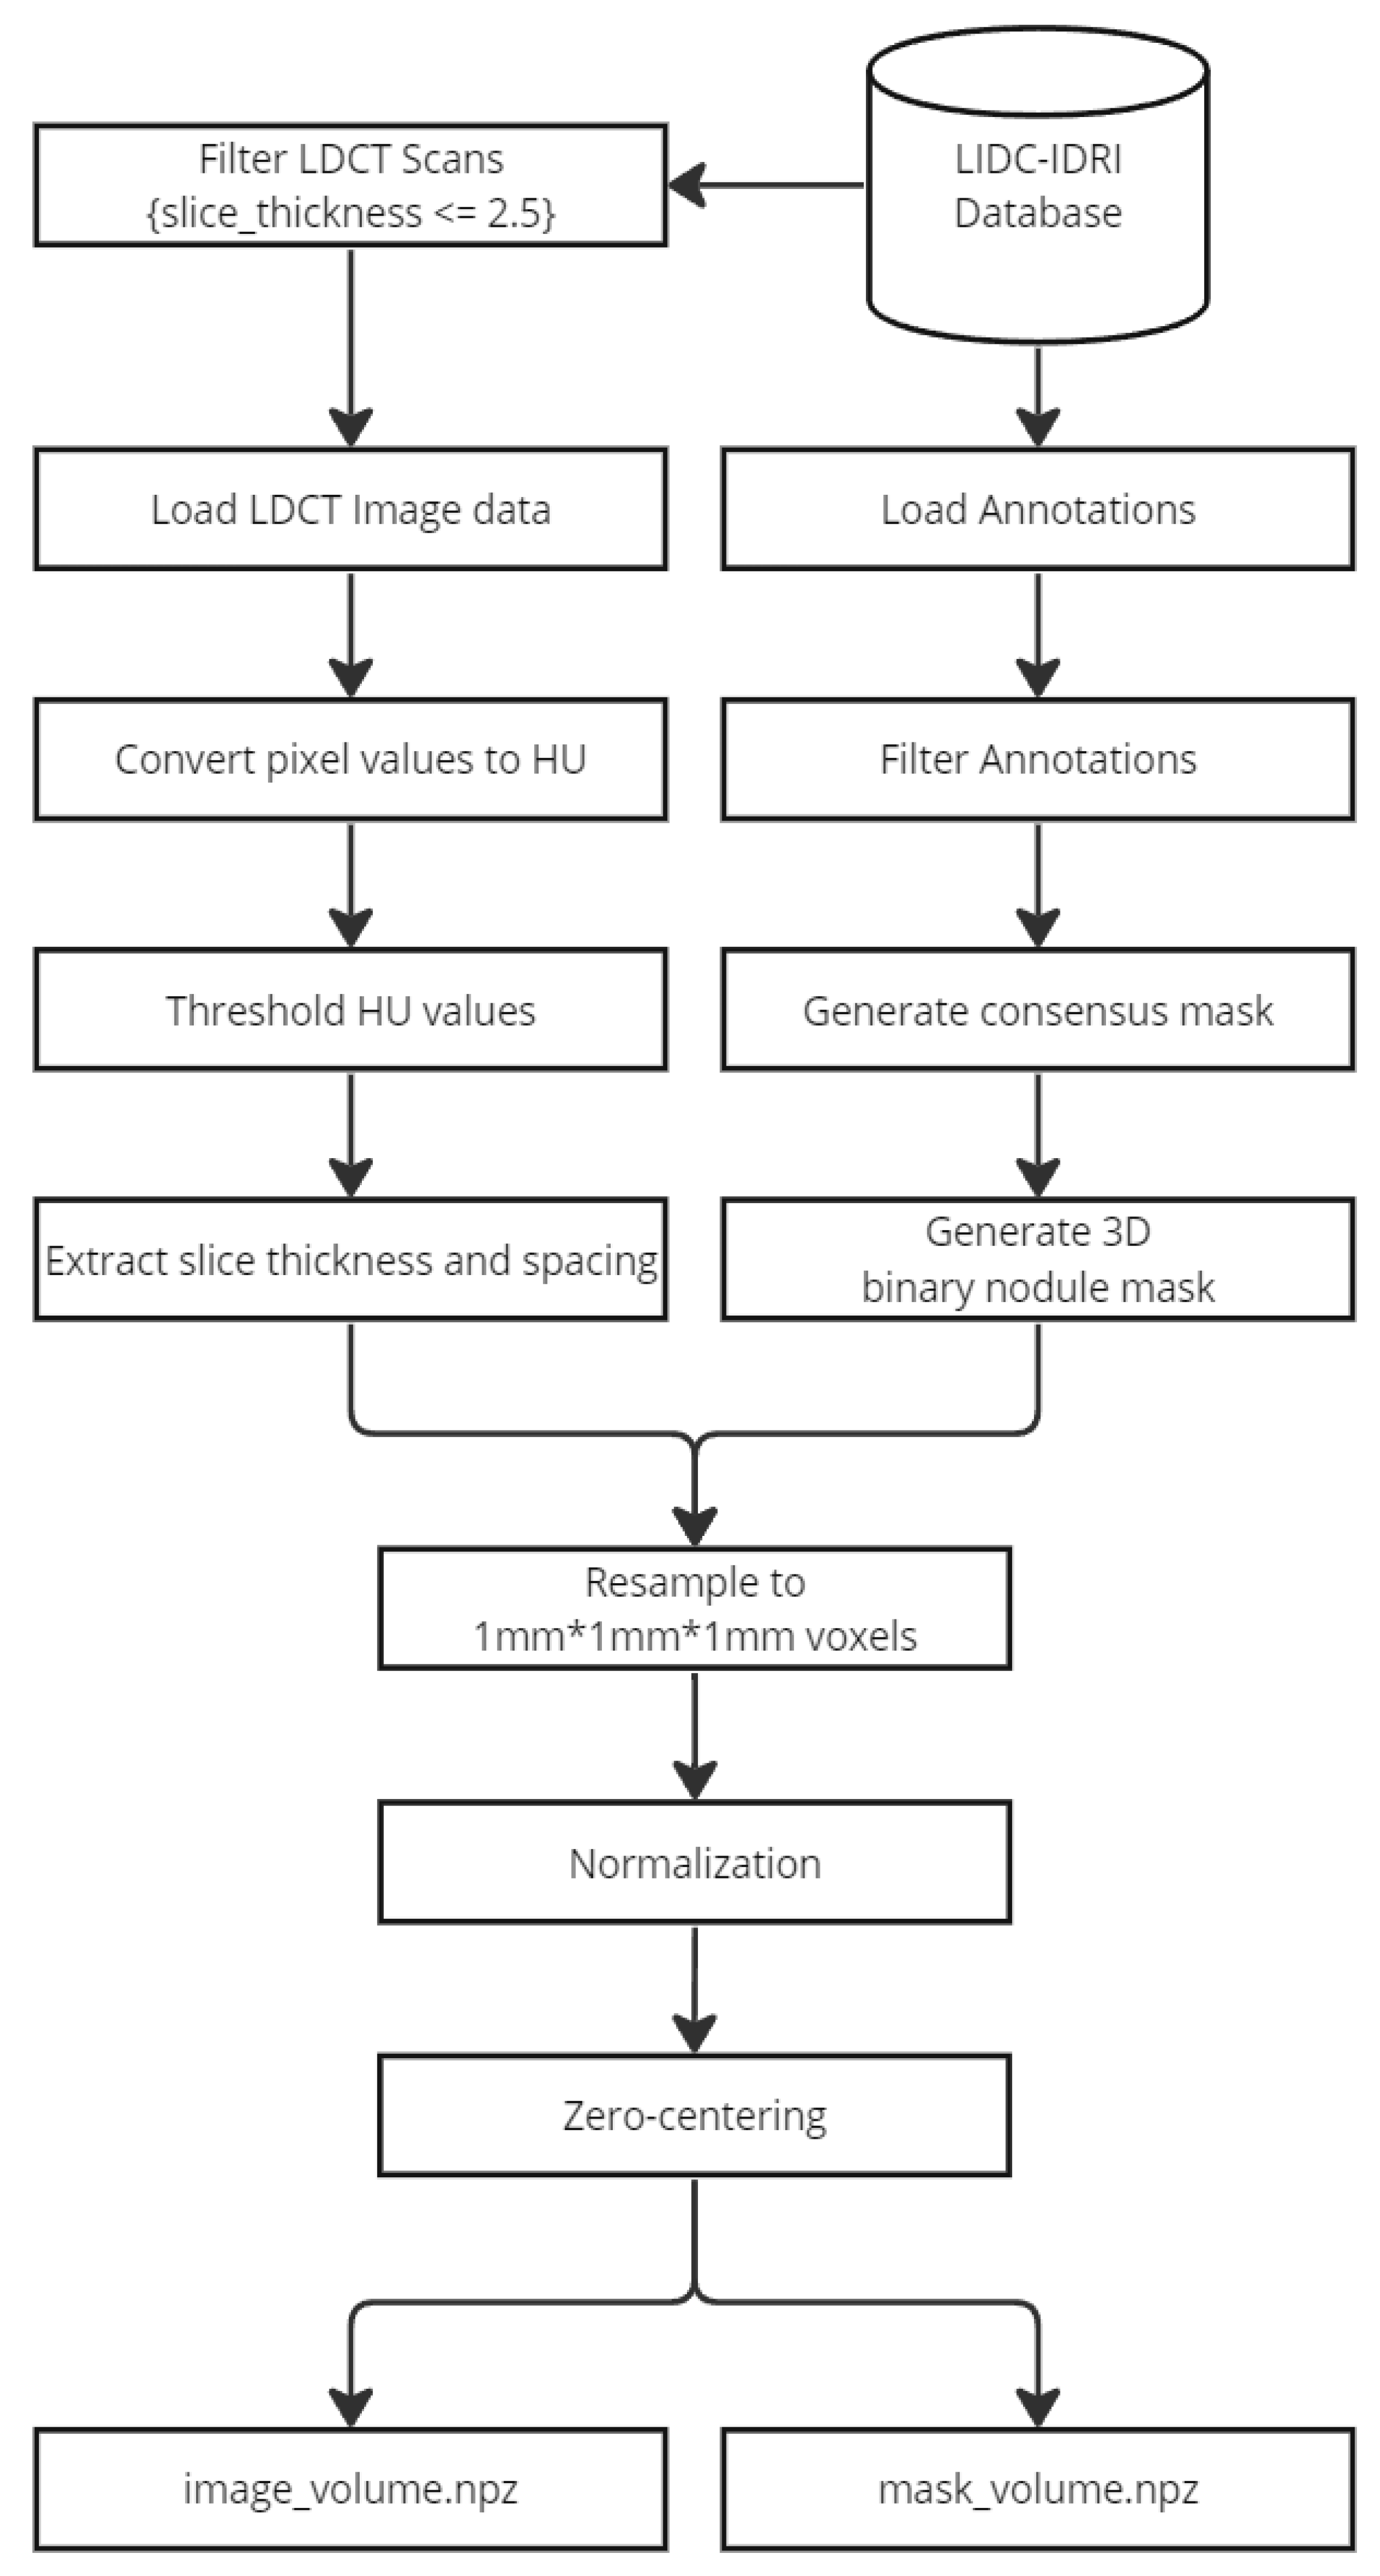
Additionally, a method was developed to handle disagreements between annotations by extracting the most common label for each characteristic. Finally, the annotations were saved as 3D masks for further analysis and model training. These preprocessing steps ensured that data were properly formatted and standardized, making them suitable for training. The following figure (
Figure 3) demonstrates the preprocessing steps collectively.
3.4. Patch Extraction and Data Augmentation
CT volumes are typically very large, and it is hard to fit entire volumes into the memory while training. Instead of loading the entire scan, a patch-based extraction pipeline was implemented to efficiently handle the loading and preprocessing of LDCT data for the proposed patch-based analysis. For this purpose, the capabilities of Torch IO [
34] (version 0.19.0) were utilized. Torch IO, a specialized library designed for the unique requirements of medical imaging data, offers tools to efficiently load and augment CT images, ensuring they are appropriately prepared for subsequent analysis.
A patch-based extraction method was developed to extract 3D volumes of the dimensions 64 × 64 × 32 (where 64 × 64 is the size of the single-layer image, and 32 is the number of depth layers) and use them as training samples. To mitigate overfitting on the training set, 3D patches were extracted online during training, ensuring that the patches differed in each epoch. Additionally, data augmentation techniques were applied in the 3D space, including random transformations such as flipping, affine transformations, elastic deformations, and patch swapping.
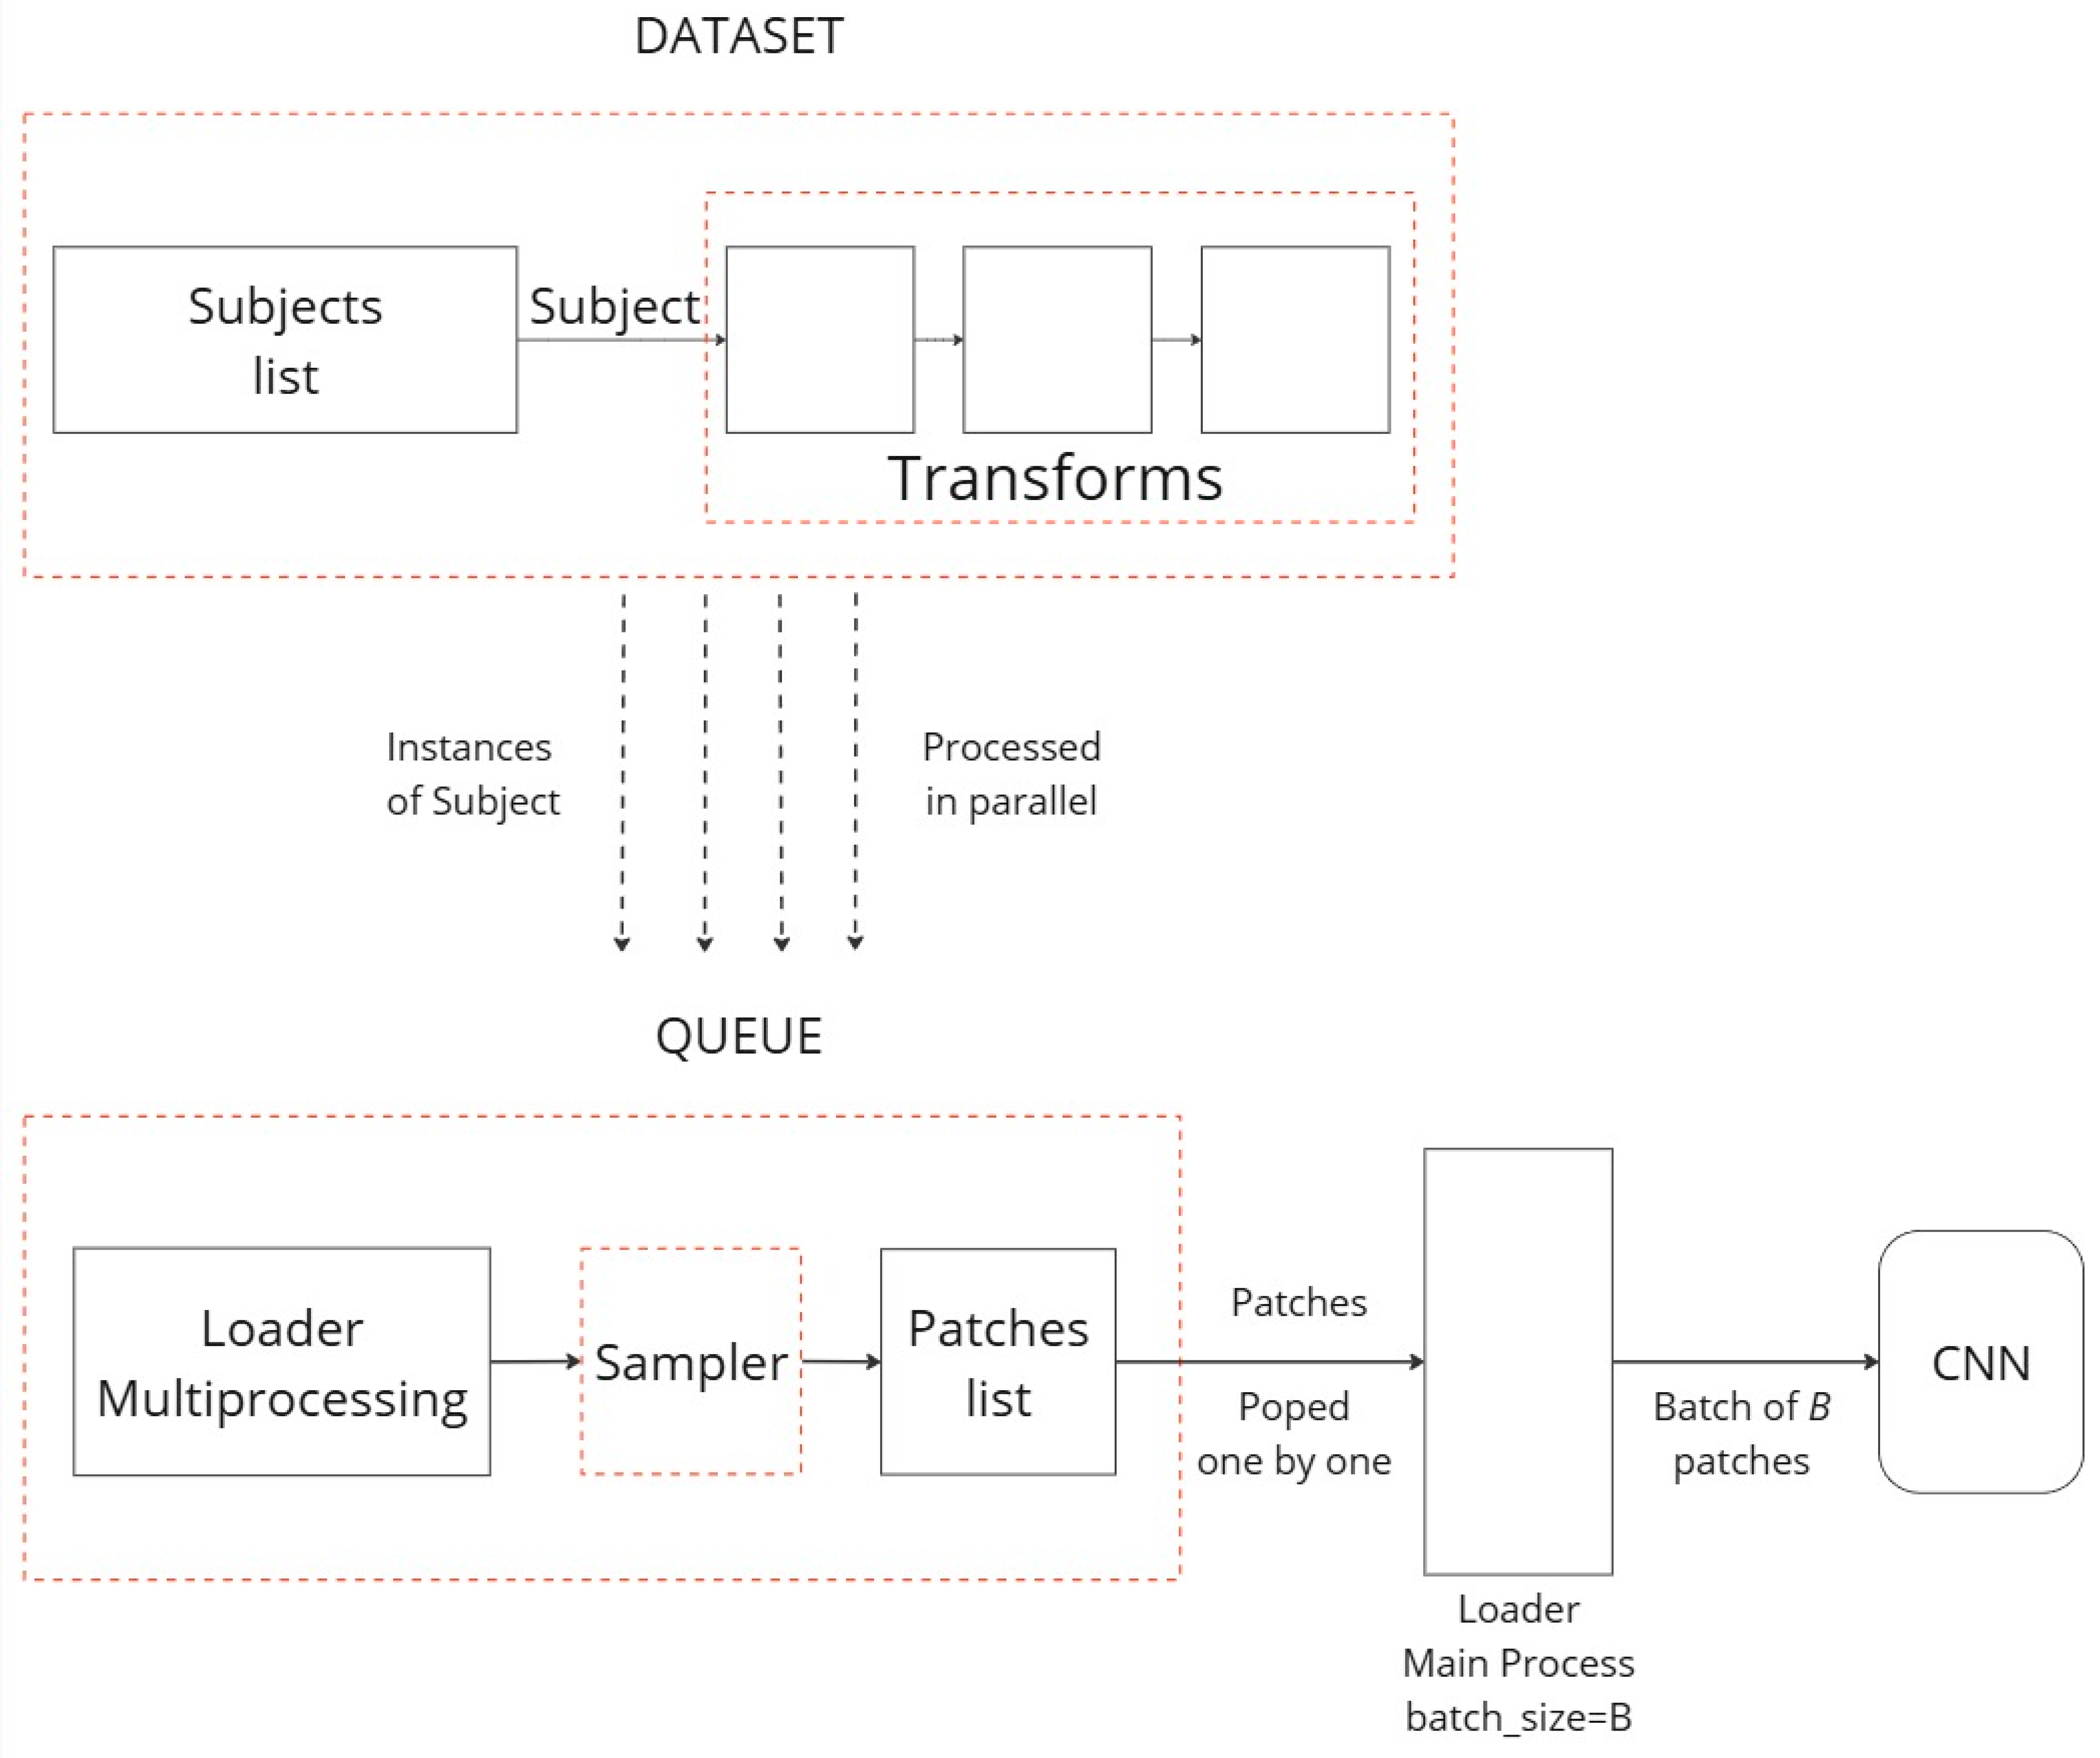
For this experiment, a 10:1 probability ratio was implemented for extracting 3D patches containing nodule samples, with four patches extracted from each scan. This approach of probabilistic patch extraction allowed us to dynamically obtain 3D patches that are highly likely to contain nodule samples, while also maintaining a chance of extracting patches without nodules. To increase the diversity of the training data, the aforementioned transformations were applied at the start of each epoch. For the validation and testing datasets, however, only patch extraction was performed, without any additional transformations. This strategy ensures a robust training process while maintaining the integrity of the validation and testing data for accurate model evaluation. The diagram of
Figure 4 showcases the patch extraction approach:
3.5. Dataset Split
An initial data split was employed, allocating 80% of the dataset for training and the remaining 20% for validation. From the validation set, an additional 10% was allocated to create a dedicated test set for final model evaluation. Additionally, a filtered dataset containing only scans with at least one nodule was generated to focus on relevant cases for this analysis.
Table 2 presents the number of scans per set.
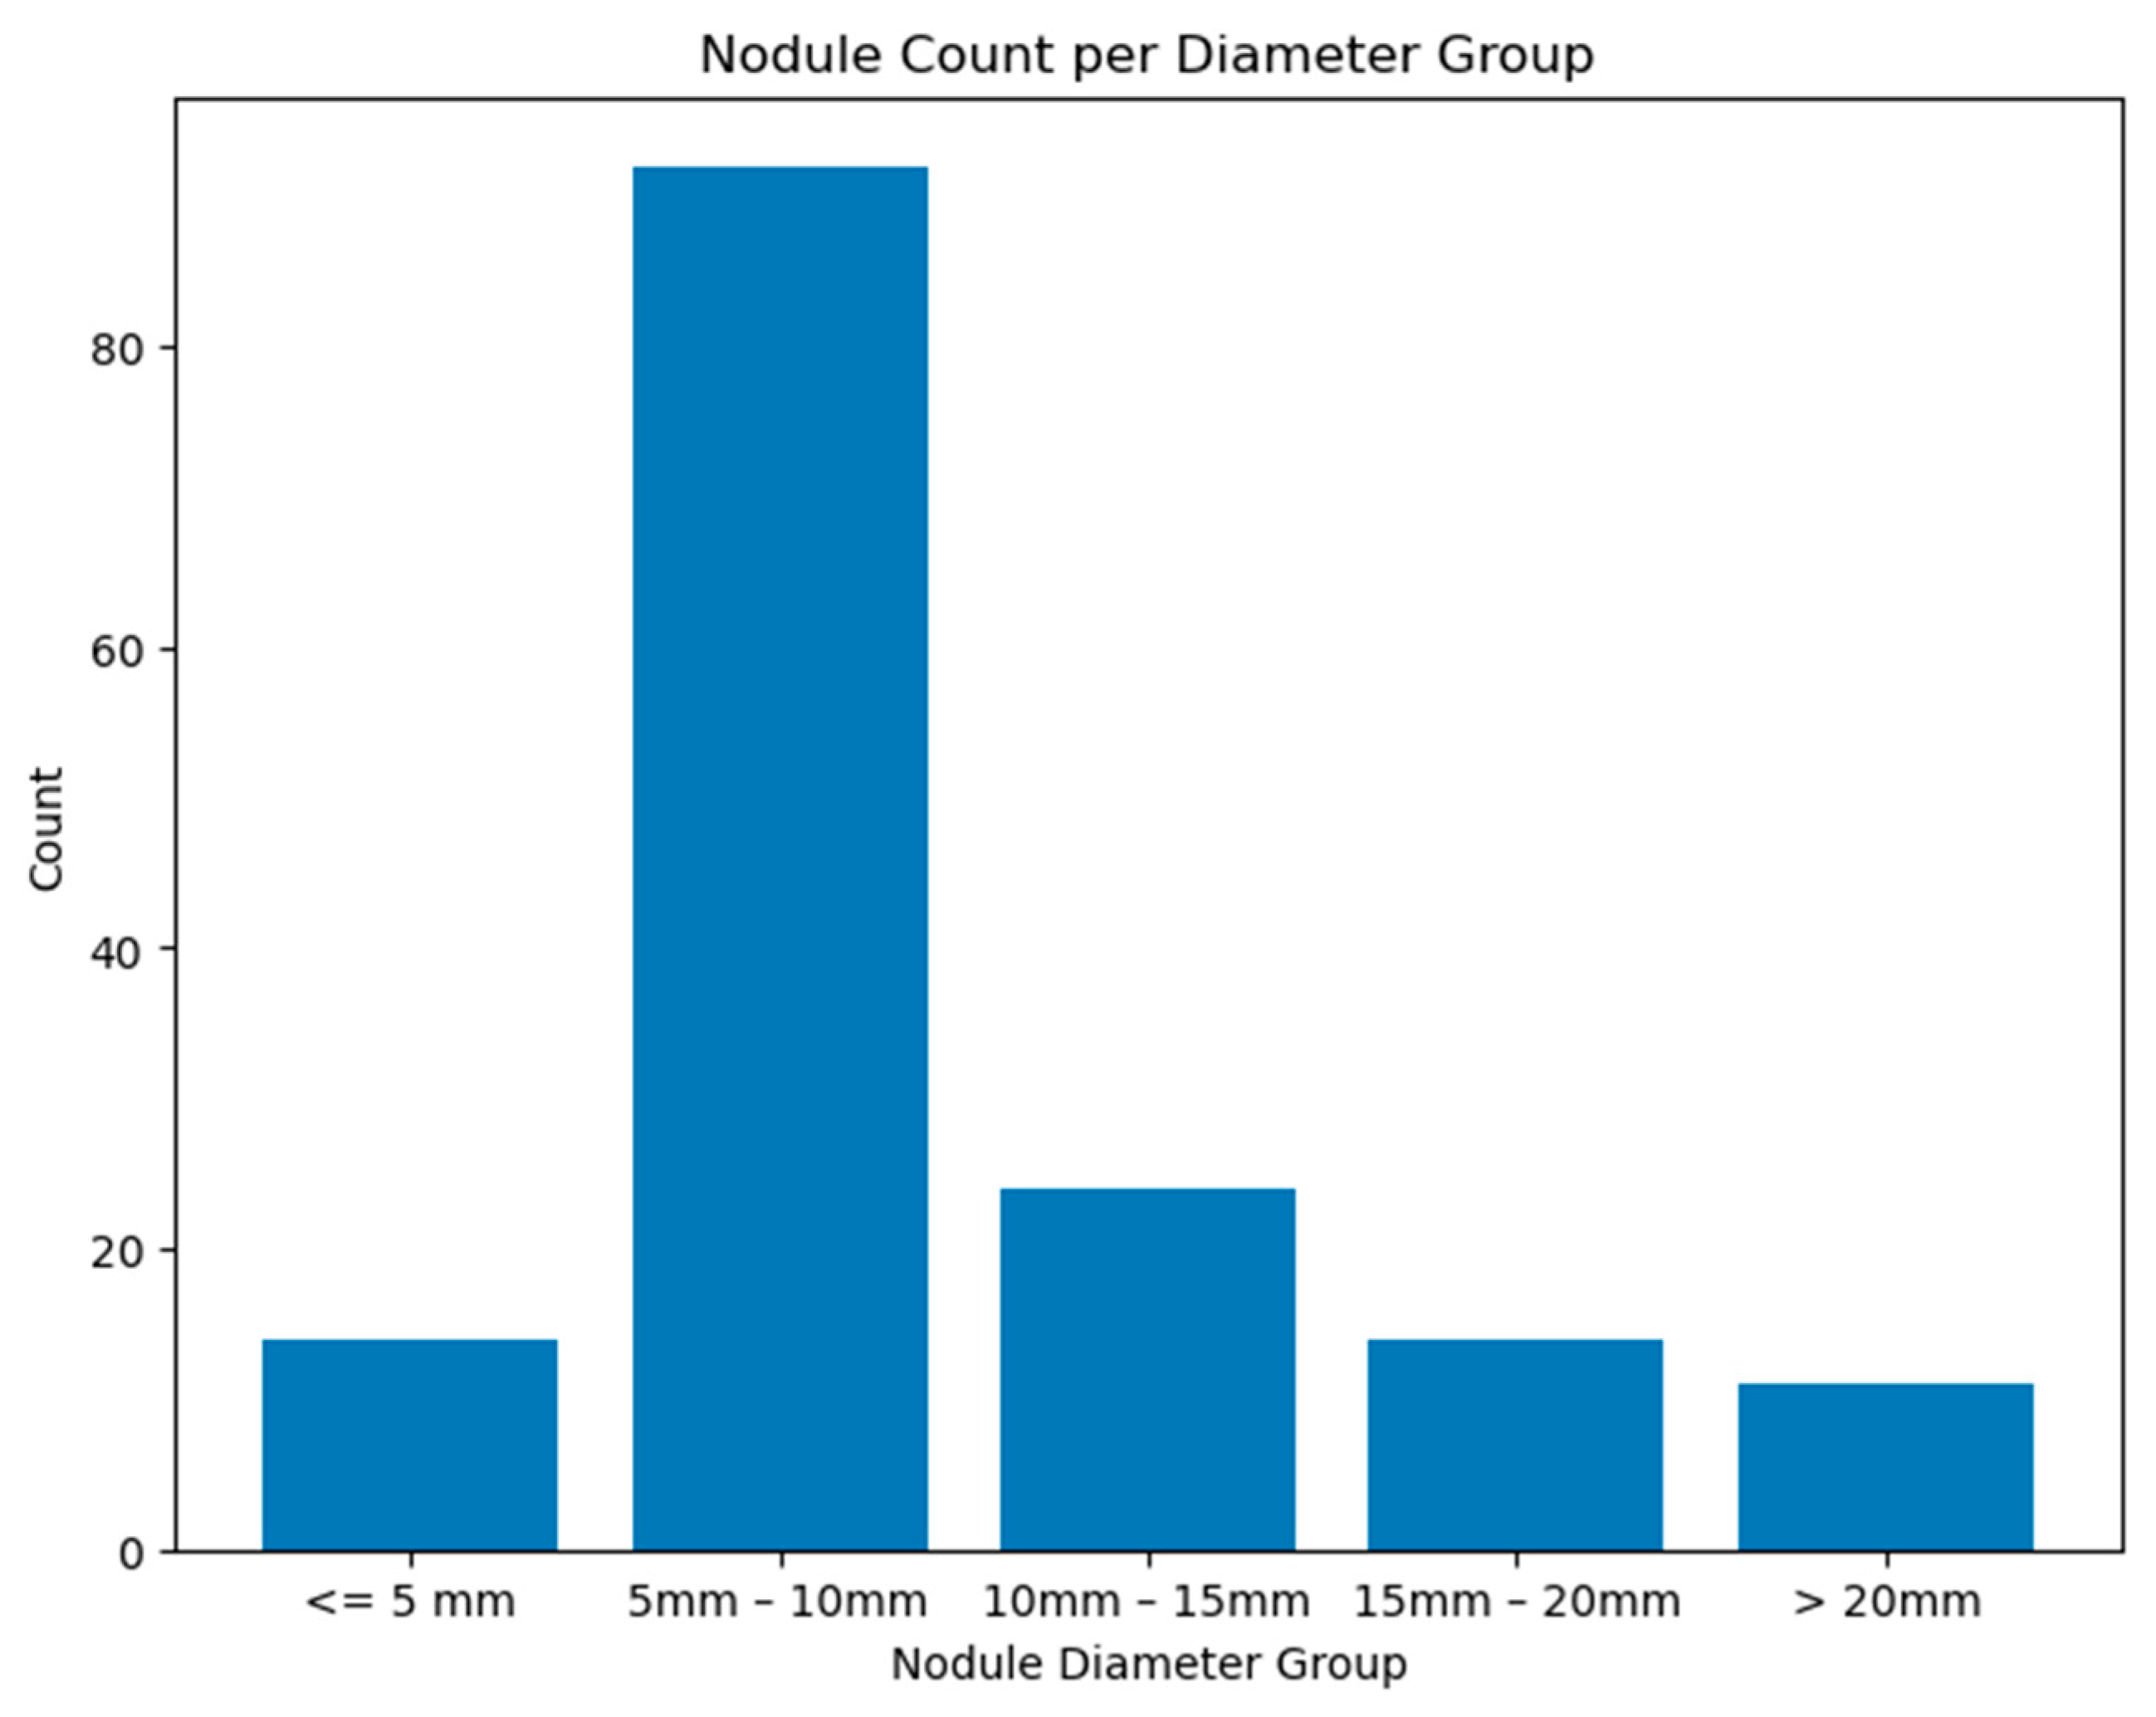
The distribution of the nodule characteristics in the testing set is illustrated in
Figure A7 (see
Appendix A.3), while
Figure A8 illustrates the histogram nodule diameters. These histograms provide a detailed overview of the dataset’s composition, highlighting the diversity of nodule types used for evaluating our model’s performance.
3.6. Training Experiments
The first loss function employed for the binary semantic segmentation task was BCEWithLogitsLoss, which combines a Sigmoid layer and the BCELoss into a single class. The function is described in Equation (1):
where
input is the input tensor representing the logits from the model
target is the target tensor containing binary labels (0 or 1).
pos_weight is an optional weight to balance positive and negative examples (default is 1).
pos_loss is the binary cross-entropy loss for positive examples.
neg_loss is the binary cross-entropy loss for negative examples.
The binary cross-entropy loss for positive and negative examples is defined as
where σ is the sigmoid function and log is the natural logarithm.
The BCEWithLogitsLoss combines the positive and negative losses with an optional weight to form the final loss function used during the training of binary classification models.
The other utilized loss function for the binary semantic segmentation problem was the Dice Loss, a well-suited metric to assessing the performance of models in scenarios where the task involves distinguishing between two classes. The Dice Loss, or Sørensen-Dice coefficient, is defined as in Equation (2):
where
p denotes the predicted binary segmentation mask,
g denotes the ground truth binary segmentation mask,
Intersection (p,g) represents the intersection of the predicted and ground truth masks,
Union (p,g) represents the union of the predicted and ground truth masks,
ϵ is a small constant added to the denominator to prevent division by zero.
A lower Dice Loss indicates improved alignment between the predicted and ground truth masks. The Dice Loss is particularly advantageous for binary segmentation tasks, contributing to robust model performance even when faced with imbalanced datasets.
Throughout the training process, the model finetunes its parameters to minimize the Dice Loss, thereby enhancing its ability to accurately delineate the regions of interest in the binary segmentation images.
Preliminary experiments were conducted without employing any data augmentation techniques. While this approach provided initial insights, it posed a risk of overfitting, particularly due to the limited size of the dataset. Data augmentation is crucial for enhancing model robustness and introducing variability during training, thereby improving generalization to unseen data.
In these initial experiments, various kernel sizes—specifically 3 × 3, 5 × 5, and 7 × 7—were evaluated to assess their impact on model training. It was observed that moderate kernel sizes (e.g., 3 × 3 and 5 × 5) generally provided a good balance between receptive field size and computational efficiency, while larger kernels (e.g., 7 × 7) tended to increase computational cost without significantly improving performance.
The training process was initiated with a learning rate (LR) of 0.001 and employed a dynamic Learning Rate Scheduler to adapt the LR based on the training progress. The scheduler reduced the learning rate whenever the loss function plateaued, ensuring steady optimization. For optimization, the Stochastic Gradient Descent (SGD) algorithm [
35] was utilized. The training process was conducted in three distinct phases, each using different loss functions to enhance model performance:
Phase 1: The model was initially trained for 80 epochs using Binary Cross-Entropy (BCE) as the loss function.
Phase 2: Using the model’s checkpoint from Phase 1, training continued for another 120 epochs with Dice Loss as the loss function and a reduced learning rate of 0.0001.
Phase 3: Finally, using the checkpoint from Phase 2, the model underwent an additional 60 epochs of training with BCE loss to further refine performance.
This multi-stage training strategy allowed the model to benefit from the strengths of both BCE and Dice Loss functions, improving its ability to handle class imbalances and segment fine details.
Table 3 demonstrates the hyperparameters that were set for these experiments.
3.7. Evaluation Metrics
Intersection over Union (IoU): IoU is a key metric for evaluating segmentation accuracy. It quantifies the overlap between the predicted and actual segmentations. IoU is calculated as the ratio of the area of overlap (true positives) to the area of union (sum of true positives, false positives, and false negatives).
Dice Score: The Dice score assesses the similarity between the predicted segmentation and ground truth. It is mathematically derived as twice the area of overlap (true positives) divided by the total number of pixels in both the predicted and actual segmentations.
5. Discussion
The experimental results demonstrate that this dynamic patch-based approach, combined with the HighRes3DNet architecture, achieves competitive performance in pulmonary nodule segmentation while offering practical advantages in computational efficiency and training stability. The final model achieved a Dice coefficient of 82.65% based on the test set, positioning it comparably among current state-of-the-art approaches in the field.
The progressive improvement observed across training rounds, from an initial Dice score of 79.3% to 82.88% based on the testing set, highlights the effectiveness of our iterative training strategy. The transition between loss functions, particularly the incorporation of Dice Loss in the second round, proved beneficial for enhancing model performance. This improvement suggests that the model successfully learned to capture increasingly refined features of pulmonary nodules while maintaining generalization capability, as evidenced by the consistent performance on the test set.
When comparing our results with existing approaches in the literature, several insights emerge. While some methods achieve higher Dice scores, such as the DAS-Net (92.05%) [
22] and V-Net with attention mechanisms (94.9%) [
24], these approaches typically incorporate more complex architectural elements, particularly attention mechanisms and specialized edge detection components. Our method achieves comparable performance (82.65%) to several established approaches, such as the 3D U-net based method (82.48%) [
21] and 3D GAN (82.88%) [
23], while maintaining a simpler architectural design and introducing the advantages of dynamic patch extraction.
The performance analysis revealed specific challenges that merit further investigation. The model showed reduced effectiveness in segmenting ground glass opacity (GGO) nodules and ultra-small nodules, which were underrepresented in the training data. This limitation points to an important area for future improvement, potentially through targeted data augmentation strategies or architectural modifications specifically designed to handle these edge cases. These studies [
21,
25] emphasized that the loss of information about small nodules during continuous down-sampling operations can negatively impact model performance. Consequently, the choice of down-sampling methods and kernel sizes in an architecture is crucial for optimal results.
Labeling inconsistency and disagreements can be problematic while training a deep learning model. The mask labels produced by the doctors did not always agree, creating noise and confusing our model. Our solution to this was to extract the average mask. The same issues had to be faced while extracting the nodule characteristic. Furthermore, there were disagreements between some of the annotations generated by the doctors, and thus a method to extract the consensus label per characteristic was developed.
By using a patch extraction method, this training pipeline was able to efficiently extract and load 3D patches of our volumetric LDCT data. The queue approach helped us to utilize all the computing power of our machine by loading patches to the memory before they were requested by the data loader. This not only helped to manage the memory better but also dynamically created new training samples in each epoch of our experiments.
The decision to not perform lung parenchyma segmentation, as applied in other studies [
25,
26,
29], was influenced by the unique context of juxta-pleural nodules. Positioned near the pleural lining, these nodules exhibit intricate spatial relationships with surrounding lung tissue. Segmenting the lung parenchyma could disrupt or alter these relationships, potentially compromising the accuracy of nodule boundary segmentation. Omitting parenchyma segmentation ensures a precise representation of juxta-pleural nodules while preserving their anatomical context, aligning with the objective of providing detailed insights into their characteristics.
The integration of HighRes3DNet, previously unexplored in pulmonary nodule segmentation, demonstrates the potential for cross-domain adaptation of deep learning architectures. The architecture’s success in this application suggests that the residual connections and deep feature extraction capabilities, originally developed for brain segmentation, are equally valuable for pulmonary imaging tasks. Our findings show that our models perform on par with other leading-edge studies in the field. With additional fine-tuning of our model’s parameters, there is potential to enhance the performance even further. This suggests that our approach not only holds its ground against current advanced systems but also has significant room for optimization and improvement.
Some limitations of this study should be acknowledged, particularly those stemming from the constraints imposed by the LIDC-IDRI database. This dataset was limited in terms of the number of scans, and there was a significant imbalance in the distribution of nodule characteristics. In our work, a segmentation model that addresses all nodule types and characteristics was developed. However, the representation of nodules varies based on their specific characteristics, and the underrepresentation of certain classes, particularly for rarer nodule types, raised concerns about underfitting. In such cases, the model may fail to capture the unique features of these less common nodules due to the limited data available. This scarcity can also lead to overfitting, where the model becomes overly tuned to the more prevalent nodule types and fails to generalize well to rare or atypical cases. Thus, addressing data imbalance is crucial to ensuring the model’s robustness and accuracy across all nodule types and characteristics. These findings underscore the critical need for creating a new, high-quality dataset that comprehensively represents diverse nodule types, particularly challenging cases like ground-glass opacity (GGO) nodules, to enhance model performance, generalizability, and clinical applicability.
In the context of future developments, we remain committed to improving our methodology by exploring alternative dimensions within our approach, seeking to uncover valuable insights that can propel our research forward. This exploration includes an investigation into the influence of varying kernel sizes within our model. The choice of kernel size is critical, as it directly impacts the model’s ability to capture features at different spatial scales within the input data. By systematically experimenting with various kernel sizes, this study aims to identify configurations that optimize both the accuracy and robustness of predictions, enhancing the model’s overall performance in handling complex segmentation tasks. Building on insights from studies like [
36], which employs an adaptive large kernel attention (ALKA) module, future work could explore the integration of dynamic kernel mechanisms to better capture multi-scale features. This approach has shown promise in improving segmentation for irregularly shaped structures, such as juxta-pleural or cavitary nodules, by balancing receptive field size and computational efficiency. Additionally, exploring the combination of loss functions, as in [
26,
29], or experimenting with boundary targeted functions, as in [
22], could further enhance the model’s performance by leveraging the complementary strengths of different loss strategies.
Another potential enhancement involves integrating attention mechanisms into the existing model, as these mechanisms can refine the model’s focus on relevant regions and enhance segmentation accuracy. As demonstrated in other studies [
22,
24,
25], the use of attention mechanisms has shown significant potential to improve overall performance and refine predictions. These improvements highlight the potential of attention mechanisms to enhance the model’s ability to focus on crucial features, further advancing the accuracy and robustness of lung nodule segmentation.
These findings suggest that while complex architectural features can enhance performance, there is significant value in developing efficient, practically implementable solutions that balance accuracy with computational resources. Our approach represents a step toward more accessible and deployable deep learning solutions for clinical practice.
However, it is important to note that the overall effectiveness of a computer-aided diagnosis (CAD) system depends on multiple factors beyond segmentation accuracy, including nodule classification, false positive reduction, and integration into clinical workflows. While our work provides a robust foundation for accurate segmentation, future studies should address these additional components to develop a comprehensive CAD system. A potential solution to enhance deployability and scalability could involve a cloud-based system that processes image patches efficiently, reducing computational burdens and enabling real-time collaboration across institutions. Such advancements would bridge the gap between experimental validation and practical clinical deployment, ensuring the system’s utility in real-world settings.
Deploying AI systems in clinical settings presents significant challenges, including variability in imaging protocols, demographic diversity, computational efficiency, workflow integration, and the need for robust multi-center validation. Drawing from recent works, such as the study by Frontiers in Oncology [
37], we recognize that addressing these challenges is critical for ensuring generalizability and practical deployment. To overcome these barriers, we propose a multi-faceted approach: conducting multi-center validation to enhance robustness, optimizing workflow integration with user-friendly interfaces, leveraging data augmentation and domain adaptation to handle variability in imaging data, exploring lightweight architectures and reinforcement learning for improved scalability, gathering clinician feedback through collaborative frameworks, and ensuring compliance with ethical and regulatory standards. These steps will be essential for bridging the gap between experimental validation and real-world clinical application.


