Article

GC×GC-TOFMS Analysis of Fecal Metabolome Stabilized Using an At-Home Stool Collection Device

1
Department of Chemistry, University of Alberta, Edmonton, AB T6G 2N4, Canada
2
The Metabolomics Innovation Centre, Edmonton, AB T6G 2E9, Canada
*
Author to whom correspondence should be addressed.
Appl. Biosci. 2024, 3(3), 348-359; https://doi.org/10.3390/applbiosci3030023
Submission received: 23 May 2024 / Revised: 20 July 2024 / Accepted: 9 August 2024 / Published: 14 August 2024

Abstract

:
Stool is a mixture of excrement, microbiota, enzymes, undigested material, and small molecules. Fecal metabolomics has gained interest recently, owing to advances in metabolomics and growing research into both the host’s physiology and the gut microbiome. One challenge with fecal metabolomics is preserving the sample integrity from collection until analysis, as the microbiota and enzymes continue to alter the metabolome following defecation. Currently, flash-freezing or lyophilization are utilized to minimize post-collection metabolome changes; however, this requires complex equipment and immediate processing, precluding the possibility for at-home sampling. Commercial devices containing stabilizing solvents have been developed to facilitate at-home collection, ambient transport, and sample storage. Here, we explore the efficacy of a commercially available stool collection device with a stabilization reagent tailored to fecal metabolomics. Stool samples from six donors were either processed shortly post-collection or stored at room temperature for seven days in the tube, with and without the stabilization reagent. Comprehensive two-dimensional gas chromatography time-of-flight mass spectrometry (GC×GC-TOFMS)-based untargeted metabolomics was utilized for analyzing extracted metabolites. Chemometric analysis was used to evaluate the performance of the device. We found that the device with the stabilization reagent minimized changes in the metabolite profile relative to unstabilized stool left at room temperature for one week.

1. Introduction

Metabolomics is the study concerned with measuring small molecules in biological samples using advanced analytical techniques [1]. Recently, it has become a popular “omics”, used to study the physiology and metabolism of numerous biological samples, including microbes, plants, and humans [1,2,3]. Metabolomics is utilized in the biomedical sciences to study tissues and biosamples, such as urine, plasma, serum, saliva, cerebrospinal fluid, and breath [3,4,5,6]. Stool has become an increasingly popular biosample in metabolomics, as it allows researchers to probe the complex physiology of the gastrointestinal (GI) tract and the gut microbiome [3,7]. While stool provides rich insights into the GI tract, there are a number of challenges preventing the adoption of stool as a biosample in metabolomic studies, rising from its complex and heterogeneous nature [3]. The metabolome of stool is highly variable both with time in an individual and between individuals, with numerous factors contributing to its variability, including genetics, environmental exposures, sex, ethnicity, diet, stress, and prebiotic/probiotic use [3,5,8,9,10,11]. Because stool is a heterogeneous solid, consisting of multiple components including macromolecules, metabolites, and non-digested roughage, there is considerable within-sample variation, requiring thorough homogenization to reduce variation between replicates [12].
Stool contains live bacteria and enzymes, which change the metabolome of the sample post-collection through processes such as oxidation, hydrolysis, and degradation [3,13]. Post-collection changes to the metabolome can have a substantial impact on the biological interpretation of the metabolomic results. The dynamic nature of stool complicates its collection and storage, requiring careful handling and processing procedures. Snap-freezing at −80 °C immediately post-collection is the method of choice in laboratory settings to preserve the metabolome of stool samples [5,13,14,15,16]. However, immediate snap-freezing post-collection is not possible in places where low-temperature storage is not available, such as in a donor’s house [17].
At-home collection has a number of advantages over sampling in the clinic, including convenience and privacy, but samples collected in this manner require preservation in order to quench the ongoing chemical and biological processes. This necessitates the development of tools to enable the convenient collection and preservation of stool samples collected at home. The development of tools and devices to stabilize collected stool samples at ambient temperatures for an extended period has been the subject of numerous publications; however, these have mainly been developed to stabilize samples for subsequent genomic or transcriptomic analyses [16,18,19,20,21,22]. These kits and devices for genomic and metagenomics are often not compatible with metabolomic analyses, as the DNA- or RNA-stabilizing reagents can cause damage to analytical instrumentation used for metabolomics and require significant sample preparation to make the samples amenable to most metabolomic analyses [3,13]. DNA Genotek (Ottawa, ON, Canada) has developed and commercialized the OMNImet.GUT collection tool with a proprietary stabilization solution optimized for stool metabolome preservation [23]. Ramamoorthy et al. explored the efficacy of this device using LC-MS-based metabolomics, and found that this device provides metabolic profiles of infant stool samples comparable to those that were snap-frozen [13]. Additionally, Isokääntä et al. compared the efficacy of the OMNImet.GUT device to 95% ethanol for stabilizing stool samples, using a combination of targeted and semitargeted metabolomic assays along with microbiome analysis, where they demonstrated that the proprietary stabilization solution had comparable performance to 95% ethanol [24]. Herein, we evaluate this device using GC×GC-MS as an analytical platform.
Here, we are exploring the efficacy of the OMNImet.GUT device to stabilize the metabolome of stool samples from six donors of different sex, ethnicity, diet, and lifestyle at ambient temperature over a seven-day period. Each donor stirred their stool sample for homogenization, and then, the sample was transferred to nine pre-weighted tubes. For each donor, three samples were processed as promptly as possible in the laboratory (within 2 h post-collection), three were left in the tube at room temperature for seven days with the stabilization reagent, and three were left in the tube at room temperature for seven days without stabilization reagent. Comprehensive two-dimensional gas chromatography time-of-flight mass spectrometry (GC×GC-TOFMS)-based untargeted metabolomics was deployed for the analysis of each sample [25,26,27]. This study design allowed us to investigate the performance of the OMNImet.GUT device for stabilizing stool samples prior to GC×GC-TOFMS metabolomics while exploring some potential considerations of using this device in multi-donor metabolomic studies or clinical settings. With chemometric analyses, we found that stool stored for seven days at room temperature in the OMNImet.GUT device with stabilizing solution had a similar metabolite profile to stool, which was processed immediately, with the unstabilized samples having undergone significant chemical changes. While the complete prevention of all chemical activity in stool is largely impossible at room temperature, similarly to other recent work, we demonstrate that the OMNImet.GUT is an effective device for the overall stabilization of stool samples for metabolomics.

2. Materials and Methods

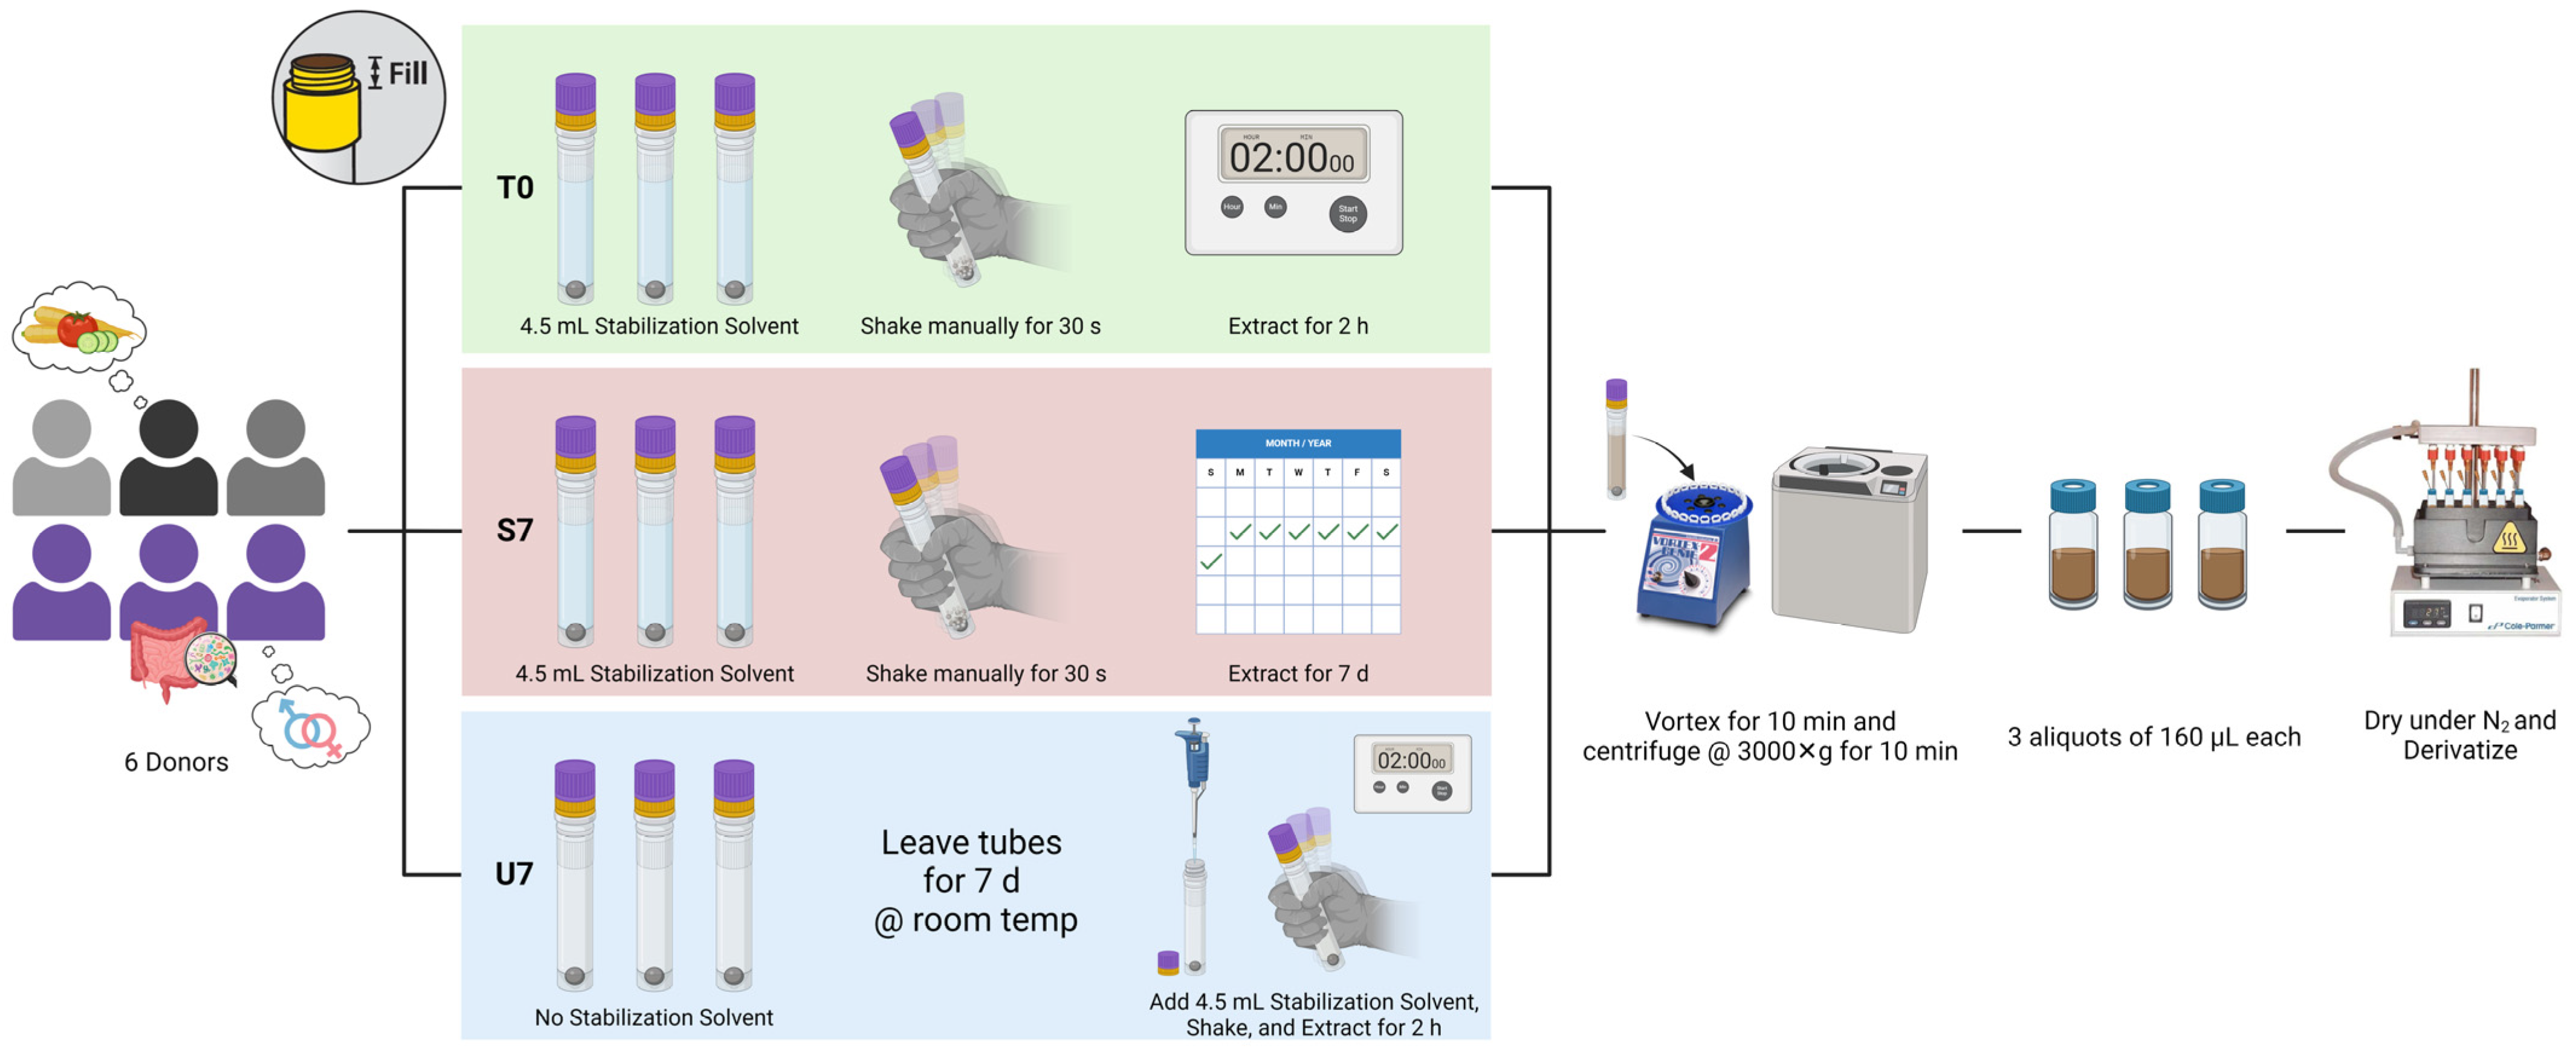
2.1. Sample Collection

To evaluate the efficacy of the OMNImet.GUT®, fecal sample collection tubes (DNA Genotek, Ottawa, ON, Canada) with the proprietary ME-200 stabilization solution (DNA Genotek) optimized for the stabilization of fecal metabolites were obtained and used in the collection of fresh stool samples from six unique healthy donors (1 male, 5 females, mean age = 27 ± 3.0 years) with no known gastrointestinal health conditions. Each donor received nine pre-weighed tubes, each containing a large metal homogenization bead: six tubes contained the ME-200 solution and three contained no solution.
Participants defecated into a clean, unused specimen collection pan (Medline, Mississauga, ON, Canada). Immediately after, participants homogenized the stool by manually stirring with a stainless-steel spoon until the stool had an even consistency. Then, participants collected approximately 0.5 g of homogenized stool into each of the nine tubes, according to the collection instructions from the supplier (Figure S1). Tubes containing stabilization reagent were shaken manually by the donor for 30 s immediately following collection. All stool samples were stored at room temperature and transported back to the laboratory within two hours of collection.

2.2. Sample Extraction and Stability Experiment

Once tubes arrived at the laboratory, they were weighed immediately to determine the mass of stool collected in each tube. The nine tubes from each donor were then separated into three groups (Figure 1): initial day 0 (T0), stabilized day 7 (S7), and unstabilized day 7 (U7). Two sets of three tubes containing 4.5 mL of ME-200 solution were assigned as T0 and S7, respectively, and the three tubes without ME-200 solutions were assigned as U7. From the time that the donor transferred the sample to the tube, T0 samples remained at room temperature for two hours to allow for the extraction of the metabolites. Prior study investigated the time required for the extraction of stool metabolites using this type of device and two hours were determined to be sufficient [28]. Both S7 and U7 samples were left at room temperature for 7 days. A total volume of 4.5 mL of ME-200 extraction solution was added to U7 tubes at the end of 7 days prior to extraction. Additionally, ground dog food kibble (VIBRANT Life chicken and rice recipe with garden vegetables) was used as a quality control (QC) for the metabolomic workflow, as it is a dry, stable, complex biological sample with many biomolecules, but without live bacteria and enzymes. A total of 500 mg of ground kibble was put into a tube containing 4.5 mL of ME-200 solution and left to extract for 2 h.
Prior to taking aliquots for analysis from the tubes, each tube was homogenized with a 10-min bead-beating/vortexing protocol using a VortexGenie2 with a horizontal 15 mL tube holder (Fisher Scientific, Edmonton, AB, Canada). This was followed by centrifugation at 3000 g and 4 °C for 10 min using an Avanti J-26XP centrifuge (Beckman Coulter, Brea, CA, USA). Three replicates of 160 μL each were aliquoted out to 2 mL GC vials and evaporated under nitrogen at 37 °C until dry. For each donor, this resulted in 27 extracts. The T0 samples were extracted, dried, and then placed in the −80 °C freezer until the extraction of the other samples could occur. All extracted dry samples were stored at −80 °C until derivatization.

2.3. Derivatization

To remove any remaining water in the extracts, 100 μL of toluene (ACS grade, Millipore Sigma, Burlington, ON, Canada) dried with anhydrous sodium sulfate (ACS grade, Millipore Sigma) was added to each extract. The samples were briefly vortexed and then dried under nitrogen at 50 °C. Then, 50 μL of 20 mg/mL methoxyamine hydrochloride (98%, Millipore Sigma) in pyridine (HPLC grade, Millipore Sigma) was added to each sample. The samples were briefly vortexed and incubated at 60 °C for 2 h on a heating block. After letting the samples cool for 5 min, 100 μL of MSTFA + 1% TMCS (Fisher Scientific) was added to each sample, briefly vortexed, and then incubated at 60 °C for 1 h. Following a cooling period of 5 min, 70 μL of the derivatized samples and 70 μL of pyridine were added to 300 μL GC insert vials to make a 1:2 dilution. Samples were stored at 4 °C and analyzed within 24 h by GC×GC-TOFMS.

2.4. GC×GC-TOFMS Metabolomics

A total volume of 1 µL of each sample was injected using a MultiPurpose Sampler (MPS; Gerstel, Linthicum Heights, MD, USA) into a CIS-4 inlet (Gerstel) operated in splitless inlet mode at 250 °C. Separation and analysis were performed with a LECO BT 4D GC×GC-TOFMS (LECO, St. Joseph, MI, USA). The first-dimension chromatographic column was a 60 m × 0.25 mm × 0.25 μm Rxi-5SilMS (Chromatographic Specialties, Brockville, ON, Canada), and the second-dimension column was a 1.4 m × 0.25 mm × 0.25 μm Rtx-200MS (Chromatographic Specialties,). Ultra-pure helium gas (Linde Canada Inc., Edmonton, AB, Canada) was used as the carrier gas at a constant flow rate of 2.0 mL/min. The initial oven temperature was held at 80 °C for 4 min before ramping up to a final temperature of 315 °C at a rate of 3.5 ℃/min, where it was held for 10 min. The secondary oven and modulator temperature offset were set at +10 °C relative to the GC oven and +15 °C relative to the secondary oven, respectively. The modulation period was 2.5 s. Data acquisition was conducted at a rate of 200 Hz over a mass range between 40 and 800 m/z. A detector voltage offset at −200 V relative to the optimal tuning voltage and an electron impact energy of −70 eV was set for the detector. The mass spectrometer transfer line and ion source temperatures were set to 250 °C and 200 °C, respectively. The total chromatographic analysis time was 81.1 min for each run. Samples were analyzed per batch of donors to minimize the effects of analytical variations. Within a batch of donors, samples of T0, S7, and U7 were analyzed in random order. QC samples, along with reagent and instrument blanks, were used as quality control and quality assurance of the analysis. MSTFA comes in a 1 mL ampule, which can derivatize 10 samples. Each batch of 10 samples from the same MSTFA ampule consisted of 1 dog food QC, 1 reagent blank, and 8 fecal samples. The QCs and reagent blanks were visually checked to catch any error that occurred during sample preparation or instrumental analysis; however, they were not used in subsequent data processing and analysis.

2.5. Data Processing and Analysis

The acquired chromatograms were exported to a prototype software package (LECO) for the alignment of GC×GC-TOFMS data. S/N 1000 was used to align the sample sets by donor (27 samples per donor) and by storage condition (54 samples per condition). The resulting aligned peak tables were normalized to both sample mass and total useful peak area (TUPA) for each donor [29]. Aligned peak tables were then imported to MATLAB® R2022a (The MathWorks Inc., Natick, MA, USA) for statistical analysis and PLS_Toolbox 9.0 (Eigenvector Research, Manson, WA, USA) was used to generate principal component analysis (PCA) models on autoscaled peak tables.
The fold change in metabolite abundance for each condition was calculated using the useful peaks (compounds present in all samples across the dataset) for each donor, which was normalized by the average of the T0 for each donor [26]. The absolute value of the relative change (ARC) between T0, U7, and S7 was used to quantify the total variation in analytes (increase or decrease). ARC was calculated for each donor using Equation (1), where n is the total number of useful peaks under consideration in the dataset.
i = 1 n P e a k   A r e a i T 0 ¯ 1

3. Results and Discussion

3.1. GC×GC-TOFMS Results

To evaluate the performance of the OMNImet.GUT® tube for stabilizing stool samples for metabolomic analysis, the S7-stabilized and U7-unstabilized stool samples were compared with the T0 samples, which served as references for each donor since the samples were processed within two hours of collection. Figure 2 shows representative GC×GC contour plots for T0, S7, and U7 samples of one donor, while representative chromatograms for the rest of the donors are presented in Figures S2–S7. Distinct metabolomic profiles are observed for different donors as expected, with the number of detected peaks (variables) ranging from 2311 to 7417. On the other hand, minimal changes are visually apparent between T0 and S7 samples, with a noticeable change in the appearance of the chromatograms for U7, within each set of donor chromatograms.

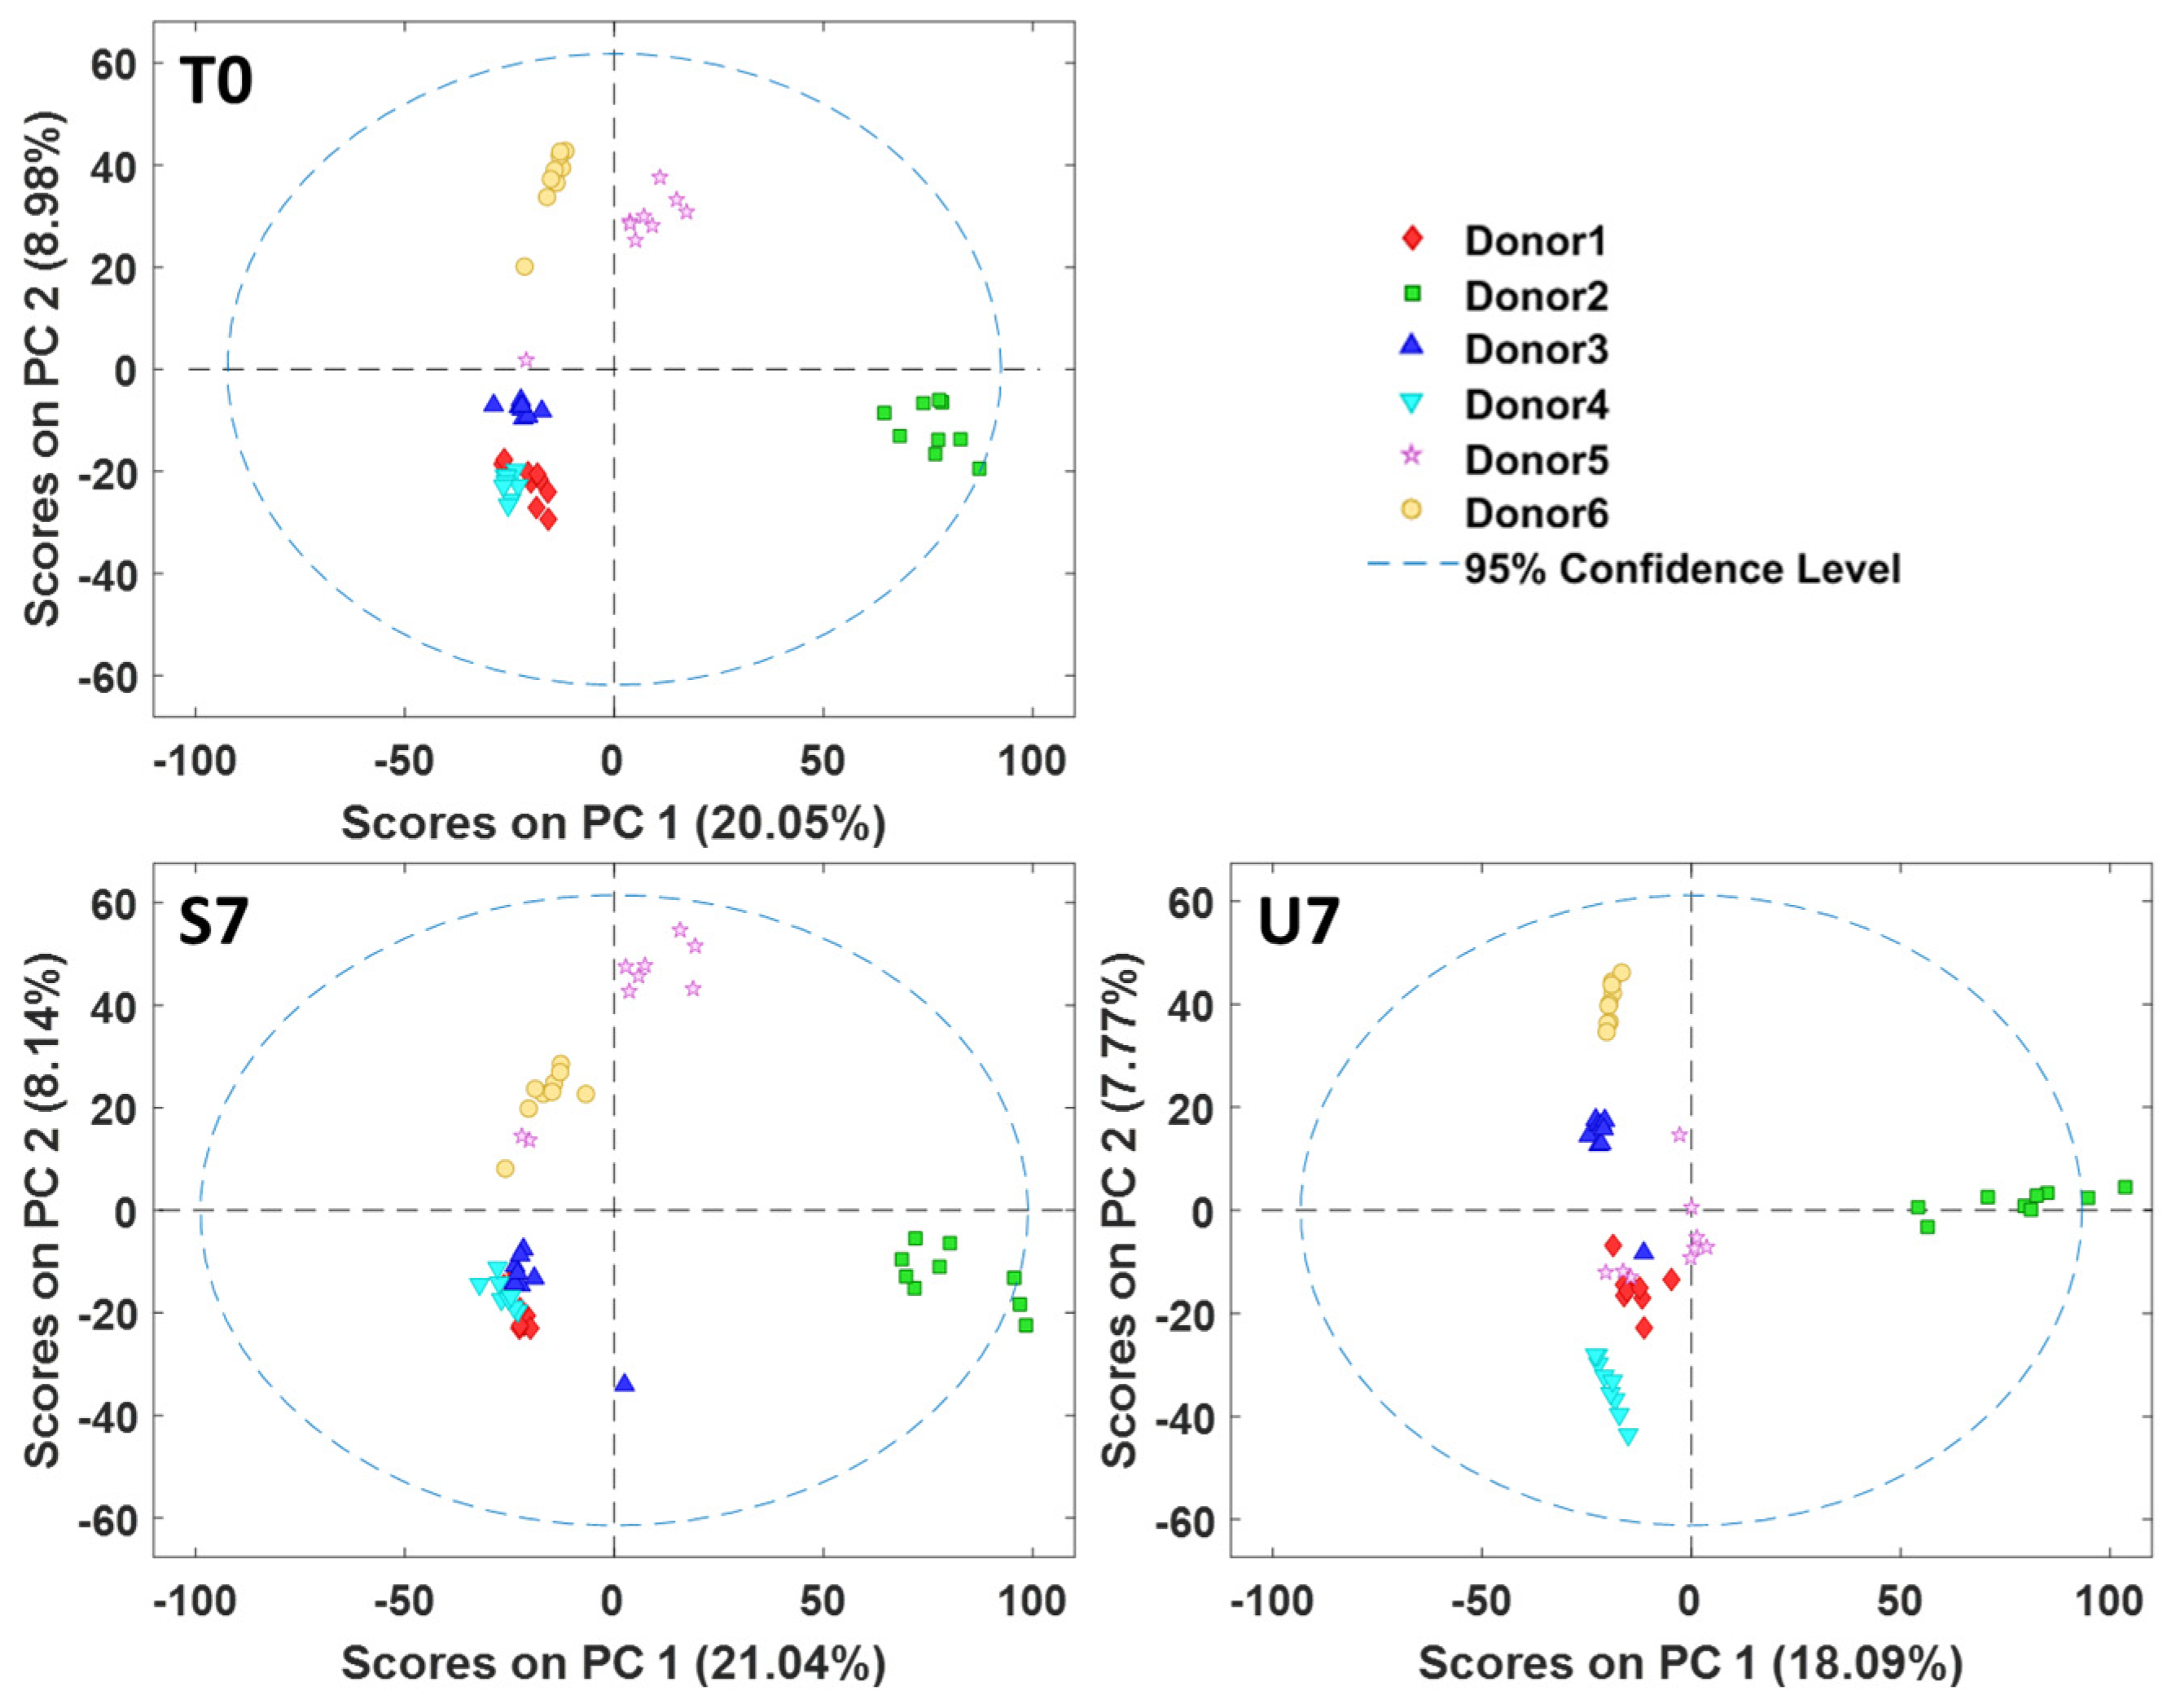
3.2. Principal Component Analysis

All PCA score plots of samples from the six donors, normalized with TUPA (Figure 3), show T0 and S7 projecting relatively close together, with U7 projecting further away. In all cases, PC1 largely describes variance from the stabilization status of the sample (Figure S8). This suggests that the U7-unstabilized samples are dissimilar from T0 and S7 samples for all cases, as metabolites in U7 undergo chemical changes from active enzymes in the stool, auto-oxidation reactions, and changes mediated by living bacteria in the stool sample, whereas the stabilization reagent largely quenches these processes.
Figure 4 shows PCA score plots of 54 samples from all 6 donors by the storage condition to explore sample distribution of different donors. All three datasets show overall clustering by donor. The T0 and S7 demonstrate similar patterns of donor similarities and differences (e.g., Donors 1 and 4 are tightly clustered). However, the donor differences illustrated in the PCA score plot of U7 are relatively different from T0 and S7, indicating that the sample integrity was lost during the seven days of unstabilized storage.

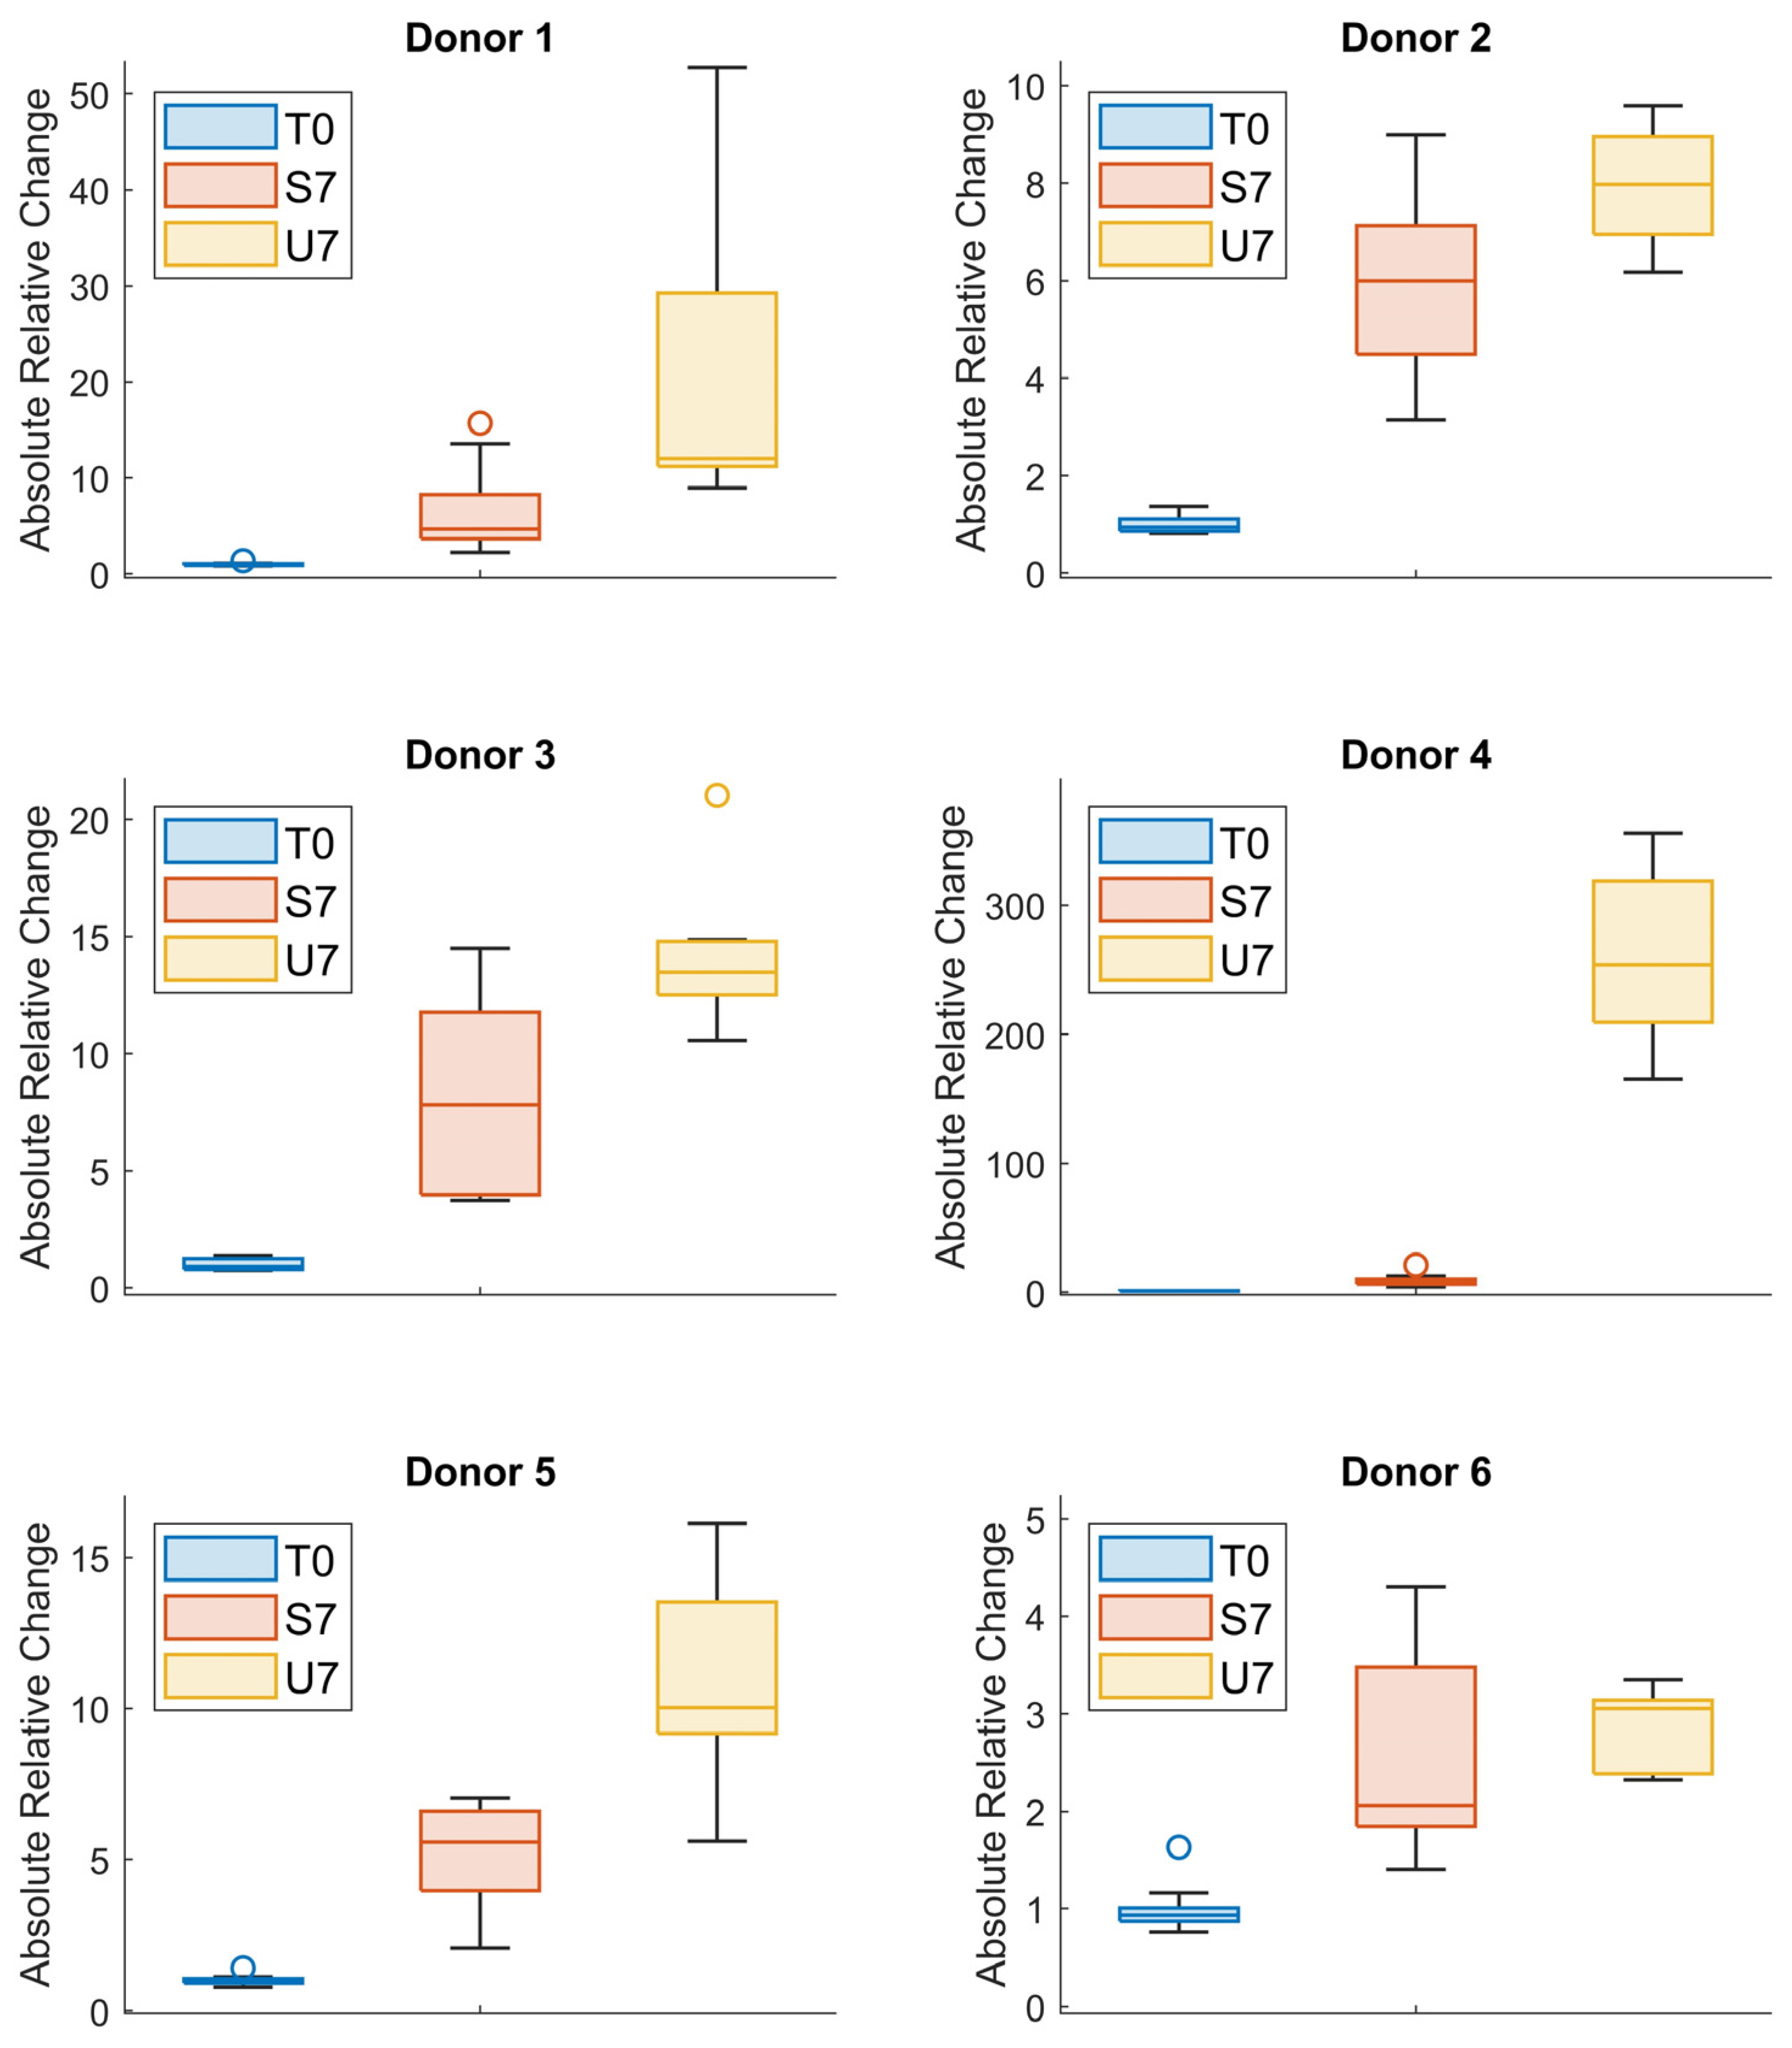
3.3. Absolute Value of the Relative Change

To evaluate the changes in metabolites between the three groups in a holistic, quantitative manner, the ARC in TUPA between the three groups was computed relative to T0. ARC is a true representation of the changes in the sample regardless of whether an increase or decrease in metabolite abundance occurs, as it is agnostic to the direction of the change. We hypothesized that U7 samples would have a larger ARC than T0 and S7 samples due to the ongoing biological and chemical processes in the unstabilized samples, which would alter the diversity and relative abundances of small-molecule metabolites. For all donors, U7 had higher ARC values than S7 (Figure 5). This is consistent with our PCA results described in Section 3.2, where U7 samples projected away from T0 and S7 samples (Figure 3). U7 samples from Donor 4 had the largest ARC (Figure 5), which is consistent with its PCA model where PC1 explains 19.75% of total variance, the most variance along PC1 of all models. When stool samples of different microbial compositions remain at room temperature without stabilization, the degree of sample change varies greatly from one sample to another, likely depending on the bacterial communities, active enzymes, and chemical substrate initially present in each sample. It is noteworthy that the ARC of S7 stayed under 10 for all donors (Figure 5), which signifies that the collection device is capable of stabilizing stool metabolites to some extent regardless of the richness of microbiome of the donor. Further direct statistical comparisons were not made in this study as they would be of little value. For example, reporting which combinations of S7 vs. U7 samples are or are not statistically significantly different is not practically meaningful and could lead to misinterpretation by readers reading too much into the data. In all cases other than Donor 6, the ARC values for S7 and U7 are “significantly” different; however, significant differences between these two samples at the compound level are apparent in the chromatographic data (Figure S7).
Based on the PCA and ARC results considering all three groups, U7 is substantially different from T0 in all cases, and the ARC for S7 samples is generally much lower than for U7, except for Donor 6. The reason why Donor 6 samples had an inherently higher stability than other samples is unknown, and not something that would generally be known a priori when performing a metabolomic study. The ARC results show a difference between T0 and S7; however, this is expected as quenching all chemical activity in the samples over 7 days at room temperature without lyophilization is a significant challenge in a complex biosample such as stool. Previous work on this topic by De Spiegeleer et al. [30] showed that freeze-dried stool samples without additives are only stable for eight weeks at −80 °C prior to metabolomic analysis. Therefore, it is reasonable to hypothesize that non-freeze-dried stool samples would be considerably less stable even at −80 °C. Interestingly, the ARC change for Donor 4 between T0 and S7 was not the largest among all donors, while this donor’s U7 samples had a substantially greater ARC than U7 samples from other donors (Figure 5). However, ARC is unitless and provides no information on individual compounds; therefore, researchers or clinicians would need to validate the device and storage conditions based on their hypothesis and specific metabolites of interest. We hypothesize that this large increase in ARC for U7 is primarily due to metabolites in this donor’s stool undergoing more modifications by active enzymes and bacteria than the other donors’ samples, as the proprietary ME-200 stabilization reagent aims to denature enzymes and lyse cells to inhibit biological activity.

3.4. Considerations for Use in Research and Clinical Applications

While a device allowing for at-home stool collection by study participants and clinical patients allows stool to be used in research and clinical applications, there are a number of considerations that are required to ensure proper quality control. Knowing the weight of the sample provided would allow for normalization to sample mass; however, this would require the device manufacturer, research team, or clinical laboratory to pre-weigh the tubes and weigh again after samples are returned to the laboratory. This is not only very time-consuming, as we found with this study, but also problematic in itself as not all users are familiar or experienced in analytical sample collection and quantitative transfer; therefore, it is expected that some users may potentially spill some of the stabilization reagent during sampling.
In our relatively small set of donors, we had one tube which had a decrease in mass after sampling (Table S1). In this particular case, this donor reported spilling some of the stabilization reagent during the sampling process. Additionally, we found that even with a proper sampling technique, there is considerable variation in the weight of stool collected, with stool masses in this study ranging from 108.3 mg to 740.3 mg (Table S1). Even with a perfect sampling technique, this is expected as the consistency of stool and its water content is highly variable.
The addition of an internal standard or multiple standards into the stabilization reagent would allow the analyst to correct for variations in sample mass during collection. The internal standards should be stable for long-term storage and appropriate for the analytical platform used to analyze the samples. However, this would need to be added quantitatively after, or simultaneously to, the addition of the stool sample to account for potential spillage by users. Additionally, analysts can opt to use various normalization strategies which do not require sample mass, such as TUPA, which was explored here, or total derivatized peak area (TDPA) if the objective is to examine one or a subset of samples from the entire study [26,29].
We compared PCA score plots generated on data from each donor without normalization, with normalization to mass, and with normalization to TUPA (Supplemental Materials). Without any normalization, there is considerably more variance between scores and the data are less structured (Figure S9) than the score plots of normalized data. We found that the score plots of data normalized to sample mass (Figure S10) and TUPA (Figure 3) had comparable structure and largely describe the same information, suggesting that TUPA is an appropriate normalization approach in the absence of reliable sample weights [26].

4. Conclusions

Here, we evaluated the performance of a device for at-home stool collection and the subsequent stabilization of the fecal metabolomic profile over a seven-day period at room temperature. To explore the applicability of this device in large studies or clinical settings, we enrolled six participants of different sex, ethnicity, diet, and lifestyle. PCA and ARC analyses enabled us to explore how the metabolome of stool stabilized in the stabilization reagent varied from stool samples processed upon arrival at the laboratory and samples which underwent no stabilization over the seven-day period. Overall, we found that the device is effective at minimizing alterations to the stool metabolome compared to unstabilized samples, even though there are still changes that occur over the seven-day period. Additionally, we explored important considerations and potential issues we discovered in this multi-donor study, including how to normalize metabolomic data in the absence of sample weight.

Supplementary Materials

The following supporting information can be downloaded at: https://www.mdpi.com/article/10.3390/applbiosci3030023/s1. Table S1: Information on sample weight; Figure S1: OMNImet.GUT® Fecal Sample Collection Tubes Instructions for Donors from DNA Genotek. Figure S2: GC×GC contour plots of stool samples from donor 1 at T0, S7, and U7. Figure S3: GC×GC contour plots of stool samples from donor 2 at T0, S7, and U7. Figure S4: GC×GC contour plots of stool samples from donor 3 at T0, S7, and U7. Figure S5: GC×GC contour plots of stool samples from donor 4 at T0, S7, and U7. Figure S6: GC×GC contour plots of stool samples from donor 5 at T0, S7, and U7. Figure S7:. GC×GC contour plots of stool samples from donor 6 at T0, S7, and U7. Figure S8: Plots of PC1 for 27 samples normalized by TUPA for (A) donor 1: 2602 variables, (B) donor 2: 7417 variables, (C) donor 3: 2580 variables, (D) donor 4: 2311 variables, (E) donor 5: 3808 variables, (F) donor 6: 2439 variables. Figure S9: PCA score plots without normalization of 27 samples for (A) donor 1: 2602 variables,(B) donor 2: 7417 variables, (C) donor 3: 2580 variables, (D) donor 4: 2311 variables, (E) donor 5: 3808 variables, (F) donor 6: 2439 variables. Figure S10: PCA score plots (PC1 vs PC2) of 27 samples normalized by sample mass for (A) donor 1: 2602 variables, (B) donor 2: 7417 variables, (C) donor 3: 2580 variables, (D) donor 4: 2311 variables, (E) donor 5: 3808 variables, (F) donor 6: 2439 variables. 3 samples were removed for donor 1 due to the erroneous sample weight. 6 samples were removed for donor 5 due to the instrumental error on the day of analysis.

Author Contributions

Conceptualization, S.L.N., A.P.d.l.M. and J.J.H.; Data curation, R.T.G., S.L.N. and A.P.d.l.M.; Formal analysis, R.T.G., S.L.N. and A.P.d.l.M.; Funding acquisition, J.J.H.; Investigation, G.N., S.A.S., S.W., E.Y.M. and A.P.d.l.M.; Methodology, S.L.N. and A.P.d.l.M.; Project administration, A.P.d.l.M. and J.J.H.; Supervision, A.P.d.l.M. and J.J.H.; Visualization, R.T.G., G.N., S.W., S.L.N. and A.P.d.l.M.; Writing—original draft, R.T.G., G.N., S.A.S., S.L.N. and A.P.d.l.M.; Writing—review and editing, R.T.G., G.N., S.A.S., S.W., E.Y.M., S.L.N., A.P.d.l.M. and J.J.H. All authors have read and agreed to the published version of the manuscript.

Funding

The authors would like to thank MITACS, DNA Genotek, Inc. and The Natural Sciences and Engineering Research Council of Canada (NSERC) for support. The support of The Canada Foundation for Innovation (CFI), Genome Canada, and Genome Alberta to The Metabolomics Innovation Center (TMIC) is also acknowledged. RTG acknowledges funding support from NSERC and the Canadian Institutes of Health Research (CIHR) in the form of scholarships.

Institutional Review Board Statement

This study was approved by the University of Alberta Research Ethics Board, under approval number Pro00071285. All participants were informed about the study and usage of their samples, and consent was obtained from each prior to collection.

Informed Consent Statement

Informed consent was obtained from all subjects involved in the study.

Data Availability Statement

Normalized peak tables and raw GC×GC-TOFMS data are available at https://doi.org/10.5683/SP3/SDBO62 (accessed on 1 August 2024). All data have been anonymized to protect the donors’ identities.

Acknowledgments

The authors would like to thank Gareth Lambkin, manager of the biological services laboratory in the Chemistry Department at the University of Alberta, for providing the use of lab space, lyophilizer, and centrifuge required for the preparation of these samples. Figure 1 was created with BioRender.com.

Conflicts of Interest

The authors declare that this study received support from DNA Genotek, who provided the OMNImet.GUT tubes free of charge. DNA Genotek was not involved in the study design, collection, analysis, interpretation of data, the writing of this article or the decision to submit it for publication.

References

  1. Fiehn, O. Metabolomics—The link between genotypes and phenotypes. Plant Mol. Biol. 2002, 48, 155–171. [Google Scholar] [CrossRef]
  2. Giebelhaus, R.T.; Biggs, L.; Murch, S.J.; Erland, L.A.E. Untargeted and targeted metabolomics to understand plant growth regulation and evolution in Wollemi pine (Wollemia nobilis). Botany 2023, 101, 377–390. [Google Scholar] [CrossRef]
  3. Karu, N.; Deng, L.; Slae, M.; Guo, A.C.; Sajed, T.; Huynh, H.; Wine, E.; Wishart, D.S. A review on human fecal metabolomics: Methods, applications and the human fecal metabolome database. Anal. Chim. Acta 2018, 1030, 1–24. [Google Scholar] [CrossRef]
  4. Khoubnasabjafari, M.; Mogaddam, M.R.A.; Rahimpour, E.; Soleymani, J.; Saei, A.A.; Jouyban, A. Breathomics: Review of Sample Collection and Analysis, Data Modeling and Clinical Applications. Crit. Rev. Anal. Chem. 2022, 52, 1461–1487. [Google Scholar] [CrossRef]
  5. Stevens, V.L.; Hoover, E.; Wang, Y.; Zanetti, K.A. Pre-Analytical Factors that Affect Metabolite Stability in Human Urine, Plasma, and Serum: A Review. Metabolites 2019, 9, 156. [Google Scholar] [CrossRef]
  6. Mochel, J.P.; Ward, J.L.; Blondel, T.; Kundu, D.; Merodio, M.M.; Zemirline, C.; Guillot, E.; Giebelhaus, R.T.; de la Mata, P.; Iennarella-Servantez, C.A.; et al. A Preclinical Model of Obesity-Independent Metabolic Syndrome for Studying the Effects of Novel Antidiabetic Therapy Beyond Glycemic Control. Research Square 2023. [Google Scholar] [CrossRef]
  7. Erben, V.; Poschet, G.; Schrotz-King, P.; Brenner, H. Evaluation of different stool extraction methods for metabolomics measurements in human faecal samples. BMJ Nutr. Prev. Health 2021, 4, 374–384. [Google Scholar] [CrossRef]
  8. Gratton, J.; Phetcharaburanin, J.; Mullish, B.H.; Williams, H.R.T.; Thursz, M.; Nicholson, J.K.; Holmes, E.; Marchesi, J.R.; Li, J.V. Optimized Sample Handling Strategy for Metabolic Profiling of Human Feces. Anal. Chem. 2016, 88, 4661–4668. [Google Scholar] [CrossRef]
  9. Zierer, J.; Jackson, M.A.; Kastenmüller, G.; Mangino, M.; Long, T.; Telenti, A.; Mohney, R.P.; Small, K.S.; Bell, J.T.; Steves, C.J.; et al. The fecal metabolome as a functional readout of the gut microbiome. Nat. Genet. 2018, 50, 790–795. [Google Scholar] [CrossRef]
  10. Tang, Z.-Z.; Chen, G.; Hong, Q.; Huang, S.; Smith, H.M.; Shah, R.D.; Scholz, M.; Ferguson, J.F. Multi-Omic Analysis of the Microbiome and Metabolome in Healthy Subjects Reveals Microbiome-Dependent Relationships Between Diet and Metabolites. Front. Genet. 2019, 10, 454. [Google Scholar] [CrossRef]
  11. Yang, Y.; Yin, Y.; Chen, X.; Chen, C.; Xia, Y.; Qi, H.; Baker, P.N.; Zhang, H.; Han, T.-L. Evaluating different extraction solvents for GC-MS based metabolomic analysis of the fecal metabolome of adult and baby giant pandas. Sci. Rep. 2019, 9, 12017. [Google Scholar] [CrossRef]
  12. Carrillo, K.T.; Nam, S.L.; Mata, A.P.D.L.; De Bruin, O.M.; Doukhanine, E.; Harynuk, J. Optimization of fecal sample homogenization for untargeted metabolomics. Metabolomics 2023, 19, 74. [Google Scholar] [CrossRef]
  13. Ramamoorthy, S.; Levy, S.; Mohamed, M.; Abdelghani, A.; Evans, A.M.; Miller, L.A.D.; Mehta, L.; Moore, S.; Freinkman, E.; Hourigan, S.K. An ambient-temperature storage and stabilization device performs comparably to flash-frozen collection for stool metabolomics in infants. BMC Microbiol. 2021, 21, 59. [Google Scholar] [CrossRef]
  14. Dudzik, D.; Barbas-Bernardos, C.; García, A.; Barbas, C. Quality assurance procedures for mass spectrometry untargeted metabolomics. a review. J. Pharm. Biomed. Anal. 2018, 147, 149–173. [Google Scholar] [CrossRef]
  15. Flores, R.; Shi, J.; Yu, G.; Ma, B.; Ravel, J.; Goedert, J.J.; Sinha, R. Collection media and delayed freezing effects on microbial composition of human stool. Microbiome 2015, 3, 33. [Google Scholar] [CrossRef]
  16. Choo, J.M.; Leong, L.E.; Rogers, G.B. Sample storage conditions significantly influence faecal microbiome profiles. Sci. Rep. 2015, 5, 16350. [Google Scholar] [CrossRef]
  17. Loftfield, E.; Vogtmann, E.; Sampson, J.N.; Moore, S.C.; Nelson, H.; Knight, R.; Chia, N.; Sinha, R. Comparison of Collection Methods for Fecal Samples for Discovery Metabolomics in Epidemiologic Studies. Cancer Epidemiol. Biomark. Prev. 2016, 25, 1483–1490. [Google Scholar] [CrossRef]
  18. Lauber, C.L.; Zhou, N.; Gordon, J.I.; Knight, R.; Fierer, N. Effect of storage conditions on the assessment of bacterial community structure in soil and human-associated samples: Influence of short-term storage conditions on microbiota. FEMS Microbiol. Lett. 2010, 307, 80–86. [Google Scholar] [CrossRef]
  19. Song, S.J.; Amir, A.; Metcalf, J.L.; Amato, K.R.; Xu, Z.Z.; Humphrey, G.; Knight, R. Preservation Methods Differ in Fecal Microbiome Stability, Affecting Suitability for Field Studies. mSystems 2016, 1, e00021-16. [Google Scholar] [CrossRef]
  20. Carroll, I.M.; Ringel-Kulka, T.; Siddle, J.P.; Klaenhammer, T.R.; Ringel, Y. Characterization of the Fecal Microbiota Using High-Throughput Sequencing Reveals a Stable Microbial Community during Storage. PLoS ONE 2012, 7, e46953. [Google Scholar] [CrossRef]
  21. Guo, Y.; Li, S.-H.; Kuang, Y.-S.; He, J.-R.; Lu, J.-H.; Luo, B.-J.; Jiang, F.-J.; Liu, Y.-Z.; Papasian, C.J.; Xia, H.-M.; et al. Effect of short-term room temperature storage on the microbial community in infant fecal samples. Sci. Rep. 2016, 6, 26648. [Google Scholar] [CrossRef]
  22. Tap, J.; Cools-Portier, S.; Pavan, S.; Druesne, A.; Öhman, L.; Törnblom, H.; Simren, M.; Derrien, M. Effects of the long-term storage of human fecal microbiota samples collected in RNAlater. Sci. Rep. 2019, 9, 601. [Google Scholar] [CrossRef]
  23. Jackson, A.; Acero, M.M.; Doukhanine, E.V.; Iwasiow, R.M.; Hernandez, C.A.M. Device for Collecting, Transporting and Storing Biomolecules from a Biological Sample. U.S. Patent Application No. 15/310,698, 16 March 2017. [Google Scholar]
  24. Isokääntä, H.; Pinto da Silva, L.; Karu, N.; Kallonen, T.; Aatsinki, A.-K.; Hankemeier, T.; Schimmel, L.; Diaz, E.; Hyötyläinen, T.; Dorrestein, P.C.; et al. Comparative Metabolomics and Microbiome Analysis of Ethanol versus OMNImet/geneGUT Fecal Stabilization. Anal. Chem. 2024, 96, 8893–8904. [Google Scholar] [CrossRef]
  25. Higgins Keppler, E.A.; Jenkins, C.L.; Davis, T.J.; Bean, H.D. Advances in the application of comprehensive two-dimensional gas chromatography in metabolomics. TrAC Trends Anal. Chem. 2018, 109, 275–286. [Google Scholar] [CrossRef]
  26. Nam, S.L.; De La Mata, A.P.; Dias, R.P.; Harynuk, J.J. Towards Standardization of Data Normalization Strategies to Improve Urinary Metabolomics Studies by, GC×GC-TOFMS. Metabolites 2020, 10, 376. [Google Scholar] [CrossRef]
  27. Giebelhaus, R.T.; de la Mata, A.P.; Harynuk, J.J. Region of interest selection for GC×GC–MS data using a pseudo fisher ratio moving window with connected components segmentation. J. Chromatogr. Open 2023, 4, 100104. [Google Scholar] [CrossRef]
  28. Nam, S.L.; Tarazona Carrillo, K.S.; de la Mata, A.P.; Giebelhaus, R.T.; de Bruin, O.M.; Doukhanine, E.; Harynuk, J.J. Evaluation of solution chemistries for stabilizing feces in metabolomics studies using GC×GC-TOFMS. Metabolomics 2024. under review. [Google Scholar]
  29. Nam, S.L.; Giebelhaus, R.T.; Tarazona Carrillo, K.S.; de la Mata, A.P.; Harynuk, J.J. Evaluation of normalization strategies for GC-based metabolomics. Metabolomics 2024, 20, 22. [Google Scholar] [CrossRef]
  30. De Spiegeleer, M.; De Graeve, M.; Huysman, S.; Vanderbeke, A.; Van Meulebroek, L.; Vanhaecke, L. Impact of storage conditions on the human stool metabolome and lipidome: Preserving the most accurate fingerprint. Anal. Chim. Acta 2020, 1108, 79–88. [Google Scholar] [CrossRef]
Figure 1. Experimental design and metabolite extraction workflow for this study. Figure created with BioRender.com.
Applbiosci 03 00023 g001
Figure 2. GC×GC contour plots (total ion chromatogram) of a representative stool sample from Donor 4 at T0, S7, and U7. First dimension retention times (s) are given on the horizontal axes and second dimension retention times (s) are given along the vertical axes.
Applbiosci 03 00023 g002
Figure 3. PCA score plots (PC1 vs. PC2) of 27 samples normalized by total useful peak area (TUPA) for (A) Donor 1: 2602 variables; (B) Donor 2: 7417 variables; (C) Donor 3: 2580 variables; (D) Donor 4: 2311 variables; (E) Donor 5: 3808 variables; and (F) Donor 6: 2439 variables. Six samples were removed for Donor 5 due to an instrumental error on the day of analysis.
Applbiosci 03 00023 g003
Figure 4. PCA score plots (PC1 vs. PC2) of 6 donors (54 samples) aligned together per condition, normalized by total useful peak area (TUPA) top left: T0, 6583 variables, bottom left: S7, 7180 variables, bottom right: U7, 7441 variables.
Applbiosci 03 00023 g004
Figure 5. Box plots of the overall absolute relative change between T0, S7, and U7 for all six donors. Outliers due to instrumental errors were removed for Donor 5.
Applbiosci 03 00023 g005
Disclaimer/Publisher’s Note: The statements, opinions and data contained in all publications are solely those of the individual author(s) and contributor(s) and not of MDPI and/or the editor(s). MDPI and/or the editor(s) disclaim responsibility for any injury to people or property resulting from any ideas, methods, instructions or products referred to in the content.

