1. Introduction
Foodborne diseases (FBD) affect the entire world population, with a statistic of one patient for every ten people. One of the reasons for contamination is the Shiga toxin-producing
Escherichia coli (STEC) bacteria [
1]. In the United States, 3% of food-related deaths are attributed to STEC serotype O157:H7 [
2].
The virulence of STEC is partially caused by the endotoxins in their cellular wall, such as surface O, H, and K antigens [
3]. However, the main virulence factors of these microorganisms are the exotoxins that can be released into the host intestinal cells after adhering to them. These toxins, called Shiga 1 and 2 (Stx1 and Stx2), induce a cascade of thrombogenic and inflammatory changes in the microvascular endothelial cells that lead to HUS and thrombotic microangiopathy in the kidney and, potentially, in other organs [
1,
2,
3,
4].
Usually, the main source of transmission of STEC in humans is the consumption of meat, milk, and milk derivatives like yogurt and cheese produced from infected cattle [
5]. These are considered the main reservoirs of these pathogenic organisms. The World Health Organization compiled STEC outbreak surveillance data between 1998 and 2017 from 27 countries in three geographical regions (the Americas, Europe, and the Western Pacific). The data show that the most common sources of STEC were beef (16%), fruits and vegetables (15%), and dairy products (6%). However, the origin of 57% of STEC outbreaks could not be established [
6].
Contamination also includes food produced from other farm animals carrying STEC, like goats, sheep, chickens, and swine. Vegetables and fruits can spread STEC if they are harvested in soils treated with organic fertilizers prepared from the feces of infected animals, as is the case for drinking water that, for some reason, has been in contact with carrier feces [
7]. According to Vélez et al. [
1], there are reports of contagion by direct contact with infected animals, between people, and through the fecal–oral route.
A way to prevent STEC O157:H7 infection, and even infection by other STEC of the same serogroup or other non-O157, is its early detection in food and drinking water, using rapid and specific analytical methods capable of discriminating the microorganism of interest from others that may be present. The methods used include cultures, immunological methods, and procedures based on molecular tools, which have become very popular in recent years [
8].
The classic methods used for the detection, isolation, and characterization of pathogens in food are cultures, considered the gold standard because they are sensitive, cheap, and provide qualitative and quantitative information on the microorganisms present in a food sample. However, these methods require several days to obtain results and are also very laborious [
8].
Immunological tests are based on antigen–antibody interactions, for which numerous commercial kits have been developed, such as O and H antigens (somatic and flagellar serotyping, respectively), Stx1 and Stx2 toxins, and their respective antibodies [
9]. These methods can be enzymatic, optical, magnetic, or immunochromatographic. All of them require prior enrichment in culture broths for several hours, and it is also necessary to confirm negative results when there is clinical suspicion of HUS [
10].
Molecular techniques such as the polymerase chain reaction (PCR) are very sensitive and specific. They allow the detection and quantification of STEC O157:H7 and non-O157 STEC through their virulence genes present in food, water, soil, animals, and humans, even at low concentrations, due to their ability to amplify the DNA of a single bacterial cell in about one hour [
9]. However, presumptive results must be confirmed through traditional culture methods or by immunomagnetic separation [
11].
Diagnosis is based on the detection and differentiation of Shiga toxin-encoding genes (
stx1 and/or
stx2) and their subtypes, intimin (
eae), intimin receptor (
tir), hemolysin (
hlyA or ehxA), genes of type III secreted proteins (
EspA and EspB), genes of STEC autoagglutinating adhesin protein (
Saa), flagellin (H antigen), and O antigen [
10,
11,
12].
Conventional PCR is the easiest and most economical technique but the least sensitive in this modality. Nevertheless, it is very useful because it provides a low-priced and relatively fast qualitative diagnosis. By intra-laboratory procedures, Yepes-Pérez et al. [
13] developed and validated three PCR protocols to detect
E. coli O157:H7 through its
stx1,
stx2, and
rfbE genes [
13]. They were able to scale their results up to the semi-quantitative level with very good sensitivity.
The qPCR test is the most sensitive and fastest of the PCRs, with results available within 12 to 24 h [
10]. Fluorogenic probes such as TaqMan or dyes such as SYBR Green are used to reveal the amplification. The former is expensive and more specific than the latter; however, the reliability, reproducibility, and sensitivity levels of SYBR Green qPCR can be considered very good, with a minimum of contaminations and false positives.
Considering the previously mentioned advantages of qPCR over endpoint PCR, the objective of this research was to validate four SYBR Green qPCR protocols for the detection of E. coli serotype O157:H7 through its rfbE, stx1, and stx2 genes and evaluate their effectiveness for the accurate identification of the bacteria in artificially contaminated ground beef samples.
2. Materials and Methods
Working range, selectivity, and robustness were determined in each of the qPCR techniques according to the ISO 16140-2:2016 [
14]. or NTC 5014 standards [
15]. Within the working range, the detection and cut-off limits and the range of initial detectable DNA concentration for each gene were determined with an adequate level of confidence and precision.
Selectivity was based on the discriminatory capacity of the technique when using DNA from different E. coli strains carrying the genes evaluated—expressed as inclusivity—as well as when using those not carrying the genes of interest—expressed as exclusivity. To analyze the robustness of each protocol, three DNA concentrations were considered for each assay, evaluating, as variables, the development of the procedures on different days, performed by different operators, and using two qPCR kits. The real application of the validated protocols was performed on samples of ground beef artificially contaminated with E. coli O157:H7.
Equipment. Rotor-Gene Q (QUIAGEN, Hilden, Germany); S-1000 Thermal Cycler (BIORAD, Hercules, CA, USA); Multigene Optimax Thermal Cycler (LABNET International Inc, Edison, NJ, USA); Gel DOC XR Imagen System (BIORAD, Hercules, CA, USA); Nanodrop 2000 spectrophotometer (Thermo Scientific, Waltham, MA, USA); and Electrophoresis Chamber (BIORAD, Hercules, CA, USA).
Bacterial strains. The genetic material used in this research came from the following ATCC-certified strains: E. coli O157:H7 ATCC 43895, carrying the virulence genes stx1, stx2, and rfbE, and generic E. coli ATCC 25922, as a positive control of the Enterobacteriaceae family that, additionally, does not express the virulence genes analyzed.
The
E. coli O157 and non-O157 DNA used to evaluate the inclusivity parameter of the qPCRs were donated by the Instituto de Genética Veterinaria “Ingeniero Fernando Noel Dulout” (IGEVET) of La Plata, Argentina (
Table 1).
Regarding the exclusivity parameter, the bacterial DNA was donated by the LACMA laboratory of the Institución Universitaria Colegio Mayor de Antioquia and included the following: Bacillus cereus (ATCC 10876); Klebsiella pneumoniae (ATCC 700603); Salmonella enterica subsp. enterica serov Typhimurium (ATCC 13311); Staphylococcus aureus (ATCC 25923); Pseudomona aeruginosa (ATCC 27853); Escherichia coli (ATCC 25122); Pediococcus acidilactici (JQ712018); Enterococcus faecalis (JQ712024); and Enterococcus faecium (JQ712021). The JQ code is an internal record from the Colegio Mayor de Antioquia. None of these microorganisms contain the virulence factors rfbE, stx1, or stx2.
Bacterial DNA extraction. Bacterial DNA extraction was carried out according to the procedure described by Yepes-Pérez et al. [
13].
Primer design. The specific sequences of the
stx1 and
stx2 gene primers and two different sequences of the
rfbE gene, named rfbE and O157, were reviewed in the gene sequence database GenBank of the National Center for Biotechnology Information (NCBI). Primer selection was carried out based on the alignment specificity of the oligonucleotides with the genome region of interest through the Primer-BLAST program (
Table 2). Enterobacteria universal
16S rRNA gene was used as an internal control or as positive control of amplification [
13].
Amplification reactions. The QuantiTect SYBR Green PCR Kit (QuantiTect, Hilden, Germany) and the Platinum SYBR Green qPCR SuperMix-DG (Invitrogen, Carlsbad, CA, USA) kit were used following the protocols suggested by the manufacturers. There were hardly any variations between protocols. All reactions were performed in triplicate, and the total volume of each reaction was 25 μL.
The assay’s positive control was the amplification of the 16S gene, i.e., for E. coli O157:H7 and commensal E. coli. The negative control was prepared by substituting DNA for MilliQ water in each reaction.
Thermal profile of the amplification. The thermal conditions were as follows: (1) pre-denaturation (polymerase activation), 95 °C/15 min; (2) denaturation, 95 °C/15 s; (3) annealing, according to the annealing temperature (Ta) of each gene/30 s; (4) extension 72 °C/30 s; and (5) melting curve, with a ramp from Ta to 99 °C (
Table 3). The procedures were programmed between 30 and 40 cycles of amplification.
Optimal Ta values were determined during the development of PCR protocols applied to
E. coli O157:H7, as published by Yepes-Pérez et al. [
13]:
stx1 gene, 58 °C;
stx2 gene, 50 °C;
rfbE gene, 52 °C;
O157 gene, 55 °C; and
16S gene, 55.5 °C.
Determination of the Validation Parameters
Dynamic range. For each of the gene primers (stx1, stx2, rfbE, and O157), the DNA concentration of 48.2 ng μL−1, whose absorbance (A) value is approximately a unit, was set as the upper limit. The goal was to ensure that the chosen maximum concentration was included within the linearity of the curves of A versus concentration according to the Lambert–Beer equation.
The maximum and minimum concentration range of STEC O157:H7 DNA detected in each qPCR was calculated, with a high degree of reliability, to determine the analytical sensitivity (detection limits) and the level of precision and accuracy (cut-off limits) of the protocols applied to each of the virulence genes (
stx1,
stx2,
rfbE/
O157). A standard curve was prepared three times for each gene from a 48 ng μL
−1 bacterial DNA stock solution, considering three dilution series with factors 1:2, 1:3, and 1:6. The detected signals were analyzed through their coefficients of variation (CV) based on their variability. The parameters of R
2 (coefficient of determination) and the percentage of efficiency (% E) (Equation (1)) were calculated from the results to determine the degree of interrelation between the Ct (cycle threshold) value and the DNA concentration [ng µL
−1] for each of the dilutions [
16].
Statistical Analysis of the Data Was Performed with Statgraphics Software.
Selectivity. The specific recognition capacity of the virulence genes
stx1, stx2, and
rfbE of the developed qPCRs was determined by evaluating, with the same protocols, the DNA of bacteria that express one or more genes (inclusivity parameter,
Table 1) and of others that do not express them (exclusivity parameter). The assays were performed twice, using DNA concentrations between 30 and 50 ng μL
−1.
The evaluation of the inclusivity of the qPCRs was developed for each gene. For stx1, LAMA 448, 683, 685, 1384, 1438, 1444, 1446, 1456, and E. coli O157:H7 template DNA were used. For gene stx2, LAMA 448, 540, 541, 564, 683, 840, 882, 1456, and 1462 DNA were used. And for gene rfbE, LAMA 448, 525, 540, 541, 543, 545, 564, 603, and 882 DNA were used.
The statistical evaluation of the inclusivity and the specificity of each qPCR was performed based on the contingency table presented by Leotta et al. [
17], adapted by Yepes-Pérez et al. [
13], as shown in
Table 4.
Positive and negative results were taken based on the amplification signal (Ct) associated with the specific gene evaluated (stx1, stx2, and/or rfbE). A true positive was assigned to the DNA that amplified and contained the reference gene. For samples that were amplified and did not contain the tested gene, a false positive was established. A true negative was applied to DNA samples that did not amplify. These samples came from microorganisms that did not contain virulence factors. The expression false negative was used for DNA samples that carried virulence genes and did not amplify in the procedures.
The inclusivity, exclusivity, and analytical precision parameters of the developed qPCRs were calculated using Equations (2)–(6) [
17], considering the contingency table (
Table 4):
Robustness. The concordance analysis (reproducibility) of the qPCRs was carried out based on the detection (Ct) of
stx1,
stx2, and
rfbE in the DNA of
E. coli O157:H7 ATCC 43895. Three DNA concentrations (24.1 ng μL
−1, 2.68 ng μL
−1, and 0.29 ng μL
−1) were considered for this parameter. Two people performed the protocols separately, two times each, on different days, using two qPCR kits. Positive and negative controls were included in each assay. A CV of less than 5% was defined as an intra-assay acceptability criterion [
18].
Detection of
E. coli O157 in a real matrix. To assess the suitability, validity, and reliability of SYBR Green qPCR procedures in a food matrix, ground beef from a meat store in the city of Medellín, Colombia, was used, which has all regulatory provisions (Colombian NTC standard 1325-2008) [
19], governed and monitored by the Instituto Nacional de Vigilancia de Medicamentos y Alimentos of Colombia (Invima, by its acronym in Spanish, Bogotá, Colombia).
To evaluate the initial quality of the raw meat and verify the absence of
E. coli O157, microbiological analyses were carried out using specific selective and differential culture media (Chromogenic Colinstant Agar, BRILA broth, SIM medium, and VRBD agar), according to official methods of the AOAC 966.24 [
20] and the NTC 4899 [
21] standard.
To verify the artificial contamination of meat samples with E. coli O157:H7 and commensal E. coli (used as one of the controls), which were used in the evaluation of the sensitivity of the qPCR protocols in this food matrix, again, the same microbiological analyses mentioned above were used. Contaminations were also verified with biochemical analysis, using the automated microbial identification system VITEK® 2 (BioMérieux Inc, Bogotá, D.C., Colombia), with the GN card for the identification of Gram-negative bacilli.
To prepare the inoculum used in meat contamination, cultures of E. coli O157 and commensal E. coli (used as a control) were enriched to increase their concentration. Each strain was plated on Trypticase Soy (TS) agar and incubated at 37 °C for 24 h; the entire procedure was performed in duplicate. From the enriched culture of E. coli O157, three inoculums were taken to contaminate the raw meat samples: 100 (range: 1–4 CFU), 101 (range: 9–15 CFU), and 102 (87–145 CFU) CFU per mL of buffered peptone water (BPW). For commensal E. coli, inoculum was prepared with a concentration of 108 CFU mL−1 of BPW. Two negative controls were included: one was an uninoculated meat sample (as obtained from the butcher shop), and the other was a sample to which 225 mL of BPW without inoculum was added.
Each ground beef sample from the treatments in each block was 25 g, and 222.5 mL of BPW and 2.5 mL of the inoculum and controls described above were added to each one. Each sample was homogenized in a Stomacher circulator at 37 °C for 24 h. Finally, 1 mL aliquots were taken from each of the treatments, and the DNA extraction was used by Yepes-Pérez [
13].
Meat contamination was carried out under an experimental design of three completely randomized blocks, taking a 275 g batch of ground beef as the blocking factor and a 25 g sample as the experimental unit. The design consisted of the following 3 × 3 + 2 factorial combination, with a total of 11 treatments in each of the blocks: three virulence genes (
stx1,
stx2, and
rfbE); three bacterial inoculum concentrations (10
0, 10
1, and 10
2); and two controls, one with a non-STEC strain and the other with BPW. The data were analyzed with the statistical software R (R Core Team. R: A Language and Environment for Statistical Computing. R Foundation for Statistical Computing, Vienna, Austria;
https://www.R-project.org/ (accessed on 22 July 2019)) and following a complete randomization scheme.
Table 5 details the three blocks and the 11 experiments in each one of them.
Buffered peptone water (BPW) and samples inoculated with commensal E. coli were used for the negative controls.
3. Results
Dynamic range fluorescence or amplification signals, taken from the threshold value of the number of cycles (Ct) in relation to the concentration 48.2 ng μL−1, ranged from 12 to 20 cycles, according to each pair of primers.
The detection limit observed for
stx1 and
stx2 was 1.30 × 10
−4 ng μL
−1. For
rfbE and
O157, the detection limit was 1.73 × 10
−3 ng μL
−1. The following values were established for the cut-off points:
stx1 1.72 × 10
−3 ng μL
−1;
stx2 3.52 × 10
−3 ng μL
−1;
rfbE 3.17 × 10
−2 ng μL
−1; and
O157 3.17 × 10
−2 ng μL
−1.
Table 6 includes the values of Ct and CV corresponding to the concentrations of each gene.
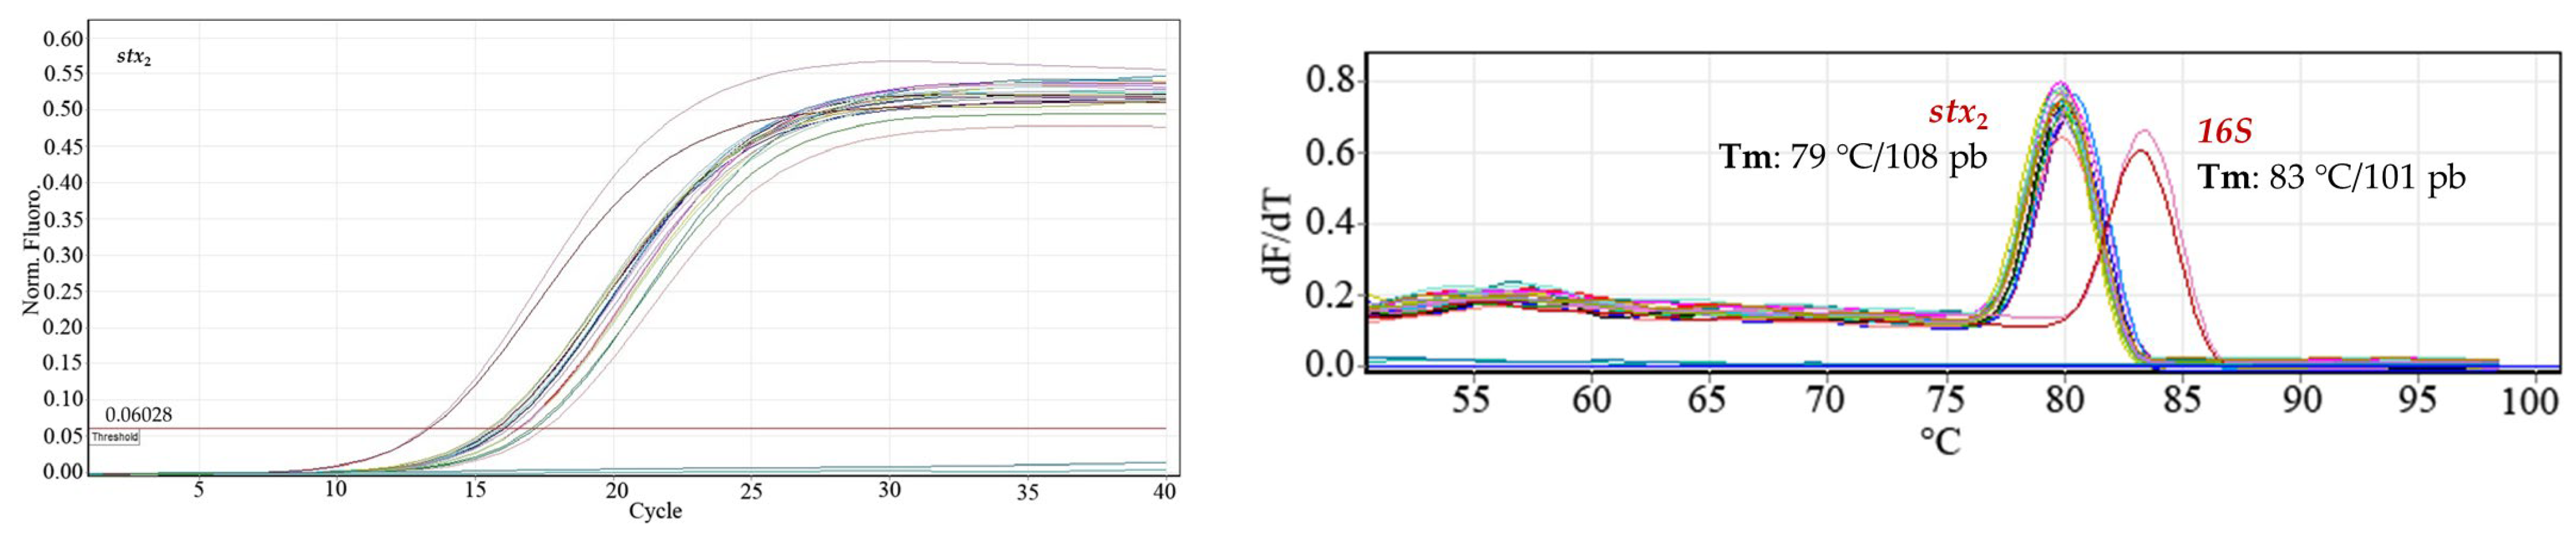
The positive control (gene 16S) amplified in all curves, reporting a single signal in the region of melting temperature (Tm), whereas the negative control (milli-Q water) did not amplify. These results are indicative of a good performance in the development of each one of the qPCR protocols applied to the virulence genes of interest and an adequate manipulation of the samples without contamination between them.
The little variability of the cut-off points or quantification values, lower than 2% in the repetitions performed, guaranteed repeatability and reliability for each one of the measurements (CV).
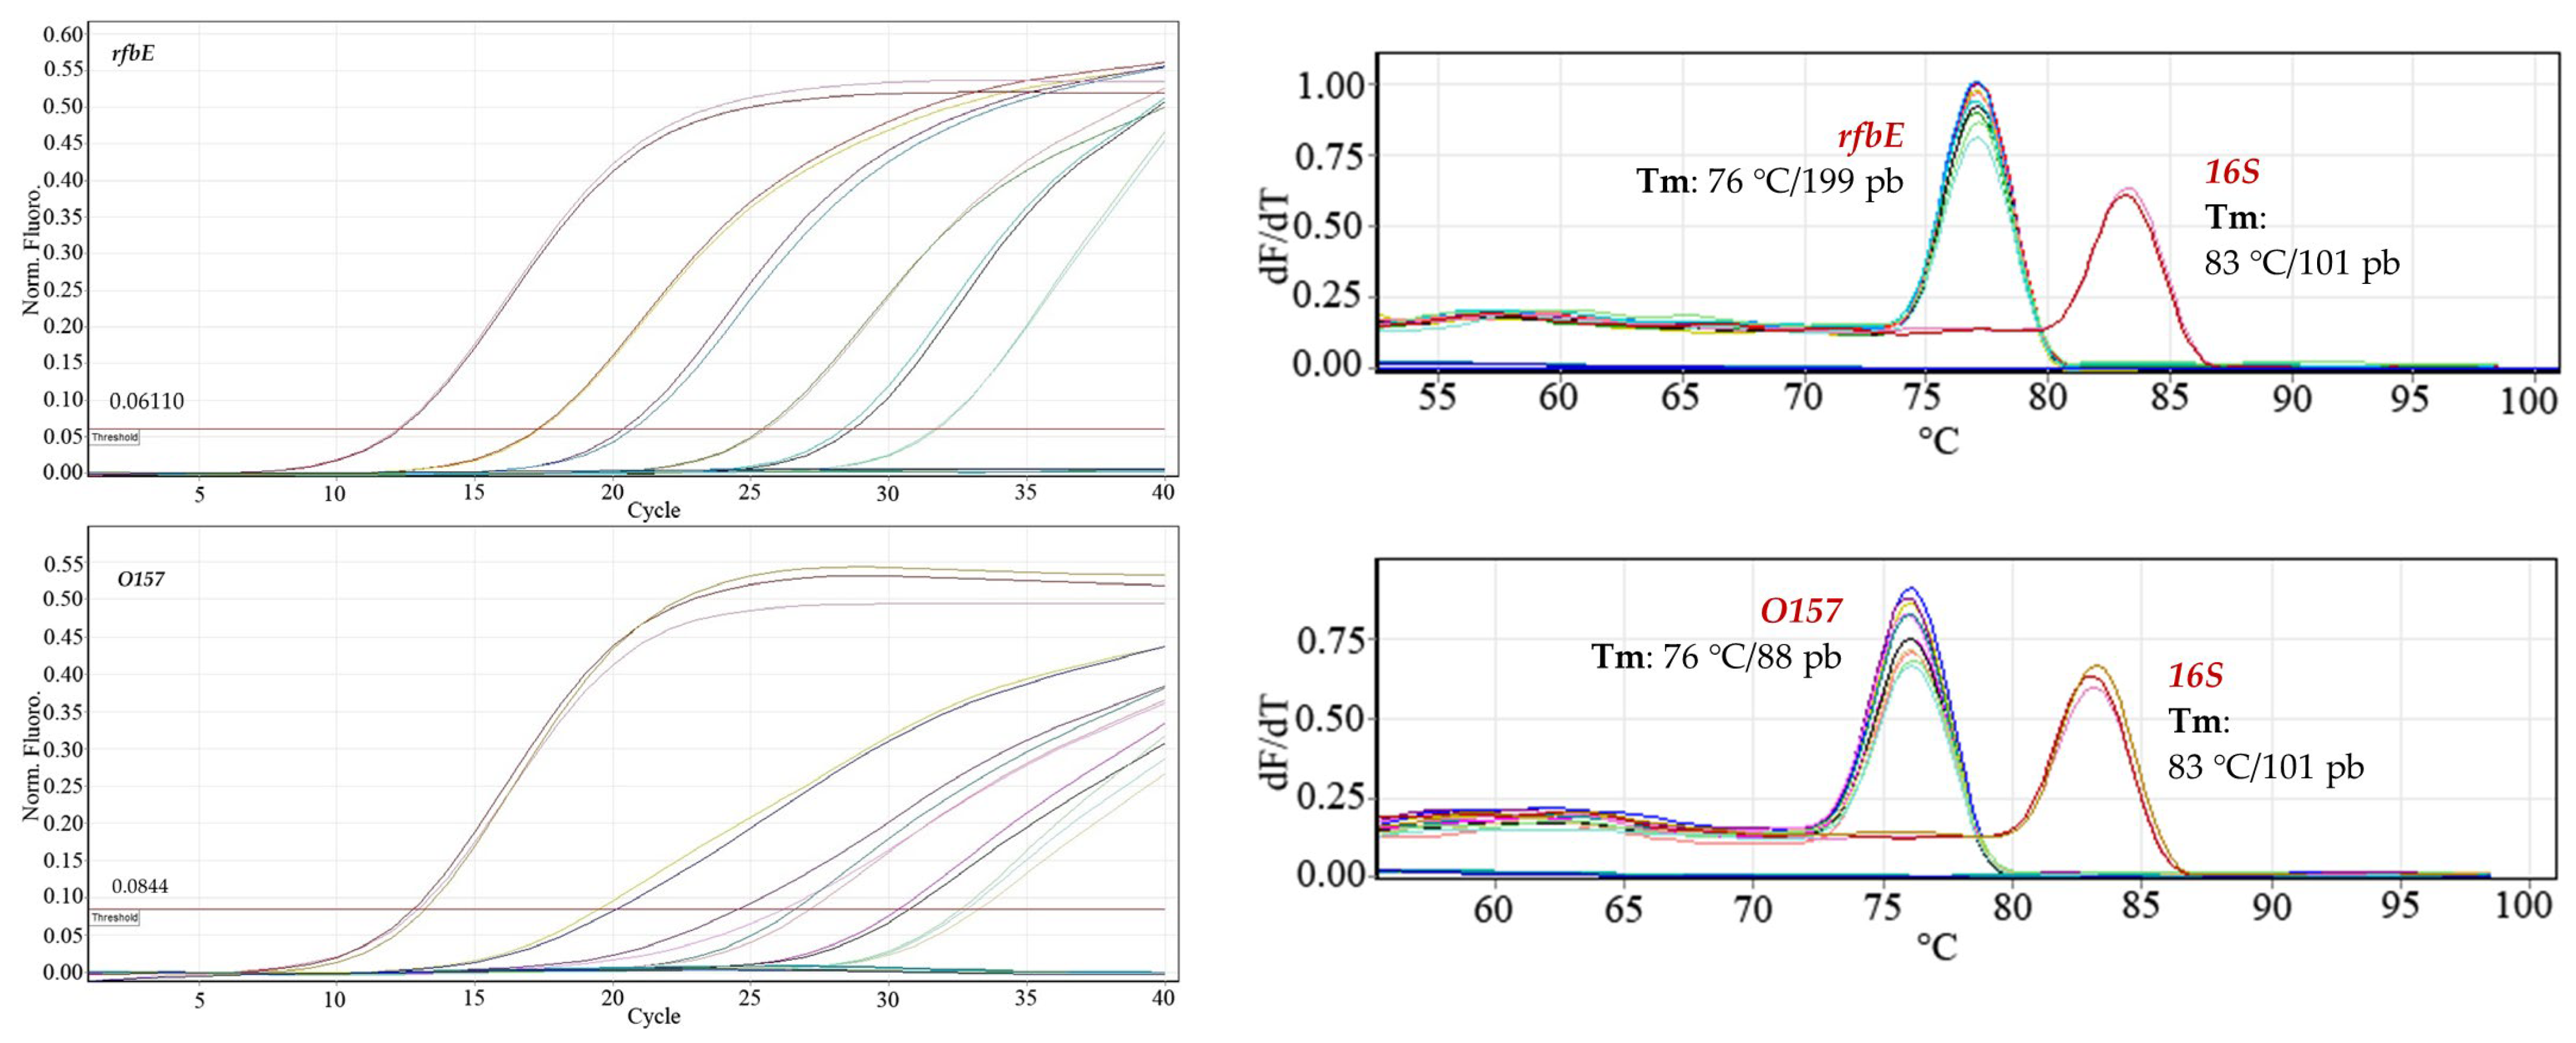
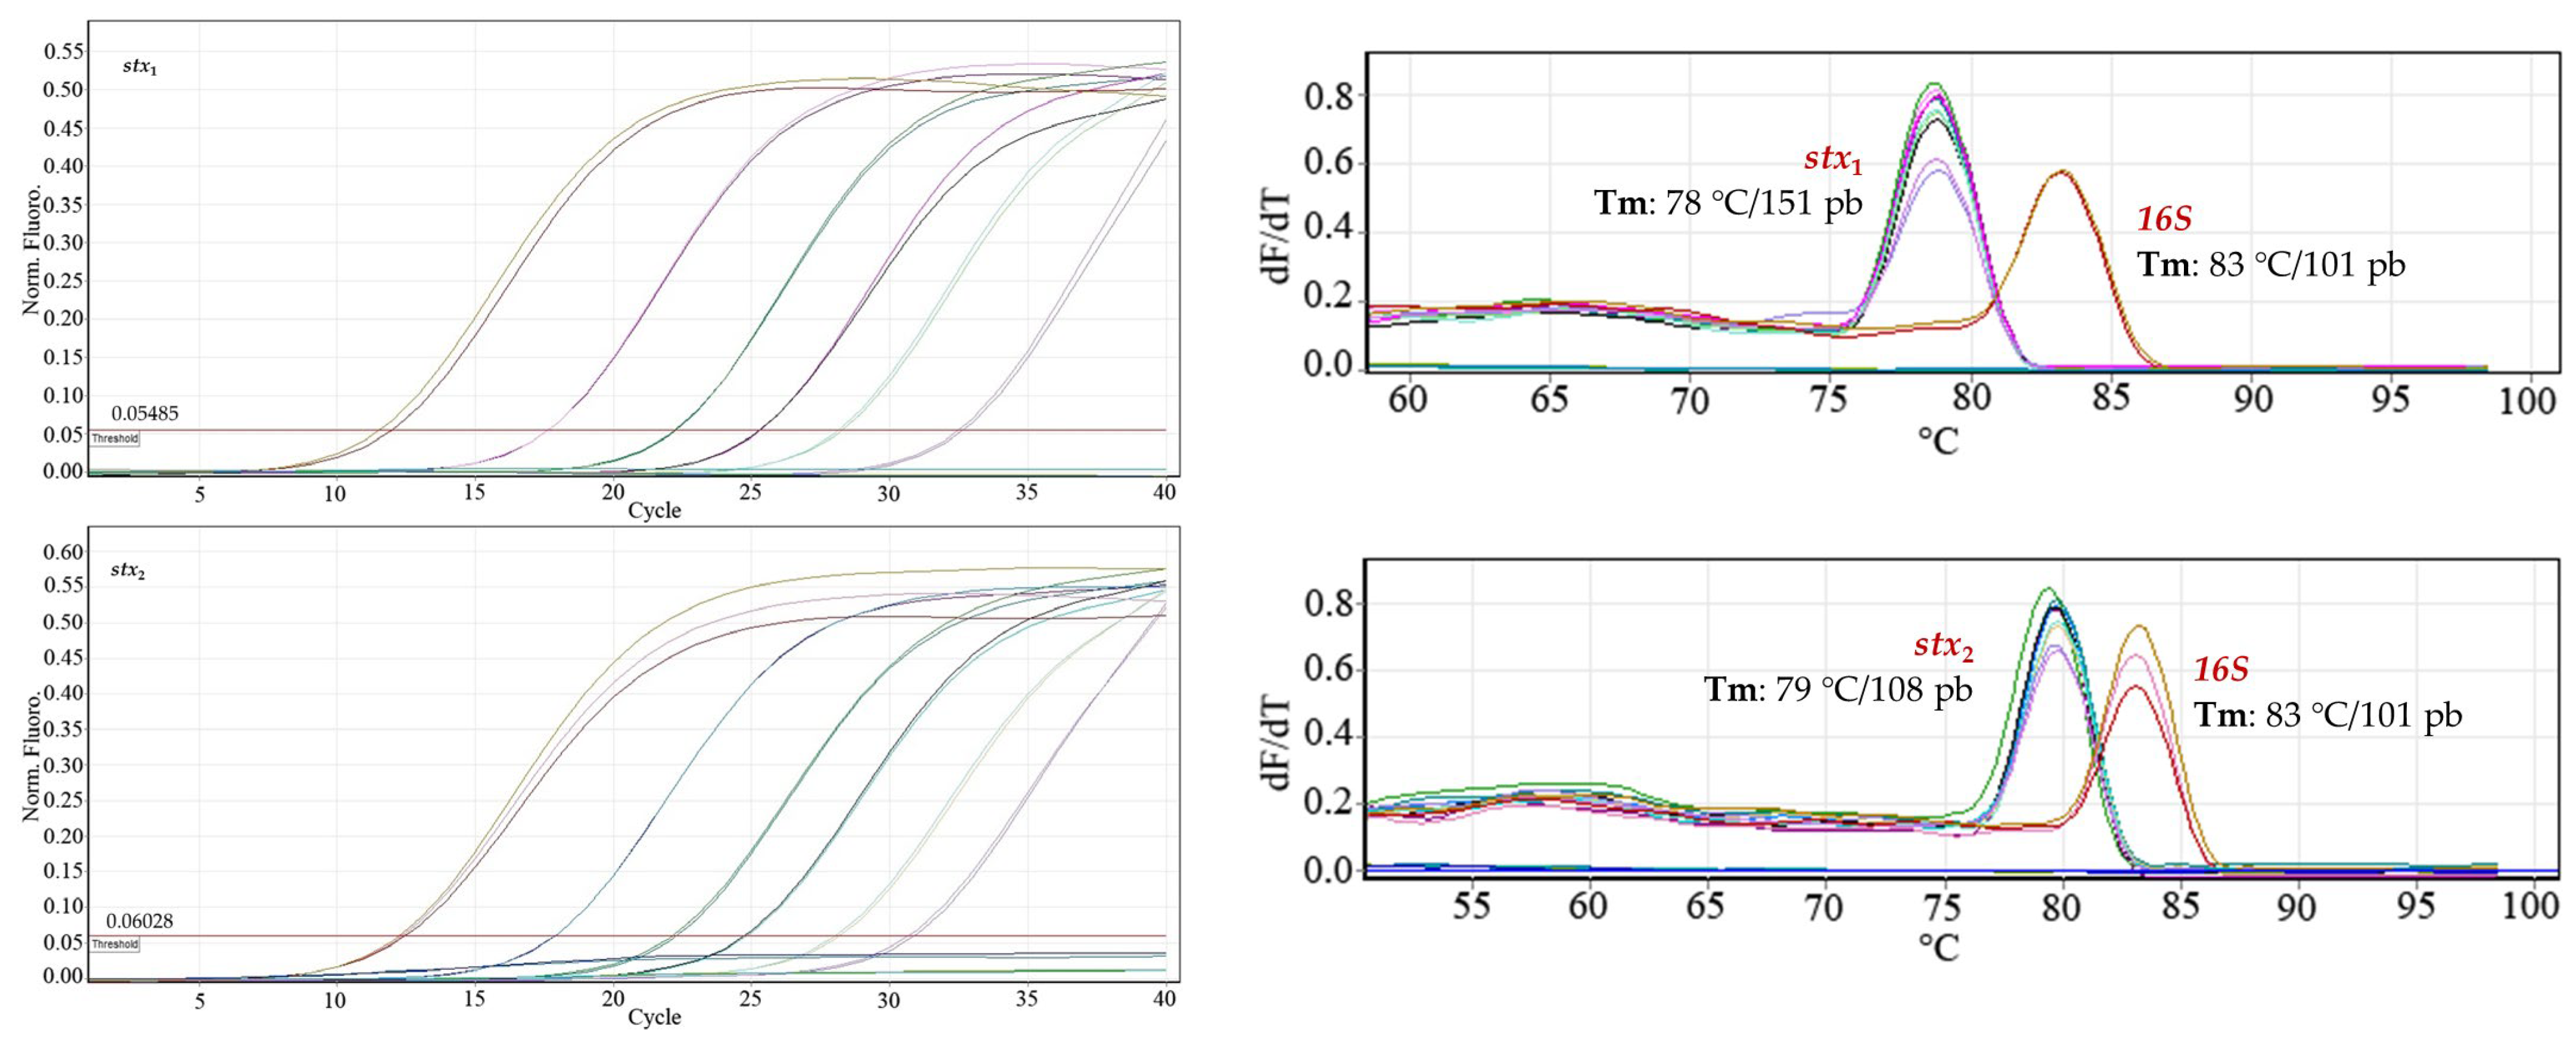
Construction of dilution curves of the bacterial DNA samples. The amplification reactions of the three genes evaluated (stx1, stx2, rfbE/O157) were developed with the 1:6 dilutions of the bacterial DNA because the 1:2 and 1:3 dilutions did not show an appreciable difference in those points where greater variability was expected.
Using the standard 1:6 bacterial DNA dilution curves, starting from the 48.20 ng μL
−1 dilution, dilutions were prepared for the calibration curve for each primer pair: 8.03 ng μL
−1; 1.34 ng μL
−1; 0.22 ng μL
−1; 0.04 ng μL
−1 (
Figure 1). With the use of ANAVA statistical analysis in the evaluated sequences,
p values < 0.05 were obtained, indicating a statistically significant relationship between Ct and Log [ng µL
−1], with a confidence level of 95%. All evaluated spots of each oligonucleotide sequence were amplified, and no signal was detected from the negative controls.
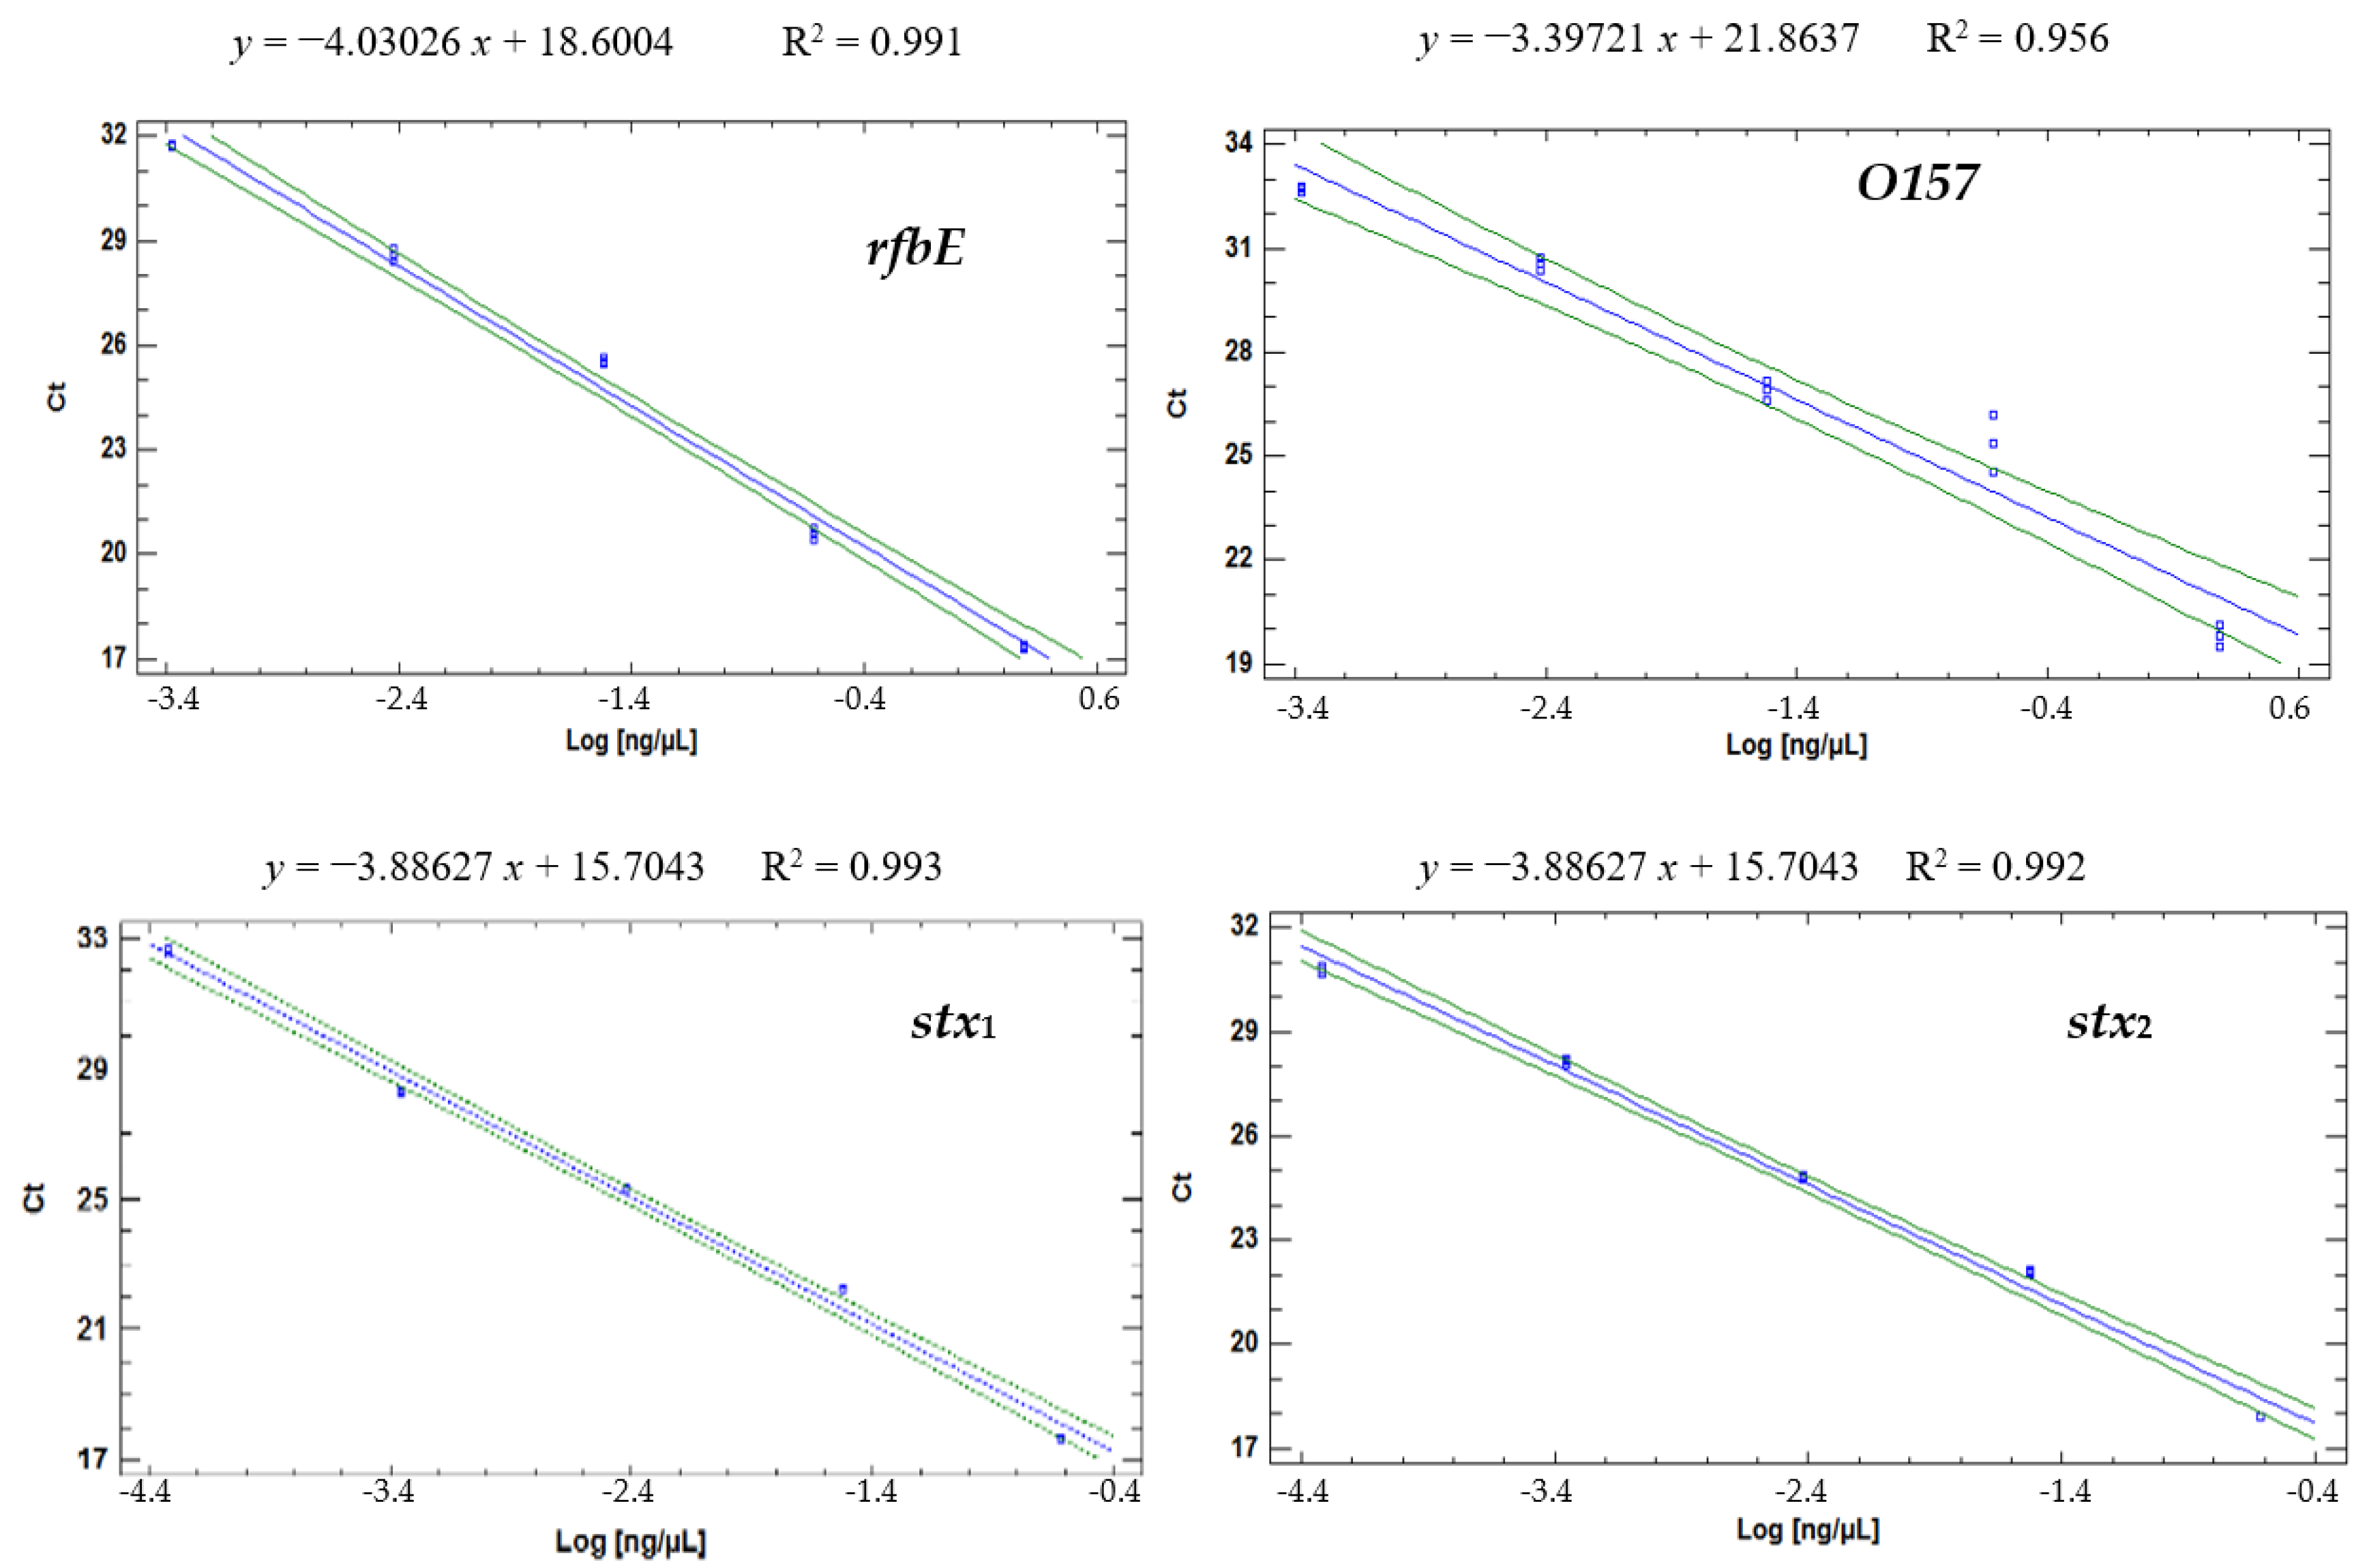
The efficiencies (% E) of the reactions measured based on Equation (1) and fitted to a simple linear regression model (
Figure 2) ranged from 80% to 97%:
rfbE at ~80% (R
2 = 0.99); for
O157, it was 97% (R
2 = 0.96);
stx1 at 81% (R
2 = 0.99); and
stx2 at 95% (R
2 = 0.99). The O157 primer amplicon had the lowest efficiency (95.6%).
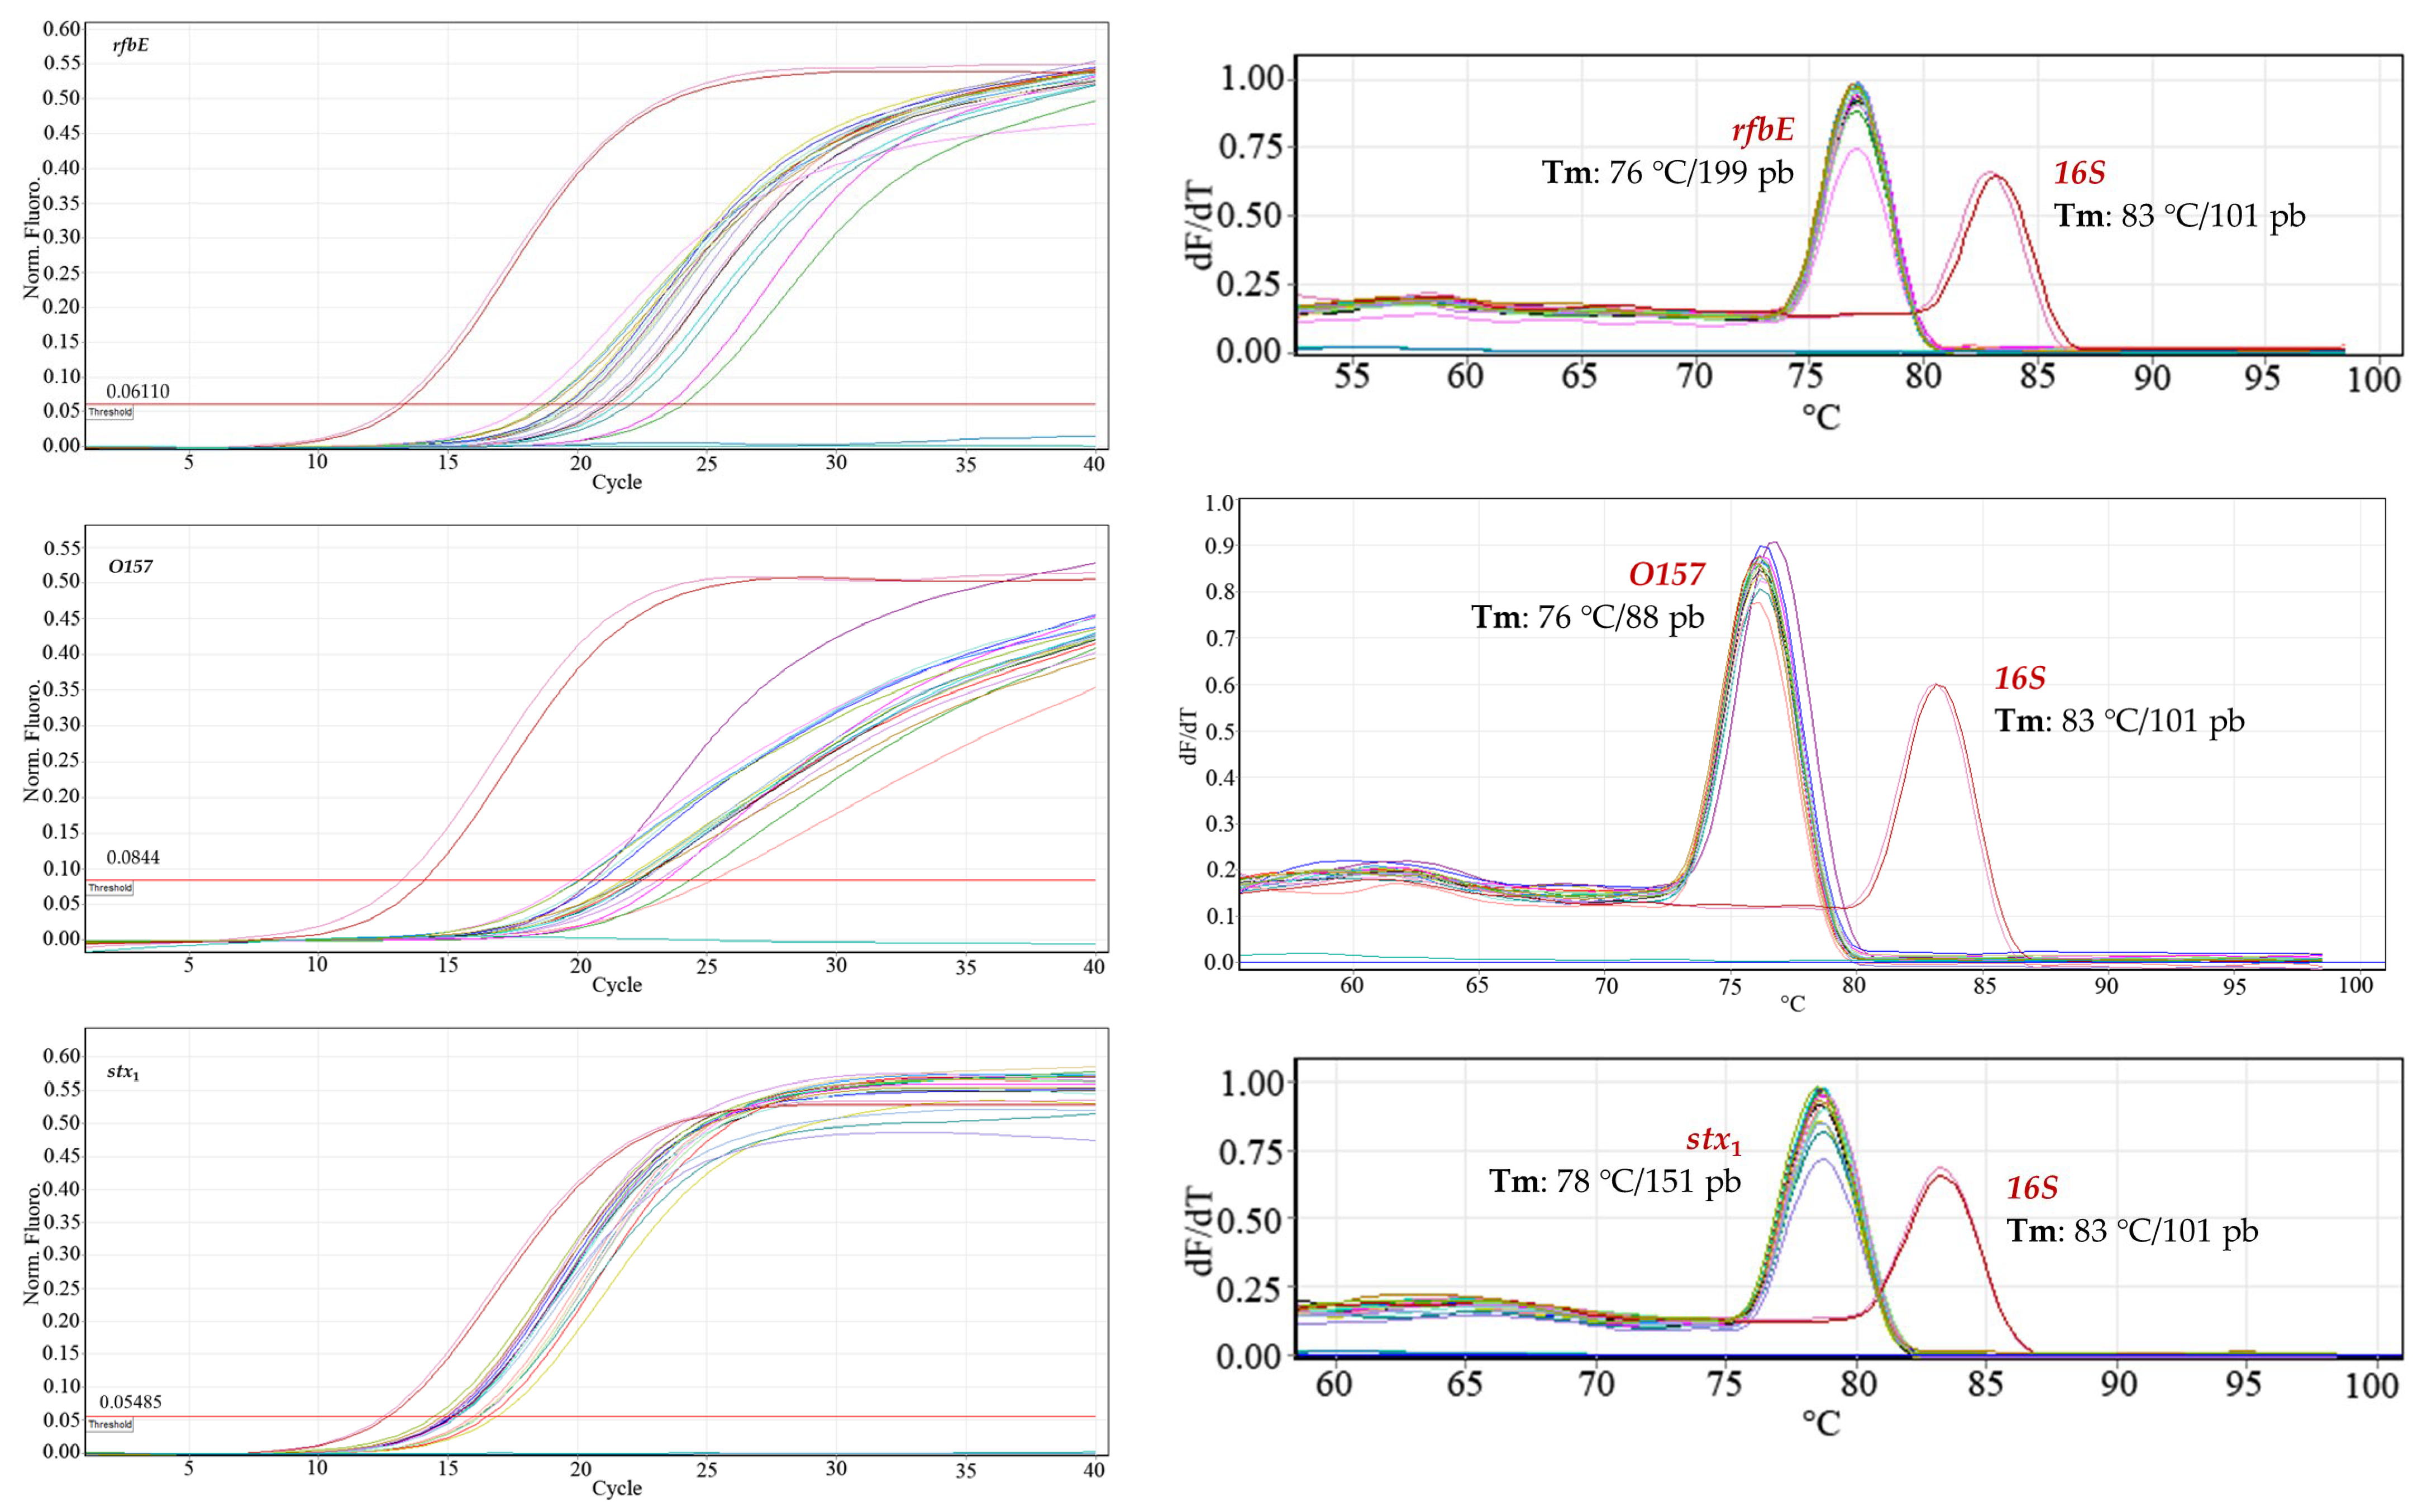
Selectivity of qPCRs. Bacterial DNA evaluated for inclusivity and exclusivity were adjusted to 30 ng μL−1, and all tests were performed in triplicate.
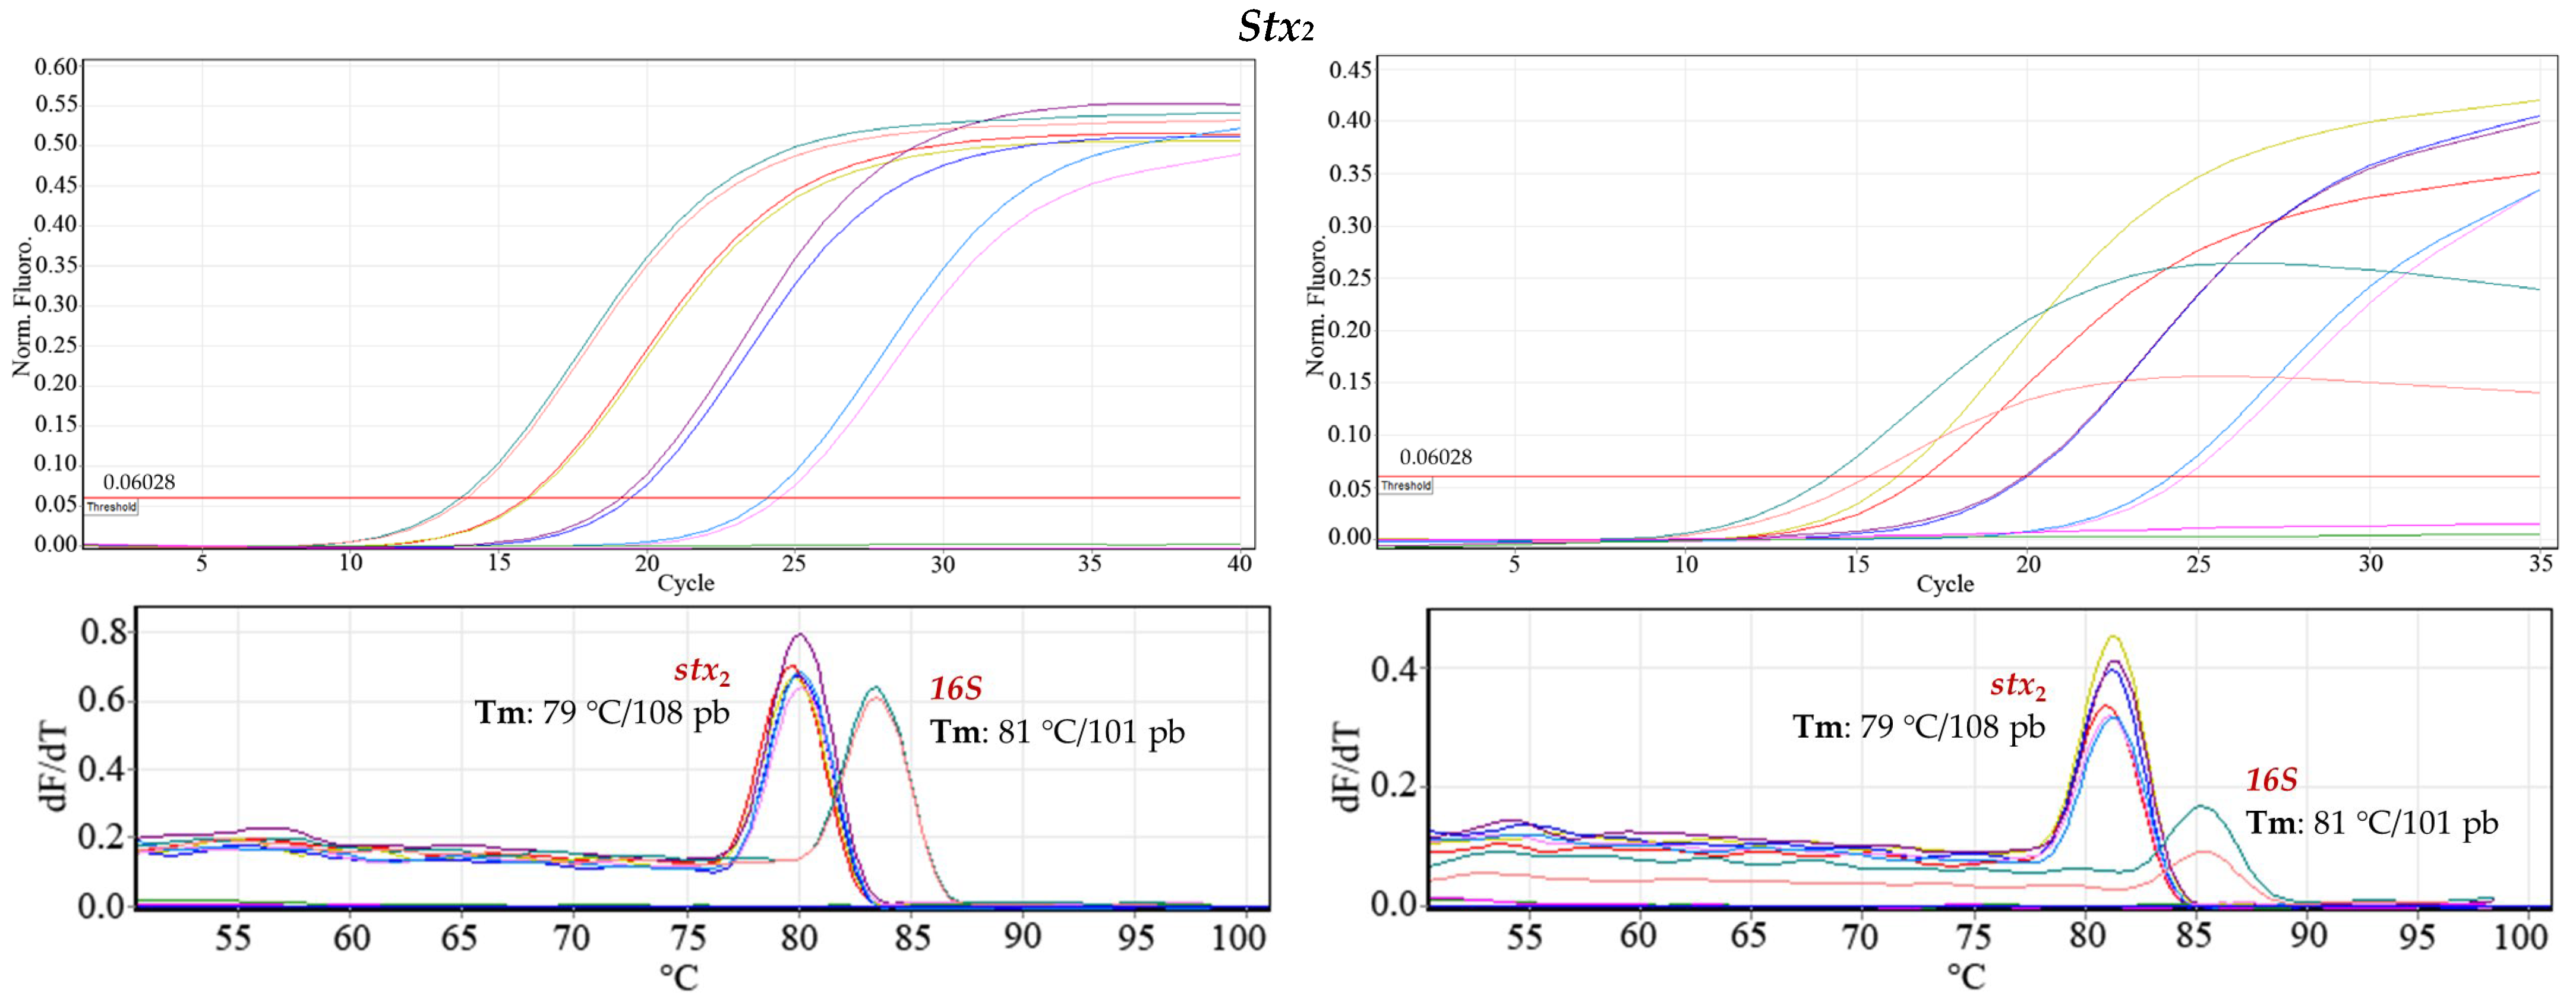
Inclusivity. The specific recognition of the genes in the nine STEC O157 and non-O157 strains in
Table 1 was 100% with 95% confidence (
Figure 3). The Cts of the strains evaluated are reported in
Table 7.
Exclusivity. Exclusivity equaled 100% because bacterial strains recognized for not expressing the virulence genes
stx1,
stx2, and
rfbE did not amplify.
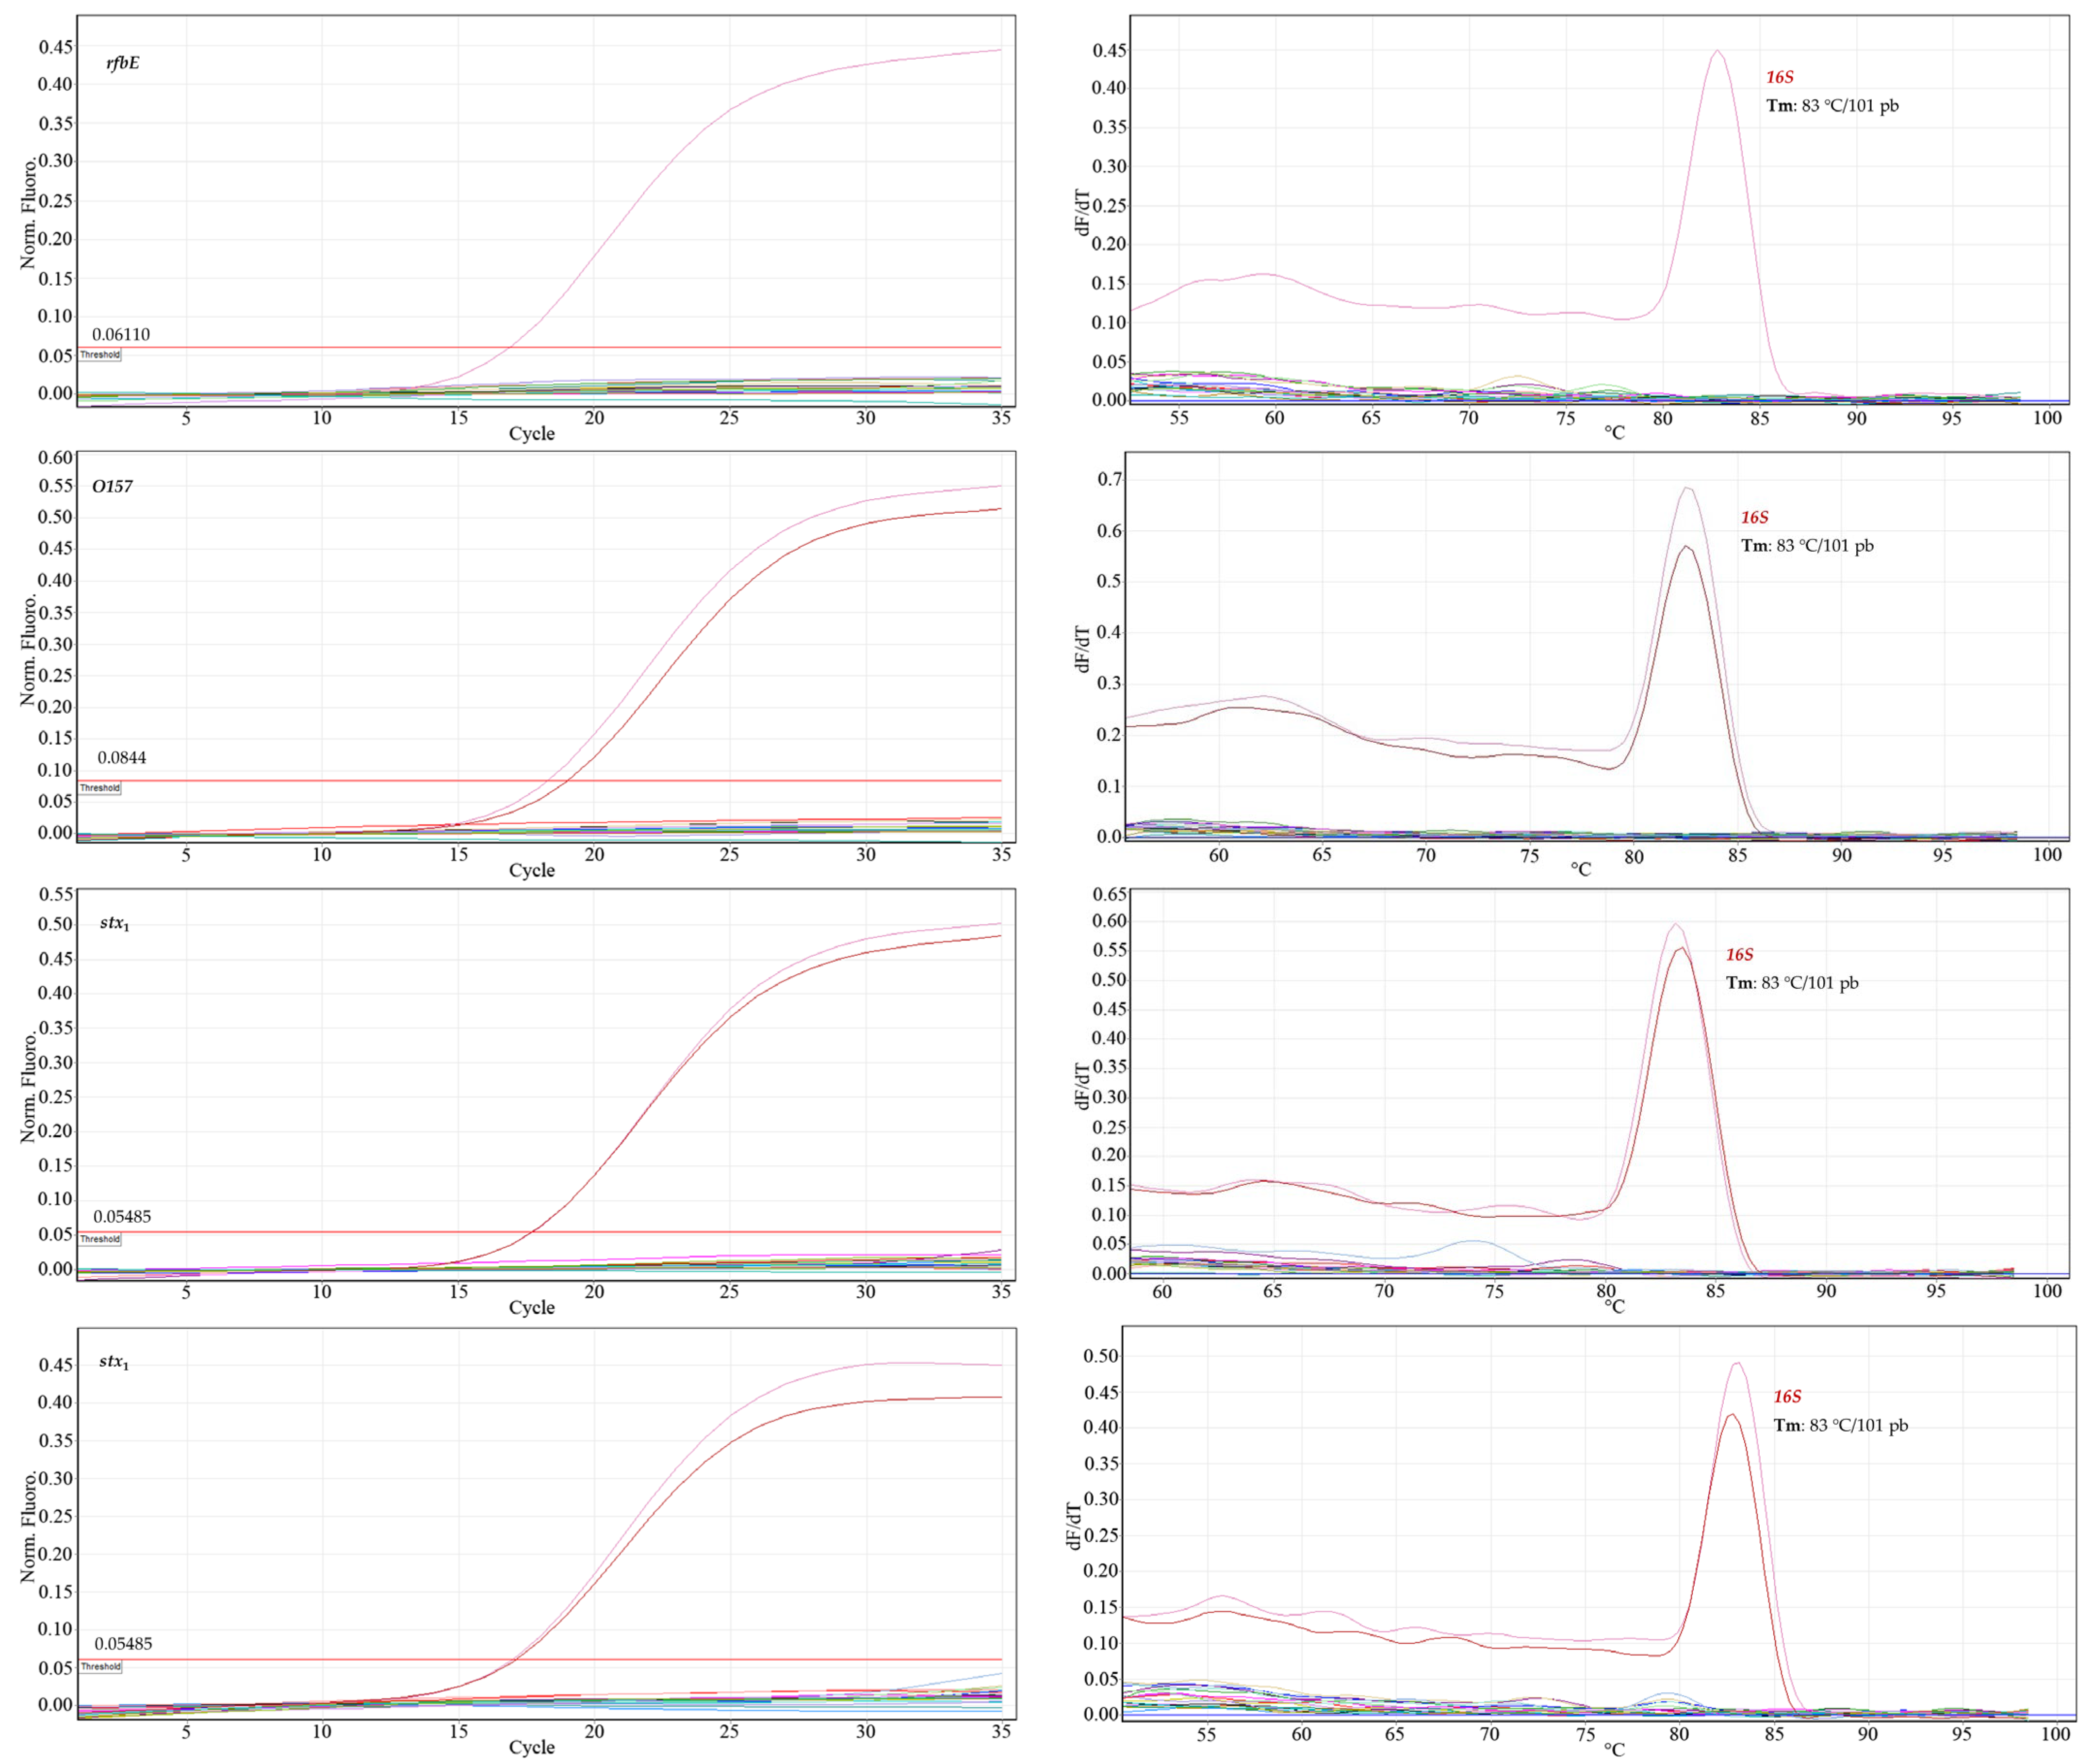
Figure 4 shows only the amplification of the DNA of
E. coli O157:H7, used as a positive control for each virulence gene, and, in the melting curve, the signals corresponding to the positive controls
E. coli O157:H7 and commensal
E. coli (
16S gene). The Ct values of the positive control evaluated for each gene were as follows: Ct
stx1 17.76; Ct
stx2 17.05; Ct
rfbE 18.84; and Ct
O157 18.70.
Based on the contingency table (
Table 5), an analytical precision of 100% was obtained for the four pairs of primers evaluated (stx1, stx2, O157, and rfbE), which demonstrates the selectivity and specificity of the procedures of SYBR Green qPCR to detect
E. coli O157:H7. Analytical precision evidenced the high degree of agreement between the data recorded for each measurement. No false positives or negatives were detected in the procedures.
Finally, the positive and negative predictive values were 100% for the four pairs of primers evaluated. Thus, it can be assured that the samples where amplification (Ct) was present really had the gene evaluated, whereas those where no signal was detected were true negatives due to the non-existence of the DNA sequences examined. These two parameters reaffirmed the efficacy of the qPCRs developed without interfering with the detection or presence of cross-reactions and with confidence in the specificity of the amplicons corresponding to the target genes evaluated in E. coli O157:H7 (stx1, stx2, and rfbE).
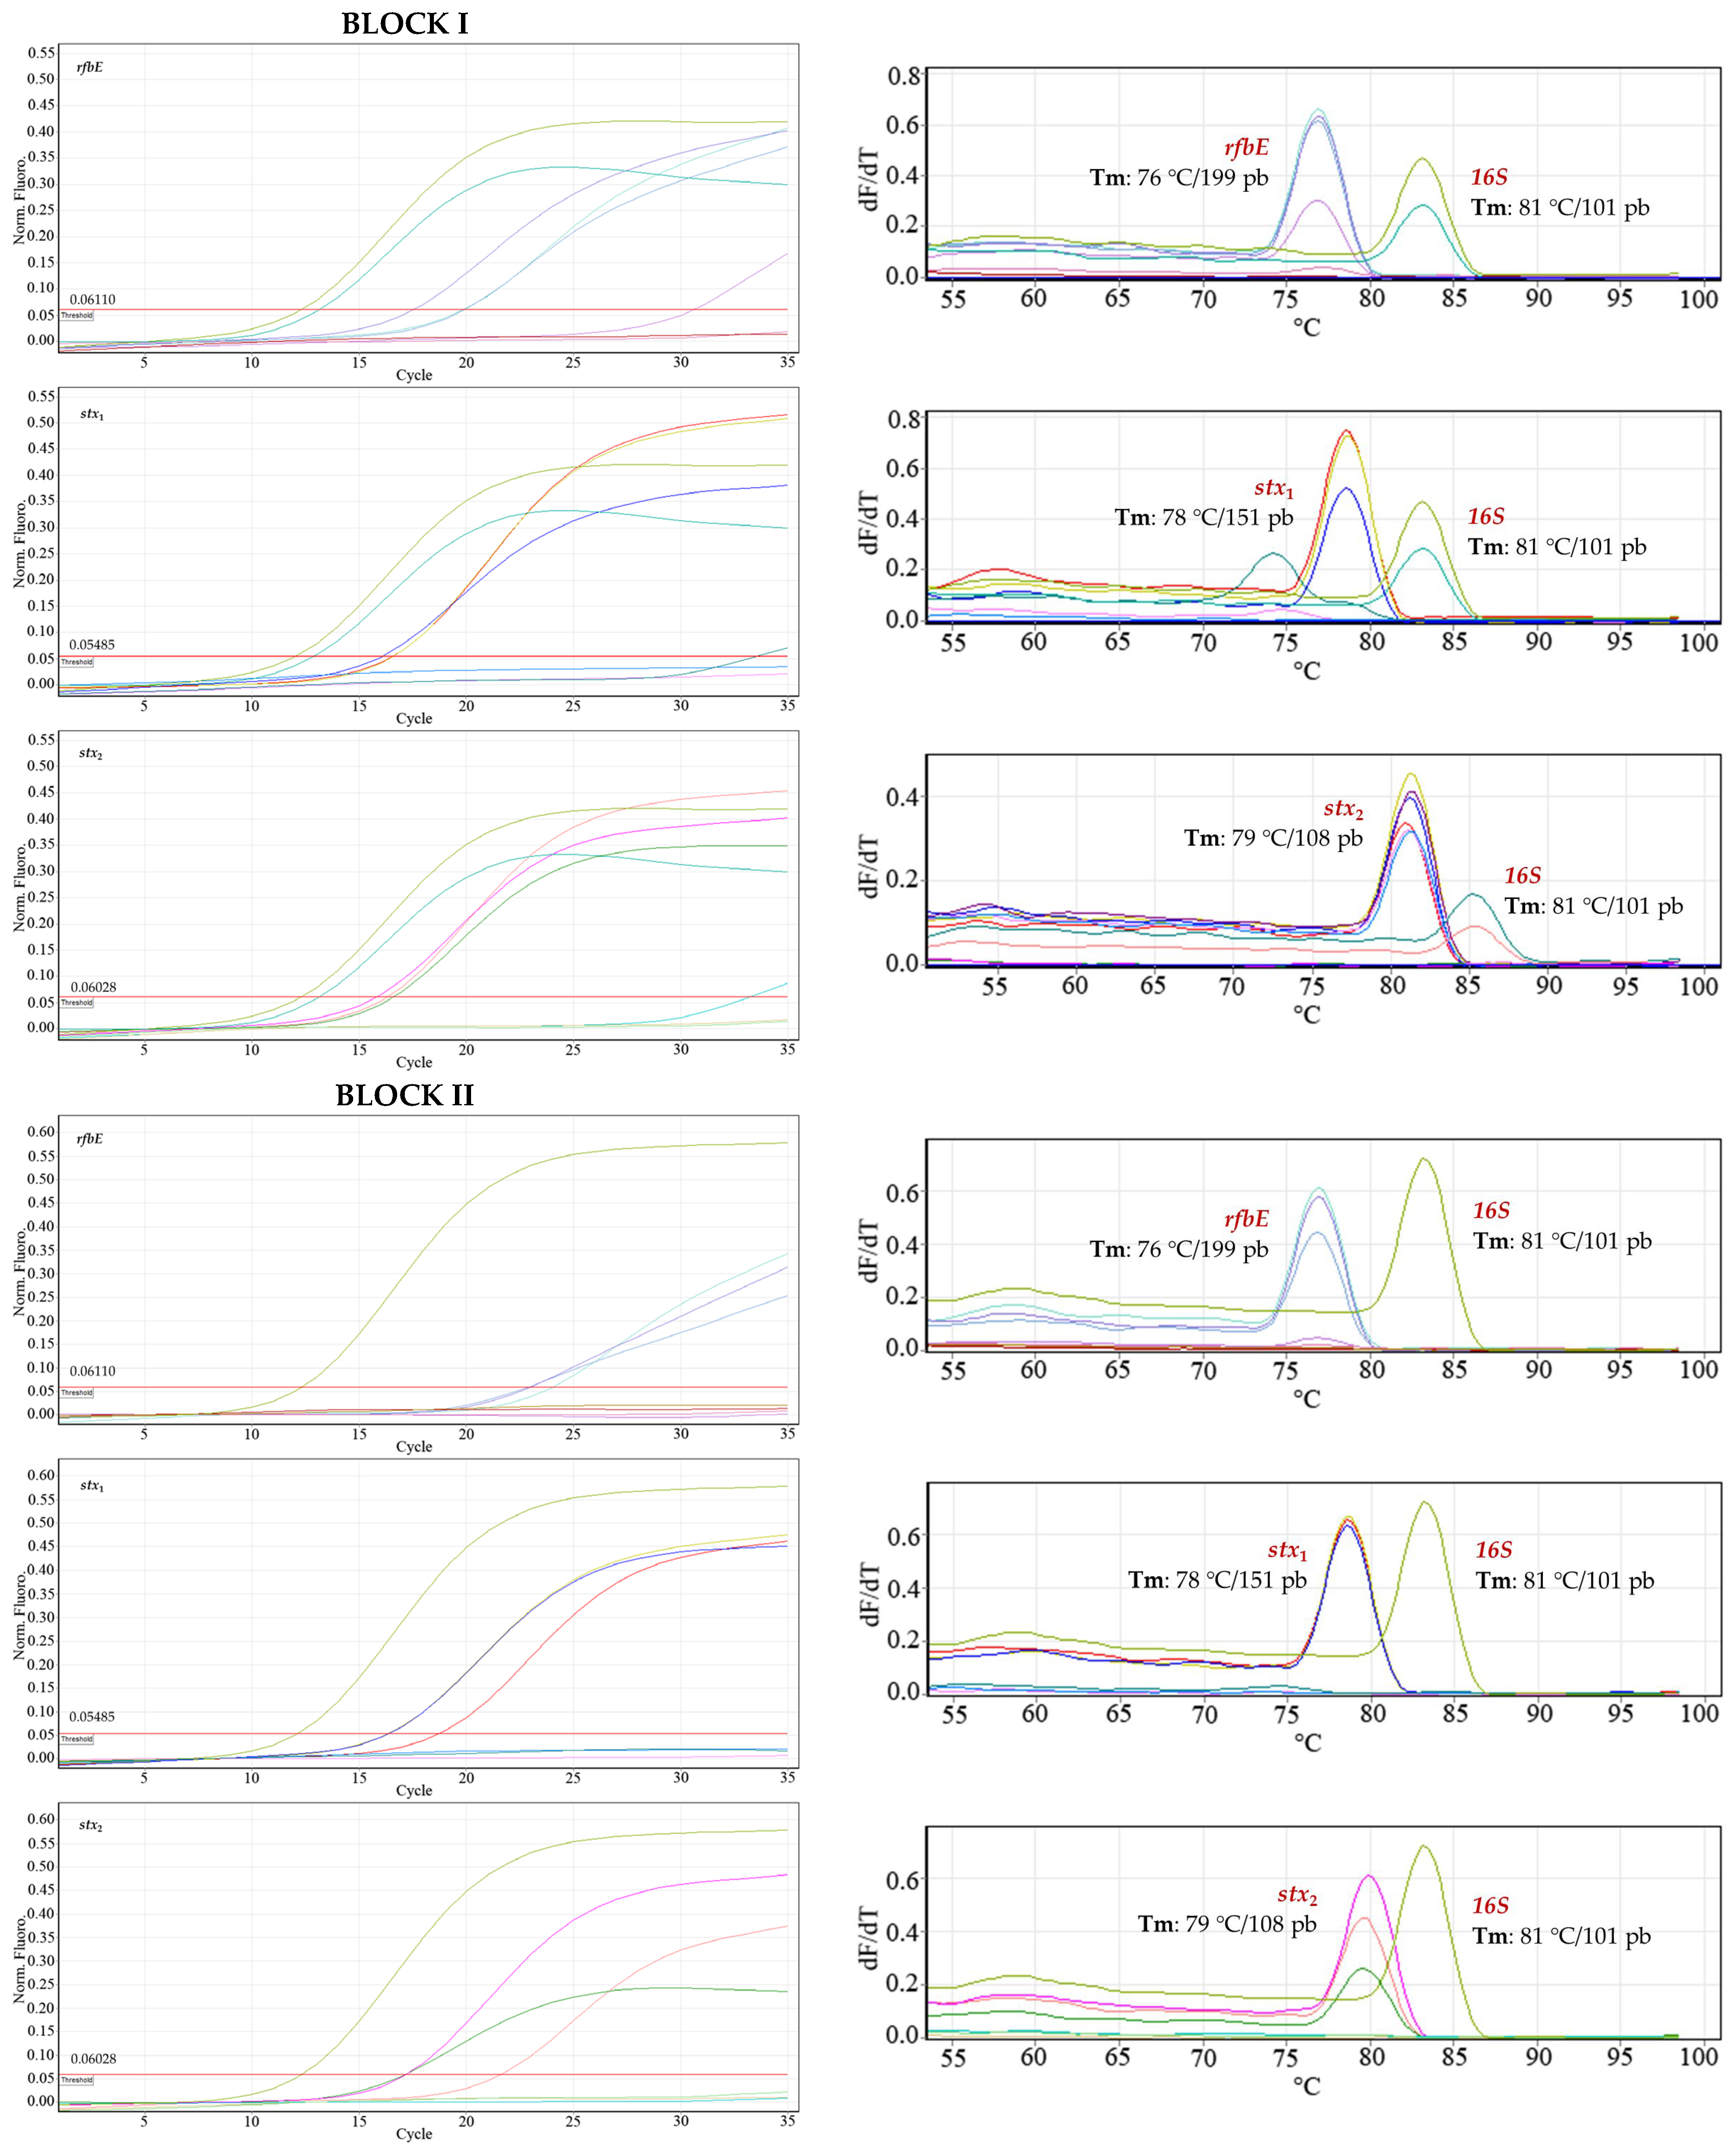
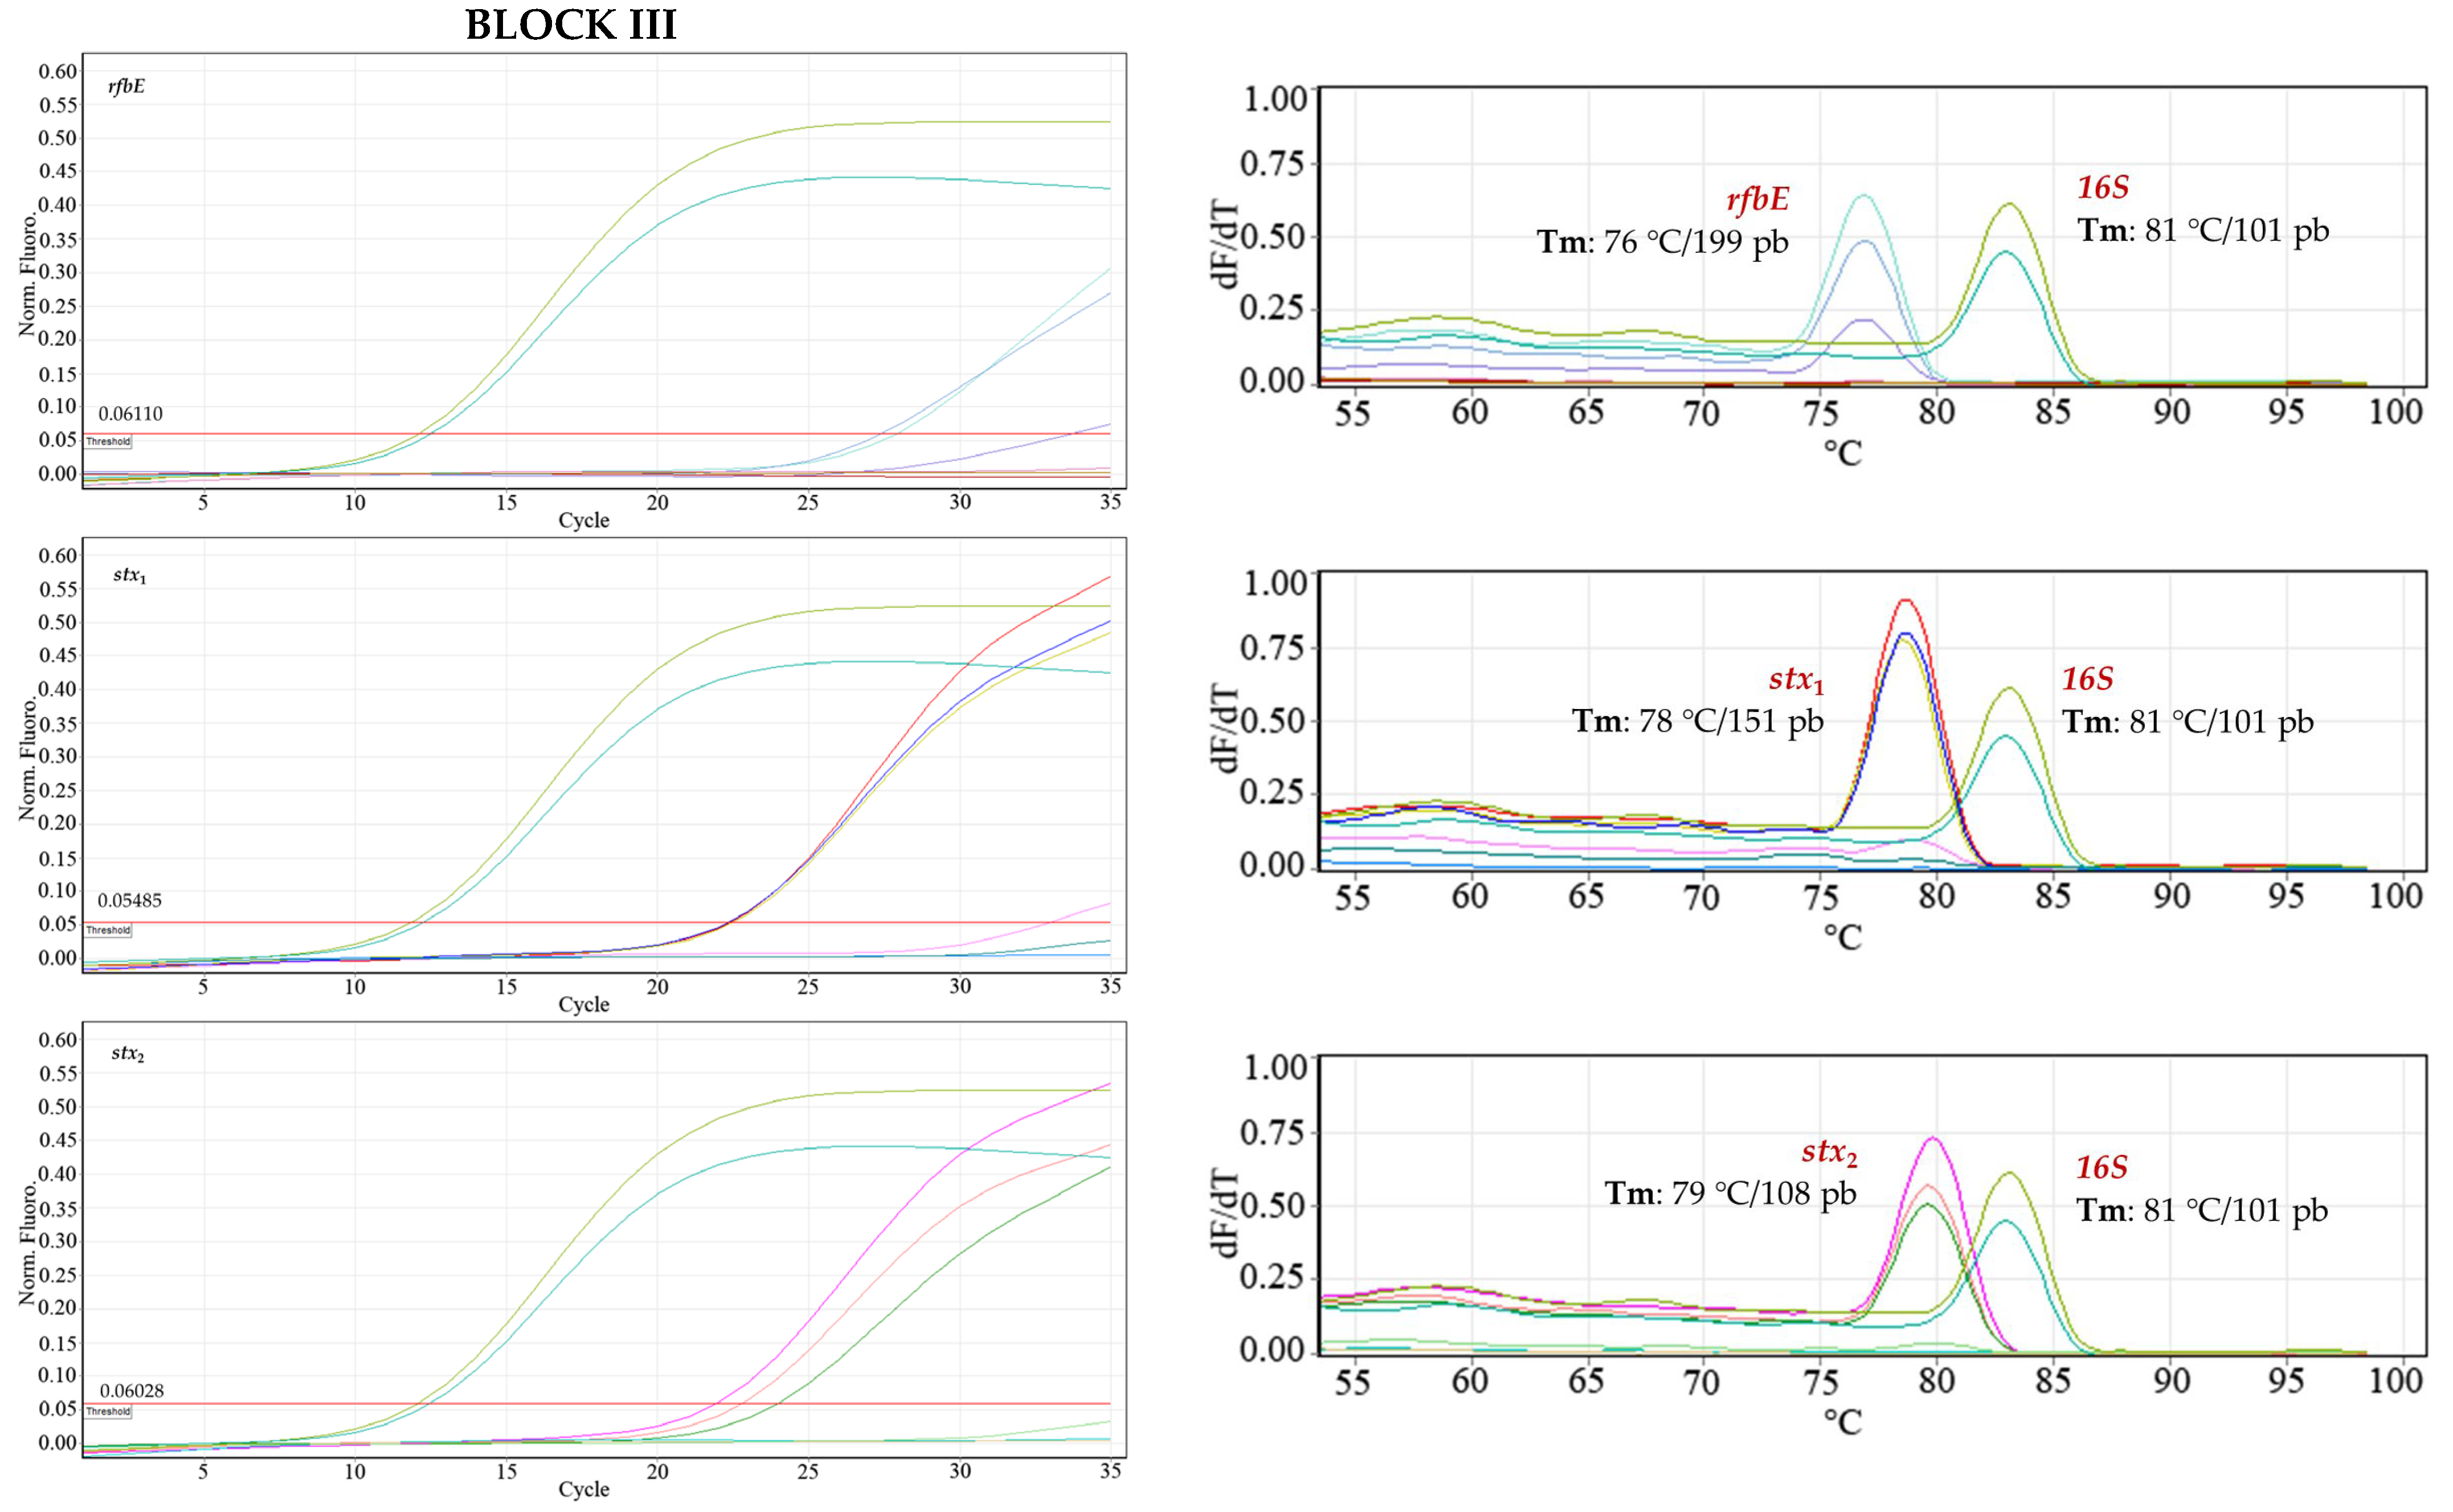
Robustness. In DNA dilutions of 24.1 ng μL
−1, 2.68 ng μL
−1, and 0.29 ng μL
−1, the three
E. coli O157:H7 genes evaluated were detected. The variations introduced did not affect the amplification of the virulence gene regions: two operators, different days, and two qPCR kits; the positive control (
16S gene) always gave a signal, and the negative control did not amplify (
Figure 5). Less dispersion was observed with the QuantiTect SYBR Green PCR Kit (Hilden, Germany) among the three replicates of each concentration with respect to the Platinum SYBR Green qPCR SuperMix-DG kit (Invitrogen, Carlsbad, CA, USA).
To demonstrate the statistical validity with respect to inter-assay reproducibility, a normal population homogeneity of variances test was performed. The results were analyzed under the F-statistic with 95% confidence, confirming that the difference in variances for each assay was not statistically significant. Therefore, there was no increased inter-assay variability.
Table 8 summarizes the Ct values with their corresponding statistical analysis.
Detection of
E. coli O157:H7 in a real matrix. To estimate the number of bacteria present in each suspension, measured in CFU (Colony-Forming Units), absorbance (A) readings were taken at 625 nm, confirming that high A values corresponded to inoculated samples with a higher number of CFU (
Table 9). However, it was not possible to establish a factor to relate A to the number of CFU because the very low values of A overlap with the noise signals of the measuring equipment, and the definition of CFU does not precisely establish a specific number of cells.
The Microbiological Tests Carried Out on the Raw Meat Samples Were Negative, with NMP/g of Less than 3
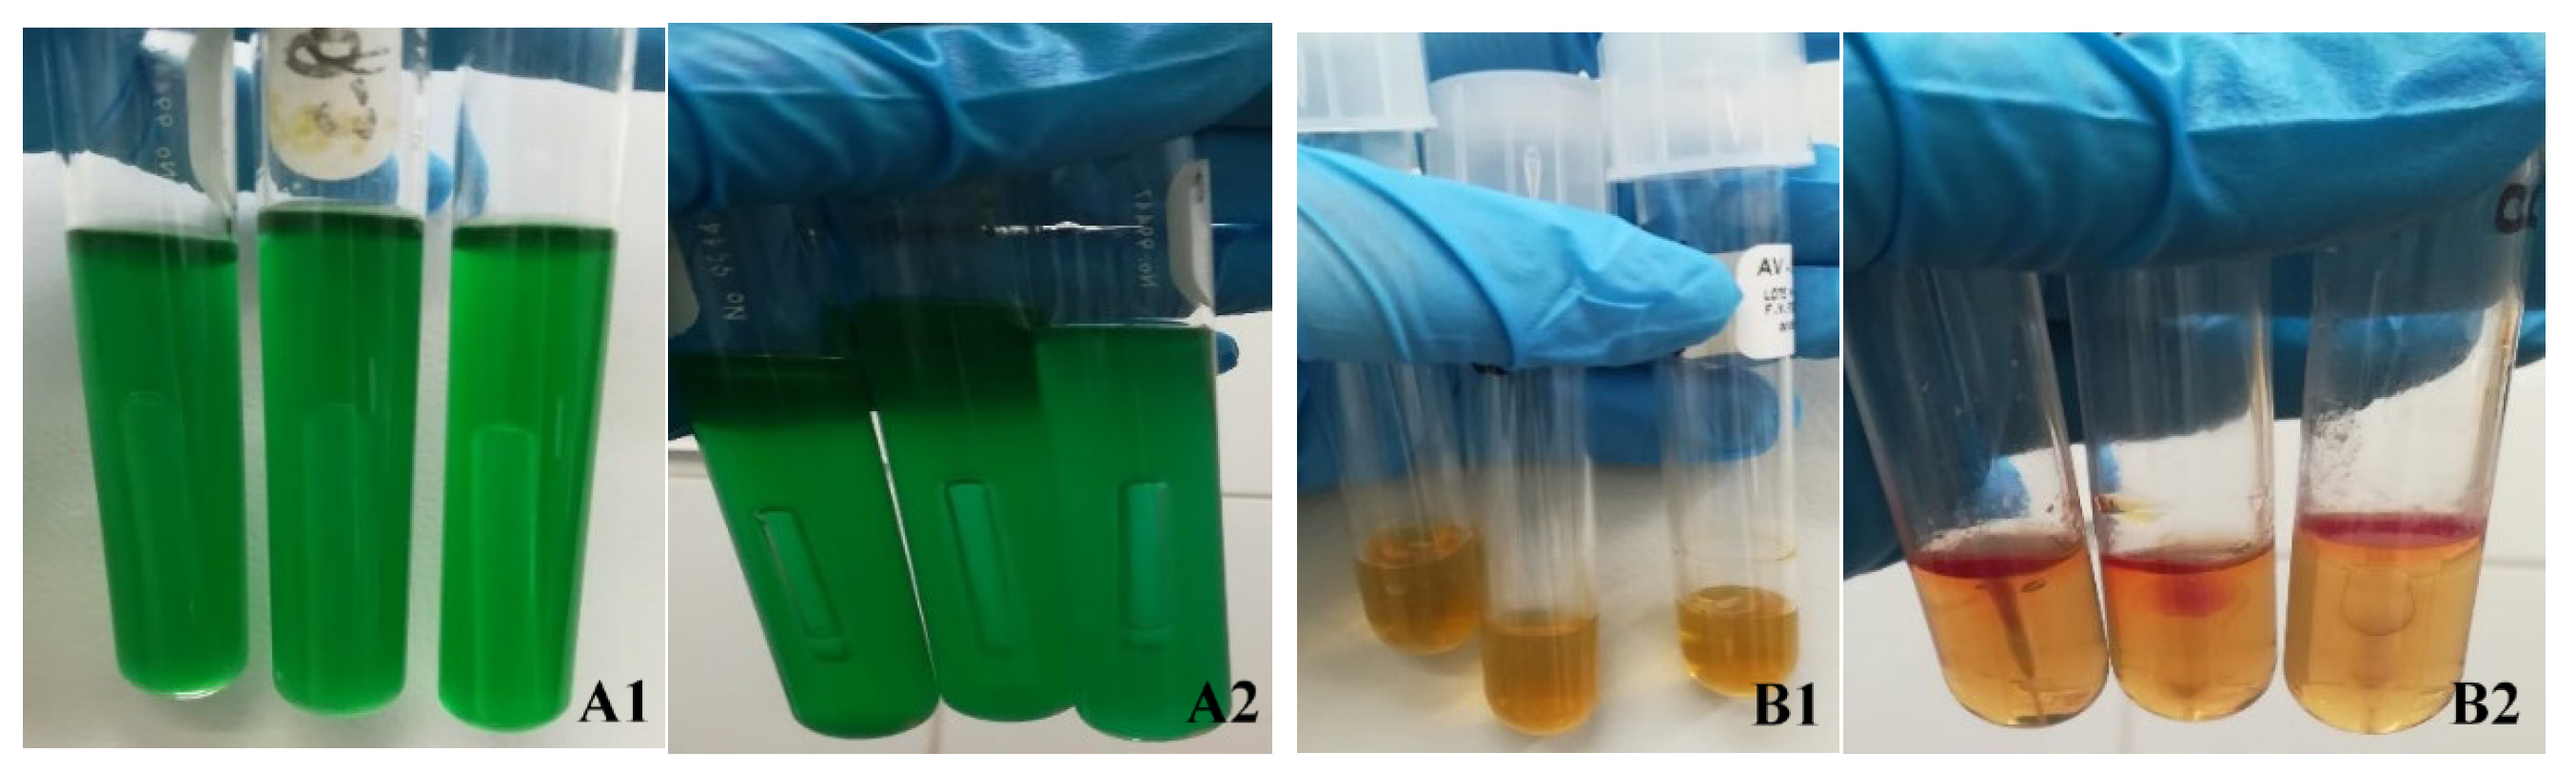
The results of microbiological tests of meat samples artificially contaminated with E. coli O157:H7 were as follows:
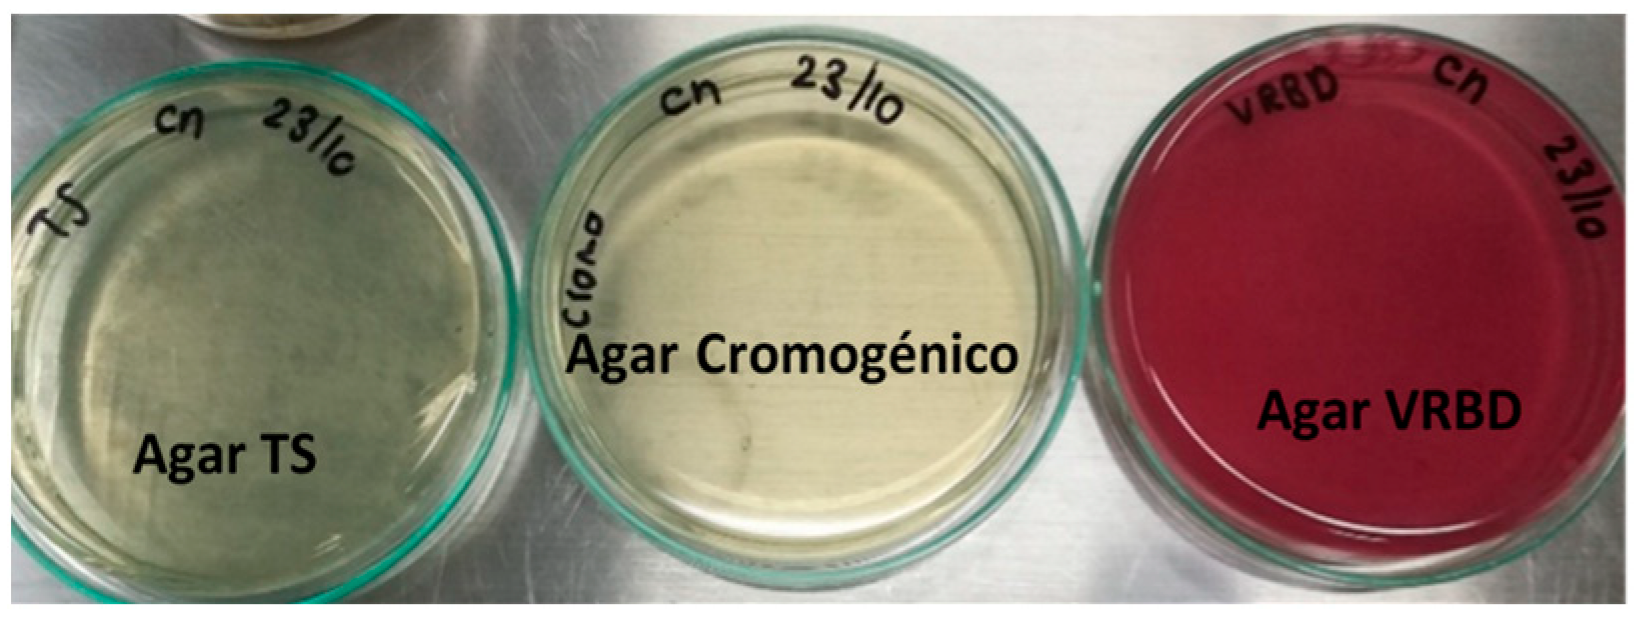
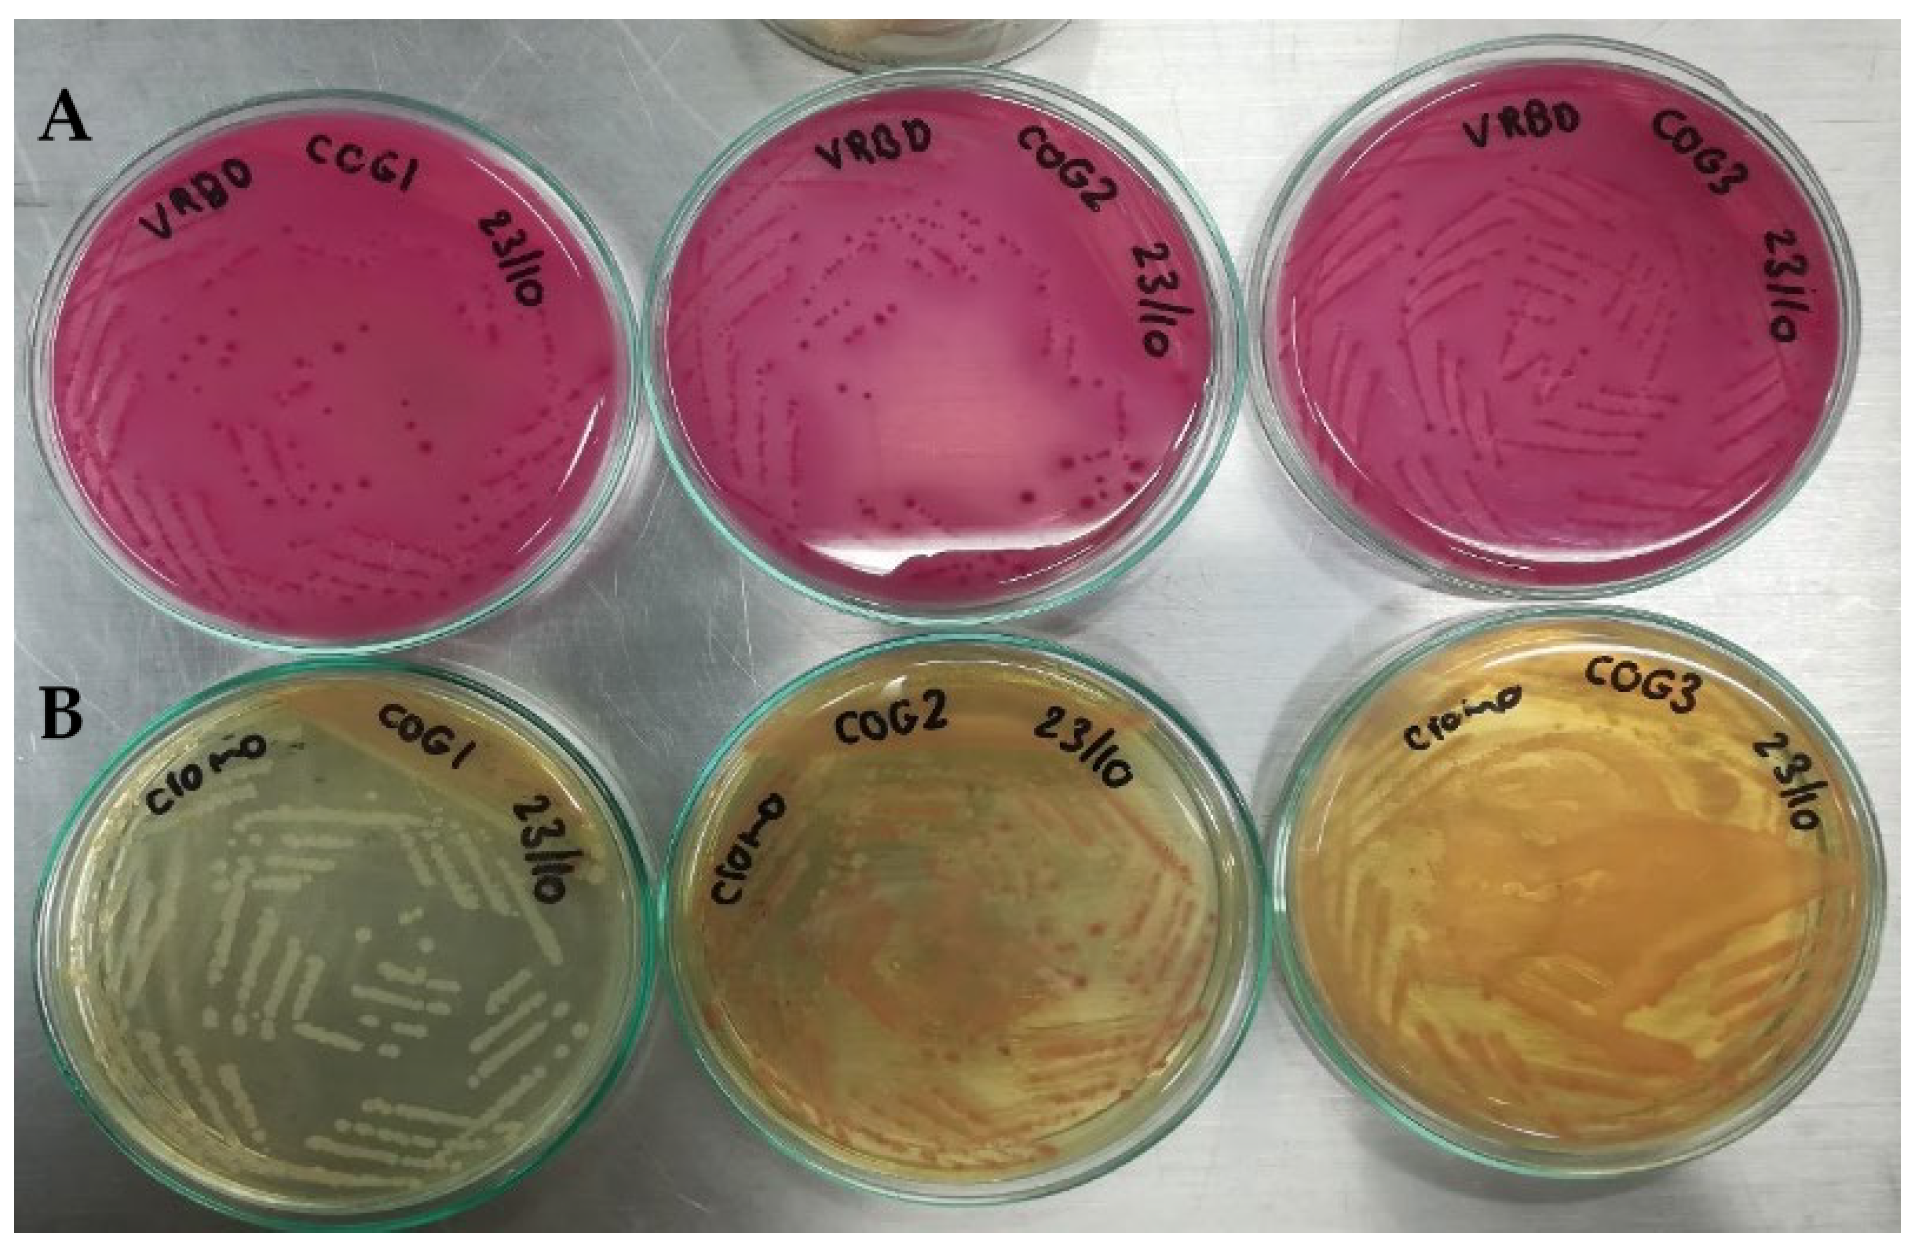
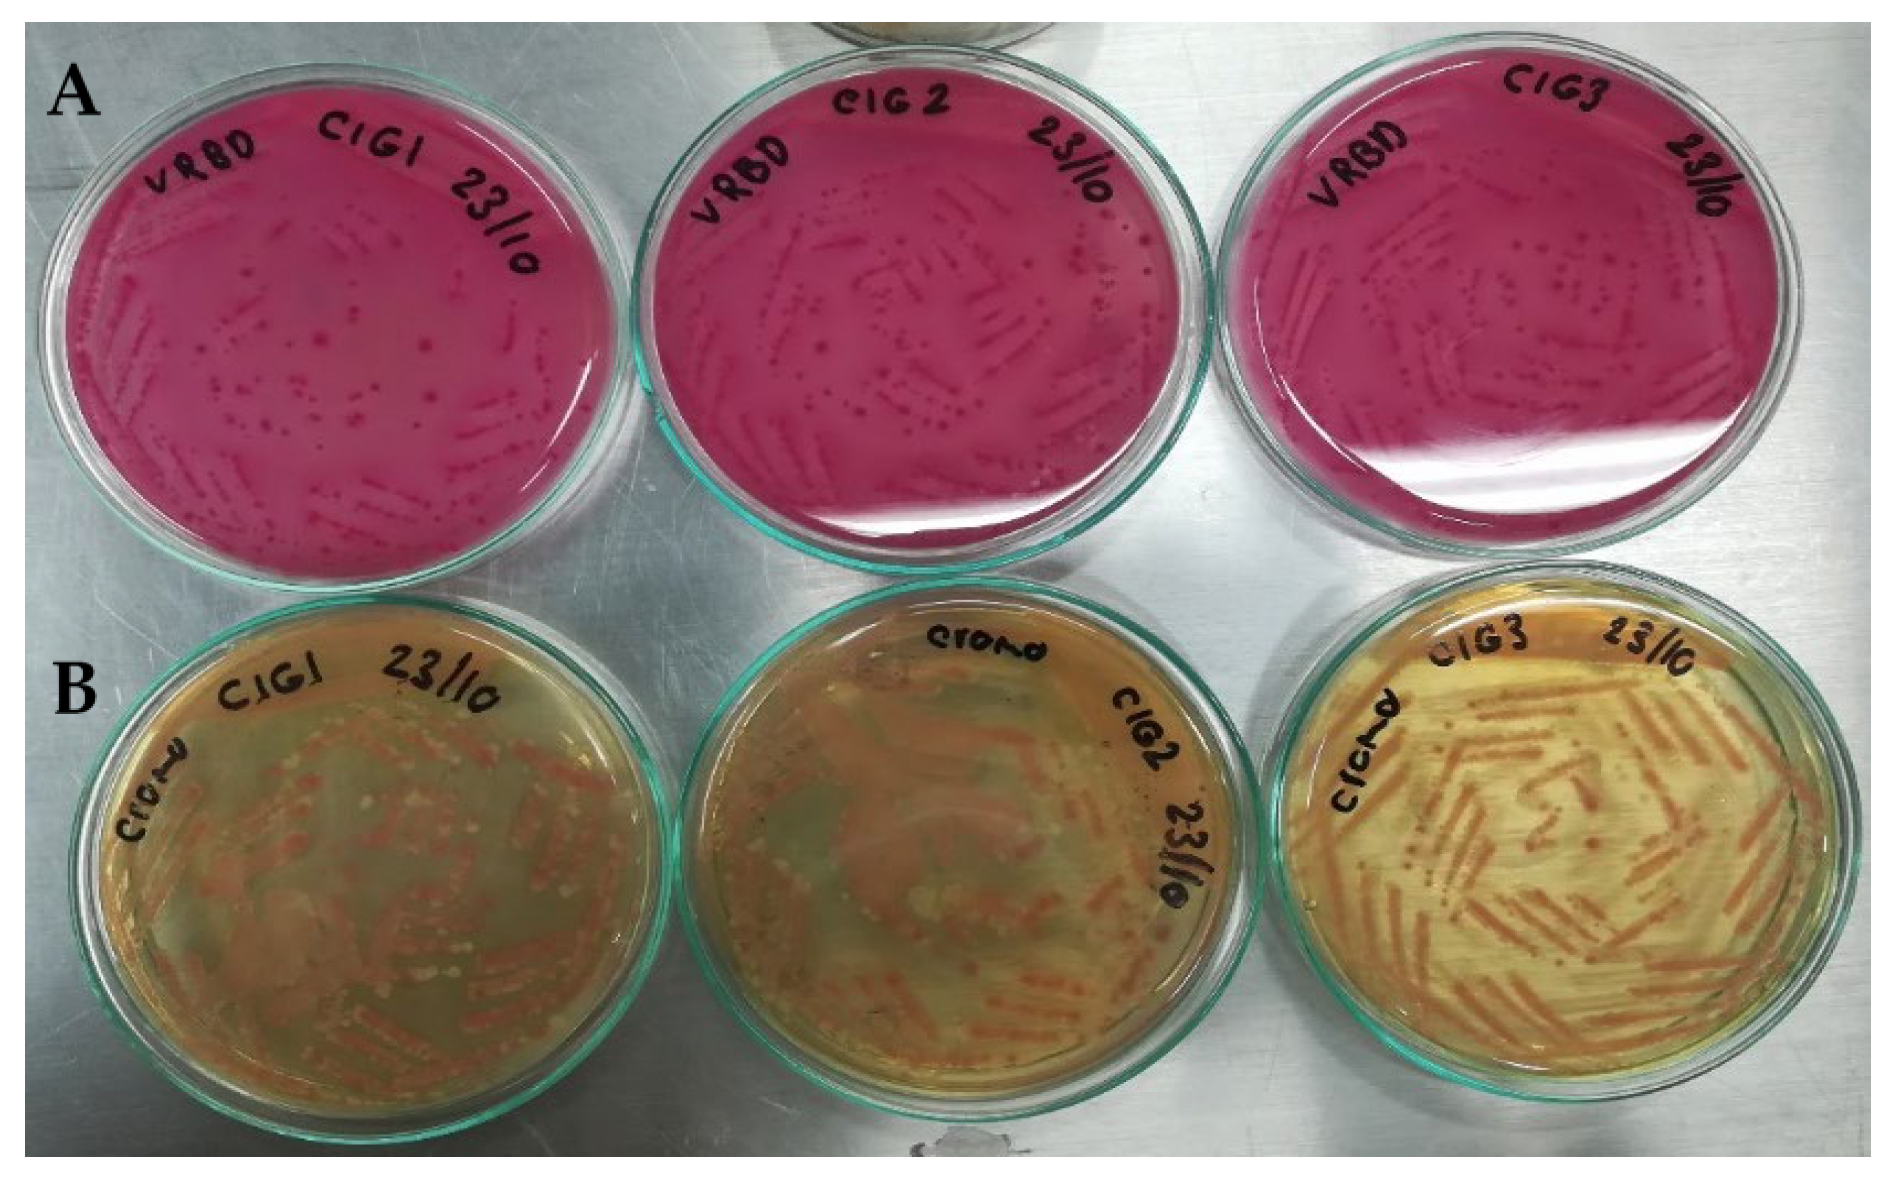
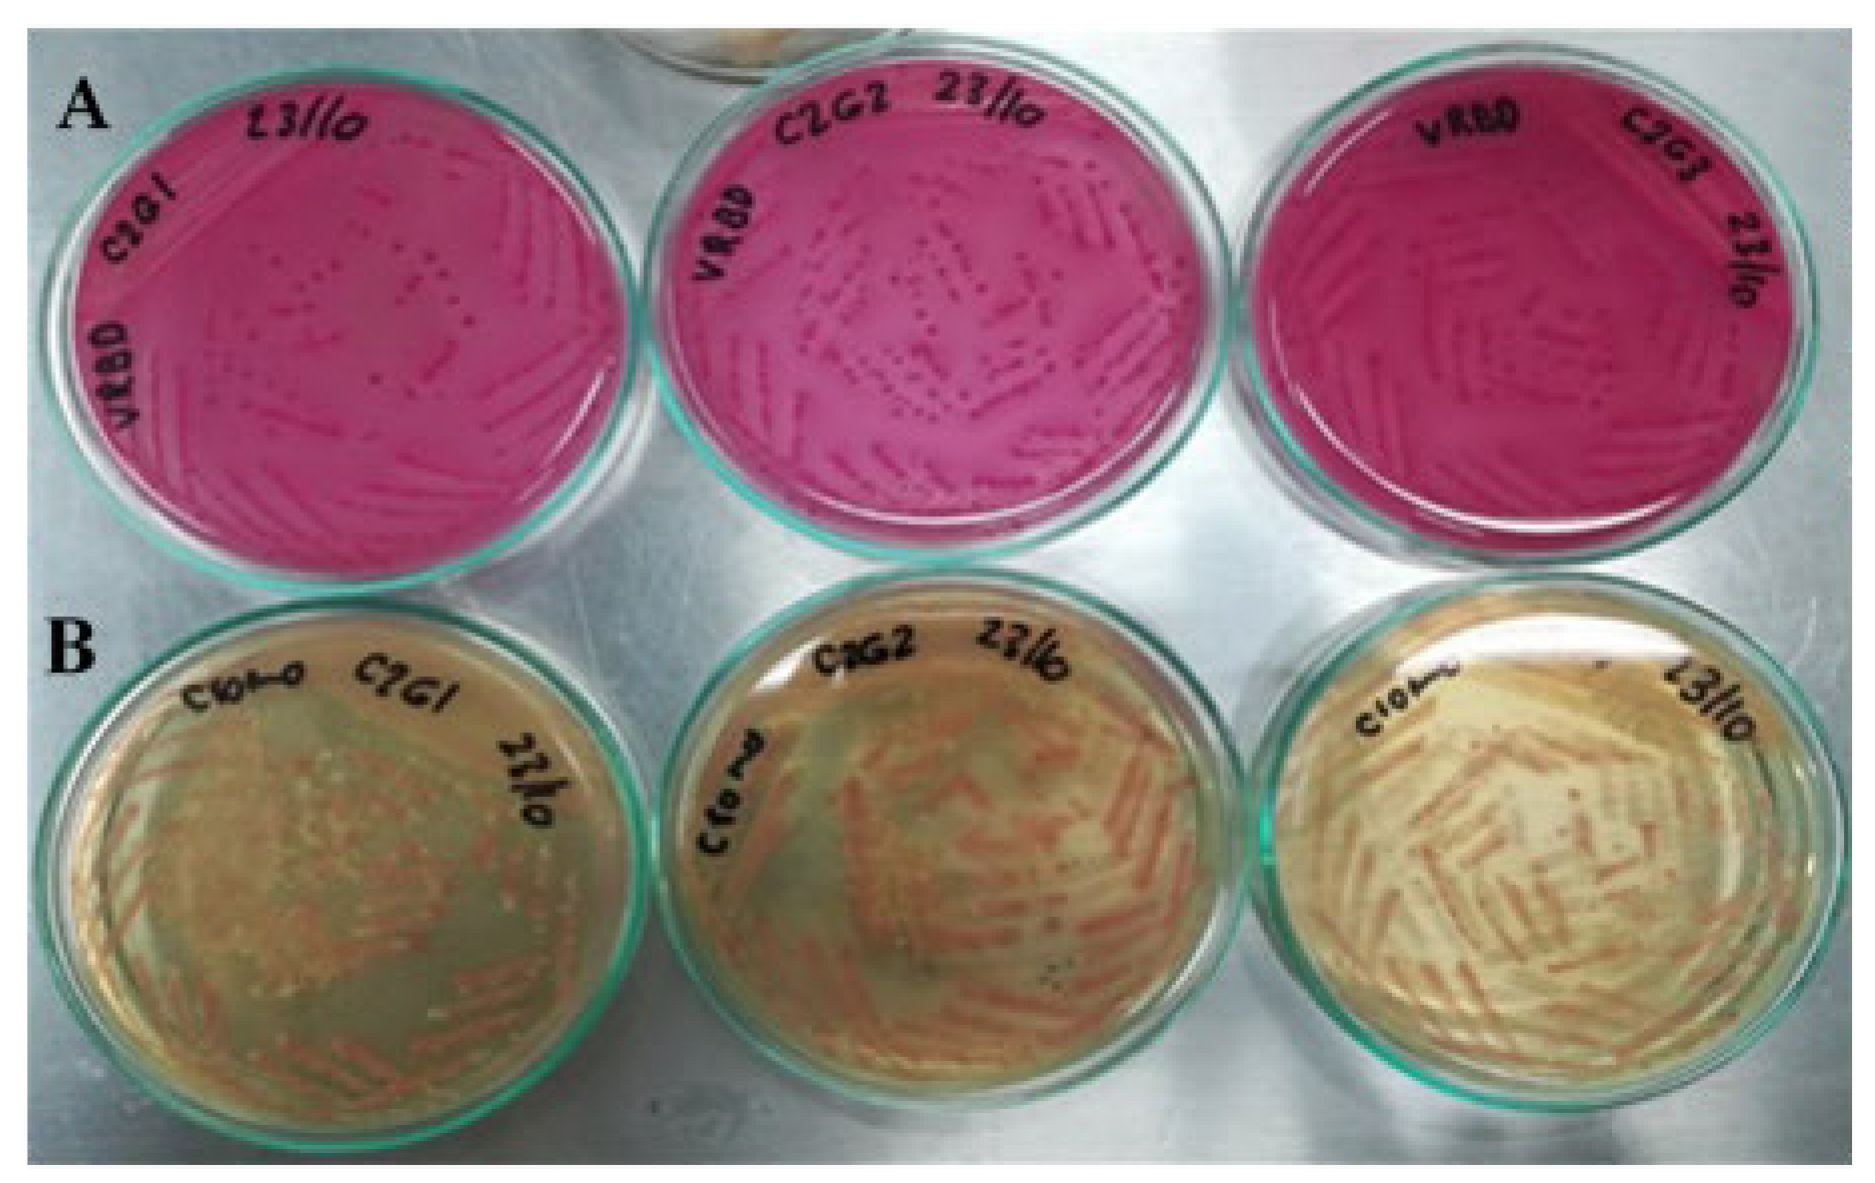
Chromogenic Colinstant Agar. Salmon pink colonies are the result of the enzymatic activities positive for β-galactosidase and negative for β-glucuronidase. For meat contaminated with commensal E. coli, blue colonies were observed, indicative of positive activities for the two enzymes.
BRILA broth. Lactose positive and bubble production (CO2).
SIM medium. Test positive for indole and motility; there was no formation of ferrous sulfide.
VRBD agar. Lactose positive, medium red. This test was contrasted with that of Chromogenic Colinstant Agar.
Using the VITEK
® 2 system, 47 biochemical reactions were analyzed for each of the samples used in the 11 treatments of each designed block. The correlation with the correct detection of
E. coli O157 was between 97% and 99% (between very good and excellent). For the meat sample contaminated with commensal
E. coli, the agreement was 95% and considered good. In
Table 10, the biochemical results of the treatments of the three blocks are recorded.
The positive treatments (samples contaminated with
E. coli O157:H7) amplified as expected, corroborating the presence of the pathogen, while the negative control samples (i.e., non-STEC strain) did not give any signal (Ct) in the assays (
Figure 12). Therefore, the developed SYBR Green qPCR protocols responded adequately to the detection of enterohemorrhagic
E. coli O157:H7 in such a complex matrix as meat. The Cts results for the three blocks are summarized in
Table 11.
The completely randomized block design made it possible to analyze the variability of the SYBR Green qPCR tests during the detection of E. coli O157:H7, which was associated with three meat samples acquired from different batches and inoculated on different days: a residual value of 3.66 was obtained, indicating little propagation of experimental error, i.e., there was good inter-assay repeatability. It can be affirmed with 95% confidence that the set of treatments in the three blocks followed a normal distribution; according to the Shapiro–Wilk test (p = 0.05417), the null hypothesis (Ho: the data follow a normal distribution) is accepted, since the value of p > 0.05 shows that the data had a symmetrical tendency around the mean.
Although a slight variation of the Cts signals between blocks (inter-assay) was noted, when applying Levene’s test, a p-value = 0.0409 was obtained, which does not allow the hypothesis of homogeneity of variances between blocks to be rejected at a 0.01 significance level. Consequently, it can be stated that the qPCRs developed correctly despite the complexity of the meat matrix, i.e., there was no interference or affectation in the detection of E. coli O157:H7.
4. Discussion
The SYBR Green qPCR protocols showed very low coefficients of variation for both detection and cut-off limits, and none exceeded 5% [
22]. Taking into account that the valid reference for biological processes is CV < 25%, a high sensitivity of the developed procedures is demonstrated, especially for the
stx1 gene, with a CV of 0.64% [
23]. Furthermore, in the dilution curve graphs of the bacterial DNA samples, the melting curves (
Figure 1) confirm the amplifications of the target gene regions without interferents.
Detection values were not taken as cut-off points since their reliability and repeatability are lower than 95%. This means that a signal detected below the cut-off point does not imply the absence of the target (
E. coli O157:H7, in this study), but it cannot be included within a quantification curve due to the variability of its results [
23,
24].
The best efficiency was for the O157 primers, but their R
2 was the lowest (0.96), which could be explained by the shorter amplicon length. However, this result is within the range between 80% and 120%, which is considered acceptable for this type of amplification reaction [
18]. Therefore, for O157, as for the other primers, the R
2 close to the unity validated the reliability of the readings with which the presence of
E. coli O157:H7 was identified through its DNA; therefore, it can be assured that each amplification reaction was duplicated in each cycle, without interference from possible inhibitors of the amplification process nor pipetting errors that could affect the veracity of the results of STEC O157 detection in a specific matrix [
18].
By comparing the range of acceptability of the three sequences of the primers O157, stx1, and stx2 and taking into account the extremely low detection limits (of the order of pg), with respect to other similar investigations, such as that carried out by Kagkli et al. [
25], it could be inferred that the qPCR procedures applied to detect STEC O157:H7 “meet the strict criteria set for PCR methods in other fields” [
25]. These researchers obtained % E (efficiency) between 80% and 95%, using TaqMan probes to detect
stx1 and
stx2, as well as
eae and
rfbE strains with which a more specific detection of the genes of interest is possible, in relation to the SYBR Green staining intercalating agent. However, the results of the qPCR protocols with SYBR Green are comparable and could, therefore, be recommended for application in the food field.
The selectivity tests of the qPCRs (inclusivity and exclusivity) confirmed the specificity of the reactions because they did not present cross-reactions, nor were there any interferents in their development. The validated qPCRs could be recommended, as the authors of these study would, as very promising methods of detection and quantification by relating the results of the present research with others, where SYBR Green qPCR protocols were also validated for the detection of
stx1 and
stx2 genes, with values of inclusivity and exclusivity of 100%, like those of Brusa et al. [
26] when applied to beef and Kagkli et al. [
25], who reported their results on minced meat, salads, and pasteurized milk. Taminiau et al. [
27] validated a qPCR using Taqman probes, indicating a specificity of 100%, to detect six very common and harmful pathogens in seafood, including enterohemorrhagic
E. coli. The cited publications contrast the ability of SYBR Green qPCR to detect STEC strains, including
E. coli O157:H7, with certainty.
It is important to note that the robustness parameter, in reference to other works such as Brusa [
26,
27,
28], included an additional variation and the evaluation of two kits with the four protocols of this research, which produced satisfactory results. The inclusion of one more variant in the protocols confirms the robustness of the SYBR Green qPCR in detecting STEC serogroup O157 in general and
E. coli O157:H7 in particular.
SYBR Green qPCRs applied to a food matrix represent a challenge due to the number of different organisms that may be present. Brusa et al. [
28] determined up to 1 CFU mL
−1 with SYBR Green qPCR for
stx genes in artificially contaminated meat, and Kagkli et al. [
25] achieved detection of up to 2 CFU mL
−1 [
26]; Garrido-Maestu et al. [
29] detected 3.9 CFU/25 g of ground beef, based on the amplification of the
rfbE gene. In the present research, a minimum experimental detection of 4 CFU mL
−1 (raw ground beef) was achieved, for which validated procedures are also recommended to detect STEC O157 rapidly and with high certainty in a meat matrix, taking into account the fact that the minimum amount for a person to develop a severe clinical picture is from 0.3 CFU mL
−1 to 15 CFU mL
−1 [
30,
31].
As suggested by Broeders et al. [
16], SYBR Green qPCR results are influenced by the microbiological and biochemical nature and by the heterogeneity of the matrices (DNA concentration of the inoculum), which can become possible inhibitors of the reaction. For these reasons, the results of this research were analyzed statistically, and it was possible to verify that under the conditions in which the tests were carried out, the correct detection of
E. coli O157 was made through the analysis of its three most virulent genes,
rfbE,
stx1, and
stx2, with no statistically significant effect of the meat matrix. With these protocols, it was possible to discriminate between the target DNA and the prevalence of a diversity of species specific to the food.
It is important to bear in mind that the positive results for the genes analyzed in this research work were attributed to the
E. coli O157:H7 strain because the absence of the genes analyzed in the meat samples was verified before contaminating them with this bacterium. However, STEC other than O157 can also carry the
stx1 or
stx2 genes, and even a
Shigella bacterium can carry the
stx1 gene. For this reason, the application of the developed protocols would allow the detection and quantification, but in addition to that, the identification of the bacteria requires its confirmation by isolation methods, as explained by Brusa et al. and Costa et al. [
32,
33] and other researchers, who also recommend the combination of several isolation methods to attain a greater certainty of the STEC serogroups.


 ,
, 


