
The Importance of Skeletal Muscle Oxygenation Kinetics for Repeated Wingate-Based Sprint Performance


Abstract
1. Introduction
2. Methods
2.1. Data Analysis
2.2. Statistical Analysis
3. Results
3.1. Lower Body Wingate Power
3.2. Lower Body Wingate Speed
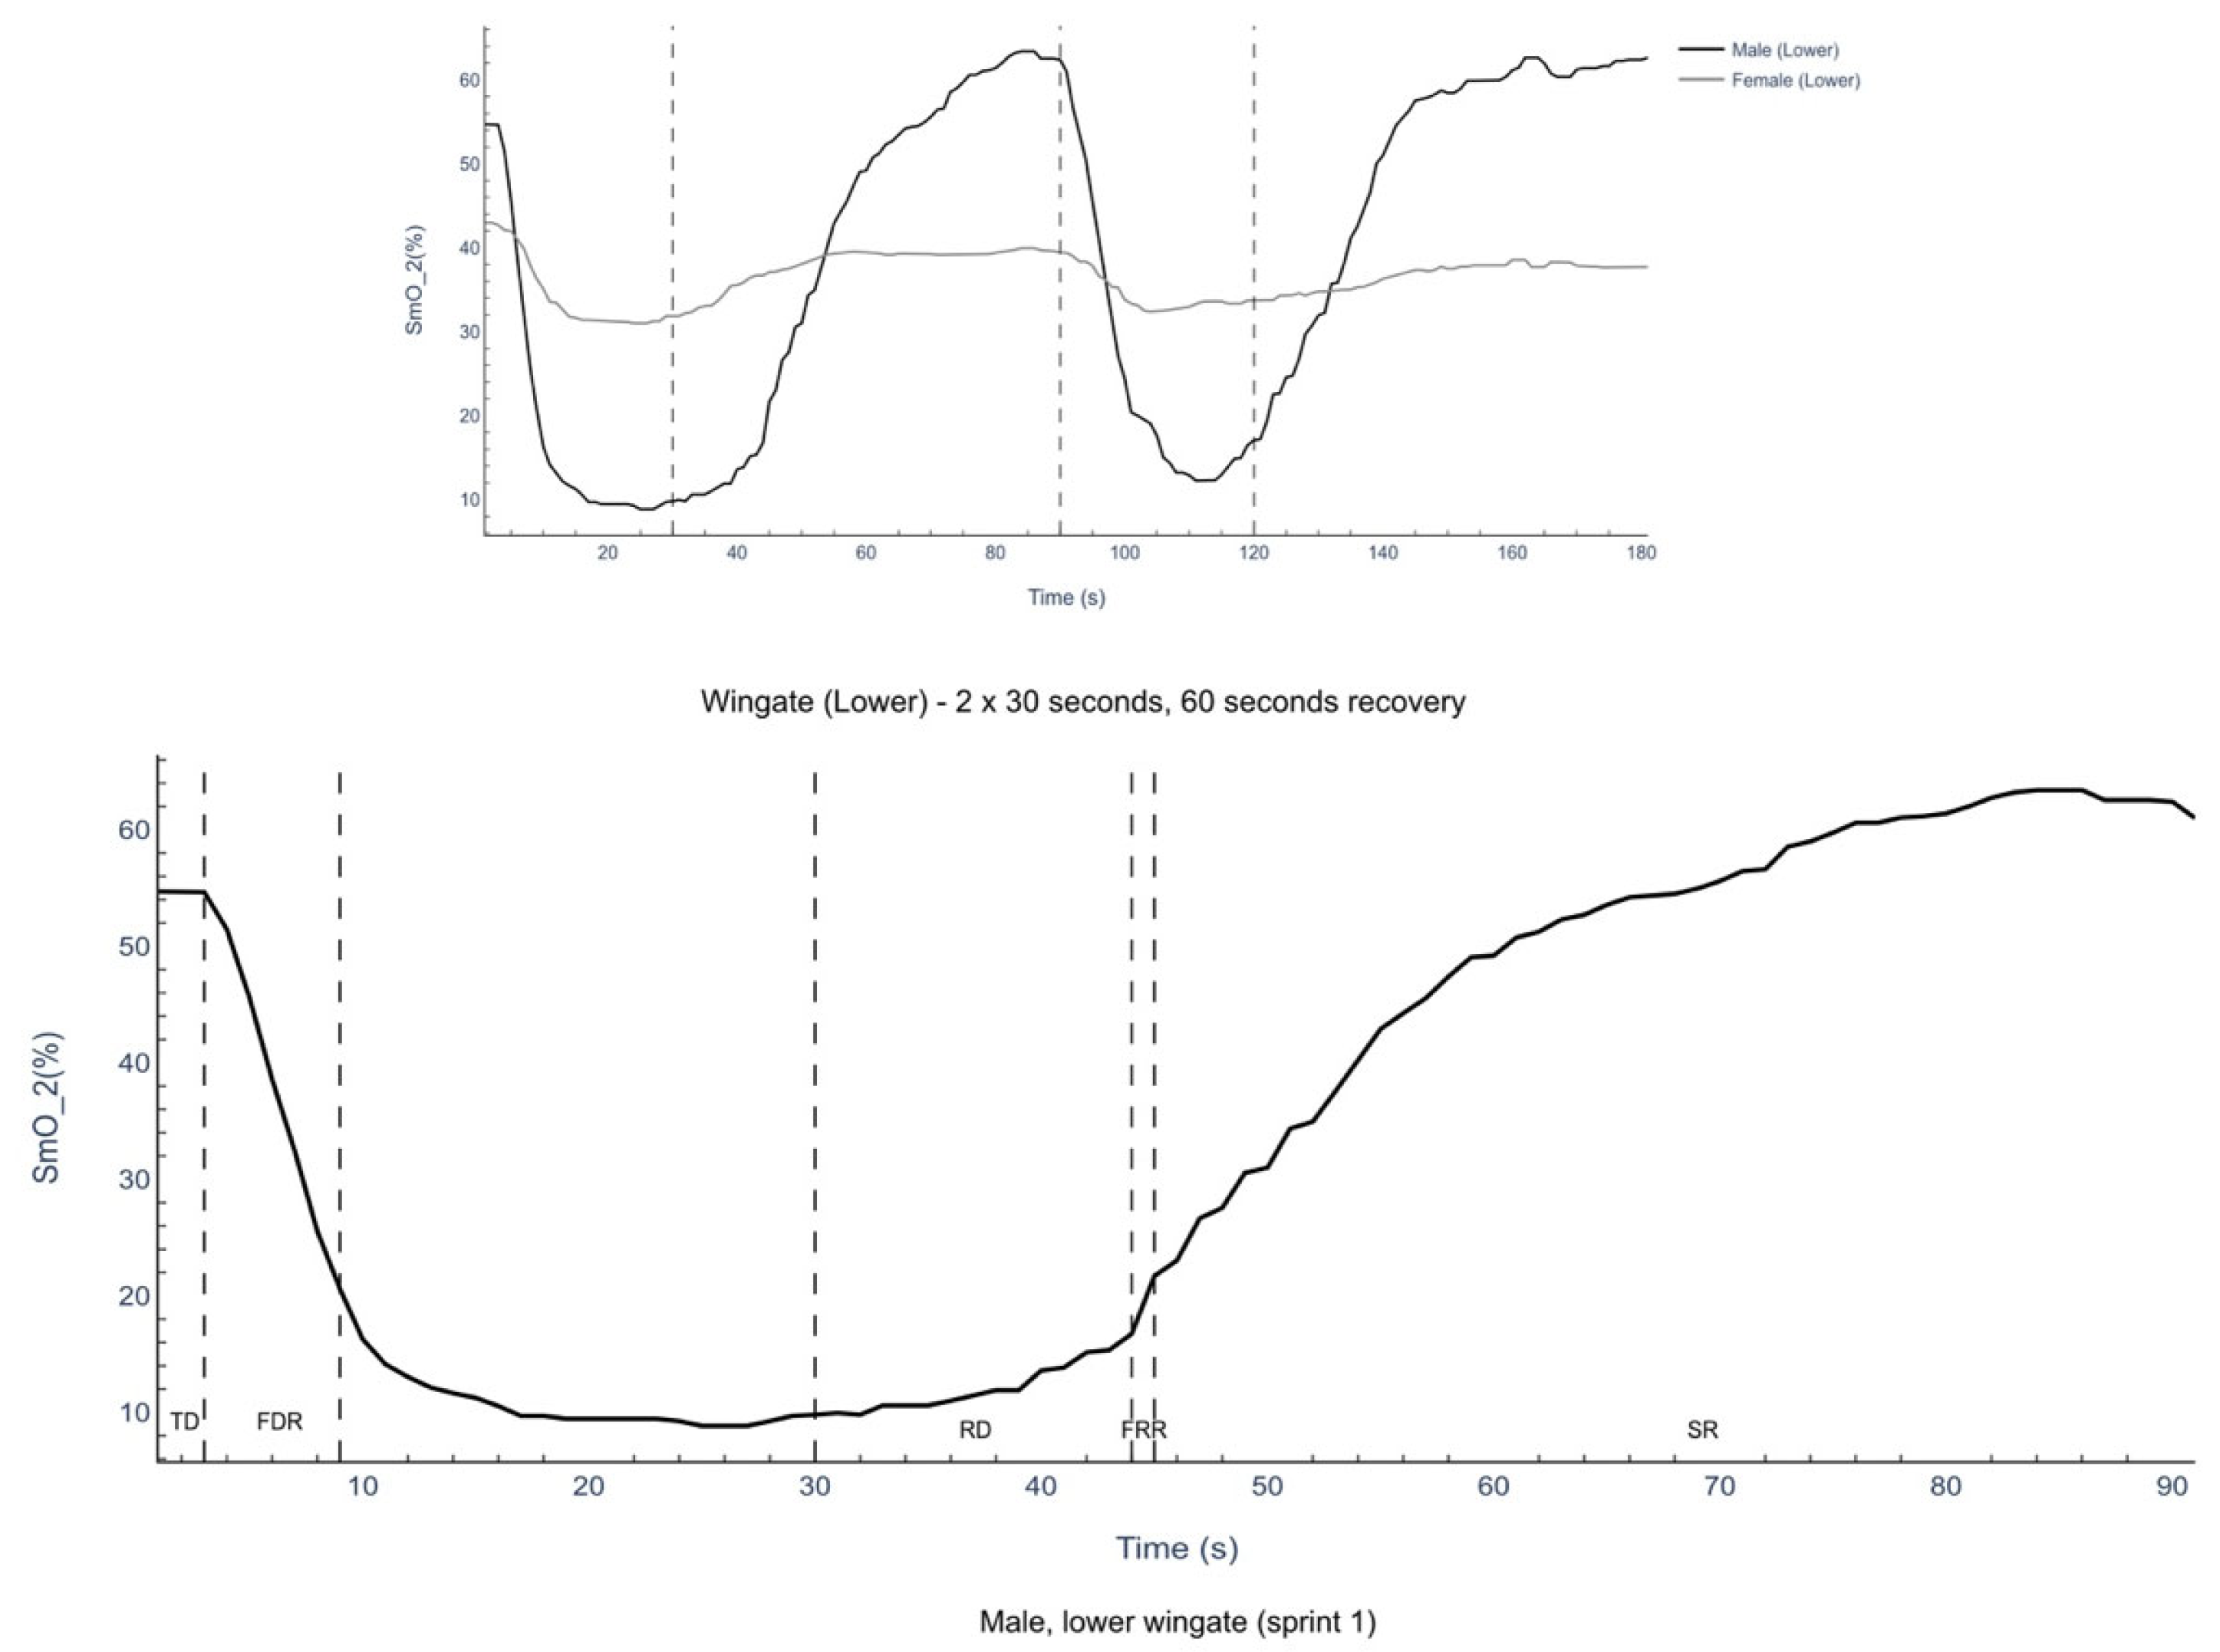
3.3. Rectus Femoris Muscle Oxygenation
3.4. Multivariate Correlative Analysis
4. Discussion
4.1. Power
4.2. Speed
4.3. Oxygenation
5. Limitations
6. Perspective
Author Contributions
Funding
Institutional Review Board Statement
Informed Consent Statement
Data Availability Statement
Conflicts of Interest
Abbreviations
| NIRS | near infrared spectroscopy |
| TD | time delay |
| FDR | fast desaturation rate |
| SS | steady state |
| RD | resaturation delay |
| FRR | fast resaturation rate |
| SR | slow recovery |
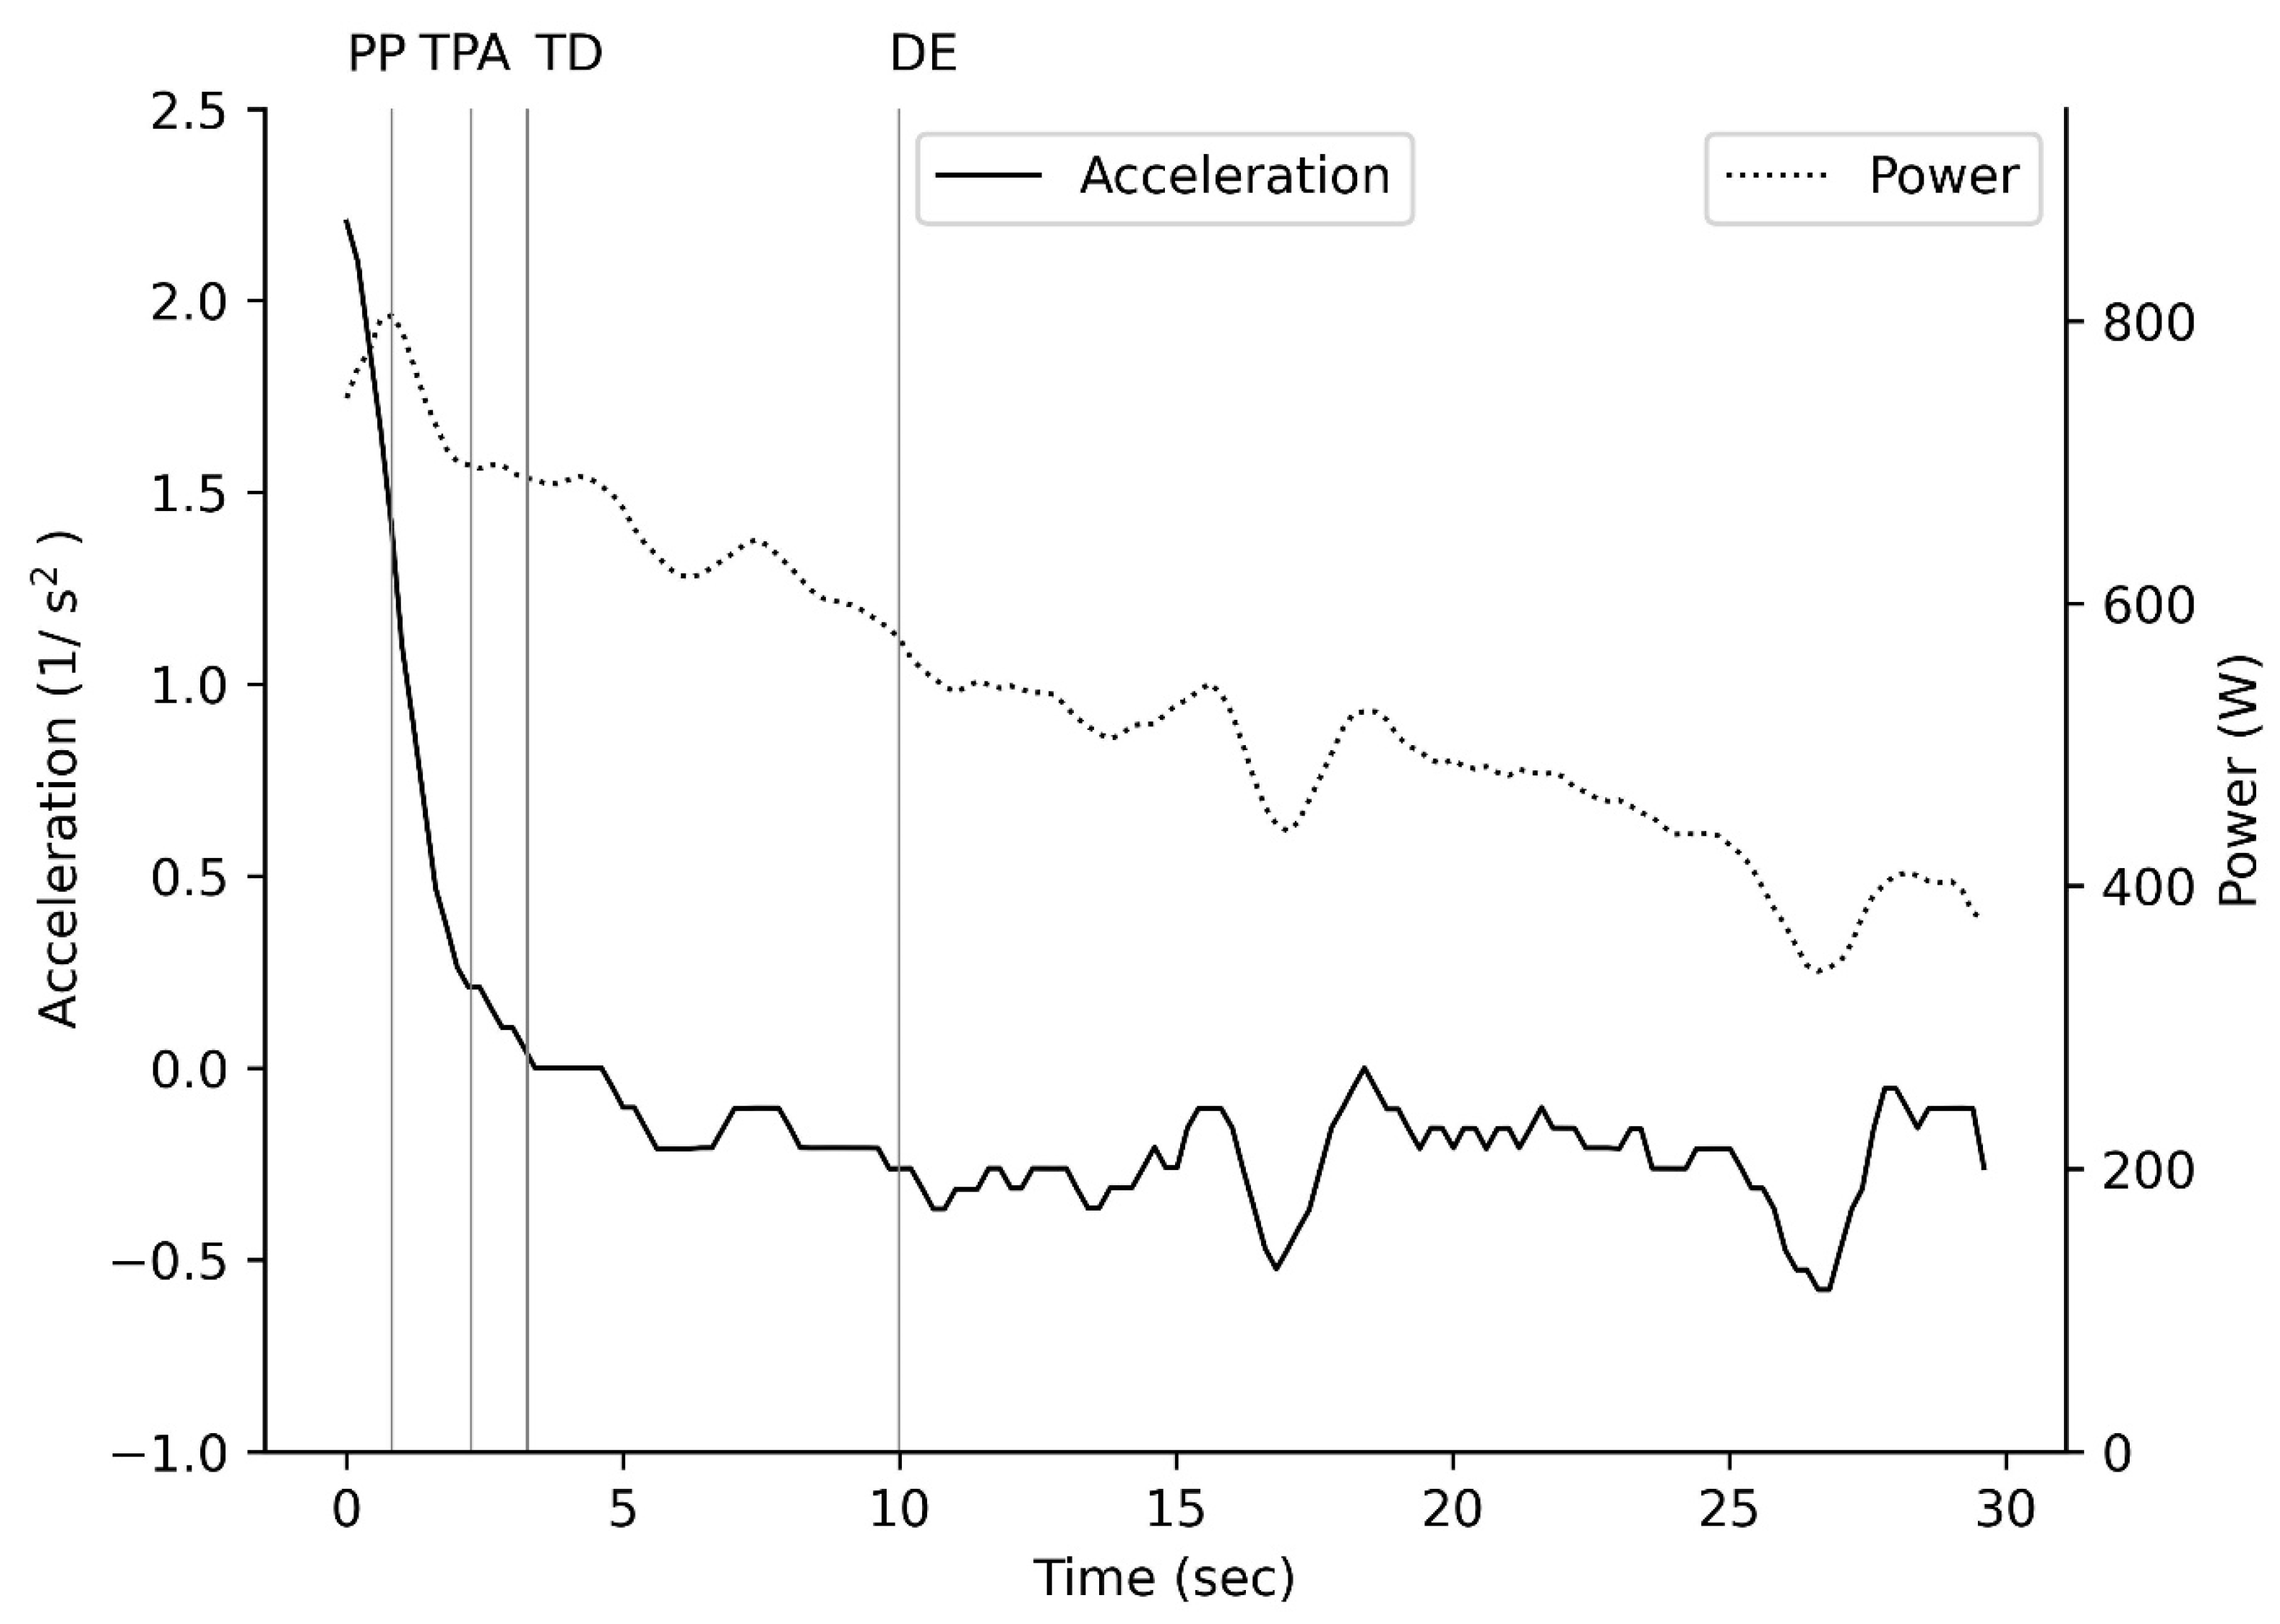
| PP | peak power |
| TPA | time of positive acceleration, |
| TD | time delay |
| DE | end fast desaturation |
| TPA | time of positive acceleration |
| TMS | time to maximum speed |
| TSL | time to speed loss |
| DE | end fast desaturation |
| PP | peak power |
| AP | average power |
| MinP | Min Power |
| DD | desaturation delay |
| TD | time delay |
| FRR | fast resaturation rate |
| DD | desaturation delay |
| AM | maximum acceleration |
| SmO2 | muscle oxygen saturation |
| ADP | Adenosine diphosphate |
References
- Slimani, M.; Chaabène, H.; Davis, P.; Franchini, E.; Cheour, F.; Chamari, K. Performance aspects and physiological responses in male amateur boxing competitions: A brief review. J. Strength Cond. Res. 2017, 31, 1132–1141. [Google Scholar] [CrossRef] [PubMed]
- Dunn, E.C.; Humberstone, C.E.; Franchini, E.; Iredale, K.F.; Blazevich, A.J. Relationships between punch impact force and upper-and lower-body muscular strength and power in highly trained amateur boxers. J. Strength Cond. Res. 2022, 36, 1019–1025. [Google Scholar] [CrossRef] [PubMed]
- Lenetsky, S.; Brughelli, M.; Nates, R.J.; Neville, J.; Cross, M.R.; Lormier, A.V. Defining the Phases of Boxing Punches: A Mixed-Method Approach. J. Strength Cond. Res. 2020, 34, 1040–1051. [Google Scholar] [CrossRef]
- Usher, A.; Babraj, J. Use of NIRS to explore skeletal muscle oxygenation during different training sessions in professional boxing. Eur. J. Appl. Physiol. 2023, 124, 595–606. [Google Scholar] [CrossRef]
- Ghosh, A.K.; Goswami, A.; Ahuja, A. Heart rate & blood lactate response in amateur competitive boxing. Indian J. Med. Res. 1995, 2, 179–183. [Google Scholar]
- Davis, P.; Leithäuser, R.M.; Beneke, R. The energetics of semicontact 3 × 2-min amateur boxing. Int. J. Sports Physiol. performance 2014, 9, 233–239. [Google Scholar] [CrossRef] [PubMed]
- Bar-Or, O. The Wingate Anaerobic Test An Update on Methodology, Reliability and Validity. Sports Med. Int. J. Appl. Med. Sci. Sport. Exerc. 1987, 4, 381–394. [Google Scholar] [CrossRef]
- Smith, J.C.; Hill, D.W. Contribution of energy systems during a Wingate power test. Br. J. Sports Med. 1991, 25, 196–199. [Google Scholar] [CrossRef]
- Chaabène, H.; Tabben, M.; Mkaouer, B.; Franchini, E.; Negra, Y.; Hammami, M.; Amara, S.; Chaabène, R.B.; Hachana, Y. Amateur Boxing: Physical and Physiological Attributes. Sports Med. 2015, 45, 337–352. [Google Scholar] [CrossRef]
- Domaszewska, K.; Szewczyk, P.; Kryściak, J.; Michalak, E.; Podgórski, T. Purine metabolism in the light of aerobic and anaerobic capcity of females boxers -The pilot study. Cent. Eur. J. Sport Sci. Med. 2020, 30, 97–106. [Google Scholar] [CrossRef]
- Hübner-Woźniak, E.; Kosmol, A.; Błachnio, D. Anaerobic capacity of upper and lower limbs muscles in combat sports contestants. J. Combat. Sports Martial Arts 2011, 2, 91–94. [Google Scholar] [CrossRef]
- Durkalec–Michalski, K.; Zawieja, E.E.; Zawieja, B.E.; Michałowska, P.; Podgórski, T. The gender dependent influence of sodium bicarbonate supplementation on anaerobic power and specific performance in female and male wrestlers. Sci. Rep. 2020, 10, 1878. [Google Scholar] [CrossRef]
- Kujach, S.; Ziemann, E.; Grzywacz, T.; Luszczyk, M.; Smaruj, M.; Dzedzej, A.; Laskowski, R. Muscle oxygenation in response to high intensity interval exercises among high trained judokas. Isokinet. Exerc. Sci. 2016, 24, 263–275. [Google Scholar] [CrossRef]
- Robergs, R.A.; Kennedy, D.; Gibson, A.L.; Zuhl, M.; Hsu, H.S.; Beam, J.; Salgado, R.M.; White, A.C.; Majumdar, A.; Lawson, S.; et al. Evidence for the invalidity of the Wingate test for the assessment of peak power, power decrement and muscular fatigue. Cent. Eur. J. Sport Sci. Med. 2015, 10, 63–78. [Google Scholar]
- Driss, T.; Vandewalle, H. The measurement of maximal (Anaerobic) power output on a cycle ergometer: A critical review. BioMed Res. Int. 2013, 2013, 589361. [Google Scholar] [CrossRef]
- Nagasawa, T. Slower recovery rate of muscle oxygenation after sprint exercise in long-distance runners compared with that in sprinters and healthy controls. J. Strength Cond. Res. 2013, 27, 3360–3366. [Google Scholar] [CrossRef]
- Kounalakis, S.N.; Nassis, G.P.; Koskolou, M.D.; Geladas, N.D. The role of active muscle mass on exercise-induced cardiovascular drift. J Sports Sci Med. 2008, 7, 395–401. [Google Scholar]
- Dunst, A.; Manunzio, C.; Feldmann, A.; Hesse, C. Applications of near-infrared spectroscopy in “anaerobic” diagnostics—SmO 2 kinetics reflect PCr dephosphorylation and correlate with maximal lactate accumulation and maximal pedalling rate. Biol. Sport 2023, 40, 1019–1031. [Google Scholar] [CrossRef]
- Dupont, G.; Moalla, W.; Matran, R.; Berthoin, S. Effect of short recovery intensities on the performance during two Wingate tests. Med. Sci. Sports Exerc. 2007, 39, 1170–1176. [Google Scholar] [CrossRef]
- Mattu, A.T.; Iannetta, D.; MacInnis, M.J.; Doyle-Baker, P.K.; Murias, J.M. Menstrual and oral contraceptive cycle phases do not affect submaximal and maximal exercise responses. Scand. J. Med. Sci. Sports 2020, 30, 472–484. [Google Scholar] [CrossRef]
- Buchheit, M.; Abbiss, C.R.; Peiffer, J.J.; Laursen, P.B. Performance and physiological responses during a sprint interval training session: Relationships with muscle oxygenation and pulmonary oxygen uptake kinetics. Eur. J. Appl. Physiol. 2012, 112, 767–779. [Google Scholar] [CrossRef]
- Rhea, M.R. Determining the magnitude of treatment effects in strength training research through the use of the effect size. J. Strength Cond. Res. 2004, 18, 918–920. [Google Scholar]
- Ozan, M.; Buzdagli, Y.; Eyipinar, C.D.; Baygutalp, N.K.; Yüce, N.; Oget, F.; Kan, E.; Baygutalp, F. Does Single or Combined Caffeine and Taurine Supplementation Improve Athletic and Cognitive Performance without Affecting Fatigue Level in Elite Boxers? A Double-Blind, Placebo-Controlled Study. Nutrients 2022, 14, 4399. [Google Scholar] [CrossRef]
- Gratas-Delamarche, A.; Le Cam, R.; Delamarche, P.; Monnier, M.; Koubi, H. Lactate and catecholamine responses in male and female sprinters during a Wingate test. Eur. J. Appl. Physiol. Occup. Physiol. 1994, 68, 362–366. [Google Scholar] [CrossRef]
- Richmond, S.R.; Whitman, S.A.; Acree, L.; Olson, B.D.; Carper, M.J.; Godard, M.P. Power output in trained male and female cyclists during the wingate test with increasing flywheel resistance. J. Exerc. Physiol. Online 2011, 14, 46–53. [Google Scholar]
- Janot, J.M.; Beltz, N.M.; Dalleck, L.D. Multiple off-ice performance variables predict onice skating performance in male and female division III ice hockey players. J. Sports Sci. Med. 2015, 14, 522–529. [Google Scholar]
- Billaut, F.; Giacomoni, M.; Falgairette, G. Maximal intermittent cycling exercise: Effects of recovery duration and gender. J. Appl. Physiol. 2003, 95, 1632–1637. [Google Scholar] [CrossRef]
- Mageean, A.L.; Alexander, R.P.; Mier, C.M. Repeated Sprint Performance in Male and Female College Athletes Matched for VO2max Relative to Fat Free Mass. Int. J. Exerc. Sci. 2011, 4, 229–237. Available online: http://www.ncbi.nlm.nih.gov/pubmed/27182366%0Ahttp://www.pubmedcentral.nih.gov/articlerender.fcgi?artid=PMC4738917 (accessed on 1 March 2025). [CrossRef]
- Tomlin, D.L.; Wenger, H.A. The relationship between aerobic fitness and recovery from high intensity intermittent exercise. Sports Med. 2001, 31, 1–11. [Google Scholar] [CrossRef]
- Giovanna, M.; Solsona, R.; Sanchez, A.M.J.; Borrani, F. Effects of short-term repeated sprint training in hypoxia or with blood flow restriction on response to exercise. J. Physiol. Anthropol. 2022, 41, 32. [Google Scholar] [CrossRef]
- Lunn, W.R.; Zenoni, M.A.; Crandall, I.H.; Dress, A.E.; Berglund, M.L. Lower Wingate Test Power Outcomes from “All-Out” Pretest Pedaling Cadence Compared with Moderate Cadence. J. Strength Cond. Res. 2015, 29, 2367–2373. Available online: https://journals.lww.com/nsca-jscr/fulltext/2015/08000/lower_wingate_test_power_outcomes_from__all_out_.36.aspx (accessed on 23 March 2025). [CrossRef]
- MacIntosh, B.R.; Neptune, R.R.; Horton, J.F. Cadence, power, and muscle activation in cycle ergometry. Med. Sci. Sports Exerc. 2000, 32, 1281–1287. [Google Scholar] [CrossRef]
- Price, M.; Beckford, C.; Dorricott, A.; Hill, C.; Kershaw, M.; Singh, M.; Thornton, I. Oxygen uptake during upper body and lower body wingate anaerobic tests. Appl. Physiol. Nutr. Metab. 2014, 39, 1345–1351. [Google Scholar] [CrossRef]
- Pérez, C.S.; Sanchez-Jimenez, J.L.; Marzano-Felisatti, J.M.; Encarnación-Martínez, A.; Salvador-Palmer, R.; Priego-Quesada, J.I. Reliability of threshold determination using portable muscle oxygenation monitors during exercise testing: A systematic review and meta—Analysis. Sci. Rep. 2023, 13, 12649. [Google Scholar] [CrossRef]
- Bae, S.Y.; Hamaoka, T.; Katsumara, T.; Shiga, T.; Ohno, H.; Haga, S. Comparison of muscle oxygen consumption measured by near infrared continuous wave spectroscopy during supramaximal and intermittent pedalling exercise. Int. J. Sports Med. 2000, 21, 168–174. [Google Scholar] [CrossRef]
- Samils, L.; Henricson, J.; Strömberg, T.; Fredriksson, I.; Iredahl, F. Workload and sex effects in comprehensive assessment of cutaneous microcirculation. Microvasc. Res. 2023, 148, 104547. [Google Scholar] [CrossRef]
- Lewis, M.T.; Blain, G.M.; Hart, C.R.; Layec, G.; Rossman, M.J.; Park, S.-Y.; Trinity, J.D.; Gifford, J.R.; Sidhu, S.K.; Weavil, J.C.; et al. Acute high-intensity exercise and skeletal muscle mitochondrial respiratory function: Role of metabolic perturbation. Am. J. Physiol.—Regul. Integr. Comp. Physiol. 2021, 321, R687–R698. [Google Scholar] [CrossRef]
- Bogdanis, G.C.; Nevill, M.E.; Boobis, L.H.; Lakomy, H.K. Contribution of phosphocreatine and aerobic metabolism to energy supply during repeated sprint exercise. J. Appl. Physiol. 1996, 80, 876–884. [Google Scholar] [CrossRef]
- Jacob, C.; Zouhal, H.; Vincent, S.; Gratas-Delamarche, A.; Berthon, P.M.; Bentué-Ferrer, D.; Delamarche, P. Training status (endurance or sprint) and catecholamine response to the Wingate-test in women. Int. J. Sports Med. 2002, 23, 342–347. [Google Scholar] [CrossRef]
- Lunn, W.R.; Axtell, R.S. Validity and Reliability of the Lode Excalibur Sport Cycle Ergometer for the Wingate Anaerobic Test. J. Strength Cond. Res. 2021, 35, 2894–2901. [Google Scholar] [CrossRef]
- Vasquez-Bonilla, A.A.; Tomas-Carus, P.; Brazo-Sayavera, J.; Malta, J.; Folgado, H.; Olcina, G. Muscle oxygenation is associated with bilateral strength asymmetry during isokinetic testing in sport teams. Sci. Sports 2023, 38, 426.e1–426.e9. [Google Scholar] [CrossRef]
- Reinpõld, K.; Rannama, I. Oxygen uptake and bilaterally measured vastus lateralis muscle oxygen desaturation kinetics in well-trained endurance cyclists. J. Funct. Morphol. Kinesiol. 2023, 8, 64. [Google Scholar] [CrossRef] [PubMed]


| Hedges G Effect Size (95% CIs) | ||||||||
|---|---|---|---|---|---|---|---|---|
| Male | Female | Male | Female | Sprint 1 | Sprint 2 | |||
| Sprint 1 | Sprint 2 | Sprint 1 | Sprint 2 | S1 vs. S2 | S1 vs. S2 | M vs. F | M vs. F | |
| PP (W·kg−1) | 12.5 ± 1.5 ⴕ | 9.6 ± 1.0 ⴕ* | 9.7 ± 1.2 | 7.1 ± 0.6 * | 2.1 (1.0:3.2) | 2.5 (1.0:4.0) | 1.9 (0.7:3.1) | 2.6 (1.3:4.0) |
| AP (W·kg−1) | 8.7 ± 0.6 ⴕ | 6.7 ± 0.6 ⴕ* | 6.1 ± 1.0 | 4.8 ± 0.4 * | 3.2 (1.9:4.5) | 1.9 (0.5:3.2) | 2.8 (1.4:4.2) | 3.5 (1.9:5.1) |
| MinP (W·kg−1) | 5.2 ± 1.9 | 4.2 ± 1.2 * | 4.6 ± 0.8 | 3.4 ± 0.7 * | 0.6 (−0.3:1.6) | 1.5 (0.2:2.7) | 0.4 (−0.7:1.4) | 0.7 (−0.3:1.8) |
| PP (W·kg.ffm−1) | 14.3 ± 2.1 | 10.9 ± 1.1 ⴕ* | 12.6 ± 1.3 | 9.3 ± 0.9 * | 1.9 (0.9:3.0) | 2.6 (1.1:4.2) | 0.9 (−0.2:1.9) | 1.4 (0.3:2.6) |
| AP (W·kg.ffm−1) | 9.9 ± 1.1 ⴕ | 7.6 ± 0.9 ⴕ* | 8.3 ± 1.1 | 6.3 ± 0.4 * | 2.3 (1.1:3.4) | 2.2 (0.8:3.6) | 1.4 (0.3:2.5) | 1.6 (0.5:2.9) |
| MinP (W·kg.ffm−1) | 6.5 ± 2.0 | 5.1 ± 1.2 * | 6.0 ± 0.9 | 4.4 ± 0.9 * | 0.8 (−0.1:1.7) | 1.6 (0.3:2.8) | 0.3 (−0.7:1.3) | 0.5 (−0.5:1.5) |
| Time to PP (s) | 1.3 ± 0.6 | 3.2 ± 3.7 | 1.0 ± 0.2 | 1.7 ± 1.5 | −0.7 (−1.6:0.3) | −0.6 (−1.8:0.5) | 0.6 (−0.4:1.7) | 0.4 (−0.6:1.5) |
| Time positive acceleration (s) | 2.5 ± 1.0 | 2.6 ± 0.9 | 2.3 ± 0.4 | 2.5 ± 1.1 | −0.1 (−1.0:0.8) | −0.2 (−1.4:0.9) | 0.3 (−0.8:1.26) | 0.1 (−0.9:1.1) |
| Max speed (rpm) | 136 ± 9 | 112 ± 9 * | 135 ± 10 | 123 ± 16 | 2.5 (1.3:3.7) | 0.8 (−0.4:2.0) | 0.1 (−0.9:1.1) | −0.9 (−1.9:0.2) |
| Average speed (rpm) | 116 ± 7 ⴕ | 89 ± 7 ⴕ* | 93 ± 14 | 74 ± 7 * | 3.7 (2.2:5.1) | 1.6 (0.3:2.9) | 2.2 (0.9:3.4) | 2.1 (0.8:3.3) |
| Time to max speed (s) | 3.6 ± 1.2 ⴕ | 3.1 ± 1.6 ⴕ | 1.3 ± 0.3 | 1.1 ± 0.4 | 0.3 (−0.5:1.2) | 0.6 (−0.6:1.7) | 2.3 (1.0:3.6) | 1.4 (0.3:2.6) |
| Time to speed loss (s) | 6.0 ± 1.5 ⴕ | 4.4 ± 1.9 ⴕ* | 2.5 ± 0.3 | 2.3 ± 0.3 | 0.9 (−0.1:1.8) | 0.6 (−0.6:1.8) | 2.7 (1.3:4.0) | 1.3 (0.2:2.4) |
| Time spent at max speed (s) | 2.4 ± 0.9 ⴕ | 1.3 ± 0.5 * | 1.2 ± 0.2 | 1.2 ± 0.2 | 1.4 (0.4:2.4) | −0.1 (−1.2:1.0) | 1.5 (0.4:2.6) | 0.1 (−0.9:1.0) |
| Hedges G Effect Size (95% CI’s) | ||||||||
|---|---|---|---|---|---|---|---|---|
| Male | Female | Male | Female | Sprint 1 | Sprint 2 | |||
| Sprint 1 | Sprint 2 | Sprint 1 | Sprint 2 | S1 vs. S2 | S1 vs. S2 | M vs. F | M vs. F | |
| Left Rec Fem | ||||||||
| TD (s) | 3.2 ± 2.2 | 3.3 ± 2.8 | 3.0 ± 2.5 | 3.0 ± 2.5 | −0.0 (−0.9:0.9) | −0.0 (−1.1:1.1) | 0.1 (−0.9:1.1) | 0.1 (−0.9:1.1) |
| FDR (%.s−1) | −5.6 ± 1.2 ⴕ | −4.2 ± 1.1 ⴕ* | −2.3 ± 1.9 | −1.5 ± 0.9 | −1.2 (−2.1: −0.2) | −0.5 (−1.6:0.7) | −2.0 (−3.2: −0.8) | −2.4 (−3.7: −1.1) |
| DD (s) | 6.1 ± 1.3 ⴕ | 7.3 ± 1.6 ⴕ* | 3.7 ± 2.8 | 4.5 ± 1.0 | −0.8 (−1.7:0.1) | −0.3 (−1.5:0.8) | 1.2 (0.1:2.3) | 1.9 (0.7:3.1) |
| Starting SmO2 (%) | 55.7 ± 10.3 | 60.0 ± 6.6 | 50.5 ± 23.3 | 48.0 ± 18.7 | −0.5 (−1.4:0.4) | 0.1 (−1.1:1.3) | 0.3 (−0.8:1.4) | 0.9 (−0.1:2.0) |
| SS SmO2 (%) | 17.7 ± 7.5 ⴕ* | 25.1 ± 8.0 | 39.0 ± 20.5 | 38.4 ± 14.9 | −0.9 (−1.9:0.0) | 0.0 (−1.2:1.2) | −1.5 (−2.8:−0.3) | −1.2 (−2.2:−0.1) |
| Recovery | ||||||||
| TD (s) | 11.0 ± 8.4 | 8.7 ± 6.0 | 14.7 ± 12.1 | 11.7 ± 3.2 | 0.3 (−0.6:1.2) | 0.3 (−0.8:1.5) | −0.4 (−1.4:0.8) | −0.5 (−1.6:0.3) |
| FRR (%.s−1) | 2.1 ± 1.0 | 2.6 ± 1.2 ⴕ | 1.4 ± 1.5 | 0.8 ± 0.6 | −0.4 (−1.3:0.5) | 0.5 (−0.7:1.6) | 0.6 (−0.4:1.6) | 1.6 (0.5:2.8) |
| RD (s) | 7.7 ± 2.5 | 6.2 ± 1.9 | 5.6 ± 2.9 | 6.6 ± 4.7 | 0.7 (−0.2:1.6) | −0.2 (−1.4:0.9) | 0.8 (−0.3:1.8) | −0.1 (−1.1:0.9) |
| Right Rec Fem | ||||||||
| TD (s) | 2.7 ± 1.5 | 2.7 ± 2.9 | 3.0 ± 3.4 | 4.2 ± 2.6 | −0.0 (−0.9:0.9) | −0.4 (−1.5:0.8) | −0.1 (−1.1:0.9) | −0.5 (−1.5:0.5) |
| FDR (%.s−1) | −5.5 ± 2.1 ⴕ | −4.5 ± 2.1 ⴕ* | −2.3 ± 1.8 | −2.2 ± 2.4 | −0.4 (−1.3:0.5) | −0.0 (−1.2:1.2) | −1.5 (−2.7:−0.3) | −1.0 (−2.1:0.1) |
| DD (s) | 6.2 ± 0.8 ⴕ | 6.6 ± 1.4 ⴕ | 3.2 ± 1.8 | 3.3 ± 2.2 | −0.3 (−1.2:0.5) | −0.0 (−1.1:1.1) | 2.2 (1.0:3.5) | 1.8 (0.6:3.0) |
| Starting SmO2 (%) | 55.3 ± 10.4 | 54.4 ± 7.4 | 53.2 ± 14.2 | 48.8 ± 13.9 | 0.1 (−0.8:1.0) | 0.3 (−0.9:1.4) | 0.1 (−0.9:1.1) | 0.4 (−0.6:1.5) |
| SS SmO2 (%) | 17.6 ± 10.0 ⴕ* | 22.8 ± 10.7 ⴕ | 38.2 ± 14.7 | 36.3 ± 10.9 | −0.4 (−1.3:0.5) | 0.1 (−1.0:1.3) | −1.7 (−2.9:−0.5) | −1.3 (−2.4:−0.2) |
| Recovery | ||||||||
| TD (s) | 10.4 ± 7.1 | 10.7 ± 5.4 | 12.4 ± 13.4 | 11.5 ± 6.0 | −0.1 (−0.9:0.8) | 0.1 (−1.2:1.3) | −0.2 (−1.3:0.9) | −0.1 (−1.2:0.9) |
| FRR (%.s−1) | 1.7 ± 0.8 | 2.0 ± 0.7 | 0.8 ± 0.7 | 1.5 ± 0.9 | −0.3 (−1.2:0.6) | −0.7 (−2.0:0.6) | 1.1 (−0.1:2.2) | 0.6 (−0.5:1.7) |
| RD (s) | 9.2 ± 4.1 ⴕ | 8.2 ± 5.0 | 4.8 ± 2.6 | 4.7 ± 3.0 | 0.2 (−0.7:1.1) | 0.0 (−1.2:1.3) | 1.1 (−0.0:2.3) | 0.7 (−0.4:1.8) |
Disclaimer/Publisher’s Note: The statements, opinions and data contained in all publications are solely those of the individual author(s) and contributor(s) and not of MDPI and/or the editor(s). MDPI and/or the editor(s) disclaim responsibility for any injury to people or property resulting from any ideas, methods, instructions or products referred to in the content. |
© 2025 by the authors. Licensee MDPI, Basel, Switzerland. This article is an open access article distributed under the terms and conditions of the Creative Commons Attribution (CC BY) license (https://creativecommons.org/licenses/by/4.0/).
Share and Cite
Usher, A.; Babraj, J. The Importance of Skeletal Muscle Oxygenation Kinetics for Repeated Wingate-Based Sprint Performance. Muscles 2025, 4, 18. https://doi.org/10.3390/muscles4020018
Usher A, Babraj J. The Importance of Skeletal Muscle Oxygenation Kinetics for Repeated Wingate-Based Sprint Performance. Muscles. 2025; 4(2):18. https://doi.org/10.3390/muscles4020018
Chicago/Turabian StyleUsher, Andrew, and John Babraj. 2025. "The Importance of Skeletal Muscle Oxygenation Kinetics for Repeated Wingate-Based Sprint Performance" Muscles 4, no. 2: 18. https://doi.org/10.3390/muscles4020018
APA StyleUsher, A., & Babraj, J. (2025). The Importance of Skeletal Muscle Oxygenation Kinetics for Repeated Wingate-Based Sprint Performance. Muscles, 4(2), 18. https://doi.org/10.3390/muscles4020018