Abstract
Nowadays, the methodology aiming to achieve carbon neutrality and net zero energy on a large scale is known. Despite this, few specialists are mastering this technology globally. What new scenarios. applied at the neighbourhood scale. generate a significant reduction in the rate of CO2 emissions and energy demand? In addition, a lack of massive, regular, and consistent data on carbon emissions and energy consumption has made it significantly difficult to understand the origins of climate change at the building and neighbourhood scales. This work has, as its main goal, the assessment of different strategies that facilitate reduction in the concentration of CO2 and lower energy demands at the district level. The life cycle assessment of a new district has been carried out over 100 years during the four stages of the life cycle of the neighbourhood (construction, operation, demolition and end of life). The results showed that up to 93% of greenhouse gas (GHG) was produced during the operational stage. The energy demand due to transport and waste management represented 60% of the total energy demand of the district during the operational stage. There is still a possibility to maintain air temperature growth around 1.5 °C in the next decade by means of the following: Global warming + 100% of heavy renovation of all buildings + 100% of electric car − renewable energy. This strategy would facilitate a reduction of over 92% of the CO2 produced at the district level.
1. Introduction
Continuous climate change has affected the whole world. Harmful and extreme climatic conditions, such as droughts, heat waves, heavy rains, floods and landslides, are becoming more and more frequent in the world. Other consequences of rapid climate change, these being sea level rise, ocean acidification and biodiversity loss, are observed. Limiting global warming to 1.5 degrees and achieving carbon neutrality by the middle of the 21st century is essential. This objective is also defined in the Paris agreement, signed by 195 countries, including the European Union [1]. In December 2019, the European Commission unveiled its European Green Deal, its flagship plan to make Europe climate neutral by 2050 [1]. This is to be achieved through the European Climate Act, which anchors climate neutrality in binding European Union legislation [1].
The European Green Deal aims to transform the EU into a modern, resource-efficient and competitive economy, ensuring an end to net greenhouse gas emissions by 2050, economic growth decoupled from the use of resources, and ensuring that no member state left behind [1]. In addition, the European Green Deal is also a guideline that emerged from the COVID-19 pandemic. A third of the € 1.8 trillion investment from the Next-Generation-EU recovery plan and the EU’s seven-year budget will finance the European Green Deal [1]. If the plan succeeds it would make Europe the first climate-neutral continent by 2050. A reduction of at least 55% in net greenhouse gas emissions is expected by 2030 compared to 1990; and 3 billion more trees are expected to have been planted in the EU by 2030.
While the roadmap of this study effort is focused on low-carbon districts, nearly-carbon, Zero Energy districts and Nearby Zero Energy districts were also included as keywords. Most academic studies have developed different kinds of methods to support decision-making on the environmental impact at the building scale [2,3,4]. These works examine different aspects of carbon emission and propose varied frameworks. For example, researchers have proposed frameworks for carbon accounting [5,6], decision support tools to advise building stakeholders on emission reduction [7,8] and, frameworks that guide decision-making on high-impact decarbonisation strategies [9,10].
According to the World Green Building Council report published in 2021 [11], the building sector accounts for approximately 40% of global energy consumption, contributing up to 40% of total global greenhouse gas emissions [12]. Due to the growing population, it is expected that energy demand could increase by up to 53% in the next decade which is likely to significantly increase emission concentration. Globally, emissions from the construction sector result from the energy expended during heating, cooling, lighting, ventilation, hot water supply, and air conditioning [13], as well as embodied energy sequestered in the building materials during manufacturing, construction, maintenance, repair, and demolition [14]. In 2022, Adel et al. [15] stated that, faced with the effects of climate change, several governments have developed various green building strategies to promote an early carbon peak and carbon neutrality in the building sector. Achieving carbon neutrality requires a comprehensive understanding of the effect of various key factors on carbon emissions.
Faced with the difficulties and disruptions in the global energy market caused by Russia’s invasion of Ukraine, the European Commission presented the Repower-EU plan. The Repower-EU plan aims to achieve energy savings. produce clean energy and diversify the sources of energy supply. It is based on financial and legal measures aimed at building the new energy infrastructures and systems that Europe needs. The increasing use of renewable resources for the production of electricity in buildings represents one of the key factors in reducing the emission rate. In 2022, Osman et al. [16] explained that the price of solar photovoltaic energy has decreased from 0.417 $/kWh in 2010 to 0.048 $/kWh by 2021. In addition, hydropower production and wind energy are expected to decrease up to 40% in some regions because of climate change, while solar energy appears to be the least impacted energy source [16]. They showed that hydroelectric power plants are the most damaging to the environment, and solar photovoltaics must be carefully installed to reduce their impact. Whereas, wind turbines and biomass power plants have a minimal environmental impact and, therefore, should be implemented extensively [16].
According to Sartori et al. [17], monitoring is necessary to effectively improve the implementation of the zero energy concept in a building. During the improvement of the energy performance of a residential building, the human and behavioural components of the occupants can lead to a significant difference between the planned and consumed energy, because the operation of the building can lead to unpredictable use of the building and the environmental operation of the heating, ventilation, and air conditioning (HVAC) [18]. Therefore, major scientific effort aims to show the importance of real measured data to identify and reduce the energy performance gap [19]. The presence of real data from measuring devices facilitates good assessment of the performance gap [20]. In 2013, Butera [21] explained that the transition from single and simple buildings to complex buildings facilitates the scaling up of zero energy performance, while overcoming the limitations of single buildings related to the use of the building, its size, and the availability and costs of on-site renewable energy. New research concludes that renewable energy, and particularly solar power, is an integral part of the zero energy concept and assesses relevant implications related to planning, design, and costs, and also the effects on networks [22,23,24].
Many countries (currently accounting for 73% of global greenhouse gas emissions) have committed to achieving carbon neutrality by 2050. In Belgium, the current federal government supports this objective. Since 2015, a broad participation process has been in place to identify citizens’ concerns and recommendations on Belgian climate policy. The government has created moments of dialogue allowing the actors in its territory to take a strategic place in this process. The Public Service of Wallonia (one part of Belgium), Walloon Air, and the Climate Agency presented their vision of the Walloon energy transition by 2030. This Plan, enriched by consultation in the sector, is positively voluntary and ambitious, particularly in the field of the energy performance of buildings. Wallonia is currently committed to a “Quasi Zero Energy” objective by 2025. It should, therefore, be able to then reach a “Zero energy” (ZEN) level, i.e., new buildings having very low energy needs and completely covered by renewable sources, mostly local. The Belgian Government is committed to making the renovation of buildings and energy efficiency a major regional priority.
Different methods can be used to draw up the environmental balance sheet of a building. Some methods use statistical models, others simulations. At the building level, the life cycle assessment (LCA) method is one of the validated scientific methods and is even standardised at the European level. This is currently the only scientifically sound approach for carrying out an environmental assessment at the scale of the building. It allows a quantitative study of buildings over the entire life cycle of the building. Most scientific studies on the subject use this method [25]. It is a method that has been increasingly used at the building level for the past 25 years. However, its application at the neighbourhood level is new [26]. Despite the novelty of the application of LCA at the neighbourhood scale, we consider it the most successful and the most likely to serve us for our present study. On the other hand, it is a challenge and an exciting research topic to test the application of the now highly accurate LCA method for buildings at the neighbourhood scale, especially because no other research, to our knowledge, has analysed many indicators.
Stephan et al. [27] demonstrated that energy consumption during the operational phase is the main contributor to environmental impacts over the complete life cycle of a district. Indeed, it accounts for nearly 40% of primary energy consumption (PEC) or for more than 42% of greenhouse gas emissions (GHG). However, at the neighbourhood scale, the use phase appears less predominant compared to the other phases. In addition, a study by Nichols and Kockelman [28], relating to the analysis of four districts, revealed that 53% of the PECs derived from construction, 45.5% of the PECs derived from mobility (operational consumption and embodied energy of infrastructures) and only 1% from other public infrastructure (water, wastewater and lighting). By comparing several urban developments of different densities, Norman et al. [29] concluded that mobility contributes much more significantly to the total energy consumed and to GHG emissions in the case of low-density urban development than in the case of dense development. Thus, the share of impacts due to buildings is relatively greater in the case of high density. On the other hand, comparing four scenarios, based on different types of residential buildings, Trigaux et al. [30], showed that the contribution of road infrastructures accounts for 1% to 6% of the total impact. When looking at studies of neighbourhoods with low energy consumption, without taking mobility into account, Herfray et al. [31], showed that, in terms of primary energy consumption, the construction phase accounted for 7% and 13.5%, the operational phase for 92% and 85% and the deconstruction phase for 1% and 1.5%, respectively. Once again, we note the predominance of the operational phase and the weak contributions of the construction and deconstruction phases. Herfray [31], emphasized the fact that architecture also strongly influences performance. With identical technical characteristics, the consumption simulated by the EQUER software varied from simple to triple between two buildings from the same district but in different blocks.
Thus, even if the heterogeneity of the studies does not allow the drawing of general conclusions, trends can be noticed.
All these studies were conducted in old buildings and old neighbourhoods. There is little research focused on environmental impact study cases from new neighbourhoods more suited to new climates. A high concentration of research carried out in these types of neighbourhoods would easily make it possible to propose a standard for all countries. Hence, this study is important.
A lack of massive, regular, and consistent data on carbon emissions and energy consumption has made it significantly difficult to understand the origins of climate change at the building and neighbourhood scales. This study was carried out to propose a roadmap for the new European Union districts to reach low emissions and low energy consumption in the future.
Firstly, a large experimental study was conducted in a neighbourhood to collect all the data necessary for modelling. Secondly, the neighbourhood was modelled, taking into account the data collected in the neighbourhood during the experimental study. Third, the life cycle assessment of the neighbourhood as it is (in its real state) was conducted. Fourth, some scenarios were applied and the different environmental impacts quantified. Finally, the different scenarios were combined to propose a strategy to reduce the concentration of carbon emissions and energy demand.
2. Methodology
2.1. District Selection
To carry out this research, a standard neighbourhood in Belgium was selected and some investigations conducted. The selected district is located in Liege city, located in the Wallonia region, and recognized as one of the largest cities in Belgium.
The new neighbourhood is located on the Sart-Tilman site, south of Liege. The site is well served by public transport links to the centre of Liege, due to the proximity of the university. The neighbourhood offers different types of buildings, apartment buildings and semi-detached single-family houses. Several functions are also offered. A majority of the built surface is dedicated to housing but we also found spaces dedicated to commercial functions or to liberal professions and small businesses. In all, we found 40 small apartments, 45 larger units, 11 single-family duplex homes and 6 additional functions (shops and businesses). Private parking spaces are provided near the buildings. The accommodation on the ground floor has a private garden. The neighbourhood meets almost all of the criteria of the efficient neighbourhood benchmark published by the University of Liege. More than 50% of the dwellings are adjoining and the site has a density of 40 dwellings/hectare. The outdoor spaces have been fitted out with more than 30% “green” or “blue” surfaces and there is separate water management for rainwater and wastewater (see Figure 1, showing a 3D view of the neighbourhood studied).
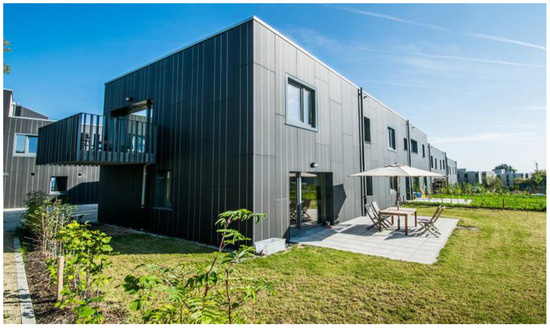
Figure 1.
New neighbourhood [11].
The choice of the functional unit is crucial in this study. Here, it was chosen to limit our study to the residential part of the neighbourhood studied. Systematically, the environmental impacts of the neighbourhood were calculated according to 2 functional units. The gross results correspond to the functional unit “residential eco-district of 3.5 ha comprising 1 ha of roads, driveways and car parks, 17,800 m2 of green spaces, 6580 m2 of built-up floor area, 13,160 m2 of floor space, housing approximately 220 people, studied on a lifespan of 100 years and located near Liege city in Belgium”. This neighbourhood was located in a suburb of the capital city of each country studied.
Some main technologies noticed in the efficient neighbourhood design are:
- (a)
- Compact buildings, well oriented, taking into account the direction of the sunrise and sunset.
- (b)
- Thermally insulated thick walls with air sealing.
- (c)
- Double glazing with high thermal performance, or triple glazing, limiting energy losses.
- (d)
- Solar shading solutions, high inertia materials for interior wall surfaces, and intensive night ventilation to naturally cool the building.
- (e)
- Ventilation systems, efficient both in terms of the air quality and in reducing energy consumption.
- (f)
- High-performance heating system associated with a smart thermostat system.
- (g)
- The use of photovoltaic solar panels for electricity production.
The main characteristics of the neighbourhood studied are shown in Table 1. As can be observed in Table 1, in the rural district, there were less occupants than in other districts. It was noticed that 40 buildings were available and occupied by only 30 people, so, some buildings were unoccupied.

Table 1.
Main reference characteristics of the main neighbourhood studied.
2.2. Modelling [32]
The modelling of our studied district started by entering a characteristic of the buildings as an input parameter. Here, we entered the geometric parameters of the buildings, and assigned to each of the walls its thermal properties. As soon as all the inputs had been established, we were able to launch the dynamic thermal simulation calculations.
(i) The first step in modelling was the input of various construction data. First, the default data concerning the walls, and thermal bridges of the buildings were defined. It was then possible to modify them element by element if necessary.
(ii) Building materials were indicated, with details of their characteristics.
(iii) For the coatings used, we used the standard values provided by the software.
(iv) Regarding the composition of doors and windows, the standard values provided by the software were used. The low-emission double-glazed windows and insulating doors were compatible with low-consumption standards.
(v) Thermal bridges were rare in the constructions studied. Indeed, being mainly passive buildings, the resolution of the constructive nodes was particularly careful. However, there were some unavoidable small losses.
After having written these data into the modeller interface of Pleiades, it was now time to draw our neighbourhood in three dimensions. For this, we relied on the plans and additional documents provided by the project architect. The modelling of the neighbourhood used in this study is shown in Figure 2.
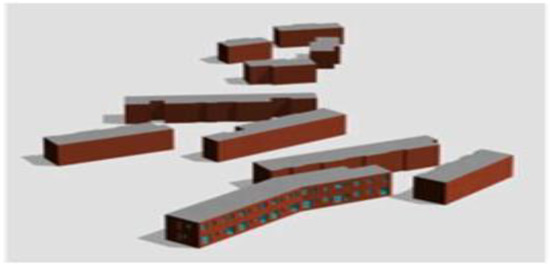
Figure 2.
Modelling of the neighbourhoods in the Pleiades LCA software.
Meteorological data were obtained with the most recent version of the American Meteonorm software. With this software, and knowing the geographic coordinates of this city, it was possible to connect to an American satellite and download the climatic data specific to this city. The data provided by the Meteonorm software were reliable and have already contributed to several valuable publications from researchers all over the world. The database of this tool contained more than 6200 cities and more than 8325 weather stations worldwide [33,34,35,36,37].
We fixed the daily mobility concentration of occupants at 80% at least. The settings were the following: distance of the weekly journey between the house and the shop, 1000 m; the distance from the public transport network, 500 m; distance from home to work, between 5000 m and 20,000 m. It was assumed that the trip was made 5 days per week and for 47 weeks per year. The principal means of public transport were tram, bus and metro. The activity of the occupant was considered to be standard in most cases. It was assumed that all the occupants were in good health. The yield of the water system was set at 80% in all the districts, and it was assumed that the hot water consumption was 40 L/day/person, and the cold water consumption set at 100 L/day/person [37].
It was assumed that the waste quantity per day per person was between 0.8 to 1.2 kg. It is important to note that the embodied energy (quantity of non-renewable energy per unit of building material, component or system), was automatically calculated by the software [37].
2.3. Ecoinvent Database
In this work, the environmental data used for the assessment of the two studied environmental impacts (life-cycle energy demand and life-cycle GHG emissions) were collected from the database of the Swiss-based ecoinvent, an international leader in the production of data associated with environmental impacts. Ecoinvent is also renowned for the transparency of its methods (Ecoinvent Lci database, 2021). The different data for each material contained an inventory of the life-cycle with all the flows of materials and energy entering and leaving the system [33,38,39,40,41,42,43,44,45], which were as follows: (i) resources consumed (water, energy, etc.); (ii) emissions in various natural environments, such as air, water, and soil (CO2 in the air, ammonia in water, metals in the soil, etc.); and (iii) waste created (inert, toxic, or radioactive). We used one of the most recent versions of the database, ecoinvent 3.5.
2.4. Simulation Tool and Components
The neighbourhood studied was modelled for some weeks. The duration of the simulation for the applications of the modelled neighbourhood was three weeks.
In this work, we used Pleiades LCA tool (Izuba Energies, Fabrègues, France) as our principal simulator. The interface of version 4.19.1.0 of the Pleiades software consisted of six modules, namely: Library, Modeller, Building Information Modelling, Publisher, Results, and LCA. Each of the modules had a specific function. This simulation tool has been widely recognized for its ability to analyse life-cycle environmental impacts at the neighbourhood level and has been the main modelling tool utilized in several other research studies [34].
- (a)
- Pleiades Library
This Library component was consulted for the elements of the general library of Pleiades; The Create/Edit library item objects created in the library can be used on all projects, and all variants. If an object is deleted from the general library, it remains present in the different projects using it because a copy is always made between the general library and the project library.
- -
- The tabbed module is structured around a series of tabs:
- -
- Walls: the elements of a wall (materials, elements, surface conditions and their different compositions);
- -
- Joineries: windows and doors and their modes of protection and opening RT2012;
- -
- Thermal bridges: thermal bridges (carpentry, integrated or linear);
- -
- Scenarios: scenarios usable in Dynamic Thermal Simulation (DTS) Heating, domestic hot water (DHW), and air conditioning;
- -
- Ventilation: ventilation equipment Photovoltaic: photovoltaic systems (modules, inverters and assemblies);
- -
- Environment: includes albedos and vegetation LCA C-: the macro-components of the C- calculation;
- -
- Lighting: lighting equipment;
- -
- Energy tariffs: energy tariffs (electricity, gas) Percentage
- -
- Contact: administrative contacts (contractor, architect, design offices, etc.).
Tabs are displayed only if they are used by the displayed module(s).
- (b)
- Pleiades modeller
The modeller is designed to facilitate the entry of buildings for the various Pleiades calculations. It makes it possible to define all the geometric parameters of the building, assign thermal characteristics to each of the walls, carry out zoning and quickly assign scenarios of use and the parameters specific to various calculations proposed by Pleiades. It facilitates viewing the entry in three dimensions and calculating the natural illumination and the Daylight Factor (FLJ) inside the buildings entered. Finally, it facilitates exporting the building to Pleiades Editor for verification and/or modification before launching the calculation (DTS, RE 2020, RT 2012, existing RT, Energie-Carbone, AMAPOLA, QAI INDALO or sizing) directly (DTS, RE 2020, RT 2012, existing RT, QAI INDALO, Energy-Carbon or dimensioning).
- (c)
- Pleiades BIM
Pleiades BIM (Building Information Modelling) is the component that allows the importing of a digital thermal model in gbXML or IFC and its conversion into a Pleiades file (.plp). It recovers the parts, walls, joinery and compositions from the model. It also ensures the detection of thermal bridges and the link of all these elements with the thermal libraries of Pleiades. Finally, it facilitates direct launching of all the calculations, except those for natural lighting and FLJ, exactly as for the Editor component of Pleiades. In order to obtain a digital model usable by Pleiades BIM, here are the prerequisites to follow: create rooms (resp. Zone for ArchiCAD), which define the interior volume, and ensure the faces of this interior volume come into contact with the walls, the lower floors, the intermediate floors and the roofs. For roofs and intermediate floors partly in contact with the outside, the lower parts must encompass the thickness of the slab, and the elements representing the walls, floors (lower, intermediate) and roofs must be identified as “room boundary” elements. If part of a slab is in contact with the exterior, this slab is set as “Exterior” (in Revit, in slab properties, change “Construction > Feature > Exterior”). Wall- and slab-type elements must have a composition with thermal characteristics (good or not) for the software to take them into account in the export, and ditto for composition materials and types of carpentry. The elements taken into account in Pleiades BIM are the walls, floors (low, intermediate), roofs, windows and doors. Curtain walls and columns are not taken into account. The project must be centred on the building to avoid rounding of the coordinates of the points during the export. The staircases and elevator shafts must be zoned in “Room”. The technical shafts must be either zoned in “Room”, or the “room limit” option of the partitions separating them from the adjacent room must be deactivated (the surface and the volume are added to this adjacent room). The walls must be represented in a single element containing the different layers of materials. Modelling via one layer per wall generates problems of contact and loss of information at the level of the compositions during the export. The perimeter of the low slabs must reach at least the middle of the thickness of the walls to be correctly exported (case encountered under Revit).
- (d)
- Pleiades Editor
Pleiades Editor and Pleiades BIM have a certain number of common functions and allow multi-zone dynamic energy simulation calculations to be performed with the COMFIE engine.
- (e)
- Pleiades Results
The screen is divided into 3 parts from left to right:
- -
- Result filters;
- -
- The list of results;
- -
- The results of the selected variant.
- (f)
- Pleiades LCA
Pleiades LCA can establish the assessments of environmental impacts on the life cycle of the building according to two distinct methodologies:
- -
- The EQUER engine uses a Life Cycle Analysis (LCA) methodology, developed by the Energy Efficiency Centre for Mining Systems ParisTech. It is historically implemented in Pleiades LCA. It uses the ecoinvent database as its database.
- -
- The assessment of environmental performance according to the RE2020 LCA regulations and the E + C- standard is a methodology based on Life Cycle Assessment and is largely based on the NF EN 15,978 standard.
The building’s original data derived from dynamic thermal simulation inputs and results or Pleiades’ RT212 regulatory calculations. This coupling of Pleiades LCA with Pleiades made it possible to automatically retrieve all the characteristics of the building entered:
- -
- The measurements of each element, with detailed information on each of the elements (density);
- -
- In the case of a simulation calculation, the needs (and/or consumption, where applicable) in heating, air conditioning, DHW, lighting, ventilation and auxiliaries, as well as the dissipated powers.
- -
- In the case of a regulatory calculation, regulatory consumption for heating, air conditioning, DHW, lighting, ventilation and auxiliaries, as well as for other uses. This data is then completed in Pleiades ACV by entering additional information:
- -
- Entry of additional elements, Pleiades DTS or RT, being thermal calculation software, certain building data are not entered, such as electrical wiring.
- -
- This data can be added in Pleiades LCA;
- -
- General and administrative data concerning the current operation and the building;
- -
- For a building, specific entries are provided for LCA in the fields of energy, water, waste and transport;
- -
- For a district, specific are provided for LCA in energy and water networks, previous occupation of the land and management of the public space.
2.5. Building Material
During the simulations, some standard data was offered by the simulation tool. It was possible to have all the data related to the structure of the building and the elements involved in the thermal calculations and/or energy consumption. These different data were then supplemented by more specific LCA data related to energy, water, waste and transport. The transport distances of the materials that we took into account in the LCA were contextualized to the case of Belgium and were the following: 100 km between the production site and the construction site, and 50 km between the construction site and the discharge. A 5% material surplus was considered. It corresponded to the average fall rate of the different construction products (standard value suggested by modelling software) [38,39,40,41,42,43,44,45].
The energy data were evaluated under the Belgian energy mix in the software. It was 52% nuclear, 27% natural gas, 17% renewable and 4% coal (International Panel of Climate Change, IPCC 2021) [46]. The production system was a natural gas condensing boiler with 92% of the lower heating value (PCI) efficiency [45]. In consequence, the type of energy for heating and energy used for domestic hot water was obtained from a natural gas boiler. Regarding waste use, the policy of selective sorting of waste was also considered (Less of waste.wallonie.be). This sorting was considered equal to 90% for glass waste and 75% for paper and cardboard. Thus, this proportion of waste was considered recycled and not landfilled [46]. According to Belgian statistics, 40% of the 1500 g of daily household waste per person is sent for incineration with a yield of 85%. The distances from the site to the garbage dump are 10 km, 100 km to the incinerator and 50 km to the recycling site. We considered the lifetime of frames and windows as being 30 years. the lifetime of coatings as 15 years and the overall service life of equipment as 20 years [47].
2.6. Environmental Cost
The environmental cost was evaluated according to the related function unit in Table 2.
Table 2.
Monetary indicators for European Committee for Standardisation indicators [32].
2.7. Analysis of the Neighbourhood in Its Initial Form
First, each piece of material and equipment for our project needed to be assigned the data corresponding to its environmental impact in the contextualized Ecoinvent v2.2 databases for France [45]. Due to the absence of precise data concerning the specific treatment at the end of life of each of the materials used, we considered them all to be inert waste sent to landfill. Regarding the lifespan of the various elements, we based ourselves on around thirty years for joinery, around ten years for coatings and around twenty years for specific equipment [46]. The structural and insulating materials were assumed to have a lifespan equal to that of the building, i.e., 80 years [48]. These lifetimes were used to calculate the impacts of the renovation phase. The transport distances of the materials that we took into account in the LCA were contextualized in the case of Belgium and were as follows [47]:
- ♣
- 100 km between the production site and the construction site;
- ♣
- 50 km between the site and the landfill concerning the end of life. In addition, a surplus of materials used on site of 5% was adopted. It corresponded to the average drop rate of the various construction products.
Energy data: In order to determine the impact of electricity consumption as accurately as possible, we entered the Belgian Wallonia energy mix into the software. It was as follows: 48.1% nuclear energy, 24.8% natural gas, 22.7% renewable sources and 4.4% coal (IPCC, 2021). Concerning consumption related to heating and DHW, these were calculated using the needs of the DTS. The production system was, we recall, a condensing boiler running on natural gas with a PCI efficiency of 92% [47].
Water: Regarding water consumption, we described the equipment included in the apartments and their use in order to perform a precise simulation of consumption. We included the following equipment:
- ♣
- Washing machine: Capacity 60 L.; Use: 1 L/week/accommodation.
- ♣
- Dishwasher: Capacity 13 L.; Use: 2 L/week/accommodation.
In addition, it was considered that the installation was equipped with a pressure reducer, that the average distribution length was less than 8 m and that 15% of losses were in the network and that no use of drinking water was made for outdoor cleaning and watering [48]. In our base scenario, rainwater harvesting systems present in the real district were not included, in order to measure their impact in a later study. In total, these options led us to a consumption of 100 l of water per person per day, 50% of which was DHW [46]. As a validation of our results, we consulted the average Belgian consumption, which is 110 litres of water per person per day, 40% of which is DHW [45]. The results were consistent with a slightly greater use of ECS in our case.
Waste: The selective waste sorting policy was also taken into account (Less dechets.wallonie.be). This sorting was considered equal to 90% for glass waste and 75% for paper and cardboard. Thus, this proportion of waste was considered recycled and not landfill. According to Belgian statistics, 40% of the 1500 g of daily household waste per person is sent for incineration with a yield of 85% [49]. The distances from the site to the landfill for household waste are 10 km, 100 km to the incinerator and 50 km to the recycling site [47].
Transport: The mobility component was also taken into account in our study [49]. Thus, the environmental impact of the occupants’ daily journeys was calculated. We assumed that 80% of the occupants made a daily trip. This amounted to considering that 20% of the occupants of the district were students using bicycles or walking on the Sart-Tilman site. For other occupants, an average distance of 20 km was indicated for daily commuting. The commutes were carried out 5 days a week, 47 weeks a year. Home–business journeys were a 10 km round trip (distance between the site and the commercial area of Boncelles). They were performed once a week, 47 weeks a year [50].
2.7.1. Life Cycle Assessment at the Building Scale
After calculation by the software, we obtained results concerning the LCA at the scale of the different buildings. The neighbourhood studied consists of 10 named buildings (from A1 to A10), as shown in Figure 2. The results for the ten buildings were very close and there is an example below for building A3 (Table 3).
Table 3.
Results of the LCA of building A3.
2.7.2. Neighbourhood Scale
Once the LCAs of the different buildings were completed, the results were be aggregated and all the impacts emanating from the neighbourhood added. Here we went to a higher scale. Thus, it was necessary to precisely describe the site in order to measure the following:
- -
- The impact of construction and the operation of public facilities (water and electricity networks, etc.).
- -
- The impact of the buildings constructed (from the LCAs previously carried out).
- -
- The impact of the development of public spaces (roads, green spaces, etc.).
- (i)
- Site
In the same way as was done for the buildings, some key data about the site was utilised. First, the energy mix used for the electricity consumed by public lighting. Obviously, we adopted the same mix as the one used for the buildings. The transport distances between the factory and site and site and waste management centres were also the same as those previously specified for buildings.
The rainfall was considered to be 800 l/m2.year. Part of this water would be directed to the network and would have to undergo specific treatment. Another part would be directed to water retention systems. The systems constitute buffer spaces to reduce the volume of water to be treated in the event of heavy rain [50].
In the base case, absence of rainwater harvesting systems were assumed, in order to measure the impact of their presence later [48]. Thus, 0% of rainwater was not evacuated via a separate network at first. This was taken into account in our analysis of the underground networks of drinking water and wastewater. We accounted for the impacts caused by their construction and their losses. After having carried out a quick survey, we counted 1200 m of pipes dedicated to drinking water and as many dedicated to wastewater. The drinking water pipes were made of 50% polyethene and 50% ductile iron and losses from these were estimated to be 15%. For polyethylene, the service life is 75 years and maintenance required every 40 years [49]. For cast iron, the service life is 100 years and maintenance required every 50 years. Regarding the wastewater network, the losses were estimated at 3% and the service life at 75 years. Maintenance was considered necessary after 40 years [50].
- (ii)
- Building
In order to calculate the additional indicators, presented at the beginning of the section, the previous use of the constructed land had to be indicated [47]. We considered that the site, being neither built before the operation, nor cultivated, nor dedicated to an urban green space, was similar to permanent fallow land [50].
- (iii)
- Public spacesFinally, a list of the public spaces present in the district and their characteristics follows:
- ♣
- Driveways, squares and car parksArea: 8000 m2; Impermeability: 85%; Lighting: Sodium (3 kWh/m2/year); Lifespan 100 years; Composition: 7 cm concrete pavers.
- ♣
- Green spaces, gardensSurface: 19,800 m2 including 1000 m2 of water; Impermeability: 40%; Maintenance:12 mowing/year for private gardens; Waste: 80% of organic waste composted on site.
- ♣
- StreetsArea: 2100 m2; Impermeability: 90%; Lighting: Sodium (4.8 kWh/m2/year); Lifespan 100 years; Composition: 5 cm layer of bituminous concrete + 10 cm concrete gravel mix [48];
All areas were considered to have previously been permanent fallow land.
3. Assumptions, Results and Discussions
3.1. Initial Scenario
The initial scenario enable description of the current state of the neighbourhood with real and existing information, without fixed assumptions, as described in the methodology section and reported in this video: “https://www.youtube.com/watch?v=V9b0DwzDQS8, accessed on 15 February 2023”.
After calculation via the software, the results obtained are detailed in Table 4.
Table 4.
Greenhouse gas and primary energy in each stage in the initial scenario.
3.2. Validation of Results
For the validation of the obtained results, the order of magnitude of our results were checked. For this, we compared these results with those present in the scientific literature. Lotteau et al. [34] carried out a critical review of the state-of-the-art concerning LCA at the neighbourhood level, as shown in Table 5.
Table 5.
Comparison between the results of this research and literature.
They found a variation in carbon concentration between 11 and 123 kgeqCO2/m2 floor area/year; and primary energy consumption from 20.5 to 461.2 kWh/m2 Floor area/year. In this study, a variety of carbon concentrations between 7.5 and 35.1 kgeqCO2/m2 floor area/year and primary energy consumption from 39.4 to 120.2 kWh/m2 Floor area/year were obtained. The obtained results (see Table 6) were almost around the intervals proposed by Lotteau et al. [39]. The results were, therefore, of a good order of magnitude. It must be highlighted, though, that this verification did not attest to the absolute veracity of our results. We now highlight the most important sources of impact and their distribution. Table 6 shows the variation of CO2 and energy cost.
Table 6.
Reduction (in percentage) in total energy consumption cost and carbon emission cost (buildings + transport − local renewable energy) based on mixed scenario applied in some EU countries in 2050.
We were primarily interested in the “greenhouse effect” impact. There was 93% of GHG generated during the operational stage. Within this phase, mobility dominated, being responsible for 46% of emissions. Next came heating and DHW couple, which represented 24% of the GHG. The different percentages of greenhouse gas and energy demand are shown in Figure 3.
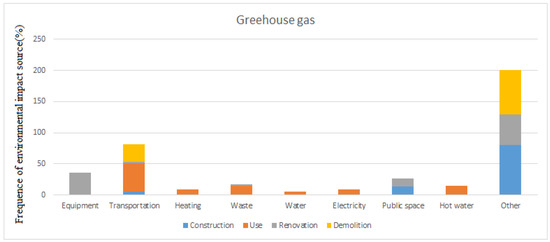
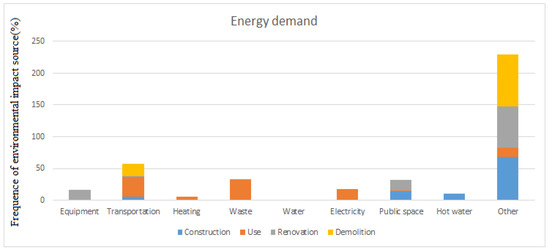
Figure 3.
Evaluation of greenhouse gas and primary energy in (%) in the current district.
We deduced that the operational stage was predominant. We also observed some notable results:
- ♣
- The cumulative energy demand coming from waste management was a third of the demand of the occupation stage.
- ♣
- The Primary energy demand due to the heating + DHW couple was only half that due to the transport of residents or due to the management of household waste. We, thus, already noticed the very strong participation of the mobility component and the household waste management component in LCA at the neighbourhood level.
Let us now move on to the study of the different design scenarios and the analysis of the impact of the different parameters studied. The systematically detailed LCA reports of the different scenarios can be found in the appendix.
3.3. Influence of Building Orientation
In this part, we study the impact of orientation on the LCA results at the neighbourhood level. In our initial scenario, the majority of the buildings were positioned so that the longitudinal facades faced north and south. We called this initial scenario “0° orientation” and it was used to test other orientations by subjecting the ground plane to a rotation of 45°, 90°, and 180°. A simulation of all the buildings for each of the orientations was performed and, after this, the most unfavourable orientation selected to perform the full neighbourhood LCA for that orientation. Finally, the results of this LCA were compared with those of the base neighbourhood in order to quantify the impact of orientation on the LCA of a neighbourhood.
An average increase for all buildings of 1 to 2 kWh/m2/year was observed to depend on the orientation. For a 180° rotation of the district, the differences in heating needs were minimal (2%). They were due to the different proportions of glazing between the north facade and the south facade. However, for a 90° rotation of the district, we noticed an increase in heating needs of 13%. We, therefore, performed the LCA of the entire neighbourhood in its 90° orientation. This relatively low impact of orientation on heating needs is explained by the very efficient nature of the thermal insulation of the buildings. However, we noticed that when a 90° rotation was performed, three of the six buildings that were initially passive were no longer so. Now let us move on to the LCA results. Apart from the orientation of the site and, therefore, the results of the DTS of the buildings, no other parameter had modified. Below, in Figure 4, are the comparative results of LCA at the neighbourhood scale in the 0° and 90° orientations.
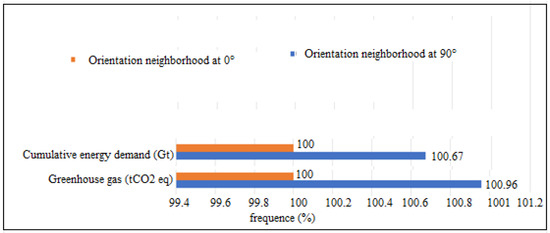
Figure 4.
Evaluation of the environmental impacts of “0° and 90° of building orientation”.
We notice that at the scale of the district, the influence of the orientation of the buildings was important. This might have been due to heating change. Moreover, this development only affected the use stage of the district. In the case of a 90° rotation, 1% of GHG and cumulative energy were obtained. This might have been because the increase of heating needs produced a strong demand for gas. The orientation did have an impact on heating consumption and the environmental indicators relating solely to these indicators. However, at the scale of the entire neighbourhood, the orientation had little impact on the LCA results.
3.4. Influence of Water Management
In our initial scenario, we did not use any rainwater harvesting system. There was no separation network and the floor coverings were not worked in such a way as to offer high permeability. Thus, all rainwater had to be taken up in the wastewater network and treated. However, we did not consider the use of drinking water for watering the gardens. Here, we studied a scenario integrating a more in-depth reflection on storm water management. For each public space, the quantity of water to be treated was measured as follows:
With:
Pw = Potable water used for irrigation and maintenance [m3/m2/year]
Rw = Rainwater [m3/m2/year]
Eff = Efficiency of the sewerage network
Wret = Proportion of water directed to water retention systems
Imp = Impermeability of the studied space
S = Surface of the studied space [m2]
D = Analysis duration [year]
The aim of the design was to divert as much rainwater as possible from the wastewater network to a sewer system. This was in order to relieve the processing centres.
For the rainwater harvesting system scenario, rainwater harvesting tanks were modelled. The rainwater would be used for watering gardens, cleaning exterior and interior spaces, flushing toilets and for washing machines. We had a total of 6580 m2 of recovery area made up of the gravelled roofs of the ten buildings. In addition, rainwater was taken care of by a separate network made up not only of these cisterns, but also of bodies of water, valleys and ditches. The water from the gardens was taken up by the ditches and valleys and directed towards a body of water, as was the water from the paths, squares and car parks. The water recovered from the roofs was stored in cisterns, the overflow of which discharged into the valleys. Thus, we considered that all of the site’s rainwater was managed by a separate network and that no part of the water was taken into charge by the wastewater network. However, the soils kept their initial permeability.
In regard to permeable soils, in this scenario, we implemented more permeable floor coverings than in the basic option.
Thus, car parks, the paths and squares were worked with coverings of unpointed concrete pavers and concrete–grass slabs. Thus, the total permeability of the site went from 66% in the initial state to 58% once the permeable coatings had been implemented. In this scenario, we supposed that no other rainwater harvesting system was added. All of the water that did not infiltrate directly into the ground was, therefore, sent to the wastewater network, and the results are shown in Figure 5.
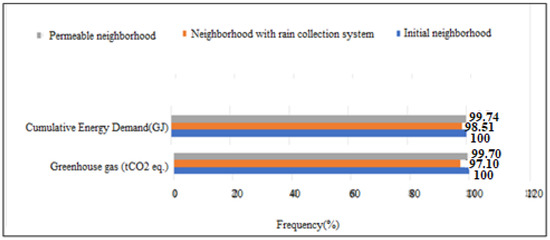
Figure 5.
Comparison between environmental impacts coming from current district (initial scenario) and rain collection system.
Soil permeability had a low impact on energy demand and greenhouse gas emissions. In the present case, the implementation of permeable soils made it possible to reduce, by 0.3%, all of the two impacts over the entire life cycle of the district. Indeed, the amount of water that infiltrated into the ground, thanks to the permeable coatings, was less than the amount recoverable by the recovery systems presented in the previous scenario. Thus, it was more efficient to set up recovery systems, such as cisterns, valleys or infiltration basins at the neighbourhood level.
3.5. Influence of Mobility
Initially, we admitted the major use of the automobile for daily trips. Now, confronted this scenario with a second one, where the site was urban, strongly integrated into public transport networks and a short distance from necessary shops. Let us recap the mobility assumptions:
- (i)
- Initial Scenario:
It was assumed 80% of occupants travelled daily. The home–work distance of 20 km was covered daily by car. The home–shop distance of 5 km was covered weekly by car.
- (ii)
- “Urban Site” Scenario:
It was assumed that 100% of occupants travelled daily. The home–work distance of 2.5 km was made daily by bus. The distance between home and shops of 300 m was covered weekly by bike or on foot. The results are shown in Figure 6.
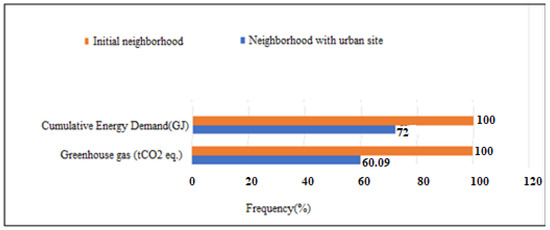
Figure 6.
Confrontation between GHG and energy generated before and after applying the mobility scenarios.
In view of these results, we deduced that mobility had a huge impact on the environmental balance of the district. For example, concerning the greenhouse effect, we observed a 40% reduction in emissions over the total life cycle of the district, thanks to a 93% reduction in emissions due to transport during the use phase. Reducing the utilisation of automobiles saved energy. Energy consumption was lower when the users moved most of time with public transport (bus, tram, etc.). Thus, the energy demand reduced up to 28%. Using personal vehicles daily between home and work significantly affected the environmental balance of the neighbourhood.
3.6. Impact of Building Density
- (i)
- Scenario: Vertical density
In our initial scenario, our buildings were mostly R + 1, with R + 2 for some buildings. In the “Vertical Density” scenario we raised each building an extra floor. These new floors were identical to the floor on which they were installed and were divided into “day” and “night” thermal zones of the same total surface. Thus, the built density of our neighbourhood and, therefore, the number of inhabitants increased. Where the neighbourhood in its initial state had 220 inhabitants, the “density +” scenario had 321. After this, we performed the dynamic thermal simulation of all the buildings again with an extra floor and then performed the LCA of the district. It was first noticed that the heating needs of an additional floor dropped slightly. It would seem that the increase in compactness caused by the elevation of the residential buildings had a greater impact. The results are given in Figure 7.
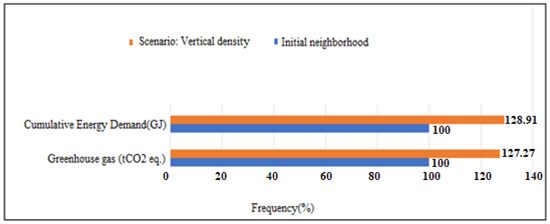
Figure 7.
Comparative diagram of the environmental impacts of the “initial” and “density +” scenarios (functional unit: entire district).
It can be observed that all the indicators increased in fairly similar frequencies, between 25% and 30%. Indeed, the indicators related to the residential buildings were modified, excepting those related to the district which remained unchanged.
- (ii)
- Scenario: Horizontal density
In an additional scenario, we increased the number of buildings present on the site. Four new buildings were added, in order to obtain the same built-up area as in the “vertical density” scenario and the same number of inhabitants. At the same time, a portion of public spaces was removed from the “aisles, squares and parking lots” category so that the surface of our site remained unchanged. In addition, the added buildings were considered to be identical copies, in all respects, to the buildings already existing within the district. Thus, it was possible to compare the environmental impact of the two types of neighbourhood densifications. The results are given in Figure 8.
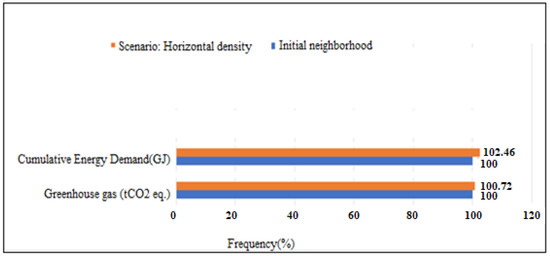
Figure 8.
Comparative diagram of the environmental impacts of the “initial” and “Horizontal Density” scenarios (functional unit: occupant).
When we added new buildings to the site, the environmental impacts increased directly. It can be observed that the indicators were on the rise. They all increased from 1% to 5%. Indeed, we did not benefit from a gain in compactness and we did not pool the networks. In addition, the construction of new buildings was greedier in materials and energy than raising a floor, as shown in Figure 9.

Figure 9.
Confrontation between the “initial”, “Horizontal Density” and “Vertical Density” scenarios.
- (iii)
- Comparison of the three scenarios
Thus, densifying the district vertically is much more interesting environmentally. The different impacts of the neighbourhood are more important than during horizontal densification.
3.7. Impact of the Utilization of Renewable Energies
3.7.1. Scenarios
Initially, we considered that the total operational electricity was generated by the Belgian electricity grid.
In the new scenario, we installed photovoltaic panels (PVs) on all the roofs of the residential buildings and we fixed the PV surface to be equal to two thirds of the roof surface for each building. It is interesting to remark that our accommodations only used electricity to power household appliances and for lighting. The PV was essentially constituted of mono-crystalline. The collectors were oriented to the south face and inclined at 35°, the optimum inclination in Belgium. A new simulation was carried out with these new hypotheses.
3.7.2. Results
At the level of dynamic thermal simulation, the consumption and production of electricity are shown. By applying PV, electricity generated exceeded electricity demanded, except in December and January, when the installation covered 45% and 75% of consumption, respectively. Indeed, the dwellings consumed an average 12 kWh/m2.year of electricity per year according to the results of the DTS. These results are in line with the Belgian averages for dwellings not heated by electricity. The solar panels, meanwhile, produced an average of 26 kWh/m2 over the year. Thus, except for the months of January and December, no electrical energy was drawn from the Belgian network. The consequences on the LCA of the neighbourhood are presented in Figure 10.
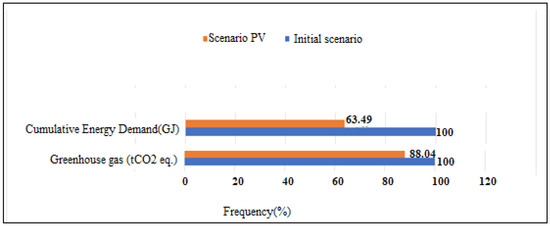
Figure 10.
Comparative diagram of the environmental impacts of the “initial” and “Photovoltaic” scenarios (functional unit: entire district).
Of all the configurations studied, the one including the addition of photovoltaic panels was the one that produced the most heterogeneous results on the neighbourhood LCA. The total energy required for the district to operate over its entire life cycle was reduced by 37%. Once again, the construction and renovation phases were negatively impacted. The construction phase saw its energy consumption increase by 75% and the renovation phase by 978%, due to the manufacture of the panels. However, the occupation phase saw its demand decrease by 47%. The greenhouse effect decreased by 12% over the entire life cycle. The evolution of the indicators once again followed the same pattern, namely a significant increase in the construction and renovation phases. However, once again, these increases were offset by a reduction in the environmental impact of the use phase, the most impacting phase of the life cycle. A 25% drop in greenhouse gas emissions was observed during this phase. To conclude, the installation of photovoltaic panels has a mixed record. However, it must be taken into account that we greatly oversized the installation in our case. That said, it is a choice that can be made in order to generate financial income through the resale of surplus electricity. Finally, it was observed that the manufacture of such panels was not neutral to environmental impacts.
3.8. Comparison of Different Scenarios
In this last part, we brought together, in Figure 11, the results of all the scenarios studied. This allowed us to compare them and, thus, define the most impacting design parameters. In order to classify the different scenarios among themselves and, thus, define the design parameters to be taken into account as a priority, we calculated the sum of the variations, in percentage, of all the indicators compared to the initial scenario. We chose not to apply any weighting.
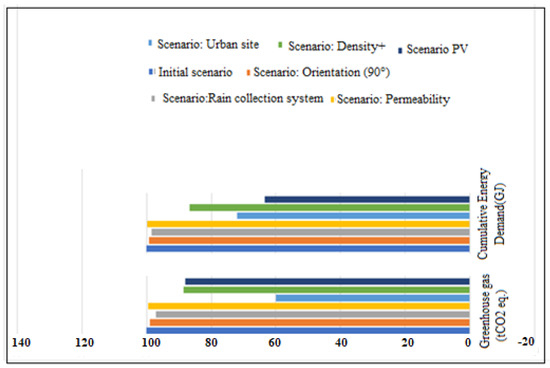
Figure 11.
Comparison of the environmental impacts of the different scenarios studied. (Functional unit: occupant).
Thus, according to our study, and among all the parameters studied, mobility management had the most impact. This is the parameter that makes it possible to reduce impacts in terms of the greenhouse effect the most. The daily use of individual means of transport by the inhabitants of the district had an enormous impact on the LCA of the district. Eliminating the use of personal vehicles in favour of public transport made it possible to limit the greenhouse effect 4 times more than generating all the electricity in the district using photovoltaic panels. Thus, mobility management must be one of the issues to be addressed as a priority during any reflection carried out at the urban level. Designing a neighbourhood that wants to be sustainable and ecological, while being disconnected from public transport networks, is nonsense.
It was found that in second position was the criterion of vertical density. Increasing the built density of the neighbourhood by raising buildings is environmentally very beneficial. This makes it possible to pool many flows, to increase the energy and environmental efficiency of the district and, thus, to minimise the various environmental impacts in a homogeneous manner. An eco-district must, therefore, have a certain density. One of the criteria of the sustainable neighbourhood reference system concerns this aspect and imposes a density of 30 to 40 housing units per hectare.
Now the implementation of renewable energy production systems is analysed. In this sense, the fact that photovoltaic panel systems had a mixed environmental record needs to be highlighted. Their use limits the production of radioactive waste and the cumulative demand for energy. However, their manufacture has a negative impact on LCA in terms of damage to biodiversity and the waste produced. Thus, their large-scale implementation does not necessarily seem to be a priority, at least not until their manufacturing and recycling processes are cleaner.
Finally, soil permeability and orientation are parameters which, if well managed, improve the environmental balance of a district, but to a lesser extent. As for the choice to densify the neighbourhood horizontally by adding more buildings, it may prove to be counterproductive.
3.9. Mixed-Scenario
In this section, a mixed scenario was applied: Global warming + heavy renovation of all buildings (100%) + 100% electric cars − solar panels. This scenario allowed for a reduction of up to 90% of total carbon emissions and 90% of the total energy consumption by 2050. Overall, a strong predominance of the occupation phase was noted, which concentrated about 93% of greenhouse gas (GHG) production. Within this phase, mobility dominated, responsible for with 46% of emissions. Next came the heating and domestic hot water (DHW) pair, which represented 24% of emissions, and waste treatment accounted for 15% of emissions during the use phase.
- Emissions due to household waste management were comparable to those due to DHW production (15% of use phase emissions) [40];
- Emissions due to heating represented only two-thirds of emissions due to the production of DHW;
- Emissions due to the mobility of residents represented almost half of the emissions of the use phase. These characteristics were notably due to the fact that the high thermal performance of buildings greatly reduced their heating consumption.
The impact of “primary energy demand” is now considered. The use phase was predominant (96% of total energy demand), which was, in particular, due to the accounting for mobility and waste management.
Some notable results were observed:
- -
- The primary energy demand due to waste management was comparable to that due to the mobility of the inhabitants and was equivalent to almost a third of the demand for the occupation phase.
- -
- The energy demand due to transport and waste management during the use phase was 60% of the total energy demand of the district over its entire life cycle.
- -
- The energy demand due to the couple heating + domestic hot water (DHW) was only half of that due to the transport of the inhabitants or due to the management of household waste.
The very strong participation of the mobility component and the household waste management component in LCA at the neighbourhood level was apparent. In conclusion, the mixed scenario would facilitate the achievement of nearly zero-carbon energy in 2050 at the neighbourhood scale, considering CO2 emission and energy consumption by buildings and daily mobility. This scenario should be recommended and applied in future neighbourhoods located in European Union countries to stabilise the temperature around 1.5 °C. Table 6 summarises the percentage of cost reduction of energy consumption and carbon emission.
More than 90% of the environmental cost would be expected to reduce by 2050 by applying this scenario at the neighbourhood scale.
Heavy renovations within residential buildings are the most effective levers of action to significantly reduce the quantity of energy consumption. The same conclusion was obtained by other researchers [41]. We could reduce a significant quantity of CO2 generated by selecting building materials more adapted to the new climate. We find that the shading effect is much higher in urban than rural areas. Despite this, the difference in solar energy production, depending on the type of neighbourhood, does not seem to modify energy priorities and strategies at the neighbourhood level. Working on a greener mobility method and also integrating local renewable energy sources are the best strategies that remain very useful to achieve the NetZero-energy target and carbon neutrality by 2050 [42].
As found in another study [43], heavy and light renovations with the current renovation rate allow up to 20% reduction in energy consumption, while, a heavy renovation (100%) of residential buildings allow energy consumption to reduce by 89%.
4. Conclusions
This research assessed the amount of carbon dioxide emissions and energy consumption coming from one new district in Belgium. The strong predominance of the operational stage, which is responsible for about 93% of greenhouse gas (GHG) production, is noted. Within this stage, daily mobility dominated with up to 46% of emissions. The next was the heating and domestic hot water (DHW) pair, representing 24% of emissions, and waste treatment accounted for 15% of emissions during the operational stage. Average carbon was expected to be 58.6 kgCO2/m2.year in this neighbourhood. The fight against global warming is mandatory, if humanity is to continue in the coming decades. We show that the typical problems of urban development are to be treated as priorities, given their considerable influences on the LCA of a district. The good news is that there is still a possibility to maintain air temperature growth around 1.5 °C in the next decade, by, for example, combining Global warming + heavy renovation of all buildings (100%) + cars 100% electric − solar panels.
Retrofitting is more beneficial in old buildings because it allows for a reduction of around 30% of total energy consumption. Building materials, such as electricity materials, were revealed as the most significant components responsible for emissions at the neighbourhood scale, while heating has a high impact in residential buildings. Therefore, sustainable material and thermal insulation are recommended. The orientation, the presence or not of permeable soils, integration into public transport networks, reduction of daily distances, increasing of uninhabitable surfaces, etc. can have significant effects on the emission rate.
It was shown that it is strongly preferable to densify the neighbourhood vertically rather than horizontally and that rainwater harvesting systems are more effective than permeable soils. The impact of installation of photovoltaic panels proved to be mixed from a sustainability point of view. This study focused on themes that seem to us to be the most relevant to study as a priority. However, many other parameters remain to be studied in order to be able to provide designers with complete guidelines. Finally, in future study, the different impacts of gardens and wind turbines on CO2 emissions at the district scale will be assessed.
Author Contributions
Investigation: M.K.N.; Simulation M.K.N., written and revision: M.K.N. and J.A.O.; Supervision J.A.O. All authors have read and agreed to the published version of the manuscript.
Funding
This research received no external funding.
Institutional Review Board Statement
This manuscript can be published in this journal.
Informed Consent Statement
Not applicable.
Data Availability Statement
Date will be made available on reasonable request. Data can be available under request of reader.
Conflicts of Interest
There is not conflict of interest between the co-authors of this article.
References
- Un Pacte Vert Pour L’europe. Available online: https://commission.europa.eu/strategy-and-policy/priorities-2019-2024/european-green-deal_fr (accessed on 18 March 2023).
- Srinivasan, R.S.; Ingwersen, W.; Trucco, C.; Ries, R.; Campbell, D. Comparison of energy-based indicators used in life cycle assessment tools for buildings. Build. Environ. 2014, 79, 138–151. [Google Scholar] [CrossRef]
- Wang, N.; Phelan, P.E.; Gonzalez, J.; Harris, C.; Henze, G.P.; Hutchinson, R.; Langevin, J.; Lazarus, M.A.; Nelson, B.; Pyke, C.; et al. Ten questions concerning future buildings beyond zero energy and carbon neutrality. Build. Environ. 2017, 119, 169–182. [Google Scholar] [CrossRef]
- Salvadó, L.L.; Villeneuve, E.; Masson, D.; Akle, A.A.; Bur, N. Decision Support System for technology selection based on multi-criteria ranking: Application to NZEB refurbishment. Build. Environ. 2022, 212, 108786. [Google Scholar] [CrossRef]
- Pulselli, R.M.; Marchi, M.; Neri, E.; Marchettini, N.; Bastianoni, S. Carbon accounting framework for decarbonisation of European city neighbourhoods. J. Clean. Prod. 2019, 208, 850–868. [Google Scholar] [CrossRef]
- Fenner, A.E.; Kibert, C.J.; Li, J.; Razkenari, M.A.; Hakim, H.; Lu, X.; Kouhirostami, M.; Sam, M. Embodied, operation, and commuting emissions: A case study comparing the carbon hotspots of an educational building. J. Clean. Prod. 2020, 268, 122081. [Google Scholar] [CrossRef]
- Doukas, H.; Nychtis, C.; Psarras, J. Assessing energy-saving measures in buildings through an intelligent decision support model. Build. Environ. 2009, 44, 290–298. [Google Scholar] [CrossRef]
- Diakaki, C.; Grigoroudis, E.; Kabelis, N.; Kolokotsa, D.; Kalaitzakis, K.; Stavrakakis, G. A multi-objective decision model for the improvement of energy efficiency in buildings. Energy 2010, 35, 5483–5496. [Google Scholar] [CrossRef]
- Liu, M.; Li, B.; Yao, R. A generic model of exergy assessment for the environmental impact of building lifecycle. Energy Build. 2010, 42, 1482–1490. [Google Scholar] [CrossRef]
- Jain, S.; Agarwal, A.; Jani, V.; Singhal, S.; Sharma, P.; Jalan, R. Assessment of carbon neutrality and sustainability in educational campuses (CaNSEC): A general framework. Ecol. Indicat. 2017, 76, 131–143. [Google Scholar] [CrossRef]
- World Green Building Council. WorldGBC Responds to IPCC: The Entire Building and Construction Supply Chain Must Decarbonise by 2050 to Reach 1.5 Degrees. 2022. Available online: https://www.worldgbc.org/news-media/worldgbc-responds-ipcc-entire-building-andconstruction-supply-chain-must-decarbonise (accessed on 18 March 2023).
- Kumar, D.; Alam, M.; Zou, P.X.W.; Sanjayan, J.G.; Memon, R.A. Comparative analysis of building insulation material properties and performance. Renew. Sustain. Energy Rev. 2020, 131, 110038. [Google Scholar] [CrossRef]
- Rock, M.; Saade, M.R.M.; Balouktsi, M.; Rasmussen, F.N.; Birgisdottir, H.; Frischknecht, R.; Habert, G.; Lützkendorf, T.; Passer, A. Embodied GHG emissions of buildings—The hidden challenge for effective climate change mitigation. Appl. Energy 2020, 258, 114107. [Google Scholar] [CrossRef]
- Ibn-Mohammed, T.; Greenough, R.M.; Taylor, S.; Ozawa-Meida, L.; Acquaye, A. Operational vs. embodied emissions in buildings—A review of current trends. Energy Build. 2013, 66, 232–245. [Google Scholar] [CrossRef]
- Adel, T.K.; Pirooznezhad, L.; Ravanshadnia, M.; Tajaddini, A. Global policies on green building construction from 1990 to 2019: A scientometric study. J. Green Build. 2022, 16, 227–245. [Google Scholar] [CrossRef]
- Osman, A.I.; Chen, L.; Yang, M.; Msigwa, G.; Farghali, M.; Fawzy, S.; Rooney, D.W.; Yap, P.-S. Cost, environmental impact, and resilience of renewable energy under a changing climate: A review. Environ. Chem. Lett. 2022, 21, 741–764. [Google Scholar] [CrossRef]
- Sartori, I.; Napolitano, A.; Voss, K. Net zero energy buildings: A consistent definition framework. Energy Build. 2012, 48, 220–232. [Google Scholar] [CrossRef]
- Koutra, S.; Pagnoule, C.; Galatoulas, N.-F.; Bagheri, A.; Waroux, T.; Becue, V.; Ioakimidis, C.S. The Zero-Energy Idea in Districts: Application of a Methodological Approach to a Case Study of Epinlieu (Mons). Sustainability 2019, 11, 4814. [Google Scholar] [CrossRef]
- Kampelis, N.; Gobakis, K.; Vagias, V.; Kolokotsa, D.; Standardi, L.; Isidori, D.; Cristalli, C.; Montagnino, F.; Paredes, F.; Muratore, P.; et al. Evaluation of the performance gap in industrial, residential & tertiary near-Zero energy buildings. Energy Build. 2017, 148, 58–73. [Google Scholar] [CrossRef]
- Carpino, C.; Loukou, E.; Heiselberg, P.; Arcuri, N. Energy performance gap of a nearly Zero Energy Building (nZEB) in Denmark: The influence of occupancy modelling. Build. Res. Inf. 2020, 48, 899–921. [Google Scholar] [CrossRef]
- Butera, F.M. Zero-energy buildings: The challenges. Adv. Build. Energy Res. 2013, 7, 51–65. [Google Scholar] [CrossRef]
- Rafique, M.M.; Rehman, S.; Alhems, L.M. Developing zero energy and sustainable villages—A case study for communities of the future. Renew. Energy 2018, 127, 565–574. [Google Scholar] [CrossRef]
- Sokolnikova, P.; Lombardi, P.; Arendarski, B.; Suslov, K.; Pantaleo, A.; Kranhold, M.; Komarnicki, P. Net-zero multi-energy systems for Siberian rural communities: A methodology to size thermal and electric storage units. Renew. Energy 2020, 155, 979–989. [Google Scholar] [CrossRef]
- Kim, M.-H.; Kim, D.; Heo, J.; Lee, D.-W. Techno-economic analysis of hybrid renewable energy system with solar district heating for net zero energy community. Energy 2019, 187, 115916. [Google Scholar] [CrossRef]
- Anderson, J.E.; Wulfhorst, G.; Lang, W. Energy analysis of the built environment—A review and outlook. Renew. Sustain. Energy Rev. 2015, 44, 149–158. [Google Scholar] [CrossRef]
- Lotteau, M.; Loubet, P.; Pousse, M.; Dufrasnes, E.; Sonnemann, G. Critical review of life cycle assessment (LCA) for the built environment at the neighborhood scale. Build. Environ. 2015, 93, 165–178. [Google Scholar] [CrossRef]
- Stephan, A.; Crawford, R.H.; de Myttenaere, K. Multi-scale life cycle energy analysis of a low-density suburban neighbourhood in Melbourne, Australia. Build. Environ. 2013, 68, 35–49. [Google Scholar] [CrossRef]
- Nichols, B.G.; Kockelman, K.M. Life-cycle energy implications of different res-idential settings: Recognizing buildings, travel, and public infrastructure. Energy Policy 2014, 68, 232–242. [Google Scholar] [CrossRef]
- Norman, J.; MacLean, H.L.; Kennedy, C.A. Comparing High and Low Residential Density: Life-Cycle Analysis of Energy Use and Greenhouse Gas Emissions. J. Urban Plan. Dev. 2006, 132, 10–21. [Google Scholar] [CrossRef]
- Trigaux, D.; Allacker, K.; De Troyer, F. Life Cycle Assessment of Land Use in Neighborhoods. Procedia Environ. Sci. 2017, 38, 595–602. [Google Scholar] [CrossRef]
- Herfray, G. Contribution à L’évaluation des Impacts Environnementaux des Quartiers. Ph.D. Dissertation, Ecole Supérieure Nationale des Mines de Paris, Paris, France, 2011. [Google Scholar]
- Nematchoua, M.K.; Orosa, J.A.; Reiter, S. Life cycle assessment of two sustainable and old neighborhoods affected by climate change in one city in Belgium: A review. Environ. Impact Assess. Rev. 2019, 78, 106282. [Google Scholar] [CrossRef]
- Goedkoop, M.; Spriensma, R. The Eco-indicator 99: A damage oriented method for life cycle impact assessment (p. 142). 2000. 2000. Available online: https://www.researchgate.net/publication/285641235_The_ecoindicator-99_A_damage_oriented_method_for_life_cycle_impact_assessment_Methodology_annex (accessed on 10 January 2023).
- Nematchoua, M.K.; Orosa, J.A.; Ricciardi, P.; Obonyo, E.; Sambatra, E.J.R.; Reiter, S. Transition to Zero Energy and Low Carbon Emission in Residential Buildings Located in Tropical and Temperate climates. Energies 2021, 14, 4253. [Google Scholar] [CrossRef]
- Wait, E.; Meukam, P.; Nematchoua, M.K.; Rene, T. Influence of external shading on optimum insulation thickness of building walls in a tropical region. Appl. Therm. Eng. 2015, 90, 754–762. [Google Scholar] [CrossRef]
- Nick, V.; Mata, E.; Sasic, K.; Scartezzini, J. Effective and robust energy retrofitting measures for future climatic conditions—Reduced heating demand of Swedish households. Energy Build. 2016, 121, 176–187. [Google Scholar] [CrossRef]
- Ciobanu, D.; Eftimie, E.; Jaliu, C. The Influence of Measured/simulated Weather Data on Evaluating the Energy Need in Buildings. Energy Procedia 2014, 48, 796–805. [Google Scholar] [CrossRef]
- De Nocker, L.; Broekx, S.; Liekens, I. Economischewaardering van Verbetering Ecologischetoestandoppervlaktewater Op Basis van Onderzoeksresultaten uit Aquamoney; Vito Intern Rapport 2011/RMA/R/248; 2011; p. 58. Available online: https://fr.readkong.com/page/economische-waardering-van-verbetering-ecologische-toestand-6432029 (accessed on 10 January 2023).
- Daunay, J.; Dugast, C.; Bachelet, L.; Foudhil, H.S. ADEME, Carbon4:Neutrality & Building How Players in the Sector Can Be Part of a Net Zero Emissions Approach, Agence de l’Environnement et de la Maitrise de l’Energie-Ademe Ile de France 2019, P4-21. Available online: http://inis.iaea.org/deniedaccess.htm (accessed on 10 January 2023).
- European Union Directive. 31/EU of the european parliament and of the council of 1910 on the energy performance of buildings (recast). Off. J. EU 2010, 18, 13–35. [Google Scholar]
- Reiter, S.; Marique, A.F. Toward low energy cities: A case study of the urban area of Liege, Belgium. J. Ind. Ecol. 2012, 16, 829–838. [Google Scholar] [CrossRef]
- Attia, S.; Mlecnik, E.; Van Loon, S. Principles for nearly zero energy building in Belgium. In World Sustainable Energy Days; OO Energiesparverband: Wels, Austria, 2012; Volume 5. [Google Scholar]
- Kameni, N.M.; Nishimwe, M.; Reiter, S. Towards nearly zero-energy residential neighbourhoods in the European Union: A case study. Renew. Sustain. Energy Rev. 2021, 135, 110198. [Google Scholar]
- Peuportier, B.; Popovici, E.; Troccmé, M. Analyse du cycle de vie à l’échelle du quartier, bilan et perspectives du projet ADEQUA. Build. Environ. 2013, 3, 17. [Google Scholar]
- Nematchoua, M.K.; Asadi, S.; Reiter, S. Influence of energy mix on the life cycle of an eco-neighborhood, a case study of 150 countries. Renew. Energy 2020, 162, 81–97. [Google Scholar] [CrossRef]
- Nematchoua, M.K.; Sendrahasina, R.M.; Malmedy, C.; Orosa, J.A.; Simo, E.; Reiter, S. Analysis of environmental impacts and costs of a residential building overits entire life cycle to achieve nearly zero energy and low emission objectives. J. Clean. Prod. 2022, 373, 133834. [Google Scholar] [CrossRef]
- Nematchoua, M.K.; Orosa, J.A. Life cycle assessment of radioactive materials from a residential neighbourhood. Sustain. Mater. Technol. 2022, 33, e00468. [Google Scholar] [CrossRef]
- Nematchoua, M.K.; Sadeghi, M.; Reiter, S. Strategies and scenarios to reduce energy consumption and CO2 emission in the urban, rural and sustainable neighbourhoods. Sustain. Cities Soc. 2021, 72, 103053. [Google Scholar] [CrossRef]
- Nematchoua, M.K.; Orosa, J.A.; Reiter, S. Life Cycle Assessment of Waste Products of a Green-Neighbourhood. Waste Biomass- Valorization 2022, 13, 3639–3651. [Google Scholar] [CrossRef]
- Nematchoua, M.K.; Asadi, S.; Obonyo, E.; Reiter, S. Environmental analysis of health damages coming from a residential neighborhood built in 150 countries. J. Hous. Built Environ. 2022, 37, 1643–1665. [Google Scholar] [CrossRef]
Disclaimer/Publisher’s Note: The statements, opinions and data contained in all publications are solely those of the individual author(s) and contributor(s) and not of MDPI and/or the editor(s). MDPI and/or the editor(s) disclaim responsibility for any injury to people or property resulting from any ideas, methods, instructions or products referred to in the content. |
© 2023 by the authors. Licensee MDPI, Basel, Switzerland. This article is an open access article distributed under the terms and conditions of the Creative Commons Attribution (CC BY) license (https://creativecommons.org/licenses/by/4.0/).