Abstract
The differential entropy of a continuous waveform is defined over the period spanned by the recording. The time-dependent information dynamics of the observed process are not accessible to this measure. We review here the construction and validation of approximate time-dependent measures of information dynamics.
1. Introduction
The object of this investigation is to review and extend methods for approximating time-dependent information dynamics and then proceed to their use in the dynamical characterization of information movement in networks. The investigation is constructed in four steps.
- Local entropy rate and specific entropy rate: approximate continuous time measures of information generation
- Specific transfer entropy: an approximate continuous time measure of information movement
- Time-dependent measures of information movement in networks
- Hierarchical transition chronometries in information networks
2. Local Entropy Rate and Specific Entropy Rate
Consider a time series Time is the time when was observed. Local entropy rate, , is a time-dependent, locally determined conditional entropy where the entropy of an observed variable is conditioned on its past. It quantifies the surprise on observing given the preceding values . , can be interpreted as the rate of information generation at time t [1,2] (It is a single number that is a function of p + 1 inputs.
The essential step in the analysis is to recognize the relationship between a conditional density function, the joint distribution, and the marginal distribution. Specifically,
The subscript −i is used to indicate that the value is not used when evaluating the local entropy rate at time . Density functions can be approximated by kernel density estimation [3,4]) or by k-th nearest neighbor estimation [5] Autoregressive order p can be determined by the minimization of a negative log predictive likelihood.
The local entropy rate is exquisitely sensitive to noise. This is consistent with its definition. Noise at time reflects information generation at time and is reflected in the value of the local entropy rate. Noise is usually not, however, particularly interesting. This difficulty is addressed with a specific entropy rate [6] Like the local entropy rate, the specific entropy rate is a time-dependent, locally determined measure. In this case, the specific entropy rate gives a quantitative estimate of uncertainty at time . Specific entropy rate differs from local entropy rate in being an average of local entropy rate over a defined set. Therefore, it is intermediate to the local entropy rate, where no averaging occurs, and the total entropy rate, which is the average of all available values of the local entropy rate.
A summary is given by Gilpin et al. [7] “Local and specific entropy rates quantify complementary properties of a dynamical system. If we have a time series representing an observable, the local entropy rate (LER) represents the statistical surprise of seeing an already observed local future given specific past. It also can be thought of as the rate of information generation at a given time point. The specific entropy rate (SER) represents the statistical uncertainty in an as yet unobserved future given a specific past. The LER, in isolation, is a retrospective measure, and the SER is a prospective measure, and each yields distinct information about the behavior of the dynamical system.” The notation is used to emphasize the fact that specific entropy rate is determined by values in the past. The present, , is not an argument of the specific entropy rate.
An operational requirement is the specification of the procedure used to calculate a specific entropy rate from a subset of local entropy rate values. An unnecessarily simplistic response would be a moving average. As an alternative, note that the set is a point in an dimensional space. Averaging local entropy rate values from points close to exploits the possibility, suggested by the Takens embedding theorem [8] that these points are subject to a dynamical process similar to that in operation at point . Ideally, one examines the same underlying dynamics at each point in the average, and noise will be reduced in the averaging process. We refer to this as dynamical adjacency in contrast with the temporal adjacency of a moving average. The estimator for the specific entropy rate is as follows:
is the set of the indices of the points closest to . An appropriate value of can be determined by a split-half minimization argument.
3. Specific Transfer Entropy
In the simplest case, consider two sources producing simultaneously measured time series. There is a long history of procedures that can be used to quantify the correlation between time series. These correlation measures do not, however, quantify information movement between the two sources. In the “Treatise Concerning Human Knowledge,” Bishop Berkeley identified prediction rather than correlation as the essential criterion for causation [9] This is consistent with Wiener’s operationalization of causation. To paraphrase Wiener [10] if measuring variable X improves the prediction of variable Y, then Y is, in this very limited operational sense of causation, causally dependent on X. Where we recognize that the relationship is not necessarily unidirectional. Granger [11] introduced a measure of causal relations based on marginal predictability that has been used extensively in econometrics. It is recognized, however, that Granger causality can fail to detect nonlinear relationships. This motivated the introduction of alternative measures, most notably transfer entropy [12] As an example, Amblard and Michel [13] give an example system that has zero Granger causality in a system that detects information movement with transfer entropy.
Y is said to transfer information to X if the uncertainty in X alone exceeds the uncertainty in X given Y. Schreiber defined transfer entropy as the difference between the marginal conditional entropy and the joint conditional entropy. The corresponding local transfer entropy is defined as
Conditional entropies can be re-expressed
Again, recalling that a conditional density can be expressed as the ratio of a joint density and a marginal density, the estimator of is
The relationship between local transfer entropy and specific transfer entropy follows the logic established by local entropy rate and specific entropy rate. Specific transfer entropy is a local, dynamically informed average of local transfer entropy [14] (Darmon and Rapp, 2017).
The Figure 1 below shows the results of a simulation using a coupled Hénon map [14] Y is independent of X, but X includes a dependence on both Y and X. The top graph shows Y as a function of time, and the second shows X as a function of time. The third graph shows and correctly indicates a nonzero transfer of information from Y to X. The fourth graph shows , and because of simulated noise, it indicates a spurious nonzero transfer of information from X to Y, though the amplitude is less than that observed for . The fifth and sixth graphs show specific transfer entropy. The fifth graph shows the expected nonzero value for . In contrast to , is effectively zero.
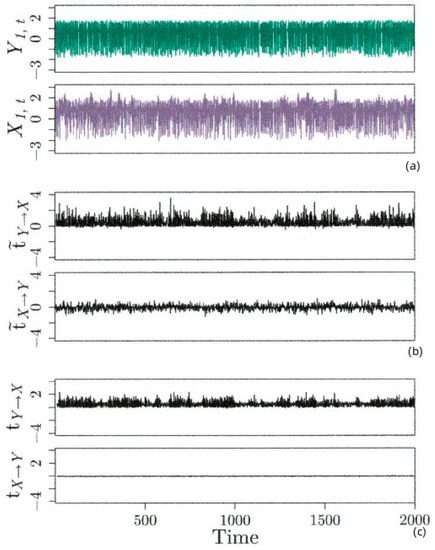
Figure 1.
Results for the unidirectionally coupled stochastic Hénon map. (a) Y and X time series, (b) local transfer entropy, (c) specific transfer entropy Reprinted with permission from [14].
4. Time-Dependent Measures of Information Movement in Networks
Networks consist of nodes and edges. Each node is not necessarily connected to all other nodes. When applied to the analysis of multichannel EEGs and event-related potentials, which is our primary interest area, the electrodes are nodes and edges are quantified by functional connectivity or information transfer. These between node relationships are summarized in the adjacency matrix.
In the simplest case, the relationship between two nodes is quantified by the correlation between the signals measured at the corresponding electrodes. A value of zero is entered in the matrix if the correlation is less than a threshold value, and a value of one is entered if the value is greater than the threshold. The resulting adjacency matrix is binary, symmetric, and static. If the correlation itself is entered, the adjacency matrix is real, symmetric, and static. Alternatively, transfer entropy can be used. As defined, transfer entropy, in contrast with specific transfer entropy, is not time-dependent, but the information movement from Node A to Node B is typically not the same as the information movement from Node B to Node A. Therefore, in this case the adjacency matrix is real, asymmetric, and static. If specific transfer entropy is used, the time-dependent behavior of information movement in a complex network is summarized in a matrix that is real, asymmetric, and time-dependent.
In principle, any measure that is applicable to a real, asymmetric, static adjacency matrix can be used iteratively at each time point to produce a time-dependent measure of matrix dynamics which we denote by . In many applications, particularly in the analysis of biological systems, the detection of transitions in network behavior is particularly interesting. This can now be implemented by an examination of the transition behavior of . This is addressed in the fourth step of the project.
5. Hierarchical Transition Chronometries in Information Networks
There is a large well developed mathematical technology for identifying transitions in a time series, but care must be exercised when using these methods. As previously argued, “the typically stated challenge, ‘find transition times in the time series’ is unacceptably naïve. Transitions are timescale dependent. A stock market change that is significant to a day trader is not necessarily important to a pension fund manager. The challenge to find a time series’ transitions must be revised: ‘find the transitions in time series X that are important on a timescale of Y’ [15].
One possible approach to meeting this requirement uses the quantification of recurrence diagrams. Recurrence diagrams were introduced by [16] with the specific objective of identifying subtle time-dependent transitions in dynamical systems. Recurrence diagrams provide a graphical representation of geometrical relationships between points in an embedded set. Quadrant scans [17] quantify this visually presented structure. A change in the system’s dynamics generating the time series produces a local maximum in the quadrant scan. A change in the embedding dimension changes the time scale of the transitions identified in the recurrence diagram, and there is a corresponding change in the time scale of the quadrant scan. The utility of this method in identifying hierarchical transition chronometries has yet to be explored.
6. Conclusions
We have presented a four-step analysis trajectory that begins with the measurement of a multichannel time series, proceeds with the construction of a time-dependent network, and concludes with the identification of transitions in the behavior of that network. Applications in the investigation of central nervous system psychopathology are now underway.
Author Contributions
All authors contributed to the development and validation of the mathematical methods presented here. P.E.R. was the primary author. Other contributors revised and edited subsequent versions of the manuscript. All authors have read and agreed to the published version of the manuscript.
Funding
Test and Evaluation of Physiologic Noninvasive Measurement Devices. United States Army Medical Materiel Command.
Institutional Review Board Statement
Not Applicable. This is a review of mathematical research.
Informed Consent Statement
Not Applicable. This is a review of mathematical research.
Data Availability Statement
Not Applicable. This is a review of mathematical research.
Conflicts of Interest
The opinions and assertions herein do not necessarily reflect the official policy or position of the Uniformed Services University, the Department of Defense, or the Henry M Jackson Foundation for the Advancement of Military Medicine. No conflicts of interest are reported.
References
- Lizier, J.T.; Prokopenko, M.; Zomaya, A.Y. Local information transfer as spatiotemporal filter for complex systems. Phys. Rev. E 2008, 77, 026110. [Google Scholar] [CrossRef] [PubMed]
- Lizier, J.T. Measuring the dynamics of information processing on a local scale in time and space. In Directed Information Measures in Neuroscience; Wibral, M., Vicente, R., Lizier, J.T., Eds.; Springer: New York, NY, USA, 2014; pp. 161–193. [Google Scholar]
- Silverman, B.W. Density Estimation for Statistics and Data Analysis; Chapman and Hall: New York, NY, USA, 1986. [Google Scholar]
- Scott, D.W. Multivariate Density Estimation: Theory, Practice and Visualization; John Wiley: New York, NY, USA, 1992. [Google Scholar]
- Biau, G.; Devroye, L. Lectures on the Nearest Neighbor Method; Springer Series in the Data Sciences; Springer: New York, NY, USA, 2015. [Google Scholar]
- Darmon, D. Specific differential entropy rate estimation for continuous-valued time series. Entropy 2016, 18, 190. [Google Scholar] [CrossRef]
- Gilpin, C.; Darmon, D.; Ziwy, Z.; Martens, C. Information dynamics of a nonlinear stochastic nanopore system. Entropy 2018, 20, 221. [Google Scholar] [CrossRef] [PubMed]
- Takens, F. Detecting Strange Attractors in Turbulence; Lecture Notes in Mathematics; Rand, D.A., Young, L.S., Eds.; Springer: New York, NY, USA, 1981; Volume 898, pp. 365–381. [Google Scholar]
- Berkeley, G. A Treatise on Principles of Human Knowledge; Wilkins, D.R., Ed.; Trinity College Dublin: Dublin, Ireland, 1982; p. 1710. [Google Scholar]
- Wiener, N. The theory of prediction. In Modern Mathematics for Engineers; Beckenbach, E.F., Ed.; McGraw Hill: New York, NY, USA, 1956; pp. 165–190. [Google Scholar]
- Granger, C.W.J. Investigating causal relations by econometric models and cross-spectral methods. Econometrica 1969, 37, 424–438. [Google Scholar] [CrossRef]
- Schreiber, T. Measuring information transfer. Phys. Rev. Lett. 2000, 85, 461–464. [Google Scholar] [CrossRef] [PubMed]
- Amblard, P.-O.; Michel, O.J.J. The relation between Granger causality and directed information flow: A review. Entropy 2013, 15, 113–143. [Google Scholar] [CrossRef]
- Darmon, D.; Rapp, P.E. Specific transfer entropy and other state-dependent transfer entropies for continuous-state input-output systems. Phys. Rev. E 2017, 96, 022121. [Google Scholar] [CrossRef] [PubMed]
- Rapp, P.E.; Darmon, D.; Cellucci, C.J.; Keyser, D.O. The physiological basis of consciousness: A clinical ambition and the insufficiency of current philosophical proposals. J. Conscious. Stud. 2018, 25, 191–205. [Google Scholar]
- Eckmann, J.-P.; Kamphorst, S.O.; Ruelle, D. Recurrence plots of dynamical systems. Europhys. Lett. 1987, 4, 973–977. [Google Scholar] [CrossRef]
- Rapp, P.E.; Darmon, D.M.; Cellucci, C.J. Hierarchical transition chronometries in the human central nervous system. In Proceedings of the International Conference on Nonlinear Theory and Applications, Santa Fe, NM, USA, 8–11 September 2013. [Google Scholar]
Disclaimer/Publisher’s Note: The statements, opinions and data contained in all publications are solely those of the individual author(s) and contributor(s) and not of MDPI and/or the editor(s). MDPI and/or the editor(s) disclaim responsibility for any injury to people or property resulting from any ideas, methods, instructions or products referred to in the content. |
© 2023 by the authors. Licensee MDPI, Basel, Switzerland. This article is an open access article distributed under the terms and conditions of the Creative Commons Attribution (CC BY) license (https://creativecommons.org/licenses/by/4.0/).