Proceeding Paper

Quantifying Bias in a Face Verification System †

by
Megan Frisella
1,*,‡,
Pooya Khorrami
2,
Jason Matterer
2,
Kendra Kratkiewicz
2 and
Pedro Torres-Carrasquillo
2
1
Department of Mathematics, Brown University, Providence, RI 02912, USA
2
Lincoln Laboratory, Massachusetts Institute of Technology, Lexington, MA 02421, USA
*
Author to whom correspondence should be addressed.
Presented at the AAAI Workshop on Artificial Intelligence with Biased or Scarce Data (AIBSD), Online, 28 February 2022.
Work done while author was an intern at MIT Lincoln Laboratory.
Comput. Sci. Math. Forum 2022, 3(1), 6; https://doi.org/10.3390/cmsf2022003006
Published: 20 April 2022

Abstract

:
Machine learning models perform face verification (FV) for a variety of highly consequential applications, such as biometric authentication, face identification, and surveillance. Many state-of-the-art FV systems suffer from unequal performance across demographic groups, which is commonly overlooked by evaluation measures that do not assess population-specific performance. Deployed systems with bias may result in serious harm against individuals or groups who experience underperformance. We explore several fairness definitions and metrics, attempting to quantify bias in Google’s FaceNet model. In addition to statistical fairness metrics, we analyze clustered face embeddings produced by the FV model. We link well-clustered embeddings (well-defined, dense clusters) for a demographic group to biased model performance against that group. We present the intuition that FV systems underperform on protected demographic groups because they are less sensitive to differences between features within those groups, as evidenced by clustered embeddings. We show how this performance discrepancy results from a combination of representation and aggregation bias.

1. Introduction

In light of increased reliance on ML in highly consequential applications such as pretrial risk assessment [1,2], occupation classification [3,4], and money lending [5], there is growing concern for the fairness of ML-powered systems [4,6,7,8,9,10]. Unequal performance across individuals and groups subject to a system may have unintended negative consequences for those who experience underperformance [6], potentially depriving them of opportunities, resources, or even freedoms.
Face verification (FV) and face recognition (FR) technologies are widely deployed in systems such as biometric authentication [11], face identification [12], and surveillance [13]. In FV, the input data are two face images and the classifications may be genuine (positive class) or imposters (negative class) [8]. FV/FR typically use a similarity measure (often cosine similarity) applied to a pair of face embeddings produced by the model [12]. There has been recent interest in assessing bias via these face embeddings [10].
Figure 1 presents a low-dimensional depiction of face embeddings generated by FaceNet [12], which clearly groups same-race and same-gender faces closely together, indicating that the model learned to identify the similarities between same-race, same-gender faces. Exploring the connection between embedded clusters of protected groups and biased performance [10] is an open area of research.
In this paper, we (1) identify and quantify sources of bias in a pretrained FaceNet model using statistical and cluster-based measures, and (2) analyze the connection between cluster quality and biased performance.

2. Related Work

2.1. Sources of Bias

We define bias in an ML system as follows. For a more complete discussion of sources of bias, see the work by Suresh and Guttag [15].
Historical Bias arises when injustice in the world conflicts with values we want encoded in a model. Since systemic injustice creates patterns reflected in data, historical bias can exist despite perfect sampling and representation.
Representation Bias arises when training data under-represent a subset of the target population and the model fails to optimize for the under-represented group(s).
Measurement Bias arises when data are a noisy proxy for the information we desire, e.g., in FV, camera quality and discretized race categories contribute to measurement bias.
Aggregation Bias arises when inappropriately using a “one-size-fits-all” model on distinct populations, as a single model may not generalize well to all subgroups.
Evaluation Bias arises when the evaluation dataset is not representative of the target population. An evaluation may purport good performance, but miss a disparity for populations under-represented in the benchmark dataset.
Deployment Bias arises from inconsistency between the problem that a model is intended to solve and how it is used to make decisions in practice, as there is no guarantee that measured performance and fairness will persist.

2.2. Statistical Fairness Definitions

We first identify attributes of the data for which the system must perform fairly. An attribute may be any qualitative or quantitative descriptor of the data, such as name, gender, or image quality for a face image. A “sensitive” attribute defines a mapping to advantaged and disadvantaged groups [6], breaking a dataset into “unprotected” and “protected” groups. For example, if race is the sensitive attribute, the dataset is broken into an unprotected group, White faces, and protected groups, other-race faces.
We define fairness according to the equal metrics criteria [6,15,16,17,18]: a fair model yields similar performance metric results for protected and unprotected subgroups. Other fairness definitions include group-independent predictions [6,15,19,20] (a fair model’s decision is not influenced by group membership with respect to a sensitive attribute), individual fairness [6,15,21,22,23] (individuals who are similar with respect to their attributes have similar outcomes), and causal fairness [6,15,24,25,26] (developing requirements on a causal graph that links data/attributes to outcomes).
We quantify fairness according to the equal metrics definition using statistical fairness metrics (see Table 1). The metrics use the definitions represented by the confusion matrix in Table 3 of Verma and Rubin [7].

2.3. Bias in the Embedding Space

Instead of solely considering model performance across protected and unprotected groups, Gluge et al. [10] assess bias in FV models by investigating the face embeddings produced by the model. The intuition behind this approach is that the “other-race effect” observed in human FV, where people are able to distinguish between same-race faces better than other-race faces, may have an analog in machine FV that is observable in how a model clusters face embeddings according to sensitive attributes such as race, gender, or age.
Gluge et al. [10] attempt to measure bias with respect to a sensitive attribute by quantifying how well embeddings are clustered according to that attribute. They hypothesize that a “good” clustering of embeddings (i.e., well-separated clusters) into race, gender, or age groups may indicate that the model is very aware of race, gender, or age differences, allowing for discrimination based on the respective attribute. They investigate the connection between quality of clustering and bias using cluster validation measures.
Their results do not support a connection between well-defined sensitive attribute clusters and bias; rather, they suggest that a worse clustering of embeddings into sensitive attribute groups yields biased performance (i.e., unequal recognition rates across groups). They conjecture that between-cluster separation (i.e., how well race, gender, or age groups are separated from each other) may be less important than the within-cluster distribution of embeddings (i.e., how well each individual race, gender, or age group is clustered), intuiting that a cluster’s density indicates how similar or dissimilar its embeddings are according to their separation from each other. Thus, a dense cluster may purport false matches more frequently than a less dense cluster. We extend [10] by investigating this conjecture.

3. Method

We experiment using an FV pipeline to evaluate FaceNet [12] on four benchmark datasets. We quantify bias according to the “equal metrics” fairness definition with several distinct statistical fairness metrics, revealing representation bias. We then evaluate clustered embeddings with respect to race and gender groups using clustering metrics and visualizations, revealing aggregation bias. Using the statistical and cluster-based analyses, we draw conclusions on the connection between the clustering of faces into protected and unprotected groups and disparity in model performance between these groups. Figure 2 provides an overview of our method.

3.1. FV Pipeline

We use MTCNN [29] for face detection and a facenet-pytorch Inception V1 model (https://github.com/timesler/facenet-pytorch, accessed on 28 February 2022), cutting out the final, fully connected layer from the FaceNet model so that it produces face embeddings. The constructed pipeline follows.
  • Pass a pair of face images to MTCNN to crop them to bounding boxes around the faces (we discard data where MTCNN detects no faces). Each input pair has an “actual classification” of 1 (genuine) or 0 (imposter).
  • Pass each cropped image tensor into the model (FaceNet, for our experiments) to produce two face embeddings.
  • Compute the cosine similarity between the two embeddings (the “similarity score”).
  • Use a pre-determined threshold (the threshold is determined according to a false accept rate (FAR) of 0.05 on a 20% heldout validation set; all datasets have no overlap between people in the testing and validation splits) to produce a “predicted classification” of 1 (genuine) or 0 (imposter).
As detailed in [12], FaceNet is trained using triplet loss on the VGGFace2 dataset [30], comprising faces that are 74.2% White, 15.8% Black, 6.0% Asian, and 4.0% Indian, with 59.3% male and 40.7% female [30].

3.2. Datasets

We run experiments on four benchmark datasets: Balanced Faces in the Wild (BFW) [8], Racial Faces in the Wild (RFW) [31,32,33,34], Janus-C [35], and the VGGFace2 [30] test set. Details for each dataset are provided in Table 2.
We discuss results primarily for BFW experiments because the dataset is balanced for race and gender. Balance in the sensitive attributes allows valid comparison between results for protected and unprotected groups. BFW comes with pre-generated face pairs with a ratio of 47:53 positive to negative pairs. However, we generate our own positive and negative pairs in order to control holding out 20% of people in the dataset for a validation set.
Table 3 shows the breakdown of our positive and negative pairs by race/gender subgroups for the BFW testing split. Ratios for the validation set are similar. Positive and negative pairs have same-race and same-gender faces. The supplemental material documents pair generation for RFW, Janus-C, and VGGFace2.
We use race and gender as sensitive attributes to examine race, gender, and intersectional race/gender biases [9] in our FV system. The race attribute encompasses four groups (Asian, Indian, Black, and White) consistent across all datasets with a “race” attribute.

3.3. Statistical Fairness

To quantify bias according to the “equal metrics” fairness definition, we use nine statistical fairness metrics to evaluate FaceNet model performance on protected and unprotected groups for each sensitive attribute across the four benchmark datasets. We generate bootstrap confidence intervals for all metric results [36].
We compare results between the protected and unprotected groups of each sensitive attribute to identify inequality in model performance, and present seven of the statistical fairness metric results on BFW in this paper (see Table 1 for details). The supplemental material documents results for additional metrics and datasets.

3.4. Cluster-Based Fairness

We extend Gluge et al. [10] by evaluating clustered embeddings to illuminate any connection between sensitive-attribute cluster quality and model performance for protected and unprotected subgroups. For example, we may consider face embeddings from the BFW dataset to be clustered according to race (four clusters), gender (two clusters), or race/gender (eight clusters). Figure 1 provides a low-dimensional depiction of the BFW embedding space, where groups are distinguished by race/gender.
Based on the findings of [10], we hypothesize a connection between the quality of embedded clusters and model performance, where dense clustering for a particular subgroup is linked to poor performance on that group. Intuition suggests that dense clustering indicates high model confidence in the group affiliation of embeddings within that cluster, but lesser ability to distinguish between individuals within the cluster compared to a less dense group of embeddings. We evaluate clustered embeddings through (1) clustering metrics, and (2) intra-cluster visualizations.
Clustering Metrics We employ the following three metrics [10] to assess embedding space partitioning into clusters according to each sensitive attribute.
  • Mean silhouette coefficient [37]: A value in the range [−1, 1] indicating how similar elements are to their own cluster. A higher value indicates that elements are more similar to their own cluster and less similar to other clusters (good clustering).
  • Calinski–Harabasz index [38]: The ratio of between-cluster variance and within-cluster variance. A larger index means greater separation between clusters and less within clusters (good clustering).
  • Davies–Bouldin index [39]: A value greater than or equal to zero aggregating the average similarity measure of each cluster with its most similar cluster, judging cluster separation according to their dissimilarity (a lower index means better clustering).
Intra-Cluster Visualizations To observe whether or not there is inequality in the embedded cluster quality of protected and unprotected groups, we produce intra-cluster visualizations and compare clusters using pairwise distance distribution, centroid distance distribution, and persistent homology H 0 death time distribution [40,41].

4. Experiments

4.1. Statistical Fairness Metrics

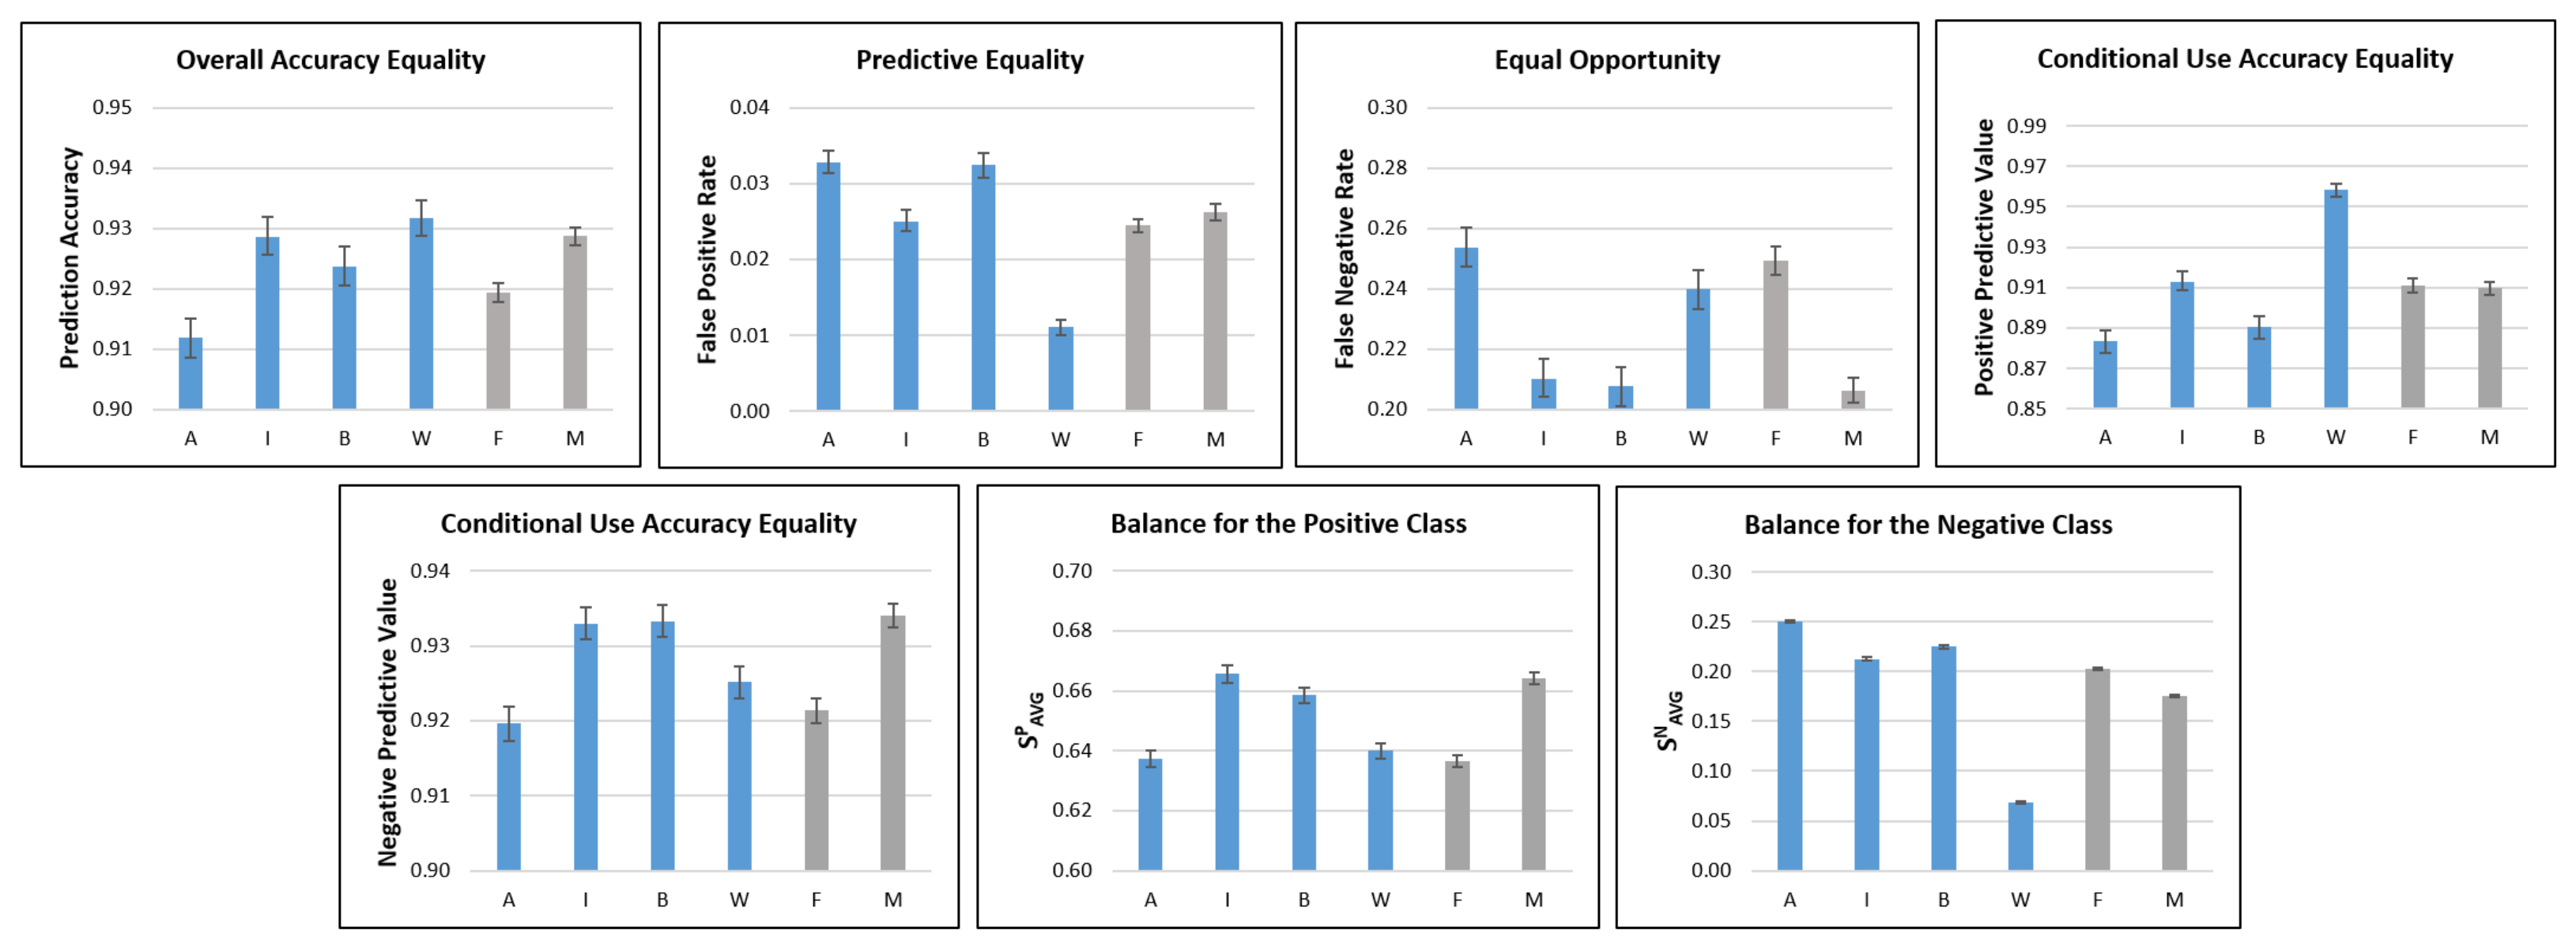
Figure 3 presents statistical fairness metric results for BFW race and gender subgroups; the supplemental materials include complete results for all datasets.
While results do not consistently favor one race group, a pattern of bias emerges when considering each metric’s implications. Prediction accuracy for Asian faces is lower, but no single race group exhibits significantly better performance than the rest (there is overlap between the confidence intervals of Indian, Black, and White faces). The same observation applies to FNR (lower FNR is better; the Indian and Black confidence intervals overlap) and NPV (higher NPV is better; the Indian and Black confidence intervals overlap). However, FPR and PPV tell a different story.
The model has a low FPR for White faces compared to other race groups, indicating more confidence in White non-matches than for other-race faces. A similar observation is made for PPV; the model is considerably more precise in determining genuine White face pairs compared to other races. The statistics on average similarity score for the positive and negative classes provide an explanation for these results.
Average similarity scores for genuine pairs across race groups are relatively similar (~0.03 range), but not for imposter pairs (~0.18 range). Low average similarity scores for White imposter pairs indicate that the model separates non-match White faces very well, hence its confidence in identifying imposter White face pairs (low FPR). Some metrics do not reveal this bias due to comparable average similarity scores across races for genuine pairs; the model is approximately equally confident in identifying genuine pairs for all races, as supported by a similar FNR across race groups.
The inequality in average similarity scores for imposter pairs means that the model learned to distinguish White faces much better than other-race faces, possibly due to encountering significantly more White faces than other-race faces during training. Thus, we identify representation bias as the first form of bias affecting FaceNet. The consistently poor performance on Asian faces, less represented in the training data, supports representation bias. However, despite having the least representation, the metrics indicate better model performance on Indian as compared to Asian faces, hinting that additional biases may be present.
Results for gender subgroups show a performance gap favoring the unprotected (male) vs. protected (female) gender group. However, the performance gaps for female vs. male faces are not as drastic as those for White vs. other-race faces (e.g., balance for the negative class). The lower average similarity score for imposter male faces and higher average similarity score for genuine male faces supports the model’s higher confidence in identifying genuine male face pairs (lower FNR). Differences in FPR are insignificant (confidence intervals overlap). The bias in average similarity scores appears in a higher prediction accuracy for male as compared to female face pairs.
We conclude that the gender results are a less extreme example of representation bias, supported by the race and gender breakdown of the training dataset, which is more skewed for race than for gender subgroups.

4.2. Clustering Metrics

We assess embedding clusters using (1) the clustering metrics described in Section 3.4, calculated for each sensitive attribute, and (2) intra-cluster visualizations. Table 4 shows results for BFW; results for other datasets are available in the supplemental material.
The trend in mean silhouette coefficient, which quantifies the similarity of elements to their own cluster, appears to vary with the number of clusters per sensitive attribute (i.e., attributes with more clusters have a higher mean silhouette coefficient). Results for the Davies–Bouldin index follow the same pattern, indicating that race/gender clusters are best separated according to similarity, followed by race clusters and then gender clusters.
Results for the Calinski–Harabasz index, quantifying the ratio of between-cluster variance and within-cluster variance, differ. A higher index for race compared to race/gender means that mixed-gender race clusters are better separated than single-gender race/gender clusters. This result indicates that gender clusters within a race are close together compared to the distance between racial groups, a property that is visualized in Figure 1.
While these metrics provide a thorough summary of embeddings clustered by sensitive attributes, they do not help us to understand how protected and unprotected groups within each sensitive attribute are clustered.

4.3. Intra-Cluster Fairness Visualizations

We use intra-cluster visualizations to observe within-group clustering inequality between protected and unprotected groups in order to identify a potential connection between cluster quality and statistical metric performance.
For each intra-cluster distribution visualization, we perform two-sided independent two-sample t-tests for every combination of two subgroups in order to identify whether or not the means of two subgroups’ distributions are significantly different. (Our null hypothesis for every t-test is that there is no difference in sample mean between the distributions for two subgroups. We accept an alpha level of 0.05 to determine statistical significance.) We perform Dunn–Šidák correction (for BFW, we account for twenty-one null hypotheses comprising all two-subgroup combinations of race and gender subgroups) of the p-values for each dataset to counteract the multiple comparison problem. Corrected p-values of the t-tests for BFW subgroup pairs are documented in the supplemental material.

4.3.1. Pairwise Distance Distribution

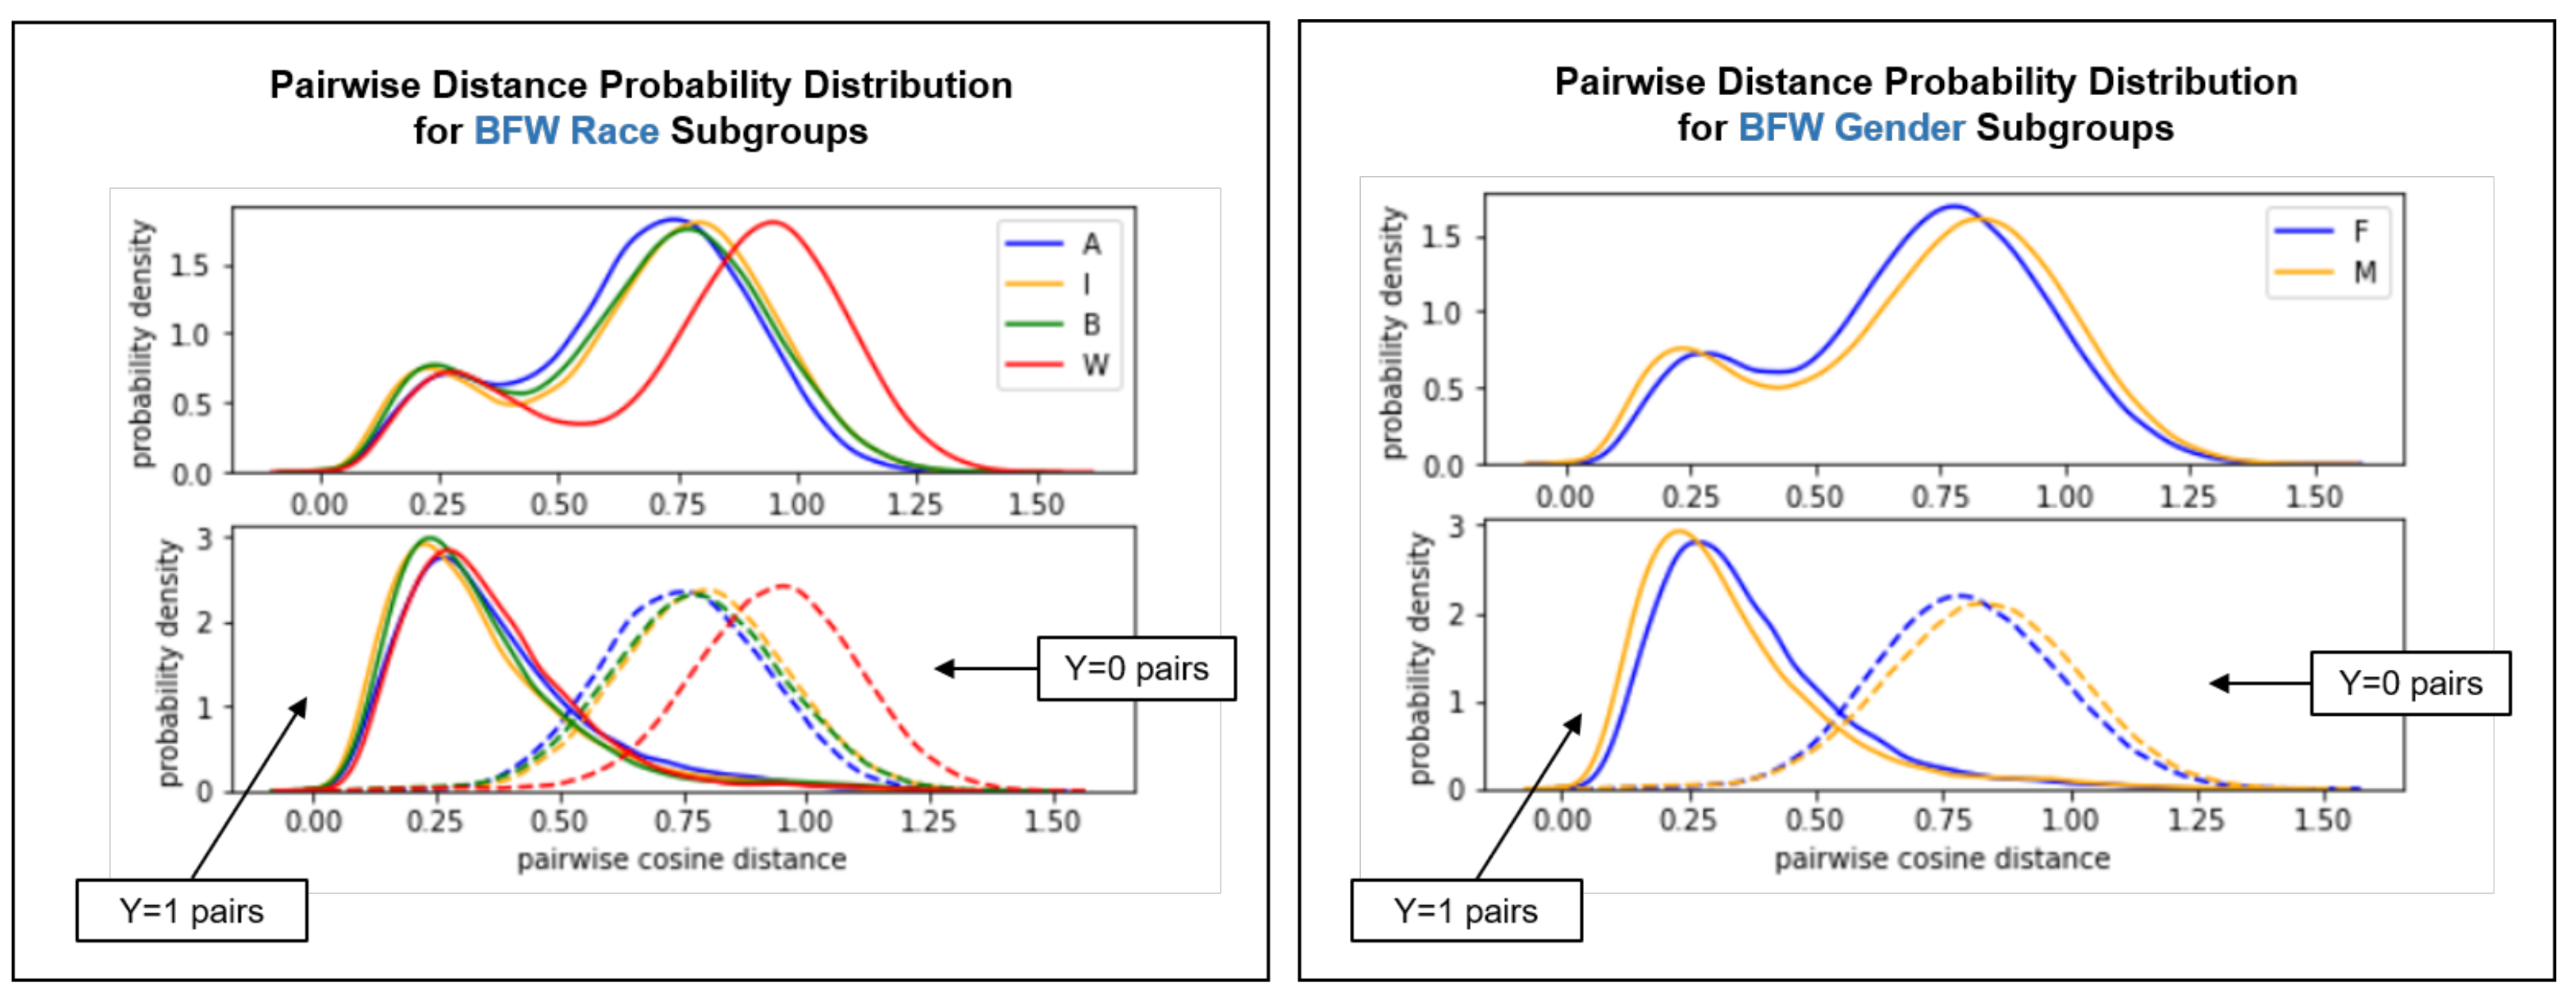
Figure 4 depicts a probability density distribution for within-subgroup pairwise distances for BFW race and gender subgroups.
The White subgroup’s negative class plot has a distinct rightward shift compared to other subgroups (p < 0.05 for W × A , W × I , and W × B t-tests), supporting the lower average similarity score for imposter White pairs seen in Figure 3. Consequently, the optimal classification threshold varies by race group; the overlap between the positive and negative class curves for White faces is further right than for other races. Thus, the average threshold will be lower than optimal for Asian, Indian, and Black face pairs, leading to more frequent false positives (supported by Figure 3).
We conclude that aggregation bias is present because the classifier relies on one aggregated, sub-optimal threshold for all subgroups [8]. Although the difference between the pairwise distance distributions of gender subgroups is smaller, it is not supported by an insignificant p-value (p < 0.05).

4.3.2. Centroid Distance Distribution

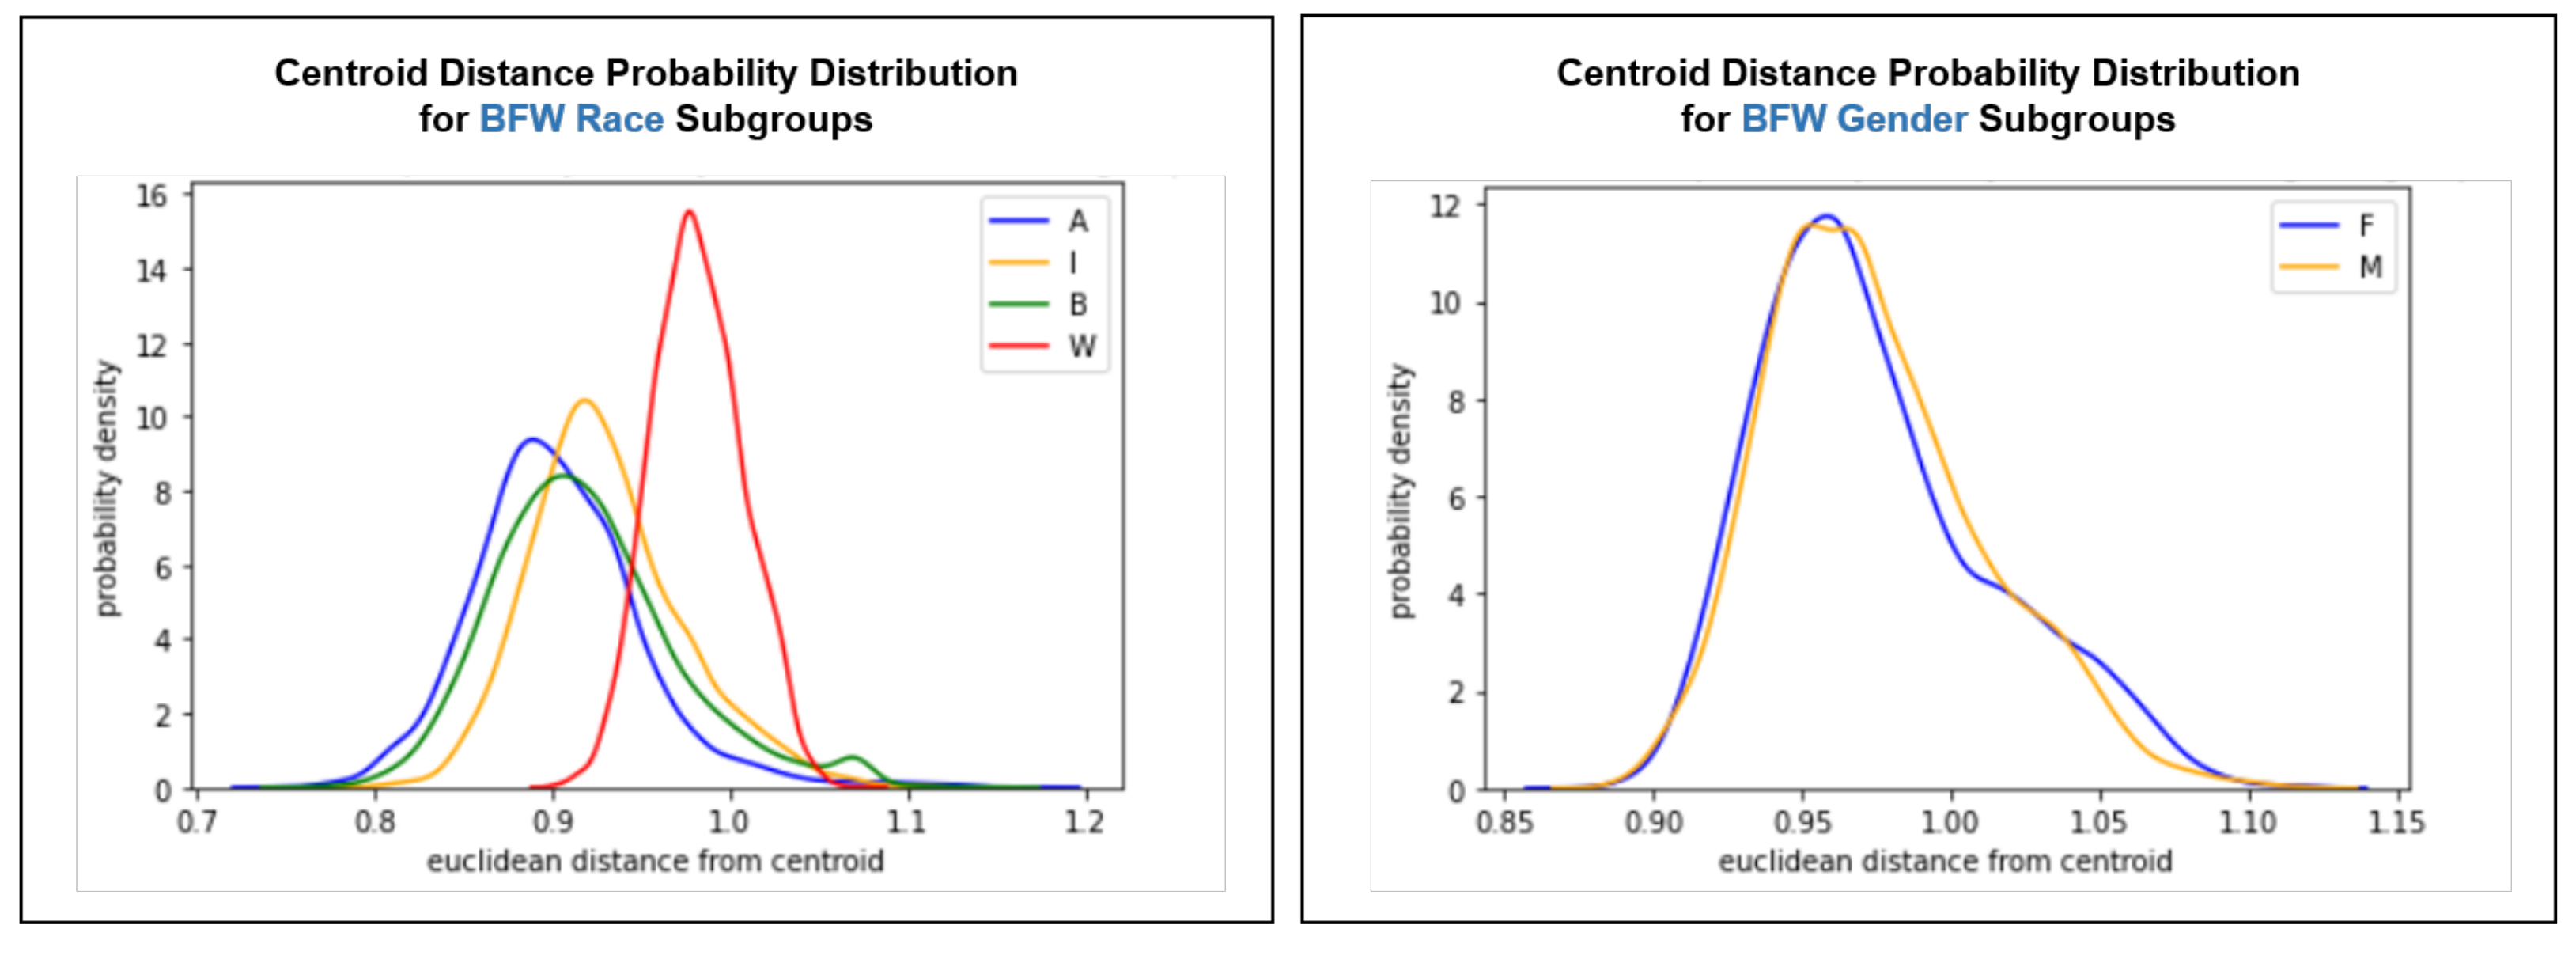
Figure 5 depicts a probability density distribution of embedding distances from the centroids of their respective race and gender subgroups for BFW. We use this as a supplementary visualization for within-cluster distances.
The centroid distance distributions for race subgroups tell a story similar to the pairwise distance distributions, but slightly more nuanced. Faces are uniformly distributed significantly further from the White centroid than in other race groups (p < 0.05 for W × A , W × I , and W × B t-tests). The behavior of Euclidean distance in high-dimensional space [42] suggests that the rightward shift of the White subgroup’s plot indicates that White face embeddings are distributed less densely than other race groups. The plots for gender subgroups indicate comparable cluster densities (p > 0.05). Thus, centroid distance distribution supports findings from pairwise distance distribution by confirming that White embeddings are better separated than other-race embeddings. It also supports the findings from statistical metrics by demonstrating that there is less inequality between gender clusterings as compared to race clusterings.

4.3.3. Persistent Homology

Our final experiment conducts a more rigorous analysis of the high-dimensional geometry of embedding clusters using persistent homology [40,41], which investigates qualitative information about the structure of data and is suited to high-dimensional, noisy data. Figure 6 depicts density plots for death times of the 0th homology class ( H 0 ) [43] for BFW race and gender subgroups in order to observe trends in the evolution of connected components. “Death time” indicates how many timesteps pass before a connected component “dies” (becomes connected with another component). Thus, death times of connected components is an indicator of the distance between embeddings in the embedding space (i.e., earlier death times indicate that embeddings are generally closer together).
H 0 death times for White face embeddings tend to be later than other race groups (p < 0.05 for W × A , W × I , and W × B t-tests), indicating that White embeddings are more dispersed in the embedding space. The other race groups have peak death times that are taller and earlier than the White race group. The shorter and wider peak for the White subgroup means that there is more variety (higher variance) in H 0 death times, rather than the consistent peak around 0.8 with less variance for other race groups. This shows that there is more variance for White face distribution in the embedding space compared to other race groups, a trend that was not present in the centroid distance distribution for race groups, which showed four bell-shaped density plots. Thus, our analysis of the ( H 0 ) death times supports previous findings that the White race group is clustered differently to other race groups. We note that there is less inequality in H 0 death times for female vs. male faces, despite our p-value indicating that this discrepancy may be significant (p < 0.05).

5. Conclusions

We quantify bias in a FaceNet FV system with statistical fairness metrics and clustered embedding evaluations. Unequal statistical metric performance for protected and unprotected race groups reflects representation inequality in the training data, implicating representation bias. However, superior prediction accuracy for some less-represented race groups (e.g., better performance on Indian faces than Asian faces) demonstrates that representation bias is not the only bias present.
Pairwise distance distributions and unequal “balance for the positive/negative class” statistical metrics indicate that the optimal classification threshold varies by race group. Thus, the aggregated classification threshold is skewed lower than optimal for protected race groups, identifying the presence of aggregation bias in the FaceNet FV system.
We demonstrate correspondence between poorly clustered subgroups and those with the best statistical metric performance, supporting our hypothesis that worse clustering may result in less bias. We thus support the intuition that the model learns to distinguish between faces in less dense clusters better than between faces in more dense clusters.
In summary, the model was optimized to perform best on White and male faces due to representation and aggregation bias, resulting in a less dense clustering of unprotected groups in the embedding space. We conclude that FaceNet underperforms on protected demographic groups because, as denser clustering shows, it is less sensitive to differences between facial characteristics within those groups.
Our experiments implicate cluster quality as an apparent indicator of bias, but do not prove causality. We identify causal fairness as an area of future investigation to supplement this work [25]. We also believe that conducting a more rigorous clustering analysis using persistent homology (i.e., quantifying the difference between persistence diagrams) would strengthen the results presented here. Finally, we see potential in applying the metrics used in this paper to multi-class classification problems (namely, FR instead of FV) in both open- and closed-world settings.
The Appendix A, Appendix B, Appendix C and Appendix D provides results from experiments not detailed in the main paper. We first document positive and negative pair generation for Racial Faces in the Wild (RFW) [31], Janus-C [35], and the VGGFace2 [30] test set. We then include results from statistical fairness metrics, clustering metrics, and intra-cluster visualization for Balanced Faces in the Wild (BFW) [8], RFW, Janus-C, and the VGGFace2 test set.

Author Contributions

Conceptualization, M.F., P.K., J.M., K.K. and P.T.-C.; methodology, M.F. and J.M.; software, M.F., P.K. and J.M.; validation, M.F., P.K., J.M. and K.K.; formal analysis, M.F.; investigation, M.F.; resources, P.K., J.M. and K.K.; data curation, M.F.; writing—original draft preparation, M.F.; writing—review and editing, M.F., P.K., J.M. and K.K.; visualization, M.F.; supervision, P.K., J.M. and K.K.; project administration, P.K.; funding acquisition, P.T.-C. All authors have read and agreed to the published version of the manuscript.

Funding

DISTRIBUTION STATEMENT A. Approved for public release. Distribution is unlimited. This material is based upon work supported by the Department of Defense under Air Force Contract No. FA8702-15-D-0001. Any opinions, findings, conclusions, or recommendations expressed in this material are those of the author(s) and do not necessarily reflect the views of the Department of Defense.

Institutional Review Board Statement

Not applicable.

Informed Consent Statement

Not applicable.

Data Availability Statement

The BFW dataset contains third-party data and is available upon registration/request from the original dataset authors at https://forms.gle/3HDBikmz36i9DnFf7 (accessed on 28 February 2022). The RFIW dataset contains third-party data and is available upon request from the original dataset authors at http://whdeng.cn/RFW/testing.html (accessed on 28 February 2022). The VGGFace2 test set contains third-party data and must be requested from the original dataset authors (https://doi.org/10.1109/FG.2018.00020, accessed on 28 February 2022). The Janus-C dataset contains third-party data and is available upon request from NIST (not corresponding author) at https://www.nist.gov/itl/iad/ig/ijb-c-dataset-request-form (accessed on 28 February 2022).

Acknowledgments

The authors would like to thank Joseph Robinson and Mei Wang for granting access to the BFW and RFW datasets, respectively. This product contains or makes use of the following data made available by the Intelligence Advanced Research Projects Activity (IARPA): IARPA Janus Benchmark C (IJB-C) data detailed at Face Challenges homepage (https://www.nist.gov/programs-projects/face-challenges, accessed on 28 February 2022).

Conflicts of Interest

The authors declare no conflict of interest.

Abbreviations

The following abbreviations are used in this manuscript:
BFWBalanced Faces in the Wild
CHCalinski–Harabasz Index
DBDavies–Bouldin Index
FNRFalse Negative Rate
FPRFalse Positive Rate
FRFace Recognition
FVFace Verification
IJBCIARPA Janus Benchmark C
MLMachine Learning
MSMean Silhouette Coefficient
MTCNNMulti-Task Cascaded Convolutional Networks
NPVNegative Predictive Value
PPVPositive Predictive Value
RFWRacial Faces in the Wild
t-SNEt-distributed Stochastic Neighbor Embedding

Appendix A. Pair Generation

Racial Faces in the WildTable A1 displays the breakdown of positive and negative pairs for the RFW testing split for each race subgroup. Positive and negative pairs are same-race faces (there is no gender attribute for this dataset).
Table A1. The test set percentages of positive and negative pairs generated per subgroup for RFW.
AsianIndianBlackWhite
% positive25.025.025.225.0
% negative75.075.074.875.0
Janus-CTable A2 details the Janus-C test set’s positive and negative pairs across skin tone and gender subgroups. All pairs are same-skin-tone and same-gender faces. Because Janus-C is not balanced over sensitive attributes, we had to vary positive and negative pair generation for each skin tone and gender subgroup. The drastically different number of faces across skin tones and genders make it difficult to achieve parity in the number of pairs for these subgroups while maintaining a large enough sample for testing. This should be considered when interpreting Janus-C results.
Table A2. The test set percentages of positive and negative pairs generated per subgroup for Janus-C.
Female123456
% positive54.940.636.514.914.47.1
% negative45.159.463.585.185.692.9
Male123456
% positive54.737.329.513.78.65.5
% negative45.362.770.586.391.494.5
VGGFace2 Test SetTable A3 shows the breakdown across gender subgroups of positive and negative pairs for the VGG testing split. All pairs are same-gender faces (VGGFace2 does not have a race attribute). The VGGFace2 test set is not balanced over its sensitive attribute, so we had to vary positive and negative pair generation by gender subgroup. Because VGGFace2 has less inequality than Janus-C in number of faces per subgroup, we achieved positive to negative pair ratios much closer to 25:75.
Figure A1. Statistical fairness metric results for BFW subgroups. A = Asian; I = Indian; B = Black; W = White; F = Female; M = Male.
Csmf 03 00006 g0a1
Table A3. The test set percentages of positive and negative pairs generated per subgroup for the VGGFace2 test set.
FemaleMale
% positive23.629.6
% negative76.470.4

Appendix B. Statistical Fairness Metric Experiments

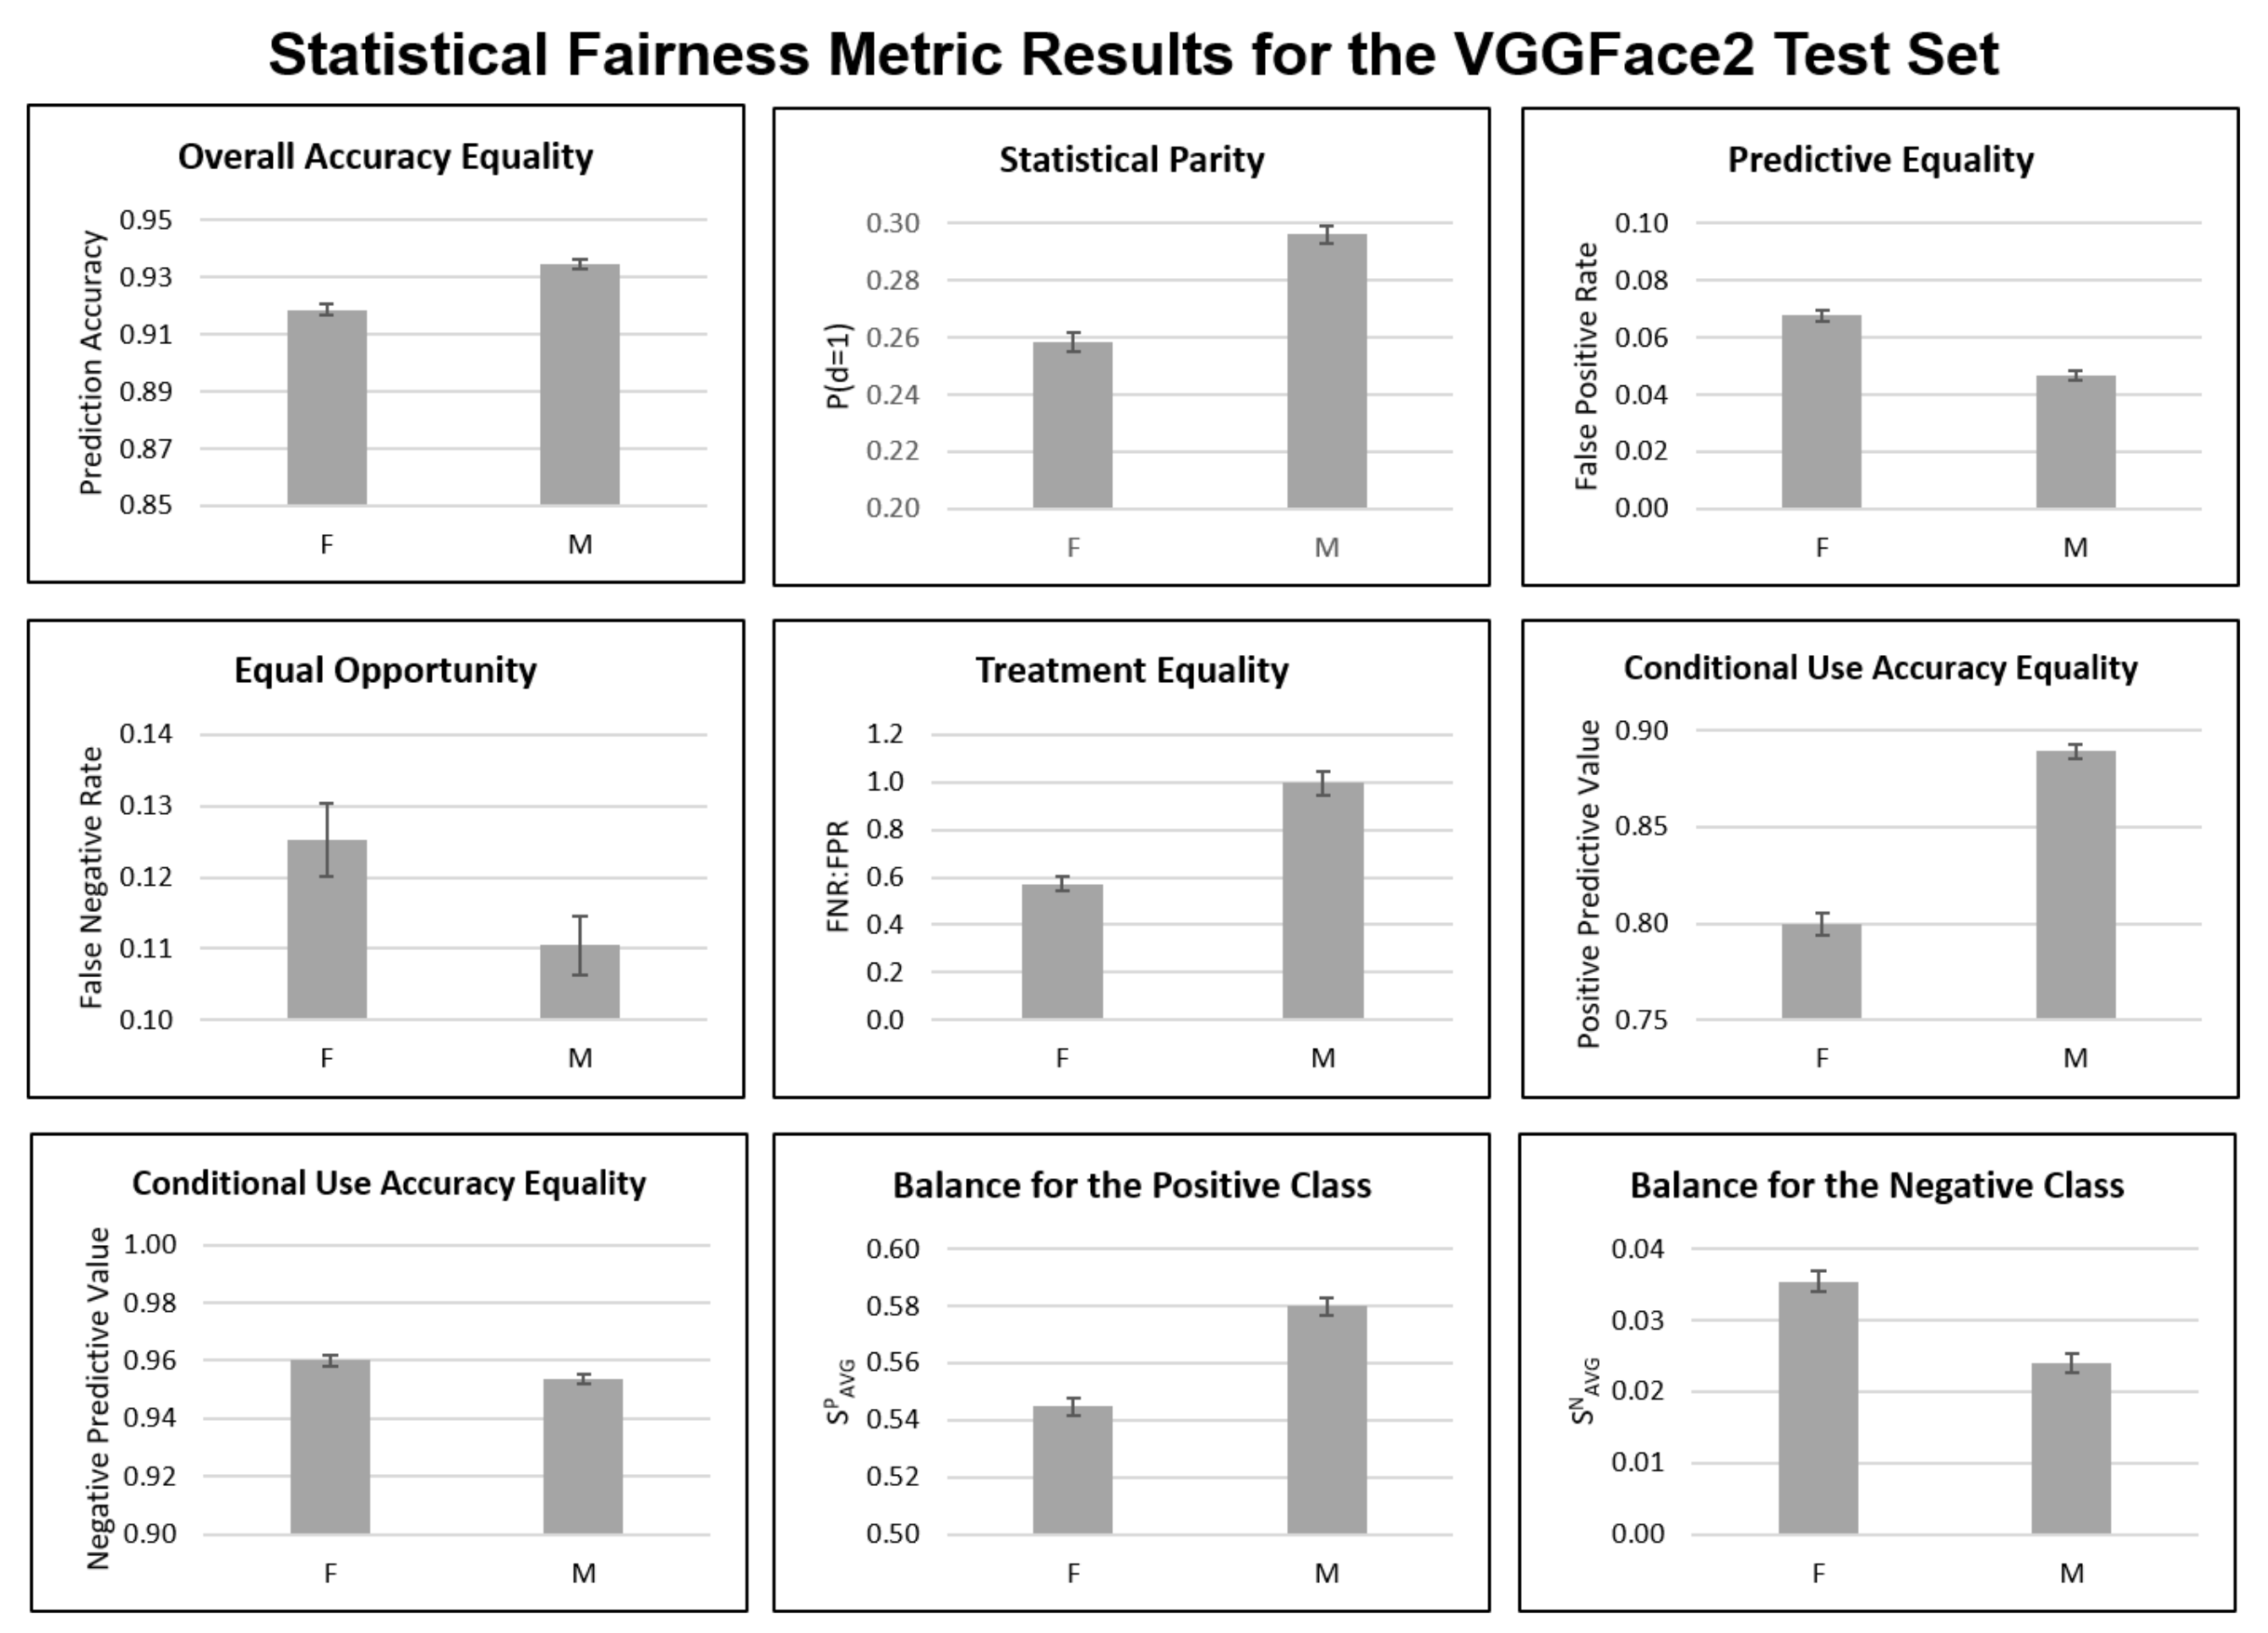
Figure A1 documents statistical metric results for BFW data that are not included in the main paper, while Figure A2 and Figure A3 document results for RFW and VGGFace2, respectively.
Figure A2. Statistical fairness metric results for RFW race subgroups. A = Asian; I = Indian; B = Black; W = White.
Csmf 03 00006 g0a2
Figure A3. Statistical fairness metric results for VGGFace2 test set gender subgroups. F = Female; M = Male.
Csmf 03 00006 g0a3
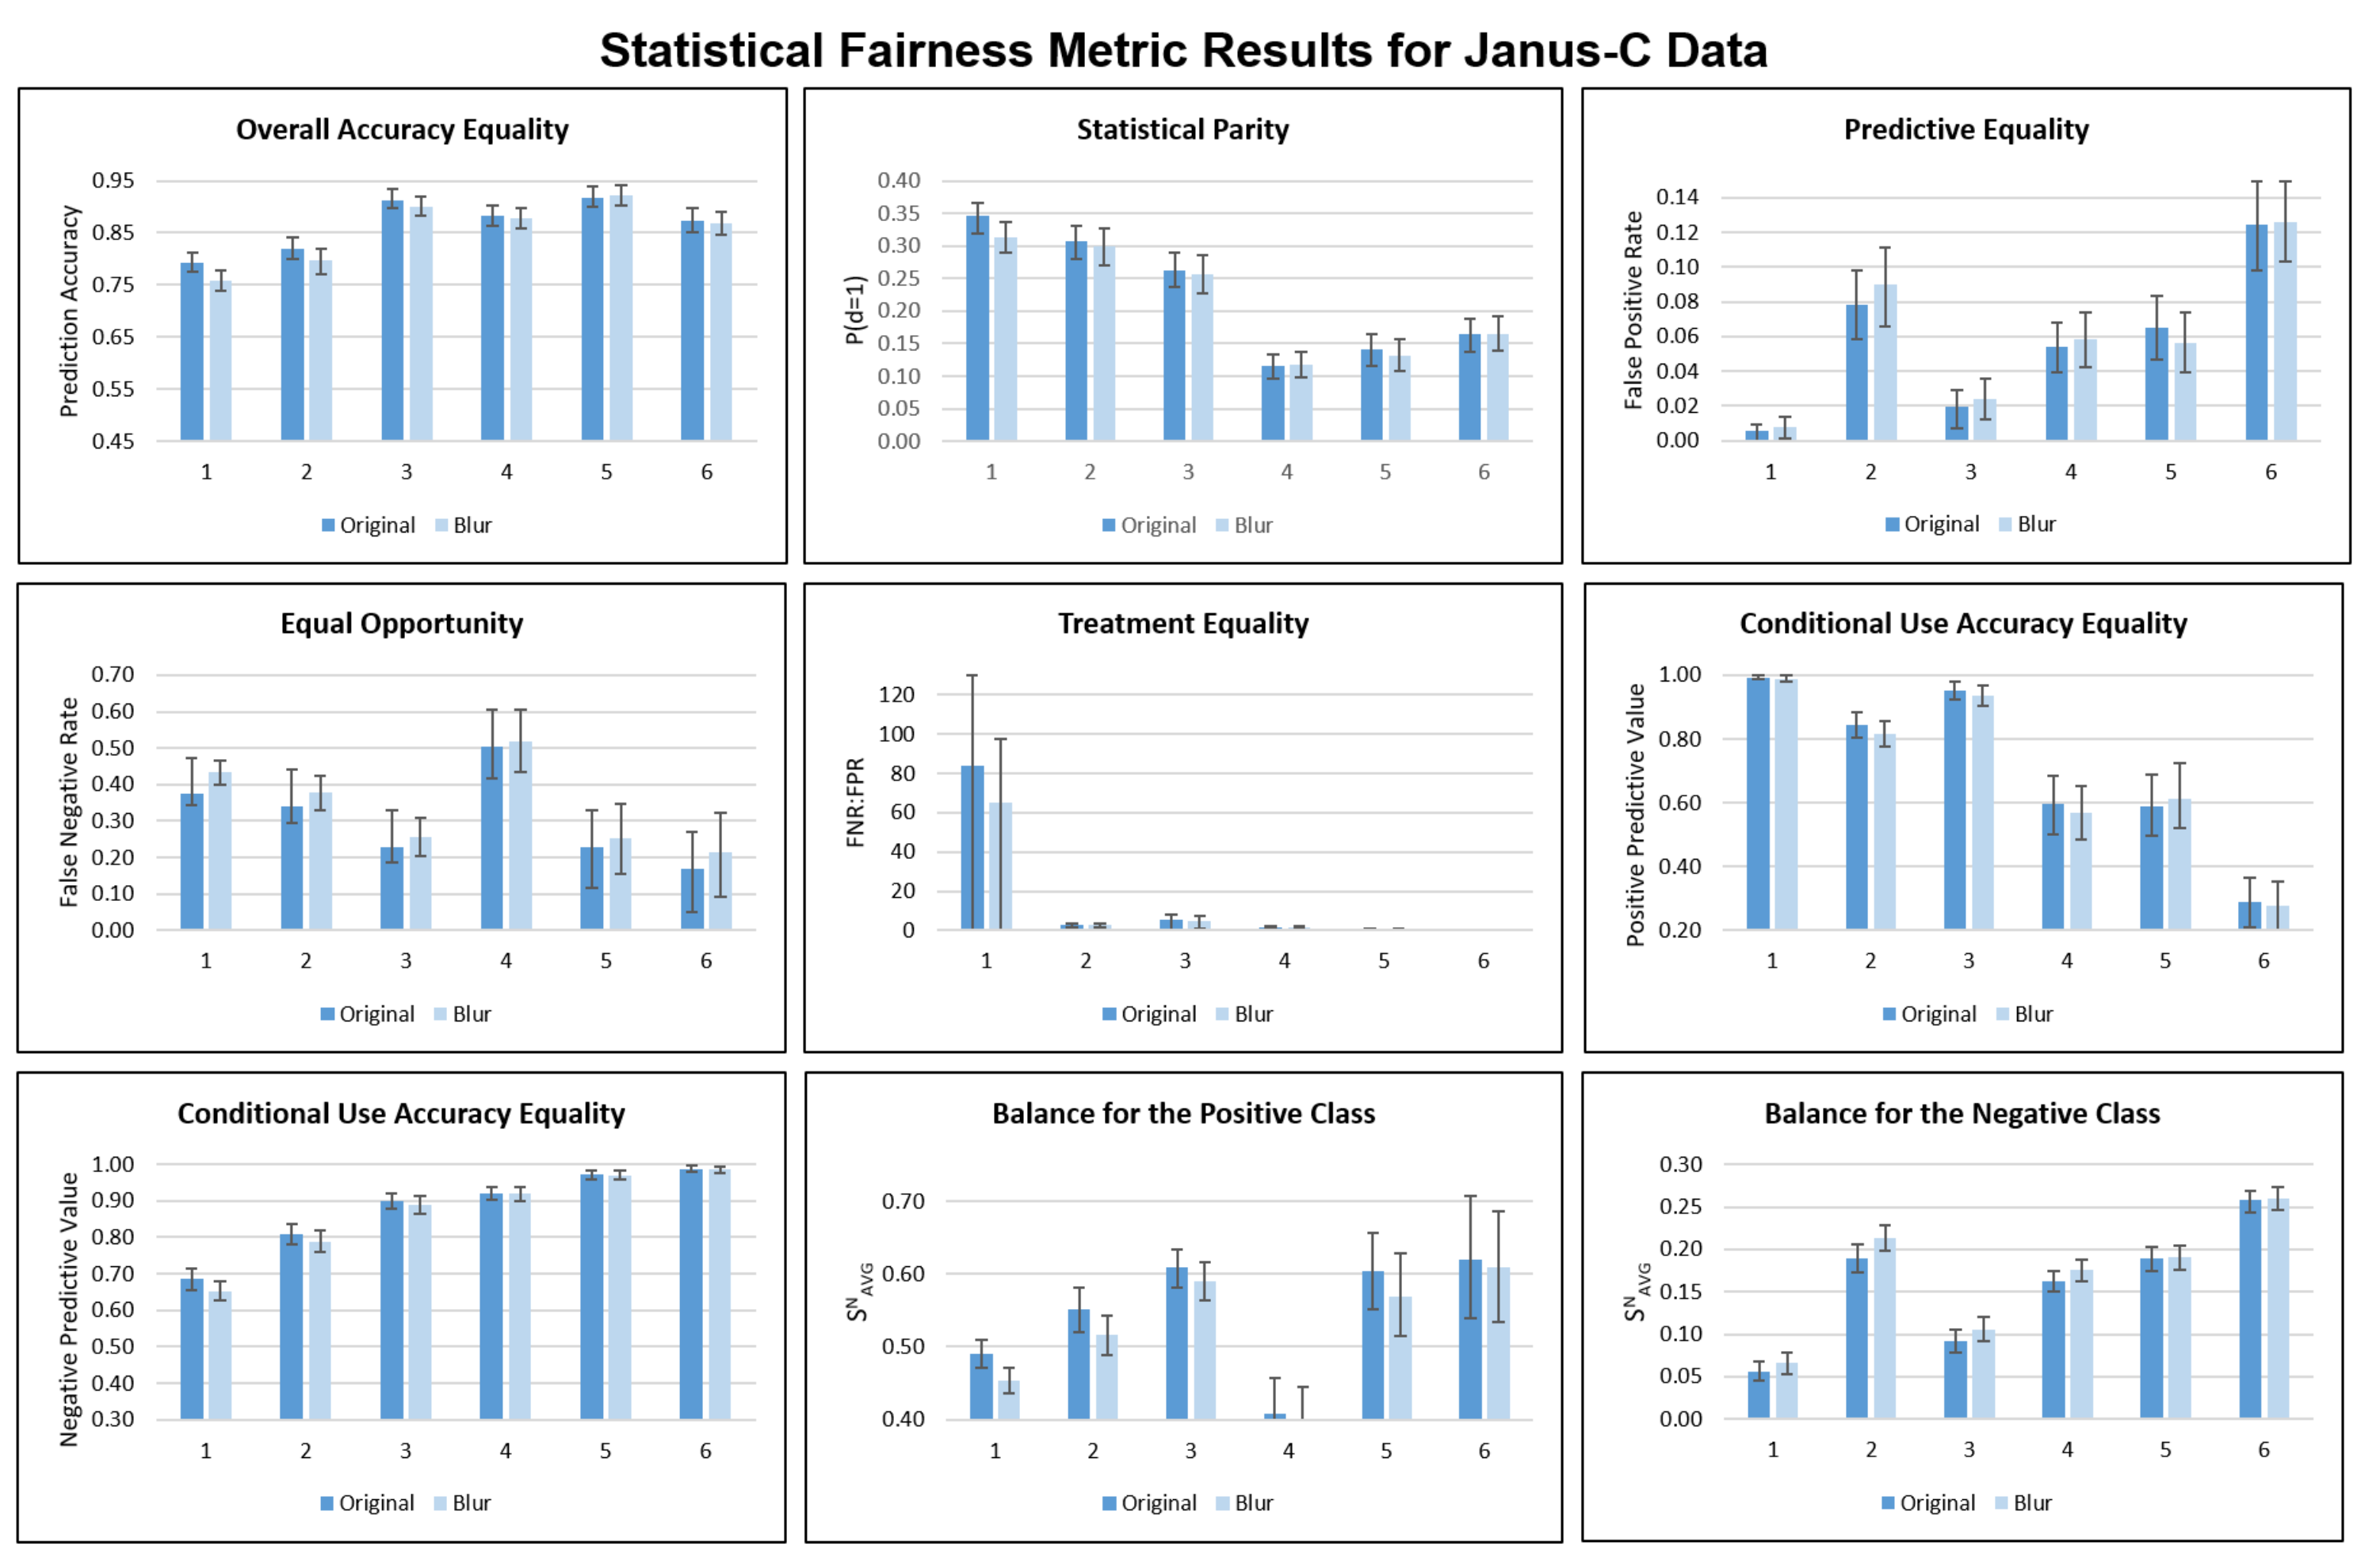
We attempt to take advantage of the skin tone attribute in Janus-C to assess performance deficits relating specifically to skin color. We hypothesize that an FV system may perform worse on darker faces than lighter faces due to factors such as lighting or image quality. We attempt to measure this by running two experiments: one with a Gaussian blur filter applied to the images and one without.
We compare blurred and non-blurred image results, expecting a greater drop in performance for blur with darker skin tones, indicating that darker faces likely appear in lower-quality images to begin with (a form of measurement bias). Figure A4 documents the results of these Janus-C experiments. We do not include these results in the main paper because (1) the inconsistent ratios of positive and negative pairs make it difficult to compare results across skin tones, and (2) we do not see significant performance changes after adding blur (the changes fall within the margin of error).
Figure A4. Statistical fairness metric results for Janus-C skin tone subgroups. Dark blue bars represent original data; light blue bars represent blurred data. Skin tone groups are labelled from 1 (lightest skin) to 6 (darkest skin).
Csmf 03 00006 g0a4

Appendix C. Clustering Metrics

Table A4, Table A5 and Table A6 display clustering metric results for RFW, VGGFace2, and Janus-C, respectively. As stated in the main paper, these results do not add support to the connection between cluster quality and model performance. However, they provide a quantification of embedding clustering according to various sensitive attributes that is useful for understanding each dataset’s clustered embeddings.
Table A4. Clustering metric results for RFW. ↑ means that a higher value indicates better clustering and ↓ means that a lower value indicates better clustering.
MetricRace
MS↑0.112
CH↑1423
DB↓4.21
Table A5. Clustering metric results for the VGGFace2 test set.
MetricGender
MS↑0.026
CH↑1835
DB↓8.44
Table A6. Clustering metric results for Janus-C.
MetricGenderSkin Tone
MS↑0.034−0.002
CH↑380227
DB↓7.577.81

Appendix D. Clustering Visualizations

Figure A5, Figure A6 and Figure A7 document intra-cluster visualizations for RFW, VGGFace2, and Janus-C, respectively. For each dataset and sensitive attribute, we include pairwise distance distributions, centroid distance distributions, and persistent homology 0th class death distributions.
Figure A5. Intra-cluster visualizations for RFW. Pairwise distance distribution (left); centroid distance distribution (middle); persistent homology 0th class deaths distribution (right).
Csmf 03 00006 g0a5
Figure A6. Intra-cluster visualizations for the VGGFace2 test set. Pairwise distance distribution (left); centroid distance distribution (middle); persistent homology 0th class deaths distribution (right).
Csmf 03 00006 g0a6
Figure A7. Intra-cluster visualizations for Janus-C. Pairwise distance distribution (left); centroid distance distribution (middle); persistent homology 0th class deaths distribution (right).
Csmf 03 00006 g0a7
Trends in RFW and Janus-C skin tone intra-cluster visualizations are similar to trends in BFW race intra-cluster visualizations; White faces (or lighter faces in Janus-C; skin tone group 1) belong to less dense and more dispersed clusters than other-race faces.
Trends in VGGFace2 and Janus-C gender intra-cluster visualizations are similar to trends in BFW gender intra-cluster visualizations; there is little difference in clustering between male and female faces.

Intra-Cluster Distribution T-Tests

In the main paper, we describe the calculation of p-values for intra-cluster distribution t-tests, used to determine if the means of two subgroups’ distributions are significantly different. p-values below the alpha-level of 0.05 validate observations from the intra-cluster visualizations, namely that White faces are less densely clustered in the embedding space than other-race faces. Table A5, Table A6, Table A7 and Table A8 document corrected p-values of the t-tests for BFW, RFW, VGGFace2, and Janus-C subgroup pairs, respectively.
Table A7. Corrected p-values of the 2-sample independent t-test results for BFW race (top) and gender (bottom) subgroup pairs. A: Asian; I: Indian; B: Black; W: White; F: Female; M: Male.
Pairwise Distance DistributionsCentroid Distance Distributions H 0 Death Time Distributions
IBW IBW IBW
A<0.001<0.001<0.001A<0.001<0.001<0.001A>0.999>0.999<0.001
I-<0.001<0.001I-<0.001<0.001I->0.999<0.001
B--<0.001B--<0.001B--<0.001
Pairwise Distance DistributionsCentroid Distance Distributions H 0 Death Time Distributions
M M M
F<0.001F>0.999F>0.03
Table A8. Corrected p-values of the 2-sample independent t-test results for RFW race subgroup pairs. Top: race subgroup results; bottom: gender subgroup results. A: Asian; I: Indian; B: Black; W: White.
Pairwise Distance DistributionsCentroid Distance Distributions H 0 Death Time Distributions
IBW IBW IBW
A<0.001<0.001<0.001A<0.001<0.001<0.001A<0.001>0.999<0.001
I-<0.001<0.001I-<0.001<0.001I-<0.001<0.001
B--<0.001B--<0.001B--<0.001
Table A9. Corrected p-values of the 2-sample independent t-test results for VGGFace2 test set gender subgroup pairs. F: Female; M: Male.
Pairwise Distance DistributionsCentroid Distance Distributions H 0 Death Time Distributions
M M M
F<0.001F<0.001F0.02
Table A10. Corrected p-values of the 2-sample independent t-test results for Janus-C skin tone (top) and gender (bottom) subgroup pairs. Results are for non-blurred data. Skin tone groups are labelled from 1 (lightest skin) to 6 (darkest skin). F: Female; M: Male.
Pairwise Distance DistributionsCentroid Distance Distributions H 0 Death Time Distributions
23456 23456 23456
1>0.999>0.9990.010.62>0.9991<0.001<0.001<0.001<0.001<0.0011<0.0010.81>0.9990.13<0.001
2-0.70<0.0010.02>0.9992-<0.001<0.001>0.999<0.0012-<0.001<0.0010.22>0.999
3--0.30>0.9990.543--<0.001<0.001<0.0013--0.980.03<0.001
4---0.91<0.0014---<0.001<0.0014---0.980.06
5----0.0035----<0.0015----0.99
Pairwise Distance DistributionsCentroid Distance Distributions H 0 Death Time Distributions
M M M
F0.08F>0.999F>.999

References

  1. Monahan, J.; Skeem, J.L. Risk Assessment in Criminal Sentencing. Annu. Rev. Clin. Psychol. 2016, 12, 489–513. [Google Scholar] [CrossRef] [PubMed] [Green Version]
  2. Christin, A.; Rosenblat, A.; Boyd, D. Courts and Predictive Algorithms. Data & Civil Rights: A New Era of Policing and Justice. 2016. Available online: https://www.law.nyu.edu/sites/default/files/upload_documents/Angele%20Christin.pdf (accessed on 28 February 2022).
  3. Romanov, A.; De-Arteaga, M.; Wallach, H.; Chayes, J.; Borgs, C.; Chouldechova, A.; Geyik, S.; Kenthapadi, K.; Rumshisky, A.; Kalai, A.T. What’s in a Name? Reducing Bias in Bios without Access to Protected Attributes. arXiv 2019, arXiv:1904.05233. [Google Scholar]
  4. De-Arteaga, M.; Romanov, A.; Wallach, H.; Chayes, J.; Borgs, C.; Chouldechova, A.; Geyik, S.; Kenthapadi, K.; Kalai, A.T. Bias in Bios: A Case Study of Semantic Representation Bias in a High-Stakes Setting. In Proceedings of the Conference on Fairness, Accountability, and Transparency, Atlanta, GA, USA, 29–31 January 2019. [Google Scholar]
  5. Fuster, A.; Goldsmith-Pinkham, P.; Ramadorai, T.; Walther, A. Predictably Unequal? The Effects of Machine Learning on Credit Markets. SSRN Electron. J. 2017, 77, 5–47. [Google Scholar] [CrossRef]
  6. Mitchell, S.; Potash, E.; Barocas, S.; D’Amour, A.; Lum, K. Prediction-Based Decisions and Fairness: A Catalogue of Choices, Assumptions, and Definitions. arXiv 2020, arXiv:1811.07867. [Google Scholar]
  7. Verma, S.; Rubin, J. Fairness Definitions Explained. In Proceedings of the 2018 IEEE/ACM International Workshop on Software Fairness (FairWare), Gothenburg, Sweden, 29 May 2018; pp. 1–7. [Google Scholar] [CrossRef]
  8. Robinson, J.P.; Livitz, G.; Henon, Y.; Qin, C.; Fu, Y.; Timoner, S. Face Recognition: Too Bias, or Not Too Bias? In Proceedings of the 2020 IEEE/CVF Conference on Computer Vision and Pattern Recognition Workshops (CVPRW), Seattle, WA, USA, 14–19 June 2020; IEEE: Seattle, WA, USA, 2020; pp. 1–10. [Google Scholar] [CrossRef]
  9. Buolamwini, J.; Gebru, T. Gender Shades: Intersectional Accuracy Disparities in Commercial Gender Classification. In Proceedings of the Conference on Fairness, Accountability, and Transparency, New York, NY, USA, 23–24 February 2018; ACM: New York, NY, USA, 2018. [Google Scholar]
  10. Gluge, S.; Amirian, M.; Flumini, D.; Stadelmann, T. How (Not) to Measure Bias in Face Recognition Networks. In Artificial Neural Networks in Pattern Recognition; Schilling, F.P., Stadelmann, T., Eds.; Springer International Publishing: Berlin/Heidelberg, Germany, 2020; pp. 125–137. [Google Scholar]
  11. Bhattacharyya, D.; Ranjan, R. Biometric Authentication: A Review. Int. J. u- e-Serv. Sci. Technol. 2009, 2, 13–28. [Google Scholar]
  12. Schroff, F.; Kalenichenko, D.; Philbin, J. FaceNet: A Unified Embedding for Face Recognition and Clustering. In Proceedings of the 2015 IEEE Conference on Computer Vision and Pattern Recognition (CVPR), Boston, MA, USA, 7–12 June 2015. [Google Scholar]
  13. Wheeler, F.W.; Weiss, R.L.; Tu, P.H. Face recognition at a distance system for surveillance applications. In Proceedings of the 2010 Fourth IEEE International Conference on Biometrics: Theory, Applications and Systems (BTAS), Washington, DC, USA, 27–29 September 2010; IEEE: Washington, DC, USA, 2010; pp. 1–8. [Google Scholar] [CrossRef]
  14. Van der Maaten, L.; Hinton, G. Visualizing Data using t-SNE. J. Mach. Learn. Res. 2008, 9, 2579–2605. [Google Scholar]
  15. Suresh, H.; Guttag, J.V. A Framework for Understanding Unintended Consequences of Machine Learning. arXiv 2020, arXiv:1901.10002. [Google Scholar]
  16. Hardt, M.; Price, E.; Price, E.; Srebro, N. Equality of Opportunity in Supervised Learning. In Proceedings of the Advances in Neural Information Processing Systems 29, Barcelona, Spain, 5–10 December 2016; Lee, D.D., Sugiyama, M., Luxburg, U.V., Guyon, I., Garnett, R., Eds.; Curran Associates, Inc.: Red Hook, NY, USA, 2016; pp. 3315–3323. [Google Scholar]
  17. Chouldechova, A. Fair Prediction with Disparate Impact: A Study of Bias in Recidivism Prediction Instruments. Big Data 2017, 5, 153–163. [Google Scholar] [CrossRef] [PubMed]
  18. Corbett-Davies, S.; Pierson, E.; Feller, A.; Goel, S.; Huq, A. Algorithmic Decision Making and the Cost of Fairness. In Proceedings of the 23rd ACM SIGKDD International Conference on Knowledge Discovery and Data Mining, Halifax, NS, Canada, 13–17 August 2017; Association for Computing Machinery: Halifax, NS, Canada, 2017; pp. 797–806. [Google Scholar] [CrossRef] [Green Version]
  19. Zemel, R. Learning Fair Representations. In Proceedings of the ICML, Atlanta, GA, USA, 16–21 June 2013; pp. 325–333. [Google Scholar]
  20. Feldman, M.; Friedler, S.A.; Moeller, J.; Scheidegger, C.; Venkatasubramanian, S. Certifying and Removing Disparate Impact. In Proceedings of the 21th ACM SIGKDD International Conference on Knowledge Discovery and Data Mining, Sydney, NSW, Australia, 10–13 August 2015; Association for Computing Machinery: Sydney, NSW, Australia, 2015; pp. 259–268. [Google Scholar] [CrossRef] [Green Version]
  21. Louizos, C.; Swersky, K.; Li, Y.; Welling, M.; Zemel, R. The Variational Fair Autoencoder. arXiv 2017, arXiv:1511.00830. [Google Scholar]
  22. Rothblum, G.N.; Yona, G. Probably Approximately Metric-Fair Learning. In Proceedings of the ICML, Stockholm, Sweden, 10–15 July 2018. [Google Scholar]
  23. Dwork, C.; Hardt, M.; Pitassi, T.; Reingold, O.; Zemel, R. Fairness through awareness. In Proceedings of the 3rd Innovations in Theoretical Computer Science Conference, Cambridge, MA, USA, 8–10 January 2012; Association for Computing Machinery: Cambridge, MA, USA, 2012; pp. 214–226. [Google Scholar] [CrossRef] [Green Version]
  24. Kusner, M.J.; Loftus, J.; Russell, C.; Silva, R. Counterfactual Fairness. In Advances in Neural Information Processing Systems 30; Guyon, I., Luxburg, U.V., Bengio, S., Wallach, H., Fergus, R., Vishwanathan, S., Garnett, R., Eds.; Curran Associates, Inc.: Red Hook, NY, USA, 2017; pp. 4066–4076. [Google Scholar]
  25. Kilbertus, N.; Rojas Carulla, M.; Parascandolo, G.; Hardt, M.; Janzing, D.; Schölkopf, B. Avoiding Discrimination through Causal Reasoning. In Advances in Neural Information Processing Systems 30; Guyon, I., Luxburg, U.V., Bengio, S., Wallach, H., Fergus, R., Vishwanathan, S., Garnett, R., Eds.; Curran Associates, Inc.: Red Hook, NY, USA, 2017; pp. 656–666. [Google Scholar]
  26. Nabi, R.; Shpitser, I. Fair Inference On Outcomes. In Proceedings of the Thirty-Second AAAI Conference on Artificial Intelligence, New Orleans, LA, USA, 2–7 February 2018. [Google Scholar]
  27. Berk, R.; Heidari, H.; Jabbari, S.; Kearns, M.; Roth, A. Fairness in Criminal Justice Risk Assessments: The State of the Art. Sociol. Methods Res. 2018, 50, 3–44. [Google Scholar] [CrossRef]
  28. Kleinberg, J.; Mullainathan, S.; Raghavan, M. Inherent Trade-Offs in the Fair Determination of Risk Scores. arXiv 2018, arXiv:1609.05807. [Google Scholar]
  29. Zhang, K.; Zhang, Z.; Li, Z.; Qiao, Y. Joint Face Detection and Alignment using Multi-task Cascaded Convolutional Networks. IEEE Signal Process. Lett. 2016, 23, 1499–1503. [Google Scholar] [CrossRef] [Green Version]
  30. Cao, Q.; Shen, L.; Xie, W.; Parkhi, O.M.; Zisserman, A. VGGFace2: A dataset for recognising faces across pose and age. arXiv 2018, arXiv:1710.08092. [Google Scholar]
  31. Wang, M.; Deng, W.; Hu, J.; Tao, X.; Huang, Y. Racial Faces in-the-Wild: Reducing Racial Bias by Information Maximization Adaptation Network. arXiv 2019, arXiv:1812.00194. [Google Scholar]
  32. Wang, M.; Zhang, Y.; Deng, W. Meta Balanced Network for Fair Face Recognition. IEEE Trans. Pattern Anal. Mach. Intell. 2021. [Google Scholar] [CrossRef]
  33. Wang, M.; Deng, W. Mitigate Bias in Face Recognition using Skewness-Aware Reinforcement Learning. arXiv 2019, arXiv:1911.10692. [Google Scholar]
  34. Wang, M.; Deng, W. Deep Face Recognition: A survey. Neurocomputing 2021, 429, 215–244. [Google Scholar] [CrossRef]
  35. Maze, B.; Adams, J.; Duncan, J.A.; Kalka, N.; Miller, T.; Otto, C.; Jain, A.K.; Niggel, W.T.; Anderson, J.; Cheney, J.; et al. IARPA Janus Benchmark – C: Face Dataset and Protocol. In Proceedings of the 2018 International Conference on Biometrics (ICB), Gold Coast, QLD, Australia, 20–23 February 2018; IEEE: New York, NY, USA, 2018; pp. 158–165. [Google Scholar] [CrossRef]
  36. Orloff, J.; Bloom, J. Bootstrap confidence intervals. 2014. Available online: https://math.mit.edu/~dav/05.dir/class24-prep-a.pdf (accessed on 28 February 2022).
  37. Rousseeuw, P.J. Silhouettes: A graphical aid to the interpretation and validation of cluster analysis. J. Comput. Appl. Math. 1987, 20, 53–65. [Google Scholar] [CrossRef] [Green Version]
  38. Calinski, T.; Harabasz, J. A dendrite method for cluster analysis. Commun. Stat.-Theory Methods 1974, 3, 1–27. [Google Scholar] [CrossRef]
  39. Davies, D.L.; Bouldin, D.W. A Cluster Separation Measure. IEEE Trans. Pattern Anal. Mach. Intell. 1979, 1, 224–227. [Google Scholar] [CrossRef]
  40. Chazal, F.; Michel, B. An introduction to Topological Data Analysis: Fundamental and practical aspects for data scientists. arXiv 2017, arXiv:1710.04019. [Google Scholar] [CrossRef]
  41. Wasserman, L. Topological Data Analysis. Annu. Rev. Stat. Appl. 2018, 5, 501–532. [Google Scholar] [CrossRef] [Green Version]
  42. Domingos, P. A few useful things to know about machine learning. Commun. ACM 2012, 55, 78–87. [Google Scholar] [CrossRef] [Green Version]
  43. Saul, N.; Tralie, C. Scikit-TDA: Topological Data Analysis for Python. 2019. Available online: https://zenodo.org/record/2533369 (accessed on 28 February 2022).
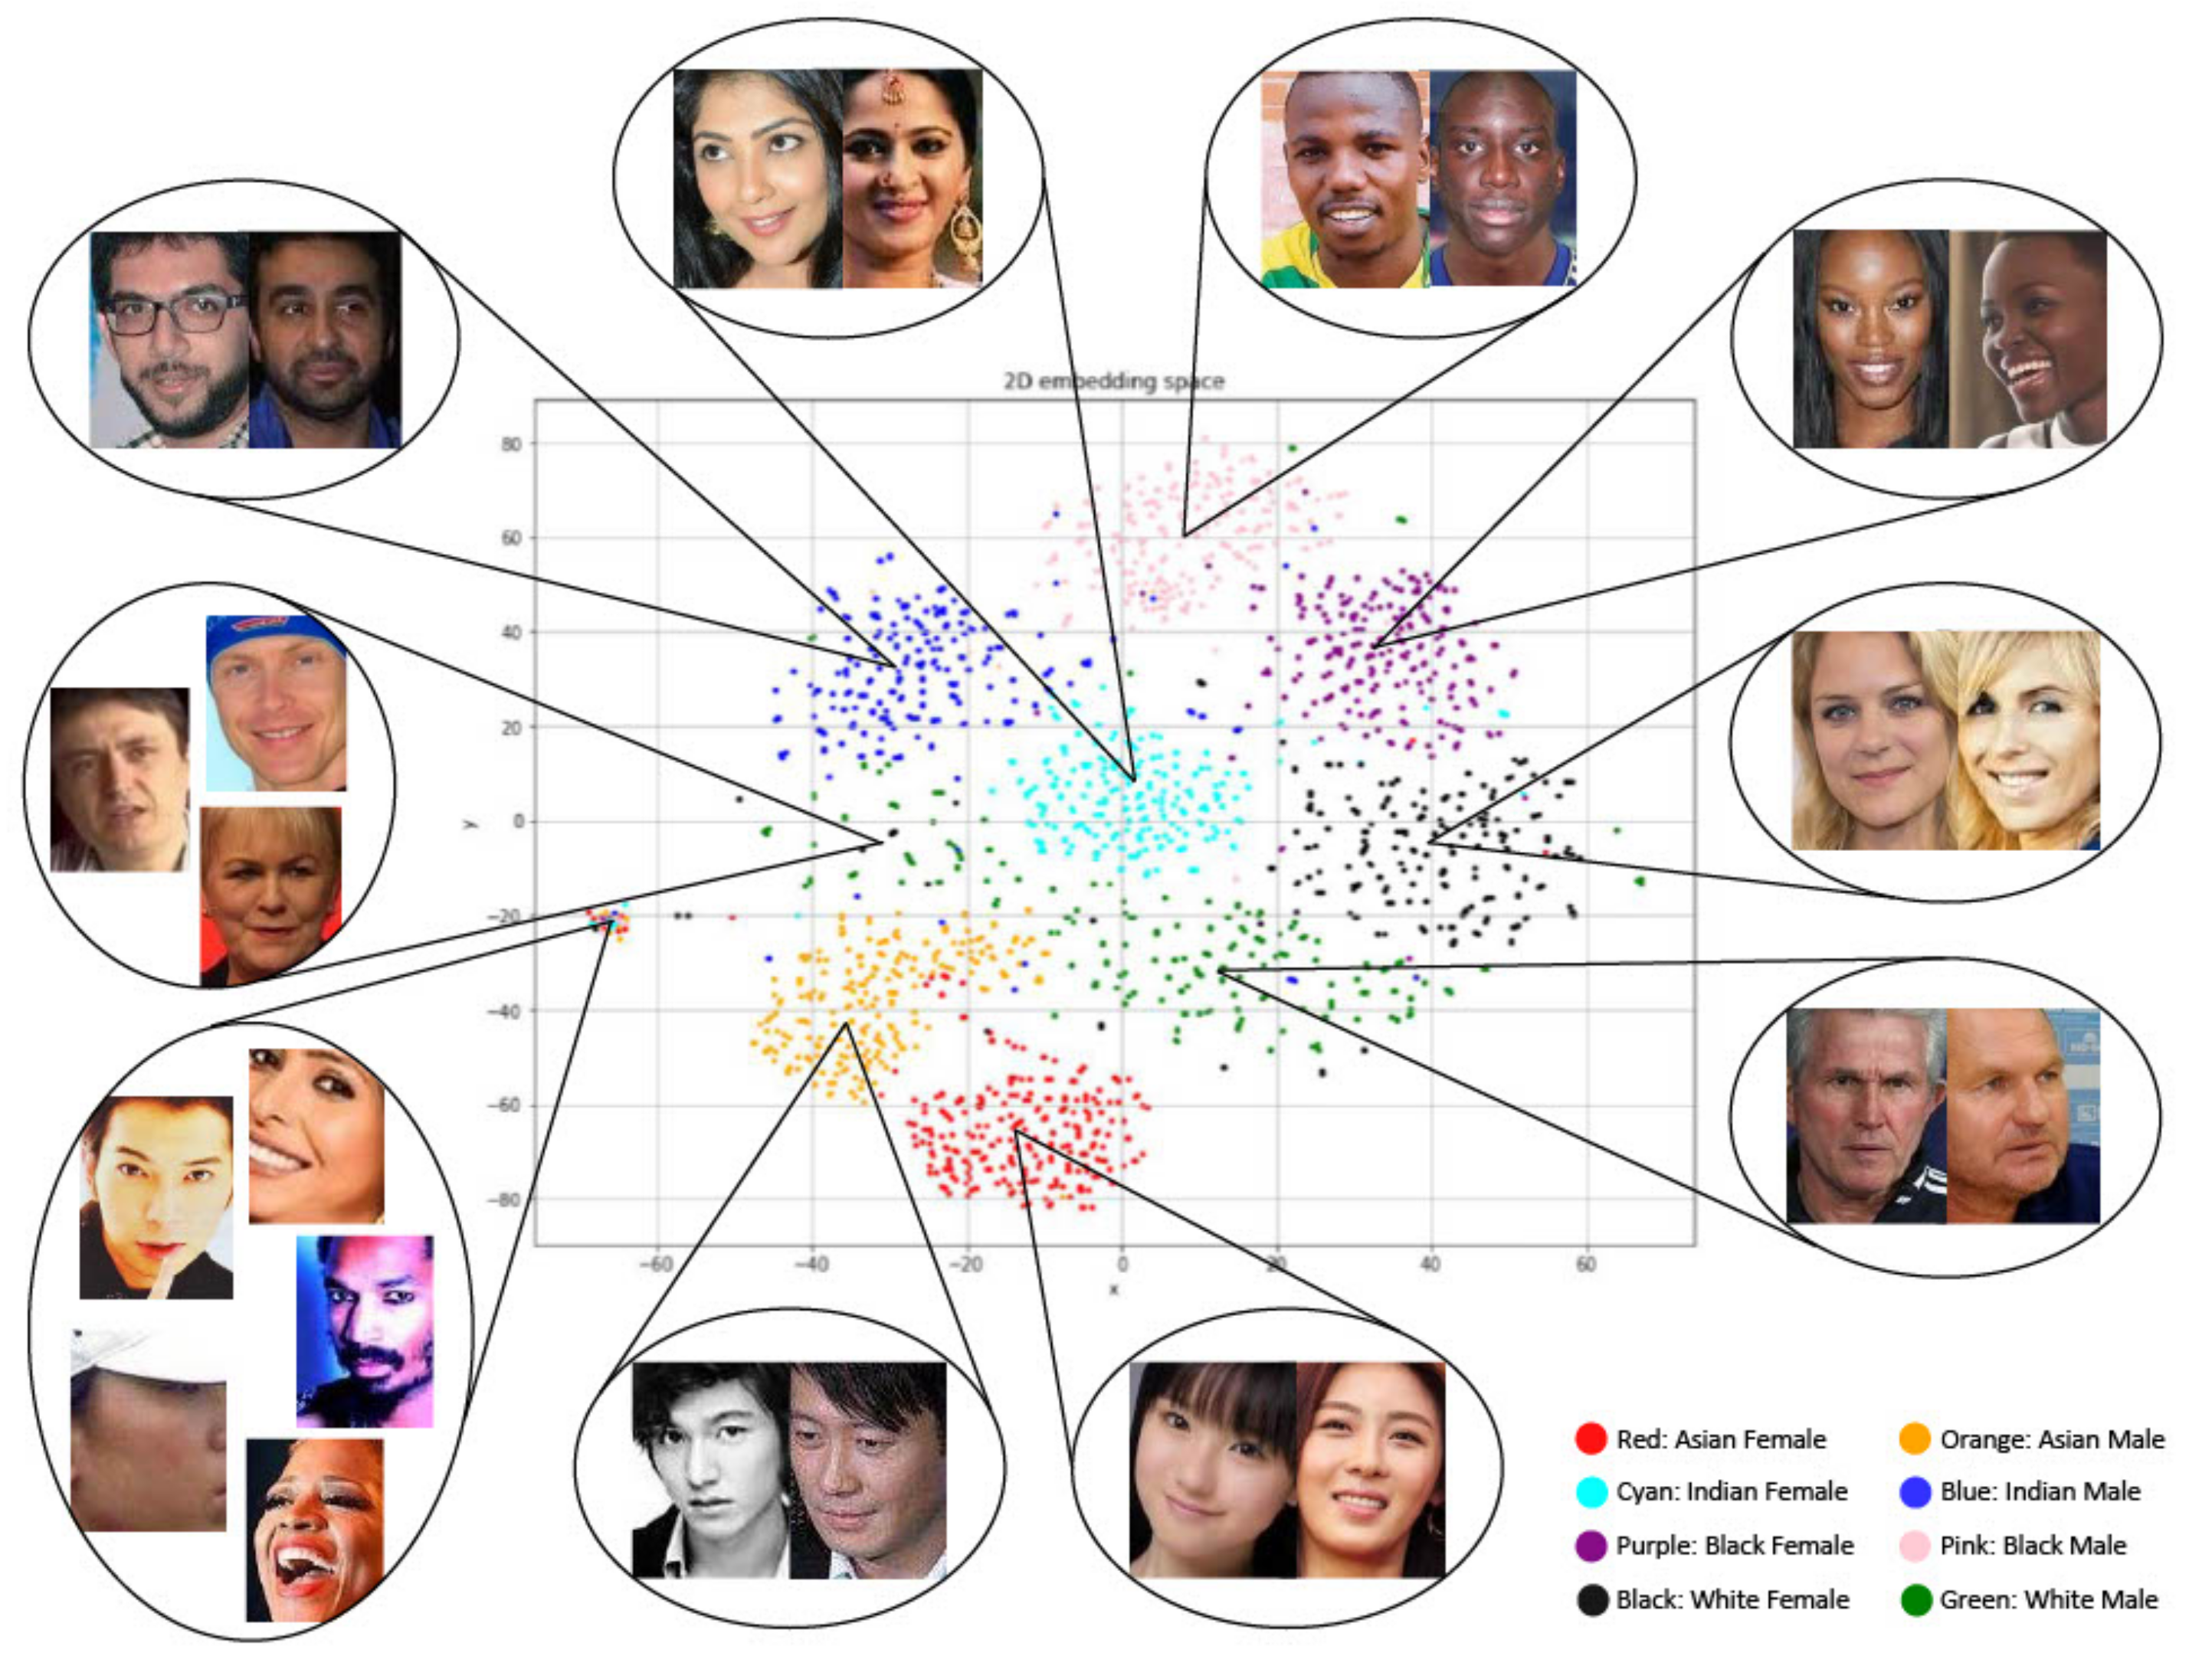
Figure 1. A two-dimensional t-SNE [14] visualization of Balanced Faces in the Wild (BFW) [8] embeddings, colored by race and gender. Clusters roughly correspond to race and gender, with varied densities (e.g., Asian clusters are tighter than White clusters). Note that t-SNE embeddings are not completely representative of actual relationships due to information loss during dimensionality reduction.
Csmf 03 00006 g001
Figure 2. An overview of our approach. We use diverse face datasets to assess bias in FaceNet [12] by leveraging the face embeddings that it produces for various fairness experiments.
Csmf 03 00006 g002
Figure 3. Statistical fairness metric results for BFW race and gender subgroups. See Table 1 for metric descriptions. Blue bars denote race subgroups; gray bars denote gender subgroups. A = Asian; I = Indian; B = Black; W = White; F = Female; M = Male.
Csmf 03 00006 g003
Figure 4. Pairwise distance distribution for BFW race (left) and gender (right) subgroups. Top plots include all pairs for each subgroup and bottom plots include distinct curves for genuine pairs (solid) and imposter pairs (dashed) for each subgroup.
Csmf 03 00006 g004
Figure 5. Centroid distance distribution for BFW race subgroups (left) and BFW gender subgroups (right).
Csmf 03 00006 g005
Figure 6. Distribution of persistent homology class 0 ( H 0 ) death times for BFW race (left) and gender (right) subgroups.
Csmf 03 00006 g006
Table 1. Selected statistical fairness metrics. Notation [7,16]: A—sensitive attribute, Y—actual classification, d—predicted classification, and S—similarity score. * PPV/NPV: Positive (Negative) Predictive Value.
MetricDescriptionDefinitionReferences
Overall Accuracy EqualityEqual prediction accuracy across protected and unprotected groups P ( d = Y | A 1 ) = P ( d = Y | A 2 ) = = P ( d = Y | A N ) = Berk et al. [27]
Mitchell et al. [6]
Verma and Rubin [7]
Predictive EqualityEqual FPR across protected and unprotected groups P ( d = 1 | Y = 0 , A 1 ) = P ( d = 1 | Y = 0 , A 2 ) = = P ( d = 1 | Y = 0 , A N ) Chouldechova [17]
Corbett-Davies et al. [18]
Mitchell et al. [6]
Verma and Rubin [7]
Equal OpportunityEqual FNR across protected and unprotected groups P ( d = 0 | Y = 1 , A 1 ) = P ( d = 0 | Y = 1 , A 2 ) = = P ( d = 0 | Y = 1 , A N ) Chouldechova [17]
Hardt et al. [16]
Kusner et al. [24]
Mitchell et al. [6]
Verma and Rubin [7]
Conditional Use Accuracy EqualityEqual PPV and NPV * across protected and unprotected groups P ( Y = 1 | d = 1 , A 1 ) = P ( Y = 1 | d = 1 , A 2 ) = = P ( Y = 1 | d = 1 , A N ) AND
P ( Y = 0 | d = 0 , A 1 ) = P ( Y = 0 | d = 0 , A 2 ) = = P ( Y = 0 | d = 0 , A N )
Berk et al. [27]
Mitchell et al. [6]
Verma and Rubin [7]
Balance for the Positive ClassEqual avg. score S for the positive class across protected and unprotected groups A V G ( Y = 1 | A 1 ) = A V G ( Y = 1 | A 2 ) = = A V G ( Y = 1 | A N ) Kleinberg et al. [28]
Mitchell et al. [6]
Verma and Rubin [7]
Balance for the Negative ClassEqual avg. score S for the negative class across protected and unprotected groups A V G ( Y = 0 | A 1 ) = A V G ( Y = 0 | A 2 ) = = A V G ( Y = 0 | A N ) Kleinberg et al. [28]
Mitchell et al. [6]
Verma and Rubin [7]
Table 2. The four benchmark datasets that we use in our experiments. Faces/ID is the average number of faces per ID. * VGG Test represents the VGGFace2 test set.
Dataset# IDsFaces/ IDAttributesNotes
BFW80025Race, GenderEqual balance for race and gender
RFW12,0006.7RaceEqual balance for race
IJBC35316Skin Tone, GenderOcclusion, occupation diversity
VGG Test *500375GenderVariation in pose and age
Table 3. The percentage of positive and negative pairs per subgroup for the BFW testing split. Ratios for the validation set are similar.
FemaleAsianIndianBlackWhite
% positive25252525
% negative75757575
MaleAsianIndianBlackWhite
% positive25252525
% negative75757575
Table 4. Clustering metric results for BFW. ↑ means that a higher value indicates better clustering and ↓ means that a lower value indicates better clustering.
MetricGenderRaceBoth
MS↑0.0340.0910.103
CH↑280572444
DB↓7.554.363.98
Publisher’s Note: MDPI stays neutral with regard to jurisdictional claims in published maps and institutional affiliations.