Article

Applied Time Series Analyses (2000–2017) of Vibrio vulnificus and Vibrio parahaemolyticus (Pathogenic and Non-Pathogenic Strains) in the Eastern Oyster, Crassostrea virginica

Department of Marine Biology, Texas A&M University at Galveston, Galveston, TX 77553, USA
*
Author to whom correspondence should be addressed.
Bacteria 2025, 4(2), 17; https://doi.org/10.3390/bacteria4020017
Submission received: 28 January 2025 / Revised: 17 February 2025 / Accepted: 18 March 2025 / Published: 1 April 2025

Abstract

:
Concerns about the health consequences of seafood-born human pathogens are ongoing given their occurrence, prevalence, and ability to cause infections, and sometimes death in humans as well as seafood-associated morbidity and mortality worldwide. An applied time-series (2000–2017) analysis of six reefs examined pathogen-specific annual trends and seasonal patterns in the eastern oyster, Crassostrea virginica, in Galveston Bay (Texas), a subtropical estuary in the Gulf of Mexico. Pearson correlation coefficients showed that temperature had a strong positive correlation with Vibrio vulnificus and V. parahaemolyticus (r = 0.66 and 0.51), but not the pathogenic thermostable direct hemolysin (tdh+) V. parahaemolyticus (r = 0.12). The correlations between Vibrio spp. and salinity showed the opposite trend. A cross-correlation factor analysis revealed the strongest positive correlations (r = 0.41 and r = 0.36, respectively) for high densities of V. vulnificus during high Perkinsus marinus infections with short lags (up to 1 month); this was not the case for total or tdh+ V. parahaemolyticus. These results reveal some of the complexity of interannual and long-term patterns of pathogens in oysters. Given climate change impacts and a growing aquaculture industry, examinations of oyster microbiomes in response to environmental and water quality variables are needed.

1. Introduction

Worldwide, the presence of pathogenic bacteria in the aquatic environment raises concerns for humans who rely on coastal and estuarine ecosystems for food and livelihoods, particularly when disease outbreaks occur [1]. Seafood is nutrient-rich and part of a healthy human diet [2]; however, its consumption may have some risks. Seafood is also known as a vehicle for the transmission of food-borne bacteria that cause human illness worldwide. This includes pathogens such as Vibrio species, Escherichia coli 0157:H7, Salmonella, and Listeria monocytogenes, all of which have been found responsible for major food-borne outbreaks [3,4]. There is also growing evidence that the eastern oyster (Crassostrea virginica, Gmelin, 1791), and other shellfish can be a vehicle for illness, and, that they are contributing to the increasing occurrence of food-related illness [5].
Specifically, the incidence of vibriosis (a potentially serious illness caused by a group of bacteria called Vibrio) in the United States is increasing [6,7]. Vibriosis continues to be a leading cause of seafood-borne illnesses in this country [2]. Along with Vibrio cholerae, Vibrio vulnificus (Farmer, 1979), and Vibrio parahaemolyticus (Fujino, 1951), all members of the Vibrionaceae family, are common causal agents [2,7,8]. Indeed, some studies suggest that V. parahaemolyticus is the leading cause of bacterial seafood-borne illness worldwide, while V. vulnificus is the leading cause of seafood-related deaths [9]. Both Vibrio species are known to be lethal to humans, particularly if the individual is immunocompromised. The prevalence of V. vulnificus and V. parahaemolyticus in freshly harvested C. virginica and stored shell stock is well documented [5].
V. vulnificus is an estuarine bacterium naturally found in brackish waters that is concentrated by filter-feeding oysters [10,11]. It can cause opportunistic infections in humans consuming virulent strains present in raw or undercooked oysters. Although it is a less frequent cause of vibriosis, V. vulnificus illnesses range from gastroenteritis to grievous wound infections or septicemia and death, particularly in individuals with predisposing conditions [2,6,8,12]. Although V. vulnificus is known as a ubiquitous organism in the Gulf of Mexico, its ecological relationship with C. virginica has not been adequately defined.
V. parahaemolyticus, a pathogenic species of the genus Vibrio, is also found in estuarine, marine, and coastal environments [1], but not all strains are pathogenic [13]. The halophile is one of the major bacterial causes of food-borne illness that affects people who consume raw or improperly cooked seafood [14]. Gastroenteritis, wound infections, and septicemia are the three major types of human illness associated with this bacterium [15,16]. V. parahaemolyticus-associated gastroenteritis has been reported worldwide [17,18], with 1995 marking the beginning of the first global pandemic [14]. The first outbreak in the United States was recorded in 1971, resulting in hundreds of people having food poisoning in Maryland following the consumption of boiled blue crabs [19]. However, in 1997, outbreaks of V. parahaemolyticus infections due to the consumption of raw oysters were reported in many states along the Pacific Northwest [20], and a year later, it was reported from Galveston Bay (Texas), and from New York and other states on the East Coast [2,16,21]. V. parahaemolyticus infection is the result of the production of thermostable direct hemolysin (tdh+) and tdh-related hemolysin toxins, respectively, while non-pathogenic V. parahaemolyticus strains do not cause any infection [4,22]. V. parahaemolyticus is found to be free-living or attached to shellfish, copepods, and fish [23]. Sarkar et al. [24] reported that fish provide an ideal substrate for the survival and proliferation of V. parahaemolyticus. In blue crabs (Callinectes sapidus) collected from Galveston Bay, the occurrence of V. parahaemolyticus was higher during the summer months, indicating a preference for higher water temperatures [25]. Further, many V. parahaemolyticus-mediated infections occurring in coastal populations have been due to exposure to seawater, primarily while fishing or swimming.
Perkinsus marinus (formerly Dermocystidium marinum or Dermo) (Mackin, Owen, and Collier, 1950), a spore-forming apicomplexan protozoan parasite of oysters, is an important cause of oyster mortality in the Gulf of Mexico and along the south-eastern coast of the United States [26,27]. P. marinus infection has been shown to result in poor oyster body condition and survival associated with the destruction of its connective tissues [28]. Surveys of this parasite in Galveston Bay oysters have revealed higher infection levels (prevalence, infection intensity, and weighted prevalence) during periods of warm and saline conditions [29,30], including those caused by El Niño-Southern Oscillation (ENSO) and strong drought conditions [31]. Unlike V. vulnificus and V. parahaemolyticus, P. marinus infection does not harm the people who ingest the oysters. Interestingly, earlier studies that examined abundance patterns of V. vulnificus and P. marinus in oysters found there was no correlation with environmental parameters or one another [32,33,34]. However, it is not clear whether the lack of a correlation is due to a small sample size, or if there may indeed be a correlation between these oyster pathogens. Understanding this phenomenon is critical given P. marinus is spread by live oysters, decomposing tissues of dead oysters, and by the excretions of scavengers that feed on the dead oysters [28,29,30].
The Eastern oyster, C. virginica, survives in a wide array of habitat conditions but prefers salinities between 5 and 40‰ and temperatures from 20 °C to 30 °C [35,36]. These oysters are found in the western Atlantic Ocean from the Canadian Maritime Provinces down to the Gulf of Mexico, Panama, and the Caribbean Islands [36]. The Gulf of Mexico states were developed as the primary oyster producer for the United States, with an oyster fishery concentrated in the Texas and Louisiana regions [6]. In Texas, V. vulnificus-related illness and deaths following raw oyster consumption became a major concern for the oyster industry in the late 1980s [37]. The emergence of the V. parahaemolyticus pandemic and a consequent rise in the number of outbreaks related to seafood consumption in the 1990s called for an immediate monitoring of seafood safety procedures both in oysters and harvest waters. In Texas, this effort started in 1999 after a wide-ranging outbreak that occurred in 1998 [21]. Ecological changes in Galveston Bay in the last few decades have negatively impacted oyster populations [38]. There have been many significant storms and floods (e.g., Hurricane Ike in 2008 and Hurricane Harvey in 2017) that have caused the oyster populations to decline. Studies are needed to highlight the importance of this critical ecosystem engineer to better understand the driving factors influencing pathogens in oyster populations.
The goal of this study was to examine the relationships between the density and the occurrence of V. vulnificus and V. parahaemolyticus (pathogenic strains with thermostable direct hemolysin (tdh+) and non-pathogenic strains without tdh (thermo labile hemolysin) associated with C. virginica in Galveston Bay, an important oyster producing estuary on the coastline of the Gulf of Mexico. We used a long-term data set (1999–2018) which includes five commercially harvested oyster reefs in the middle of the bay (Figure 1) and an undisturbed man-made reef found in West Bay (Sammy’s Reef) to examine the biotic factors influencing these Vibrio spp. populations. In addition, we examined relationships between these pathogenic bacteria and the parasite P. marinus in a subset of the oysters where these pathogens were measured concurrently.

2. Materials and Methods

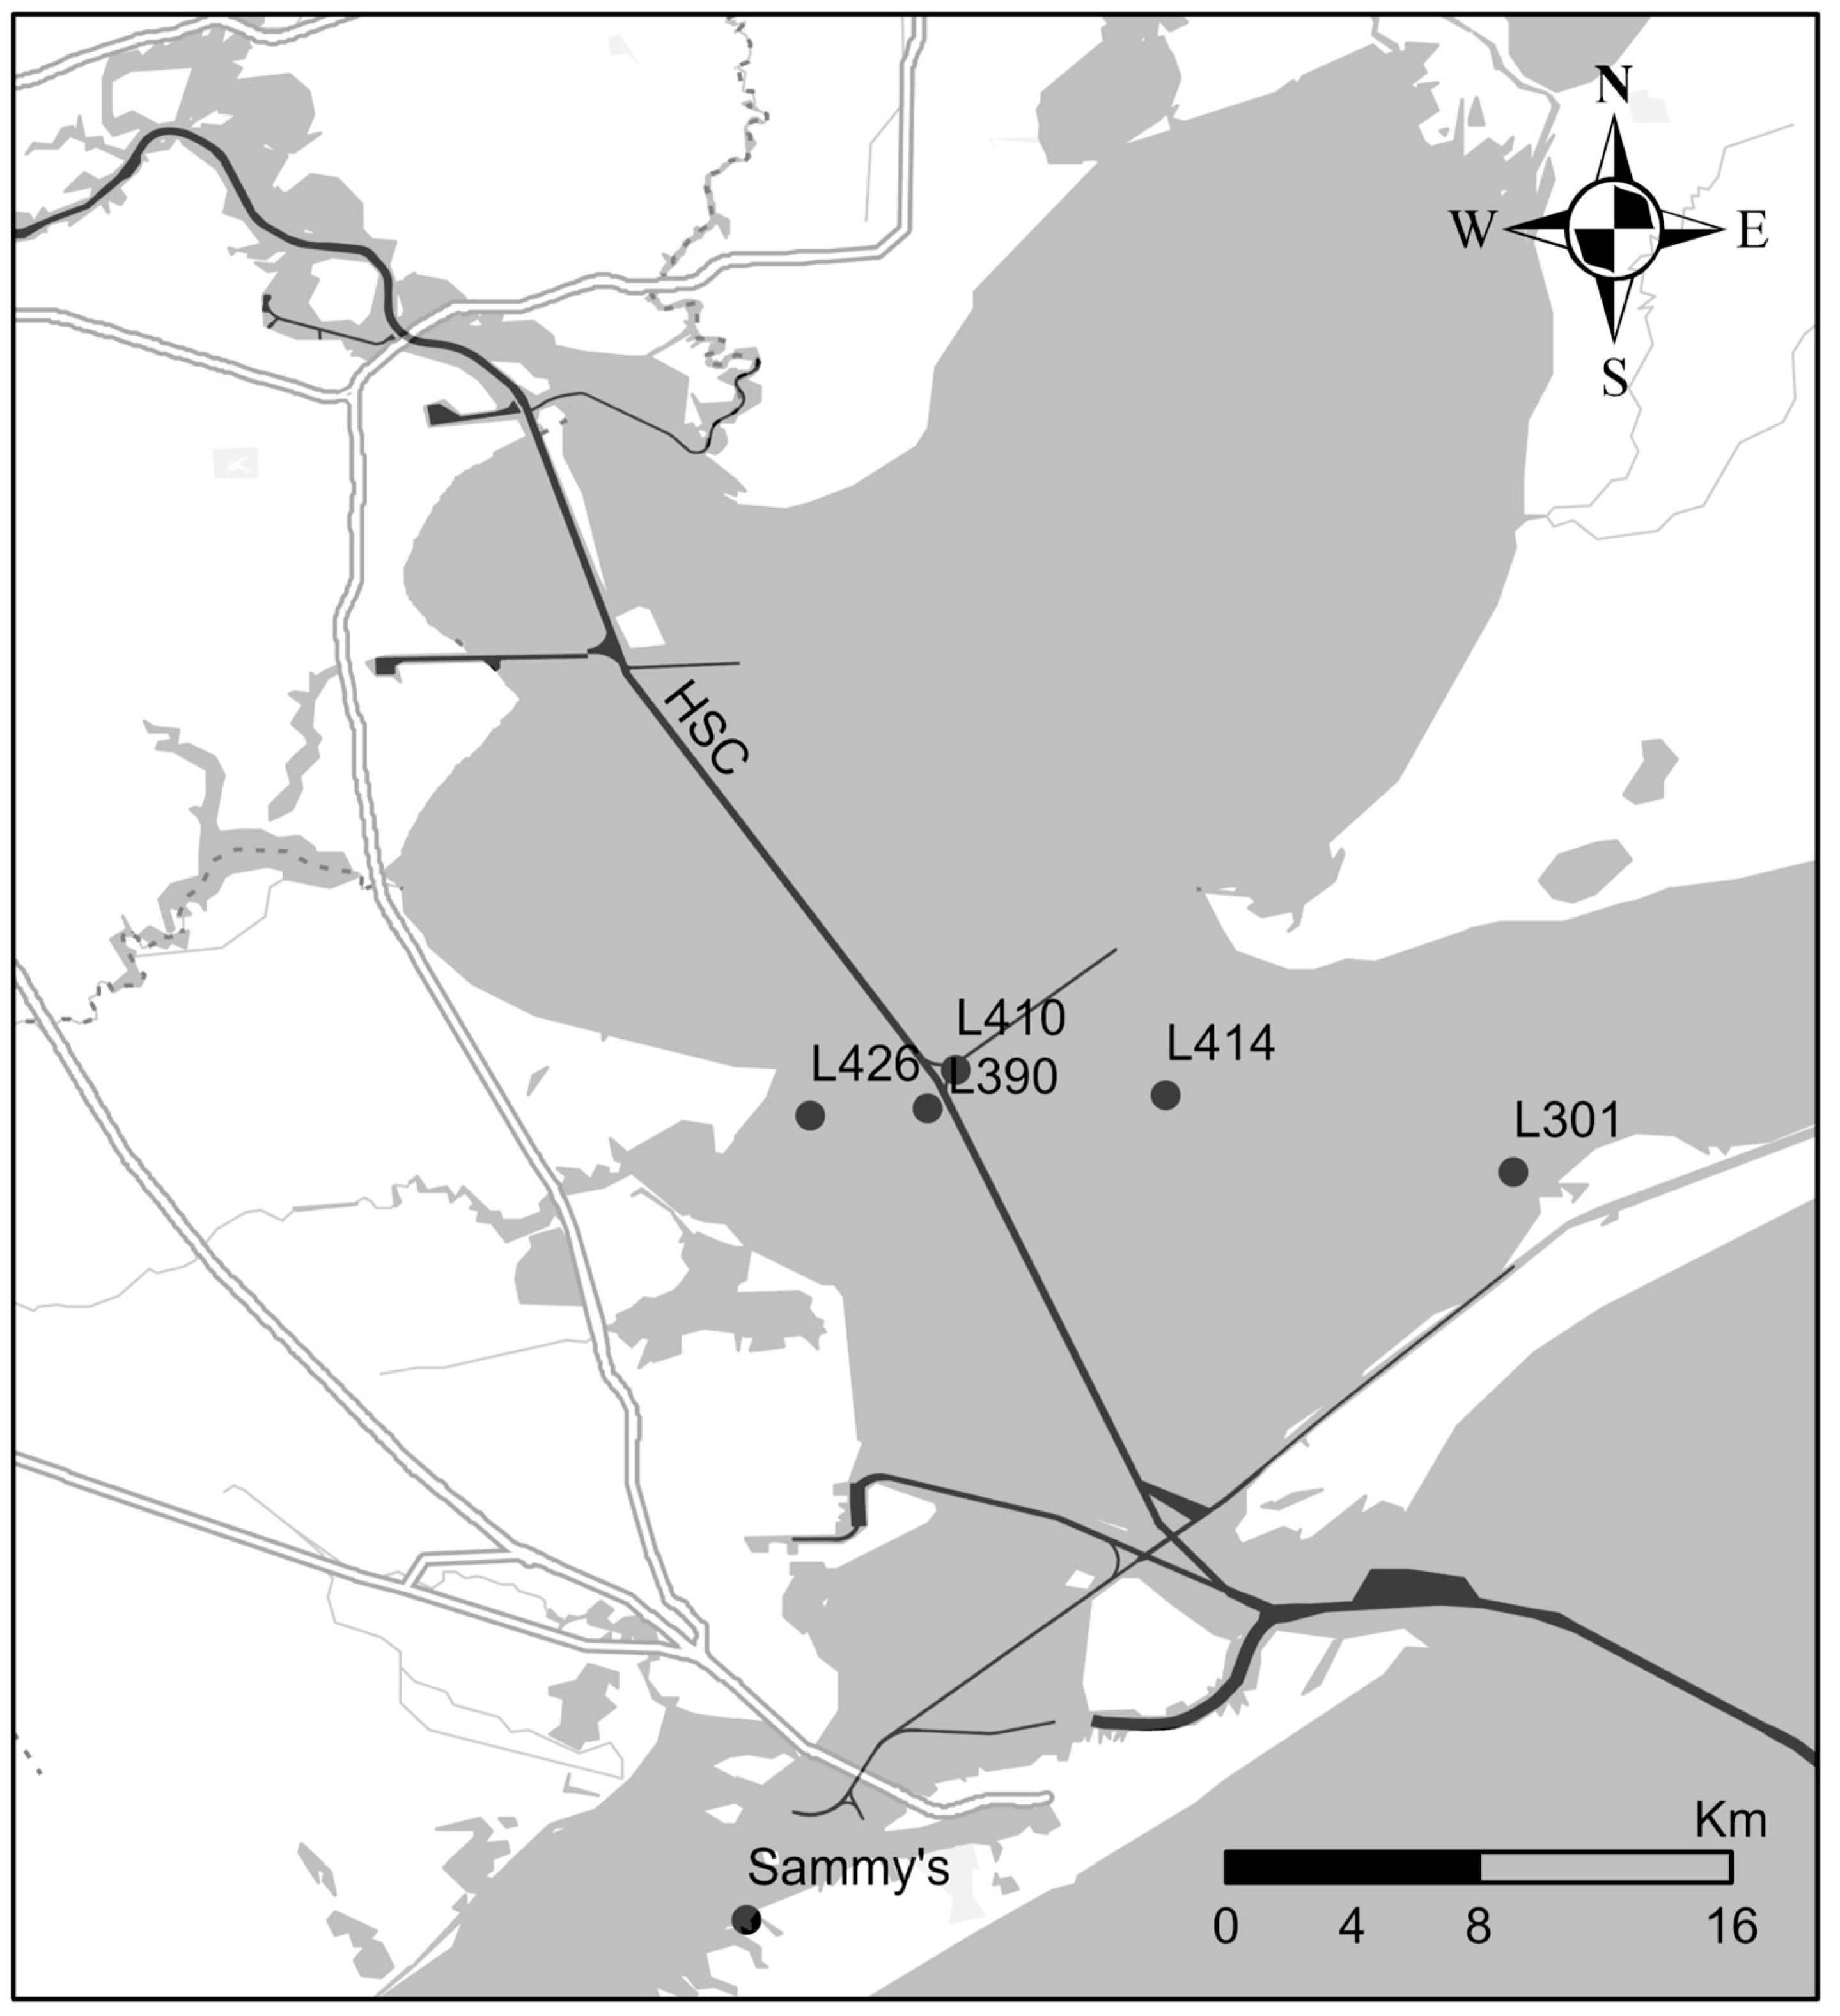
2.1. Sample Collection

C. virginica samples collected in Galveston Bay came from six reefs (Figure 1) along with water temperature and salinity measured in situ with a calibrated YSI (YSI Inc., Yellow Springs, OH, USA) or similar meter. Sammy’s Reef (29.26 ºN, −94.91 ºW), is a man-made, soft-sediment reef located in the west bay. This was sampled from 1999 to 2017 by Sammy Ray and members of the Seafood Safety Laboratory (SSL) at Texas A&M University at Galveston. The slow water currents that flow over the reef allow the deposition of suspended material in the oysters [37]. The other five reefs are found in the central section of Galveston Bay. These private, commercially harvested oyster leases (L301, L414, L410, L426, and L433), found in water depths of >1 m, are in areas of relatively fast-moving currents. These oysters were sampled by the Texas Department of Health (1999–2004) and Texas Department of State Health Services (2005–2018) for delivery to the SSL.
Oyster samples (97%), consisting of 10–12 individual shell stock oysters (average weight 252–256 g), were collected by dredge in the bay and by hand at Sammy’s reef and immediately chilled inside an insulated cooler with ice packs. Bubble wrap was placed between the samples and ice packs to prevent direct contact. The chilled oyster samples were immediately transported to the SSL for analysis. Upon receipt, the muscle temperatures of three oysters from each sampling site were recorded to ensure that the temperature in the container had remained low enough (<10 °C) to prevent the replication of Vibrio spp. during transport. All samples were analyzed for Vibrio spp. within 6 h of collection. V. vulnificus, total V. parahaemolyticus (all strains producing a “tlh” or thermolabile hemolysin gene), and tdh+ V. parahaemolyticus (pathogenic strains which produce both a “tlh” and “tdh” or thermostable direct hemolysin gene) were quantified.

2.2. Isolation and Enumeration of Vibrio spp.

Oyster samples were processed according to the procedures in the FDA’s Bacteriological Analytical Manual [39]. Oysters were scrubbed with sterile brushes to remove external debris. Oyster muscle was shucked and transferred into sterile blenders with the liquor. This mix (muscle and liquor) was diluted with equal amounts of phosphate-buffered saline (PBS), and then homogenized for 2 min. The homogenate was used to create serial dilutions, with the 10−1 dilution prepared by weight: 20 g of homogenate into 80 g sterile PBS. Subsequent 10-fold dilutions through 10−6 were prepared in PBS volumetrically, with each transferred in triplicate into test tubes containing alkaline peptone water.
Following incubation in alkaline peptone water at 35 °C for 18–24 h, dilutions containing turbid (positive) tubes were streaked onto modified cellobiose–polymyxin B-colisitin (mCPC) agar for V. vibrio and thiosulfate-citrate-bile salts-sucrose (TCBS) agar for V. parahaemolyticus, respectively. V. vulnificus produces bright yellow colonies of 1–2 mm in diameter with an opaque center and translucent margins on the mCPC agar. V. parahaemolyticus produces dark blue-green, opaque colonies of 2–3 mm on the TCBC agar. Following a 24 h incubation period on agar, typical colonies of each bacterium were isolated in 96-well plates for 4 h at 35 °C.
V. vulnificus was then transferred to enzyme immunoassay plates for the ELISA procedure [40] from 1999 to 2000. Thereafter, V. vulnificus was transferred to V. vulnificus agar (VVA) and verified using the alkaline phosphatase-labeled oligonucleotide probe protocol [41]. The V. vulnificus alkaline phosphatase-labeled gene probe (VVAP) was derived from the sequence of the V. vulnificus cytolysin structural gene, vvhA, and consisted of the following oligonucleotide sequence (nucleotides 1857 to 1880): 5′-XGA GCT GTC ACG GCA GTT GGA ACC A [41], where the 5′ X denotes alkaline phosphatase-conjugated 5′ amine-C6 [42,43].
V. parahaemolyticus colonies were transferred (in duplicate) to tryptone salt (T1N3) agar (1% tryptone, 3% NaCl, and 2% agar) for the gene probe procedure. Total and pathogenic tdh+ V. parahaemolyticus strains were verified in 1999 using biochemical testing as in the Bacteriological Analytical Manual [22], switching to alkaline phosphatase-labeled gene probes in 2000 for total V. parahaemolyticus [42] and pathogenic tdh+ V. parahaemolyticus [43], respectively. The nucleotide base sequence for the probe was from bases 904–927 of the V. parahaemolyticus tlh gene (accession number M36437), and the sequence for the tlh probe was 5′-XAA AGC GGA TTA TGC AGA AGC ACT G where the 5′ X denotes alkaline phosphatase-conjugated 5′ amine-C6 [42]. The sequence for the tdh+ probe was 5′-XGG TTC TAT TCC AAG TAA AAT GTA TTT G [43]. All probes were purchased from DNA Technology (Denmark). Filter preparation, hybridization, and colorimetric detection were conducted according to [42,43].
For bacterial enumeration, isolated colonies were lysed onto WhatmanTM 541 filters (Cytiva Life Sciences, Marlborough, MA, USA) prior to being exposed to their respective gene probe [41,42,43]. The positive results for the V. vulnificus and V. parahaemolyticus gene probes appear as dark brown–purple colonies on filters (negative results appear as tan-yellow colonies). The positives were compared with the original serial dilutions, and results were quantified using a most probable number (MPN) per gram procedure [22]. To assess the accuracy of the detection method, additional positive and negative controls were tested for both V. vulnificus and V. parahaemolyticus [41,42,43].

2.3. Isolation and Enumeration of P. marinus

To quantify P. marinus abundance, a 5 mm2 section of mantle tissue was incubated for two weeks at room temperature in Ray’s Fluid Thioglycollate Medium [28]. The infection intensity was assigned a numerical value ranging from 0 (no infection) to 5 (heavy infection) following the ranks in the Mackin semi-quantitative scale [44]. The findings by Dr. Ray were submitted to the oyster sentinel website (www.oystersentinel.cs.uno.edu; accessed on 2 August 2024).

2.4. Decomposition of Time Series

Monthly averages were estimated for the abundance of all Vibrio spp. in each year from 2000 to 2017. We detected a few missing observations in the time series for V. vulnificus (2.7% of total times series) and total V. parahaemolyticus (0.92%). These missing observations (“NA”) were filled in by applying a seasonal Kalman filter as recommended by Benavides et al. [45]. Because the seasonal Kalman filter cannot fill out NAs found at the beginning of a time series, the analysis of V. vulnificus was moved forward to cover the period from 2001 to 2017. A logarithmic transformation (log x + 1) was applied to the resulting time series, followed by its decomposition to obtain the trend, seasonal, and error components of each. An autocorrelation coefficient (ACF) was applied to the time series with itself at different lags and confirmed the seasonal component of each Vibrio spp. Time series analysis and resulting plots were performed in R software v4.0.5 [46], and RStudio v2023.12.0 [47] using stats v4.4.2 [46], tseries v0.10-58 [48] and zoo v1.8-12 packages [49].

2.5. Spatial Distributions

Annual and monthly averages of each Vibrio spp. were estimated for each station in Galveston Bay. In this region, winter falls from December to February, spring from March to May, summer from June to August, and fall from September to November. The results were plotted by color and size in geographical representations across the bay. We represented the data following an exponential scale to facilitate the visualization, and we only applied a log (x + 1) transformation to represent the pathogenic tdh+ V. parahaemolyticus abundance. The land path for Galveston Bay was obtained from GSHHS v2.3.7 (https://www.soest.hawaii.edu/pwessel/gshhg/ (accessed on 6 August 2024)). Maps were created in R and RStudio [47] and using “ggplot2” v.3.5.0 [50] and “sp” v1.4-5 packages [51].

2.6. Cross-Correlations Between Time Series

Because the protozoan parasite P. marinus alters the physiological conditions of the oysters [28,31,52], we ran statistical tests to determine if its presence makes them more susceptible to having high infections of Vibrio spp. To test this hypothesis, we used data on P. marinus measured on oysters collected at the same time as those used for the bacterial analysis. These data are available at Oyster Sentinel (www.oystersentinel.cs.uno.edu (accessed on 2 August 2024)). Sammy’s Reef is the station with the most frequent surveys during our study period. Because the initial exploration of the data showed missing observations starting in 2011, the cross-correlation factor (CCF) analysis was performed between P. marinus and the Vibrio spp. time series is limited to only from 2001 to 2010 at Sammy’s Reef. The results were interpreted using correlation coefficients at zero and negative lag values to test if P. marinus infers Vibrio spp. abundance at different time lags.

2.7. Environmental Effects on Vibrio spp.

We estimated monthly means for temperature and salinity from the in situ measurements during oyster collections. We also used the Oceanic El Niño Index (downloaded 23 August 2024, https://ggweather.com/enso/oni.htm) to indicate El Niño (positive values) and La Niña events (negative values). This index presents the three-month mean sea surface temperature anomaly for the Niño 3.4 region (our study area) in order to detect the occurrence of El Niño-Southern Oscillation (ENSO) events. These are defined as five consecutive overlapping 3-month periods equal to or greater than the +0.5° anomaly for warm (El Niño) events and equal or below the −0.5 anomaly for cool (La Niña) events. ENSO events were further categorized into weak (range from 0.5 to 0.9 SST anomaly), moderate (1.0 to 1.4), strong (1.5 to 1.9), and very strong (≥2.0). Most of the years in the period studied (2000–2017) coincided with the occurrence of ENSO events. Most of these events were classified as weak either during El Niño (2004, 2006, and 2014) or La Niña events (2000, 2005, 2008, and 2016–2017). Moderate events occurred in fewer amounts (El Niño: 2002 and 2009 and La Niña: 2011) as well as the strong and very strong events that were reported in just a few years (El Niño: 2015 and La Niña 2007 and 2010). No ENSO events occurred in 2001, 2003, and 2012–2013. To estimate if Vibrio spp. abundance had a positive or negative relation with environmental variables, Pearson correlation coefficients (r), and the significance of these correlations was estimated for each pair of variables. Correlation coefficients, p-values, and plots were obtained using the ggpubr v0.6.0 package [53].

3. Results

During the study period, 21,613 oysters were examined from six reefs, resulting in 1853 bacterial assays. We did not consider results from 1999 (2187 oysters, 183 bacterial assays) and 2018 (251 oysters and 21 assays) in the time series analyses due to missing information throughout those years (01/1999 to 03/1999 and 07/2018 to 12/2018); however, we did include these data in the spatial distributions for reference. Of the oysters tested, 1398 assays (75%) were identified as positive for V. vulnificus, 1679 (91%) total V. parahaemolyticus, and 128 (7%) pathogenic tdh+ V. parahaemolyticus, respectively. The remaining 103 assays (6%) of oysters tested were found not to be positive for these bacteria. Similarly, in an analysis of the oysters examined at Sammy’s reef, P. marinus was found to have impacted 87% (2545) of the oysters sampled (2931) while the remaining 13% (386) oysters tested were not positive for P. marinus.

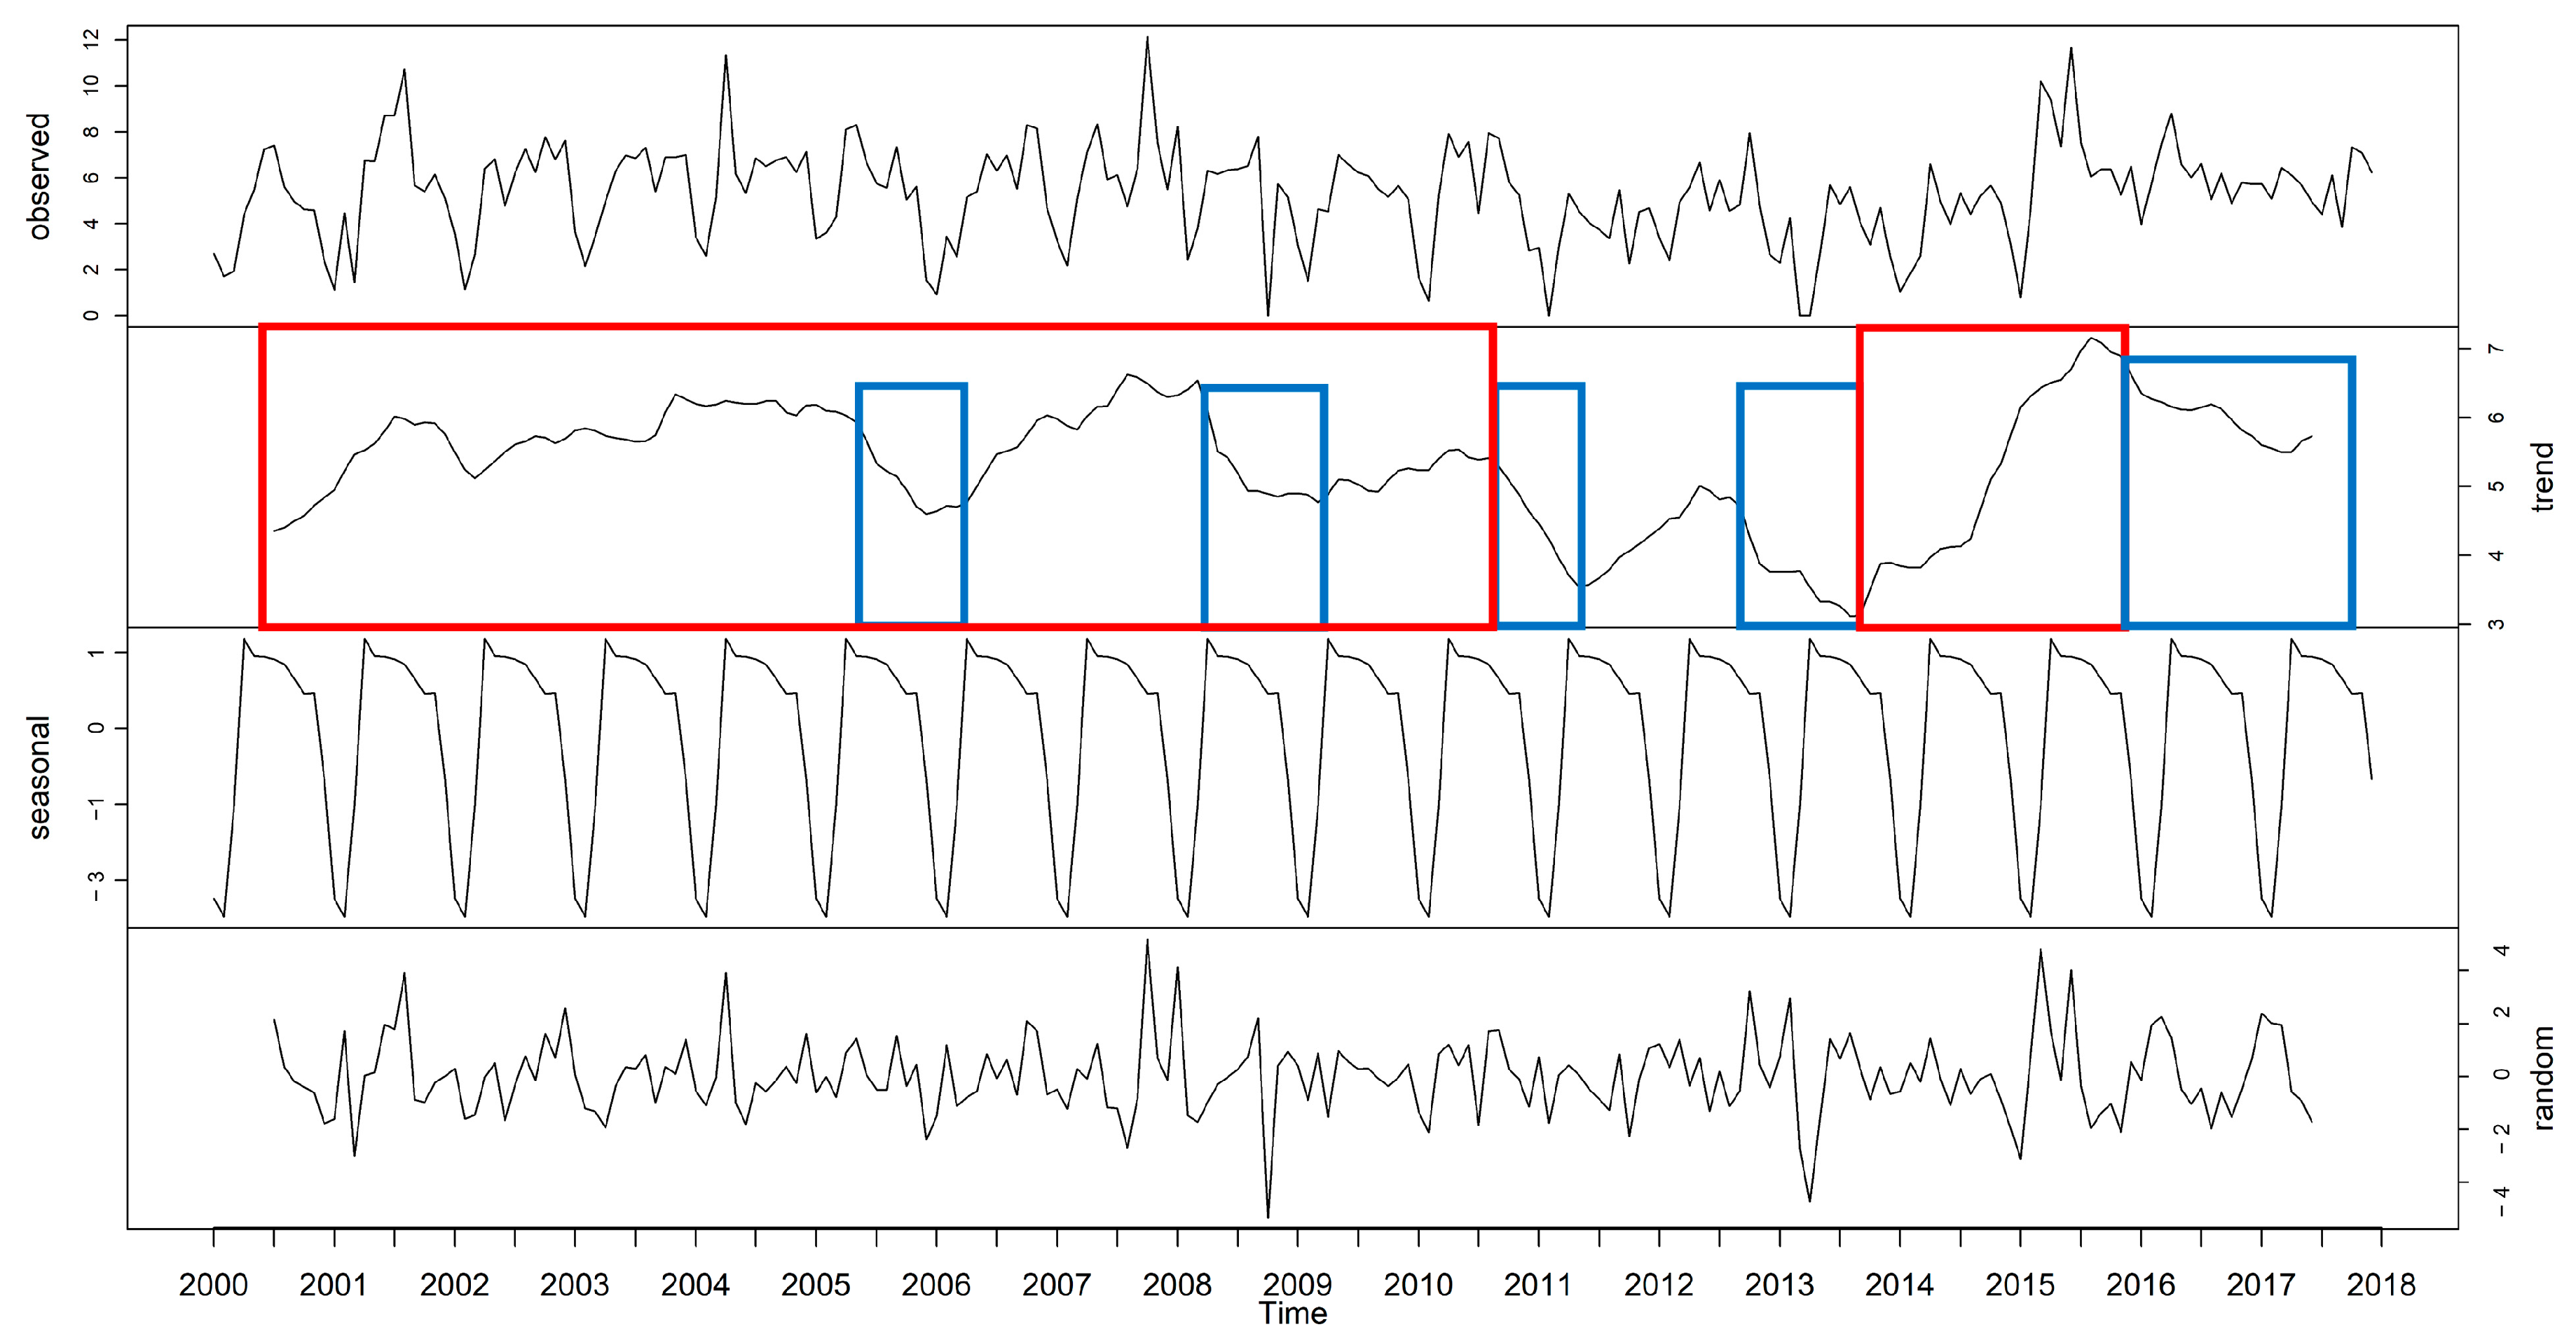
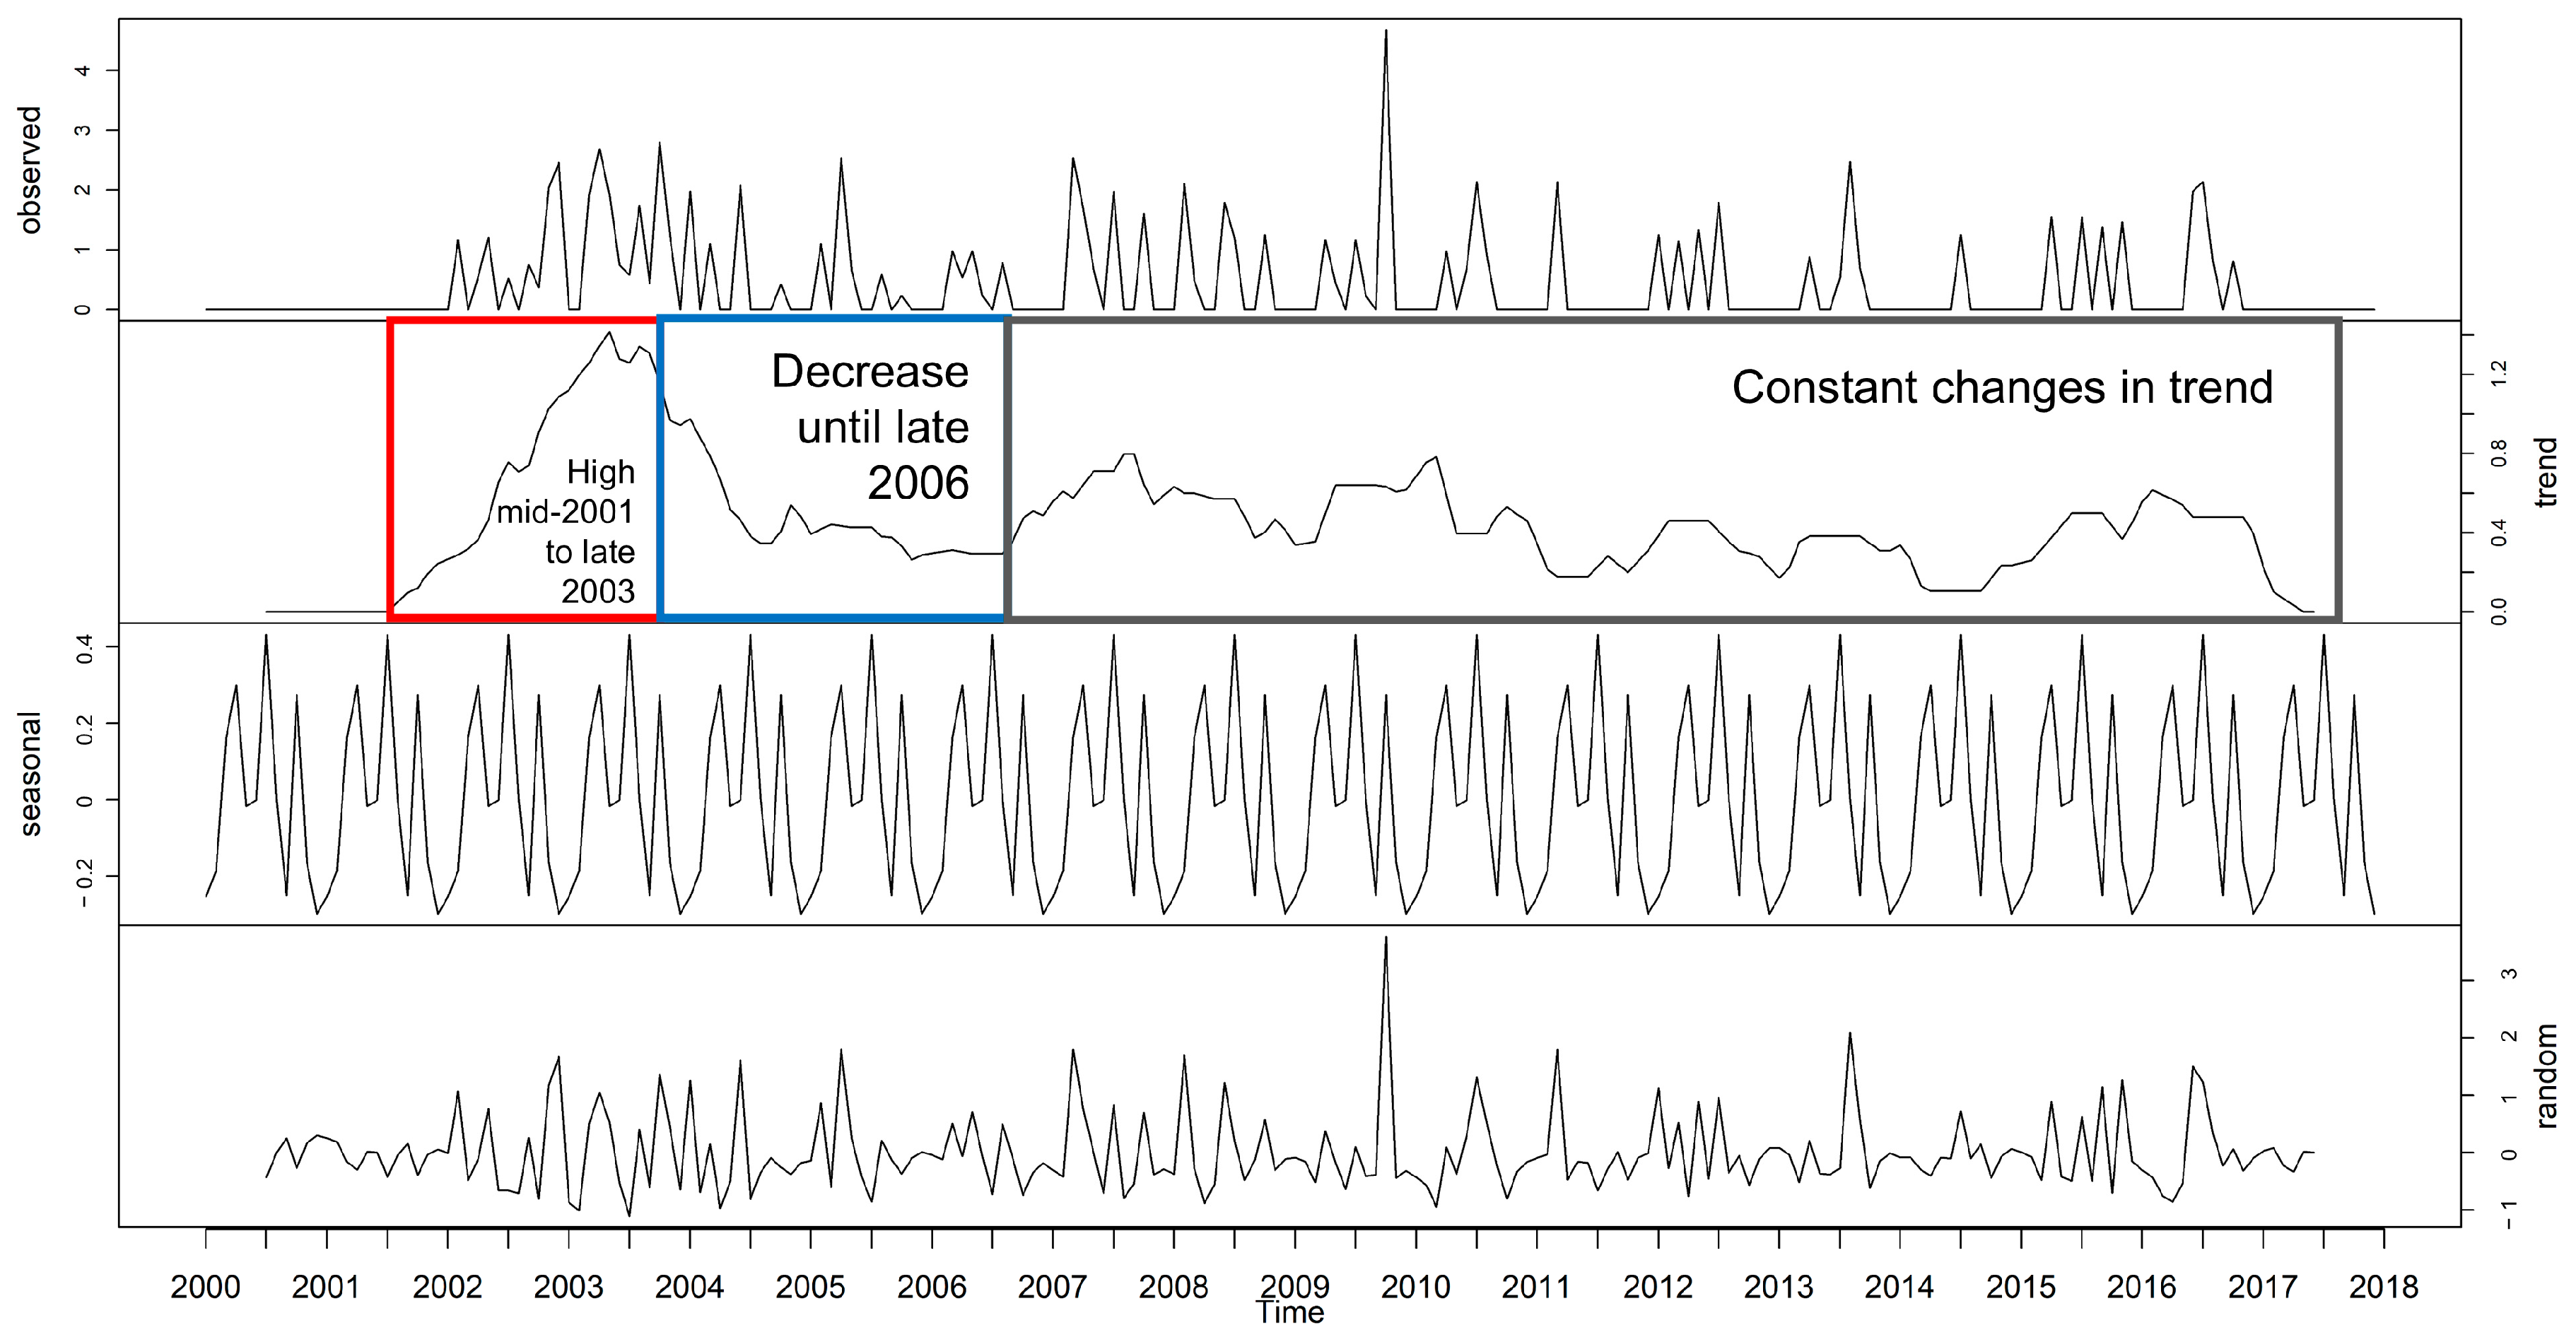
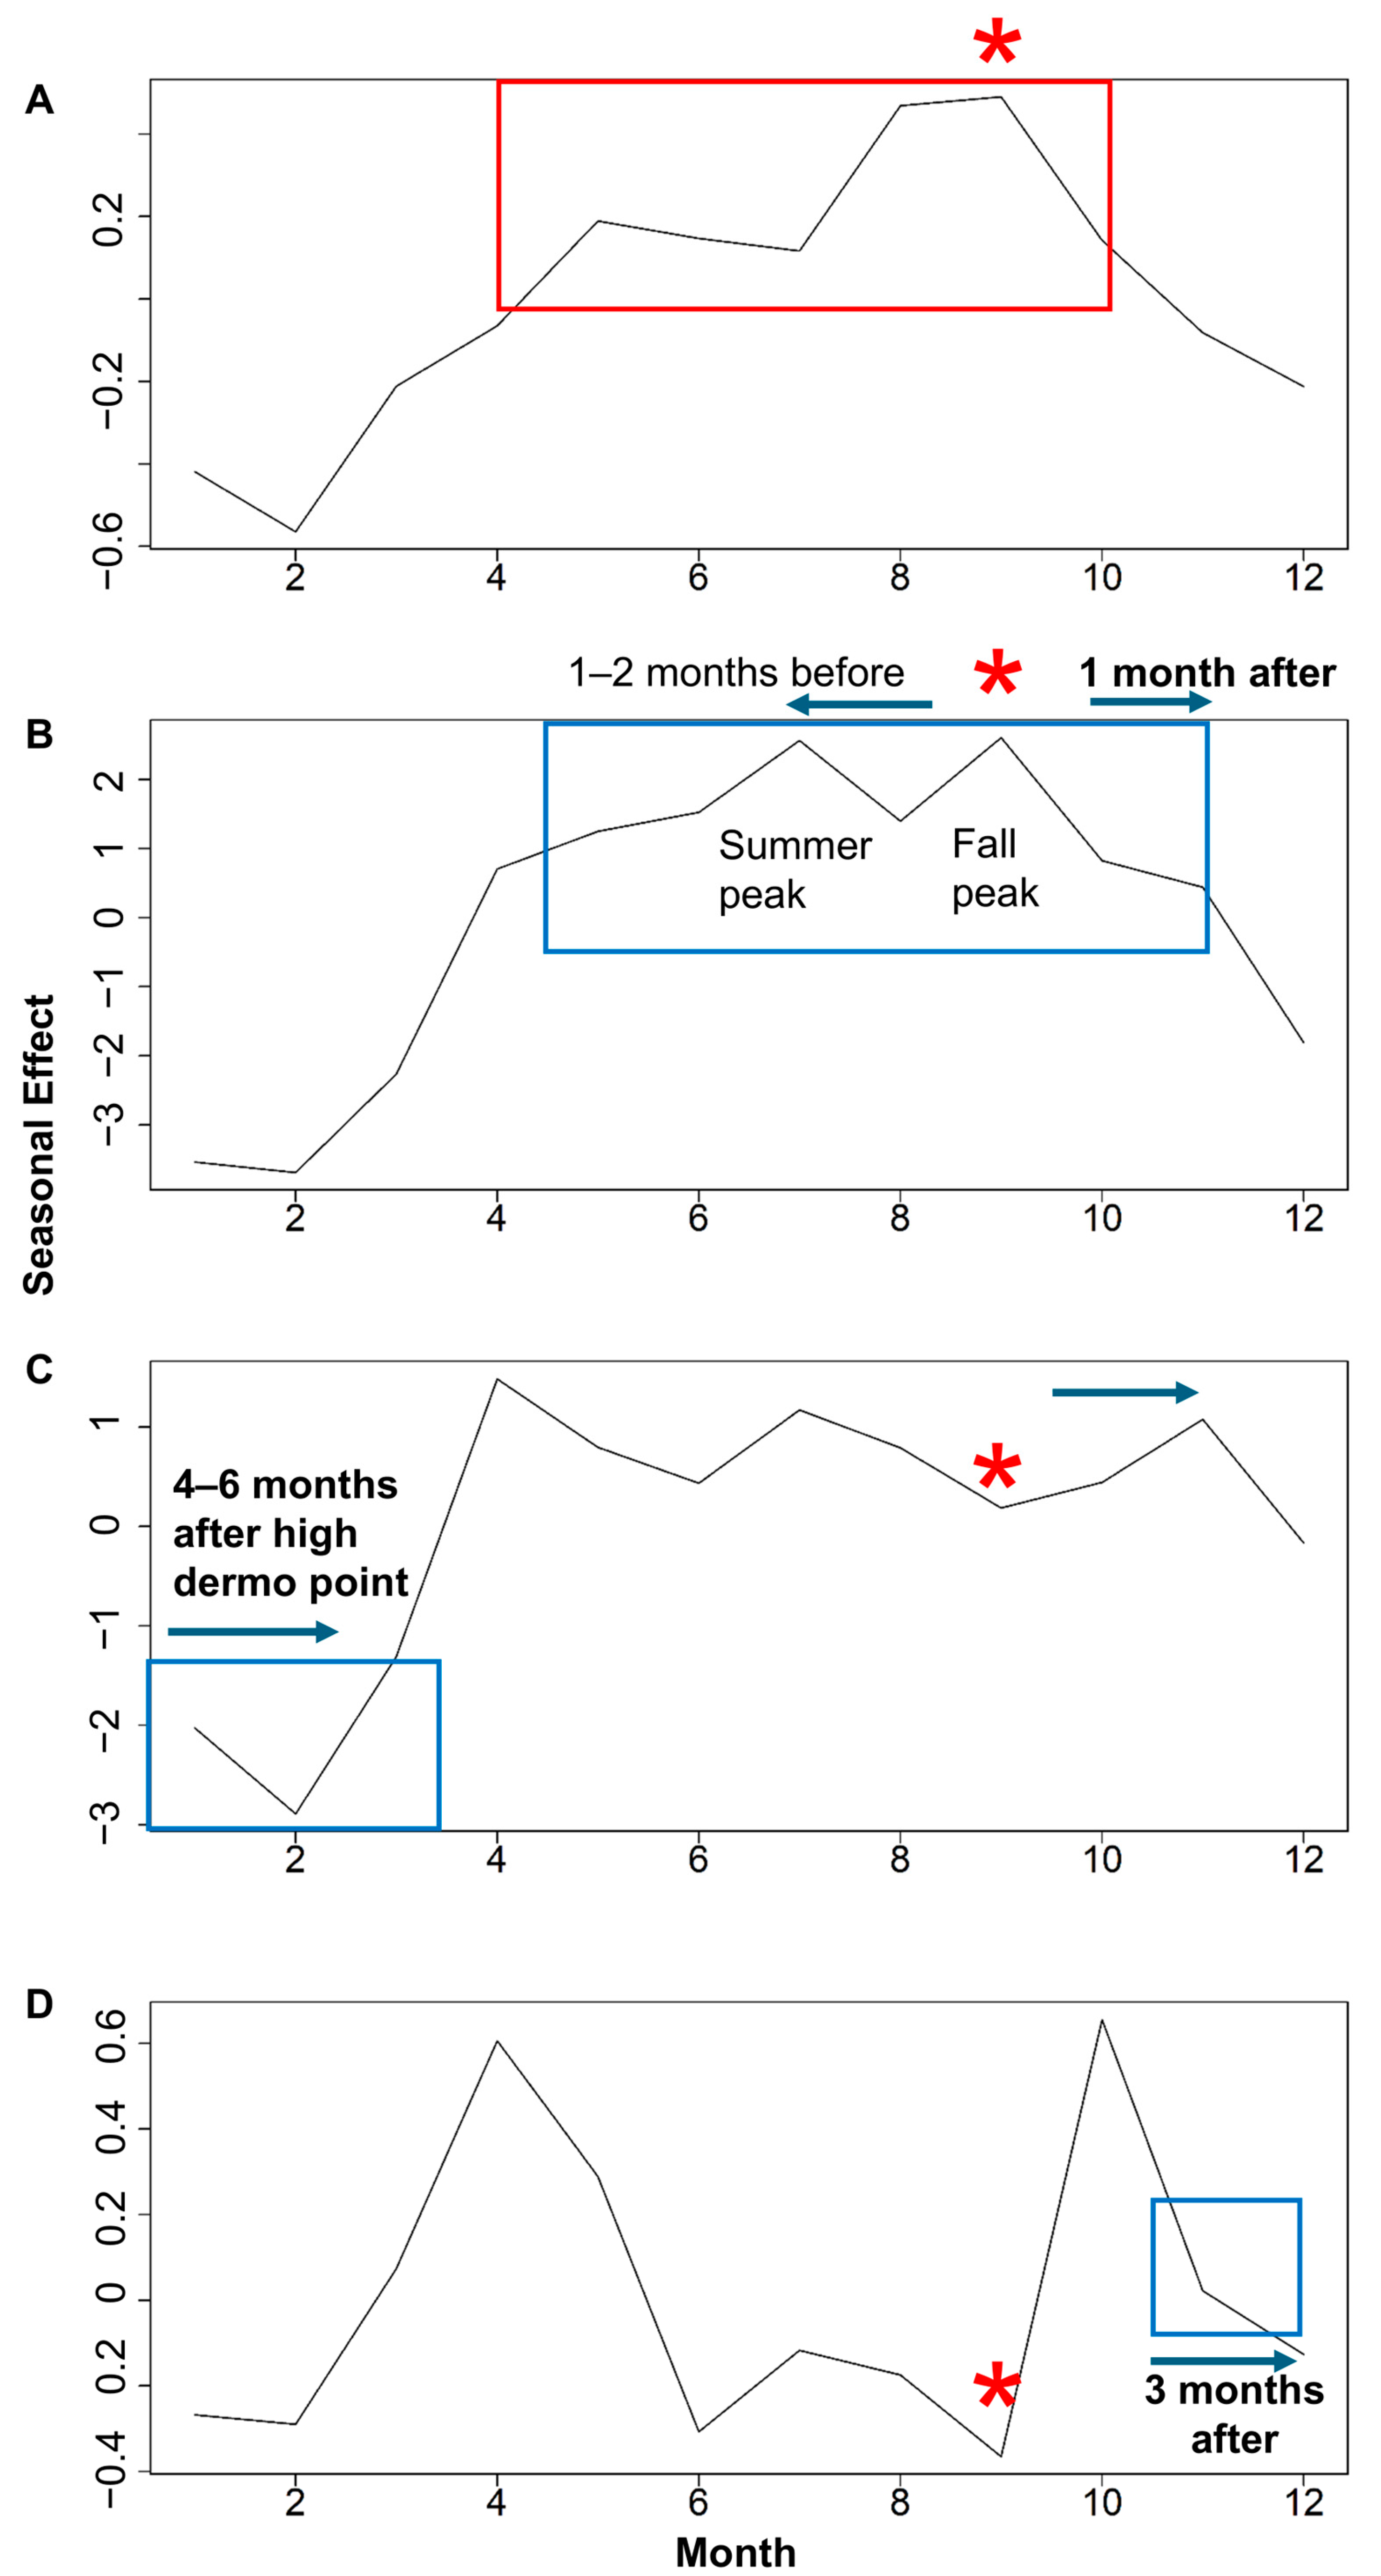
3.1. Time Series Decomposition: Trend, Seasonal, and Random Error

The decomposition of the time series show that V. vulnificus, total V. parahaemolyticus, and pathogenic tdh+ V. parahaemolyticus (Figure 2, Figure 3 and Figure 4) followed a seasonal pattern over time, confirmed only for V. vulnificus, total V. parahaemolyticus by the autocorrelation coefficients. High abundances were observed for all Vibrio species during the early and mid-2000s, their abundance peaked again in the mid- and late 2010s but exclusively for V. vulnificus and total V. parahaemolyticus. V. vulnificus was the only species that showed a long-term trend. Errors in the quantification of Vibrio abundance were associated with peaks or strong drops of abundance. More specifically, we observed a clear trend and seasonal effect on the abundance of V. vulnificus (Figure 2). Its maximum abundance occurred during the summer, decreased throughout the fall, and remained in low abundance during spring and winter. We also observed a shift in the trend every 7 to 8 years, that is, V. vulnificus abundance was high from 2001 to early 2008, decreased from early 2008 to mid-2014, and then increased again from late 2014 to mid-2017. Random errors did not show a trend throughout the entire time series. The shift in the trend and the strong seasonality in the abundance of V. vulnificus was supported by the significant oscillating autocorrelation coefficients of the time series with itself at different lags (Figure S1A).
We did not observe a clear pattern in the trends of total V. parahaemolyticus (Figure 3); rather, the decomposition of the time series shows two periods of high abundance and a few short periods of decreasing numbers. High abundance occurred from 2000 to the mid-2010s with a few decreases during the fall–winter seasons of 2005–2006, 2008–2009, 2010–2011, and 2012–2013. The decreasing abundance of total V. parahaemolyticus extended until early fall during 2012–2013. We observed an increasing total V. parahaemolyticus trend from late 2013 to late 2015 that decreased afterward. Seasonality of total V. parahaemolyticus suggests a stronger effect than the long-term trend. The highest abundance occurred during the spring and slowly decreased until late fall; winter shows a significant drop in the abundance of total V. parahaemolyticus. Higher random errors were observed with strong changes in the trend. The lack of a long-term trend and the seasonal component of total V. parahaemolyticus was supported by the significant correlation coefficients of the time series with itself in the first months (lag < 1 year, Figure S1B).
The abundance of pathogenic tdh+ V. parahaemolyticus (Figure 4) did not show a clear long-term trend produced by seasonal peaks in most of the seasons. Instead, we observed increasing numbers of pathogenic tdh+ V. parahaemolyticus from mid-2001 to late 2003 followed by a decrease that lasted until late 2006. Afterward, we observed constant changes in the trend of pathogenic tdh+ V. parahaemolyticus with low abundance in the most recent data (2018). Seasonal effect reveals three peaks of pathogenic tdh+ V. parahaemolyticus that occurred in the beginning of spring, summer, and fall, followed by a strong decline during the winter. Summer season had the highest abundance of pathogenic tdh+ V. parahaemolyticus. However, the autocorrelation coefficients did not show a significant seasonal component and supported the lack of long-term trend (Figure S1C). Errors did not show a trend but coincided with the peaks of abundance observed in original data.

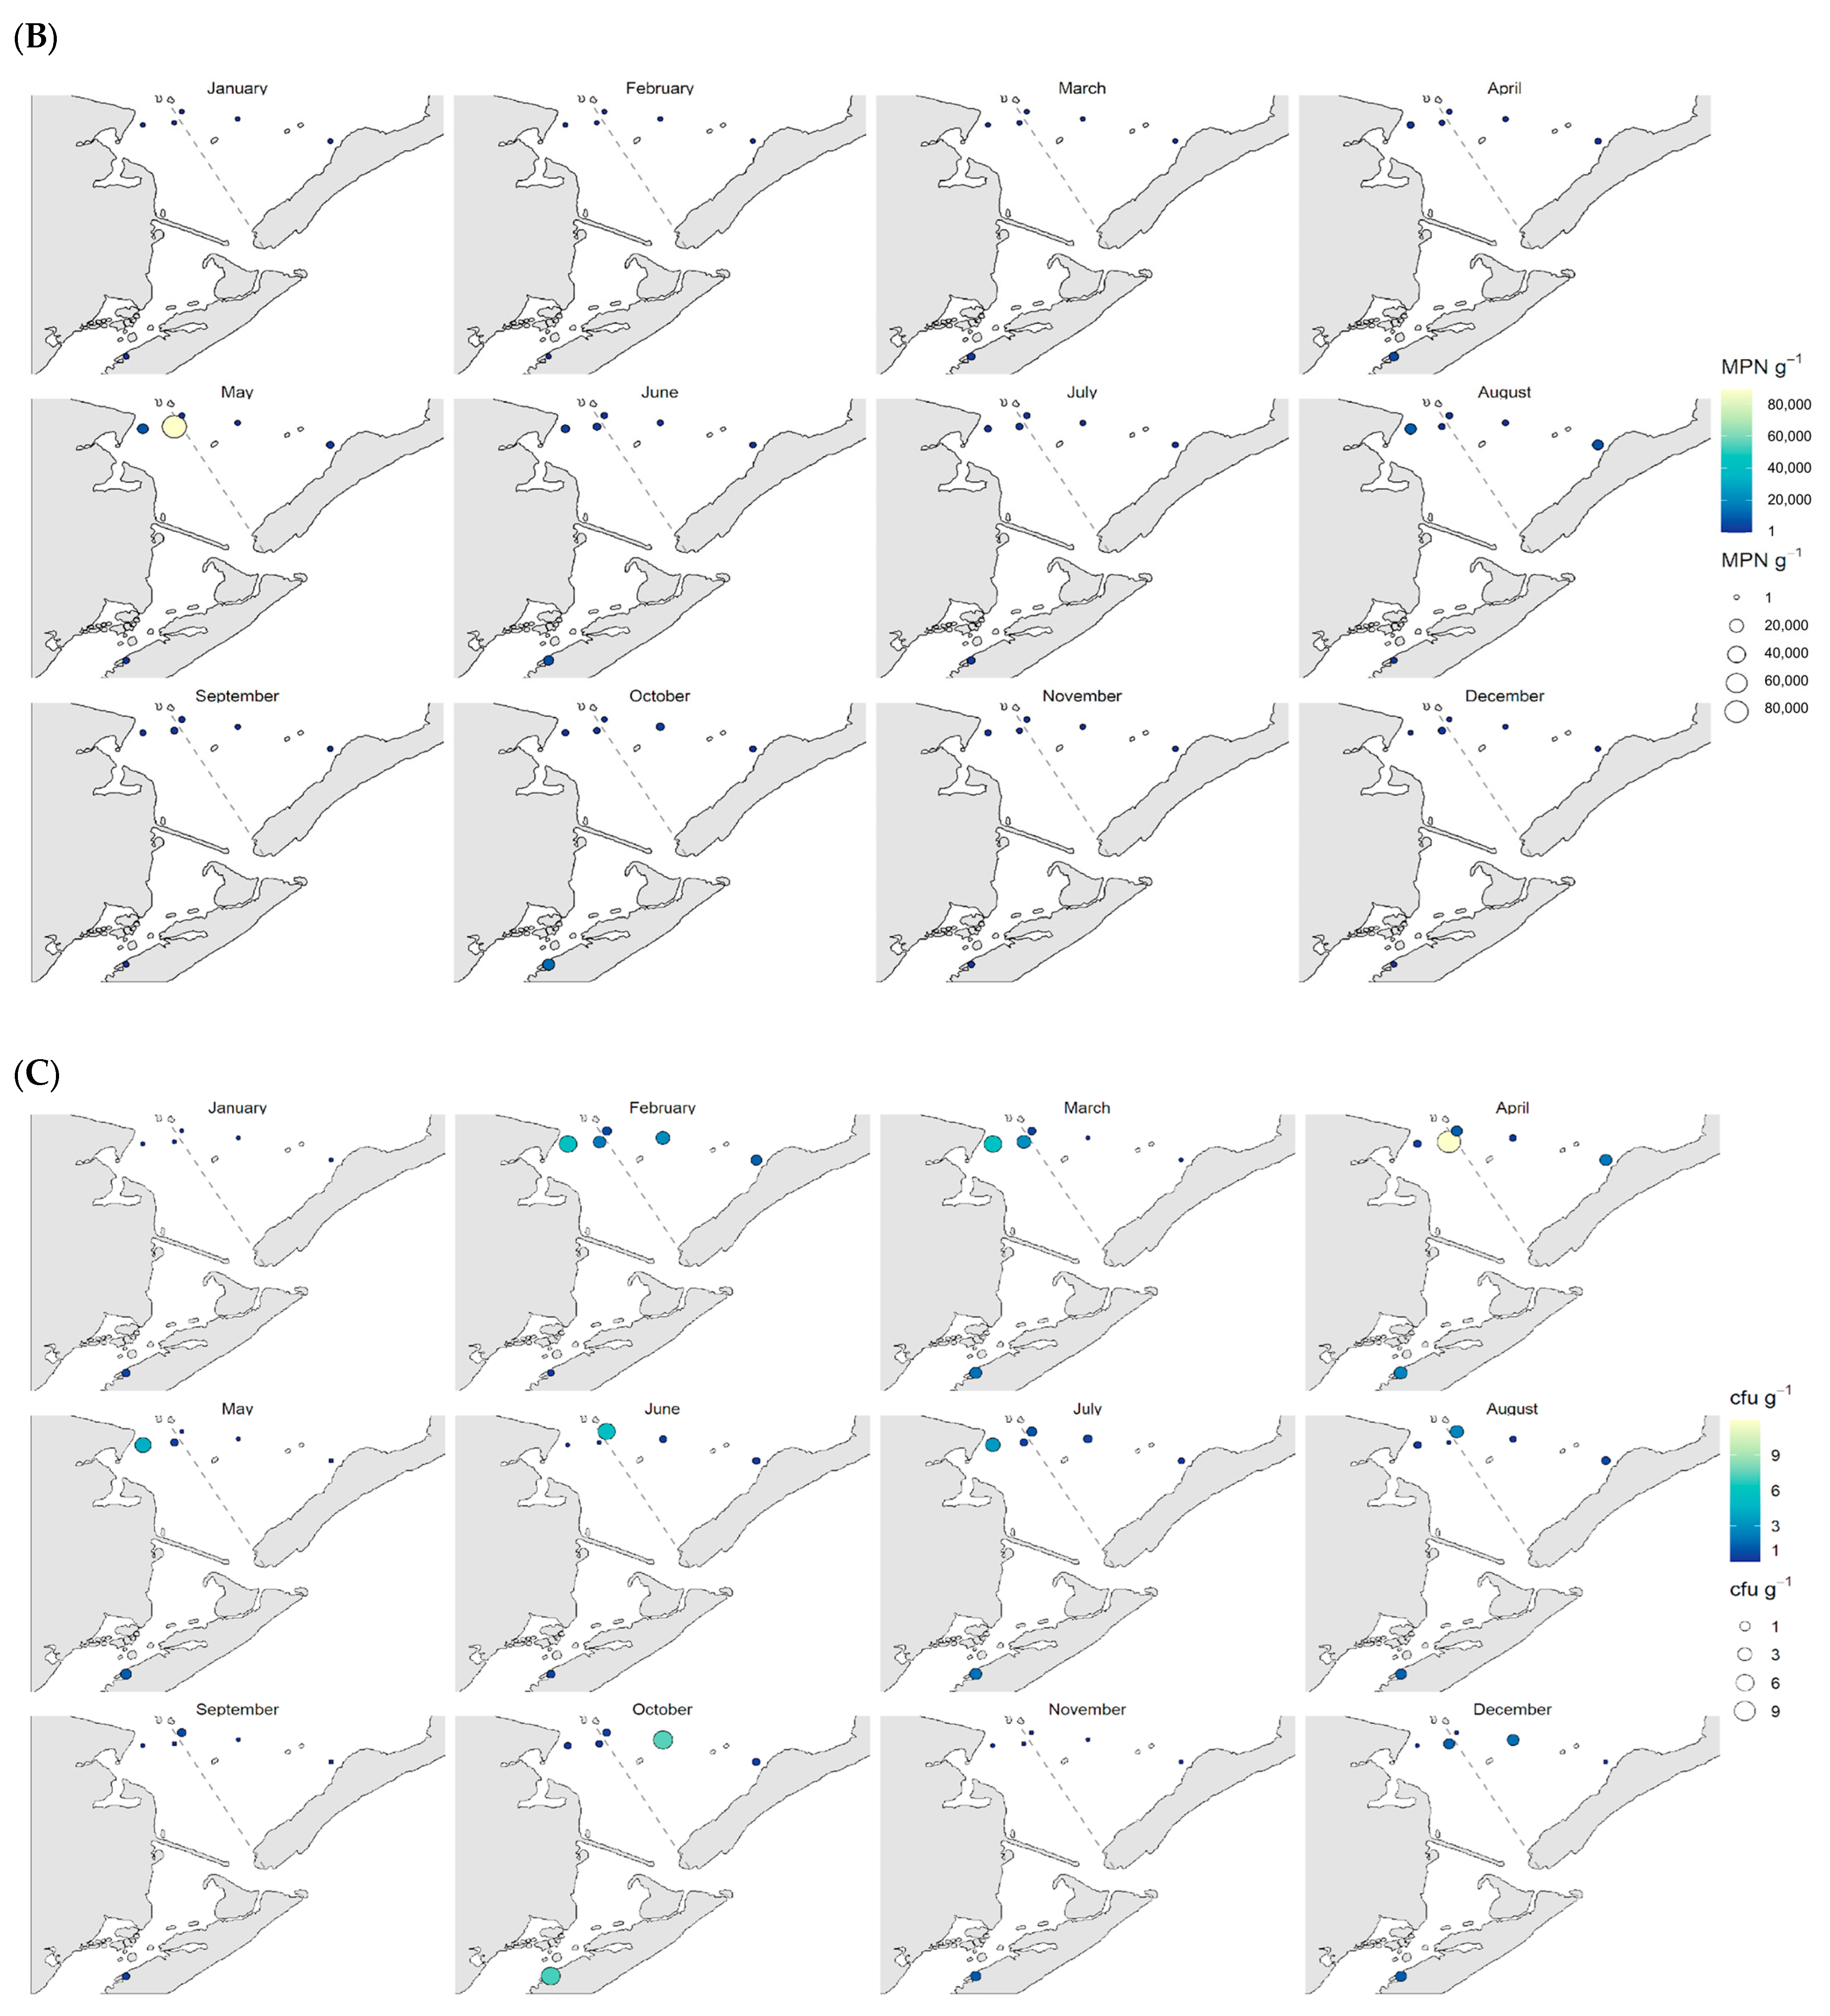
3.2. Spatial Distribution of Vibrio spp.

Spatial representations suggest an uneven distribution of Vibrio spp. abundance across reefs in Galveston Bay. The distribution of V. vulnificus shows peaks of abundance in 2001, 2006, 2007, and 2008 in the stations closer to the shore (L390 and L301) (Figure S2A). This high abundance occurred during the summer months and late spring (Figure 5A). The lowest abundance of V. vulnificus occurred from November to March. The distribution of total V. parahaemolyticus also shows a peak in the stations close to the shore that occurred in 2001 (Figure S2B) that was led by May high abundance (Figure 5B). Total V. parahaemolyticus remained under 25,000 MPN g−1 for most of the time series and decreased throughout the year after the summer peak. The distribution of pathogenic tdh+ V. parahaemolyticus shows multiple peaks that occurred throughout the 2000s (2003, 2004, 2005, 2007, 2008, and 2009) (Figure S2C). Particularly, the high abundance observed in 2003 occurred in most of the stations (except L301) whereas high abundance in the following peak years was observed close the shore (Figure S2C). Monthly distribution of pathogenic tdh+ V. parahaemolyticus shows multiple peaks throughout the year (Figure 5C) as suggested in the decomposition of the time series analysis (three peaks: spring, summer, and fall). High abundance was observed in spring, summer and fall in the stations close to the shore except in October when high abundance of pathogenic tdh+ V. parahaemolyticus was observed in deeper waters (L414).

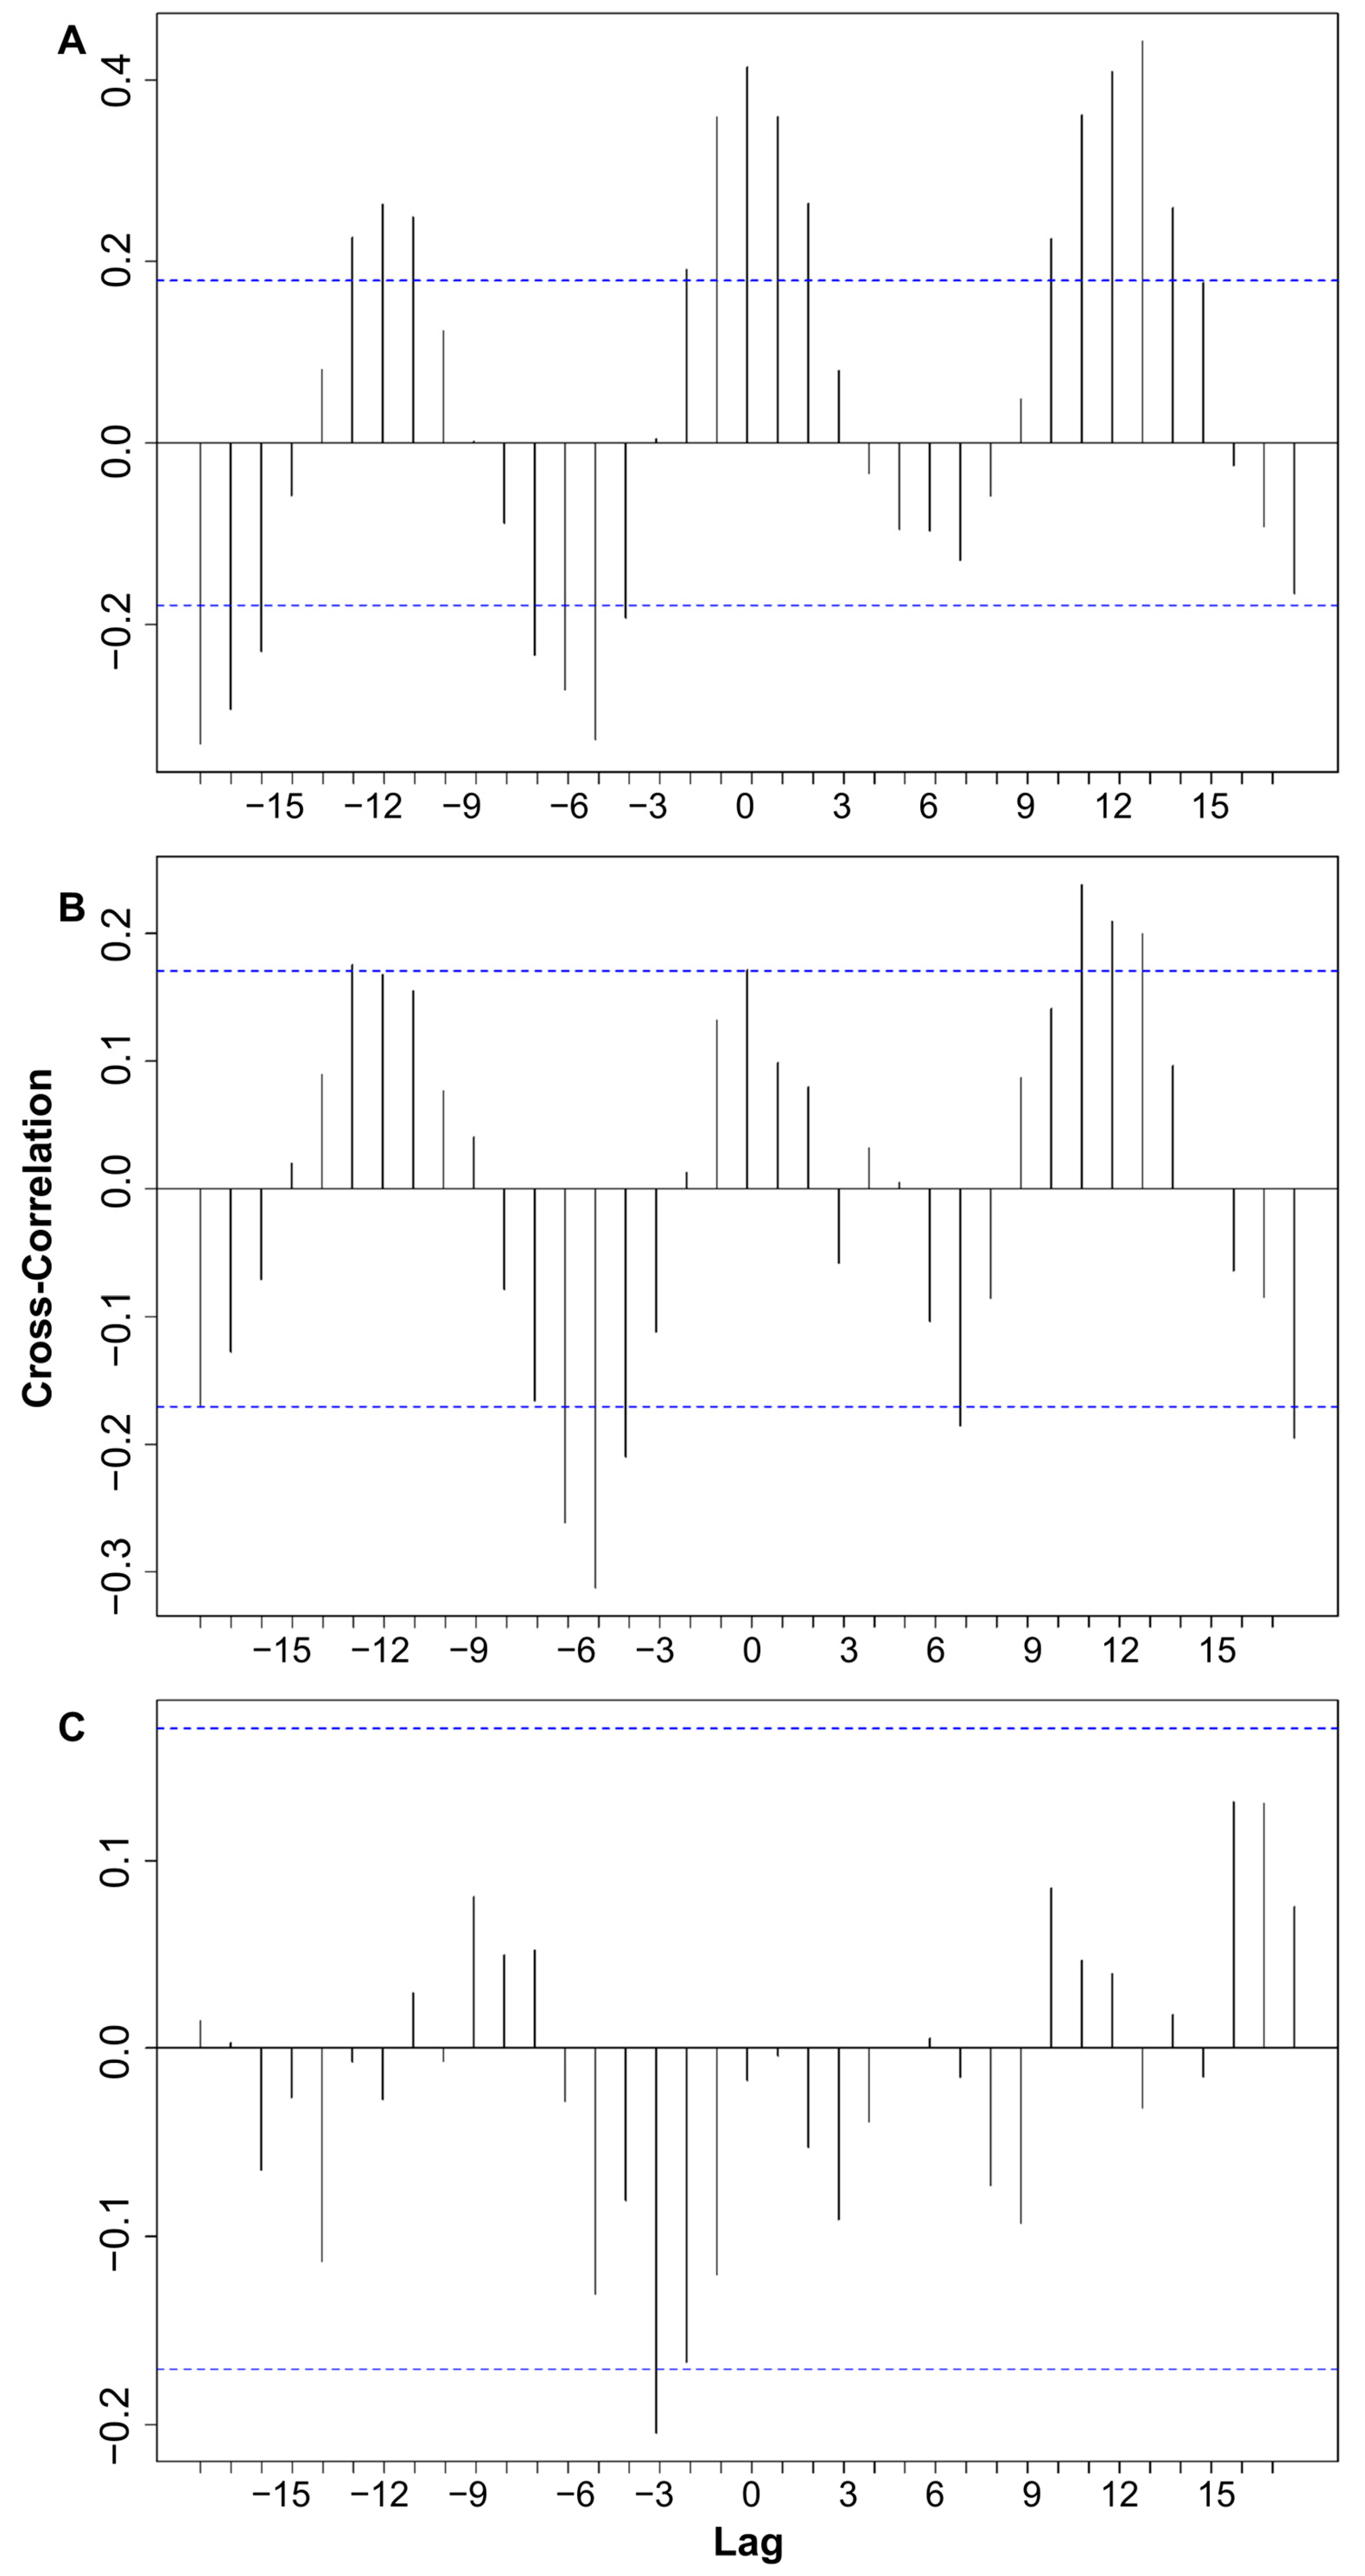
3.3. Cross-Correlations Between Time Series

Because the protozoan parasite P. marinus alters the physiological conditions of the oysters, we tested the hypothesis that this may make oysters more susceptible to having high infections of Vibrio spp. By itself, P. marinus has a strong seasonal component in its abundance across Galveston Bay (Figure S1D) that increases during the summer and peaks in the fall (Figure 6). The cross-correlation analysis indicates a seasonality pattern in the co-occurrence of P. marinus and V. vulnificus from 2001 to 2010 (Figure 7A). We found significant correlations at positive lags 0, 1, 2, 10, 11, and 12 and negative lags −1, −2, −4, −5, −6, and −7. We only used the results at zero and negative lag values to test if P. marinus infers V. vulnificus abundance. The strongest positive correlations (lags 0, and −1, r = 0.4147 and r = 0.3590, respectively) suggest that V. vulnificus numbers are high during high P. marinus infections (lag 0), and 1 month after high P. marinus infections (lags −1) (Figure 7A). Two months after the correlations between time series are significant but reduced (lag −2, r = 0.1913) (Figure 7A). This pattern can be observed in the seasonal decomposition of each time series (Figure 6A,B), where the fall peak of V. vulnificus coincides with the peak of P. marinus during September, and high numbers of V. vulnificus are also observable one month after. The interpretation of positive lags does not allow us to infer the abundance of V. vulnificus due to P. marinus effects. However, the high correlations one and two months before P. marinus high infection (lag 1 and 2, r = 0.3598, and r = 0.26434, respectively) shows that the summer peak of V. vulnificus coincides with increasing infection intensities of P. marinus during the summer (Figure 6A,B).
Cross-correlations between P. marinus and total V. parahaemolyticus indicate a weak seasonal pattern in the co-occurrence of both species. We found significant correlations at positive lags 7, 11, and 12 and negative lags −4, −5, and −6 (Figure 7B). Significant correlations of the negative lags did not indicate that P. marinus infers high abundance of total V. parahaemolyticus, instead it shows low bacterial abundance after 4 to 6 months of high P. marinus infections (lag −4, r = −0.21, lag −5, r = −0.31 and lag −6, r = −0.26) (Figure 7B). This lack of association might be produced by the multiple peaks of total V. parahaemolyticus throughout the year (Figure 6C). The analysis between P. marinus and pathogenic tdh+ V. parahaemolyticus did not show a clear seasonal pattern between the two-time series (Figure 7C). The results only showed a significant correlation at lag −3 (r = 0.21), suggesting that pathogenic tdh+ V. parahaemolyticus decrease after 3 months of high P. marinus infections. However, we did not detect the co-occurrence of a high abundance between both species (Figure 6C). Both Total V. parahaemolyticus and pathogenic tdh+ V. parahaemolyticus decrease at different time lags after high P. marinus infections.

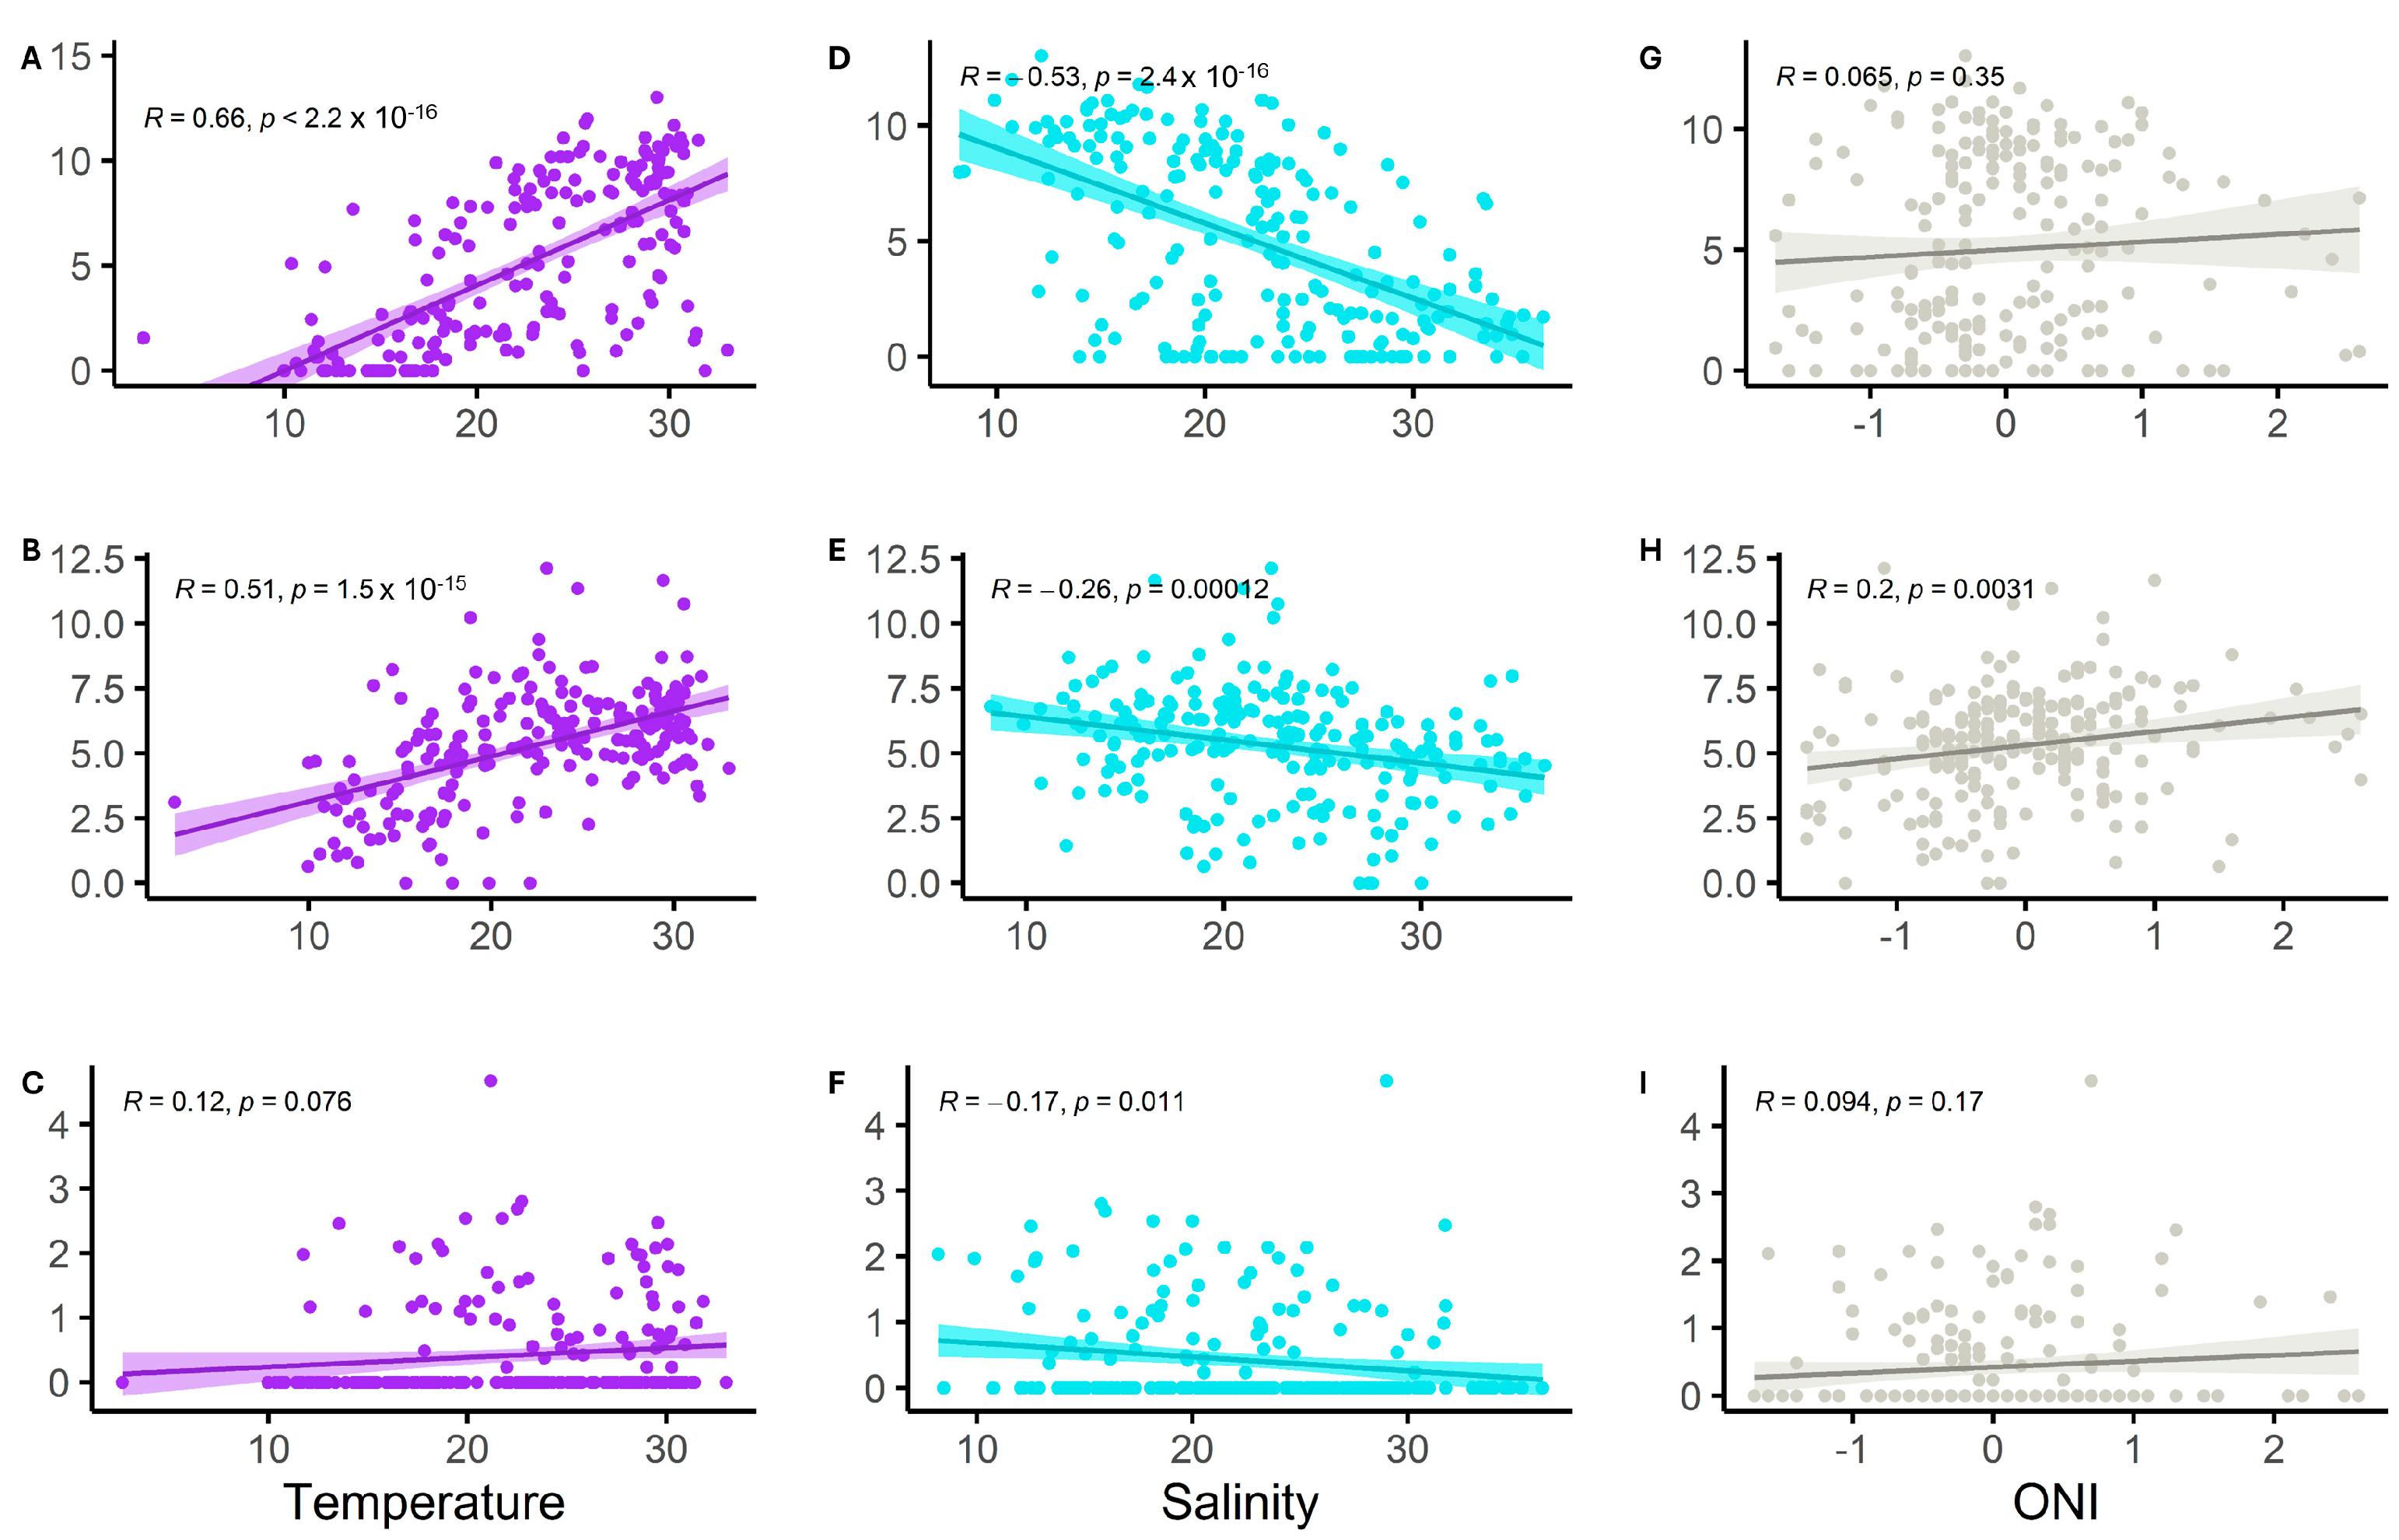
3.4. Environmental Effect on Vibrio spp. Abundance

Pearson correlation coefficients showed different levels of relations between the environmental data and the abundance of Vibrio spp. Temperature had a strong positive correlation with V. vulnificus and V. parahaemolyticus (r = 0.66 and 0.51, respectively, Figure 8A,B) suggesting more abundance of both species at warmer temperatures. This correlation did not exist for the pathogenic tdh+ V. parahaemolyticus (r = 0.12, Figure 8C). The correlation of Vibrio spp. with salinity showed an opposite trend. Abundance of V. vulnificus and V. parahaemolyticus decreased with higher salinities (r = −0.53 and −0.26, respectively, Figure 8D,E) and it was weak for the pathogenic tdh+ V. parahaemolyticus (r = −0.17, Figure 8F). For the results with the Oceanic Niño Index, we only found a positive correlation with total V. parahaemolyticus (r = 0.2, Figure 8G), suggesting more bacterial abundance during El Niño events.
Cross-correlations between time series confirmed our findings in the association between environmental variables and Vibrio spp. High abundance of V. vulnificus occurred during the highest temperatures (lag 0, r = 0.66) and remained high up to 2 months after (r = 0.54, and 0.32 at lag −1 and −2, respectively), a significant decrease in V. vulnificus was observe 4 months after the warm event (r = −0.34, lag −4) (Figure S3A). This pattern was also observed between temperature and total V. parahaemolyticus at the same time lags but with lower correlations (r = 0.51, 0.44, 0.28 and −0.22 for lag 0, −1, −2, and −4, Figure S3B). As with the Pearson correlations, we did not find a significant co-occurrence between warm temperatures and pathogenic tdh+ V. parahaemolyticus at any time lag (Figure S3C). CCFs with salinity showed significant decreases in the abundance of V. vulnificus and total V. parahaemolyticus during high salinity conditions (lag 0) and up to 7, 6 and 4 months after high salinity events for V. vulnificus, total V. parahaemolyticus and pathogenic tdh+ V. parahaemolyticus, respectively (lags −1 up to −7, Figure S3D–F). Contrary to our findings with the Pearson correlations, CCF’s showed seasonal patterns in the co-occurrence of the Oceanic Niño Index and Vibrio spp. However, CCF’s were weaker (<0.21) compared to CCF’s with temperature (<0.66) and salinity (<0.53). High abundance of V. vulnificus occurred 5 months after an El Niño event and remained elevated for up to 11 months after the event (lags −5 to −11, Figure S3G) whereas high abundance of total V. parahaemolyticus occurred during El Niño event (lag 0) and then stayed high throughout the year (lag −1 to −12, Figure S3H). High numbers of pathogenic tdh+ V. parahaemolyticus after an El Niño event occurred sooner (3 months after) compared to V. vulnificus and total V. parahaemolyticus (Figure S3I).

4. Discussion

Vibrio spp. are ubiquitous in estuaries and coastal waters throughout the world. While most of these bacteria are harmless, several species can potentially infect humans or animals and cause serious disease. Of those, Vibrio cholerae, Vibrio vulnificus, and Vibrio parahaemolyticus are the most important pathogens, and the latter two are particularly dangerous when combined with oysters, which filter and concentrate them internally [8,54]. V. vulnificus infections were reported to the Centers for Disease Control and Prevention from 23 states in the US between 1988 and 1996 [6]. All trace-backs implicated oysters harvested in the Gulf of Mexico, and in 89% of cases, when oysters were harvested in water with temperatures > 22 °C [6]. Further, implicated oysters could be traced back to major oyster harvesting regions, including those in Texas, Louisiana, and Florida [6,22]. Subsequently, the sudden emergence of the global V. parahaemolyticus pandemic in 1995 and a consequent rise in the number of outbreaks related to seafood consumption called for immediate monitoring of seafood safety procedures, seafood, and surrounding waters [14,20,21]. Since then, the prevalence of V. vulnificus and V. parahaemolyticus in freshly harvested oysters is well documented [5,6,22]. Vibrio spp.-mediated outbreaks, and oyster beds around the outbreak regions, result in closures until the pathogen(s) can no longer be detected or the water temperature becomes unsuitable for the proliferation of the pathogen [6,20]. C. virginica can concentrate Vibrio spp. up to 6 × 10⁴ CFU/g, from surrounding waters containing only 7 CFU/mL [55]. In a review, Froelich and Oliver [11] concluded that oyster bacterial populations are not directly dependent on the bacterial abundance or types present in the surrounding waters. Looking at a broader scale, Raszl et al. [54] reviewed Vibrio spp. reports in South America and found that infections from V. parahaemolyticus were more frequently reported on the Pacific coast of South America, while V. vulnificus was more heavily reported along the Atlantic coast of South America. Hence, more work is needed to understand the distribution of bacteria amongst and between oysters.

4.1. Oysters and V. vulnificus

V. vulnificus populations fluctuate seasonally, with many studies finding that oysters harvested during the summer months have a greater likelihood of containing bacterial cells, and at higher concentrations, than oysters from the winter months [56,57]. This includes oysters in Galveston Bay, in which Vanoy et al. [37] reported that the major increase in V. vulnificus occurred only after the seawater temperature had increased above 20 °C and the winter–spring rainfall had lowered the salinity to below 16‰. Lin et al. [55] reported that no V. vulnificus could be detected during the winter months (December–February) in Galveston Bay oysters. Temperature may account for as much as 50% of the variability in V. vulnificus density between studies, including the present work [10,36,37,56,57,58]. The lowest temperature range in which culturable V. vulnificus in oysters varies from 12 °C to 17 °C [6,57,59]. Some studies have, however, found no correlation with temperature; but these observations are associated with studies in tropical climates where seasonal temperature changes are not as striking as those in temperate climes and/or those in which water temperatures remain above 26 °C year-round [11,58].
V. vulnificus has only been recovered in waters with oysters growing at a salinity of at least 5‰ but never from the open ocean, consistent with its halophilic nature [11]. Parvathi et al. [58] found V. vulnificus in oysters from low salinity (<2.6‰) to brackish water (∼6‰), but it was largely absent when salinities increased to >25‰. Reports regarding high salinities (∼25‰ or greater) agree that these conditions have an inhibitory or detrimental effect on V. vulnificus populations in oysters [11]. Parvathi et al. [58] found a nonlinear relationship between V. vulnificus density in oysters when salinities varied over a sufficiently wide range (i.e., <3 to >30‰). On the other hand, Lin et al. [56] sampled oysters in Galveston Bay in salinities ranging from 5 to 25‰ and found no correlation. Others have found a correlation in V. vulnificus densities in water, but not in the oysters inhabiting those waters, when the salinity in these environments ranged from 0 to >30‰ [57]. Interestingly, Motes et al. [59] reported that V. vulnificus was present in much lower concentrations in years coinciding with unusually high salinity. Nonetheless, measuring salinity alone is insufficient to explain the distribution of this bacteria in oysters.

4.2. Oysters and V. parahaemolyticus

As part of a meta-analysis of V. parahaemolyticus in seafood, Odeyemi [60] found that the overall prevalence rate in oysters was 63.4% (95% CI 0.592–0.674), much higher than that for clams (52.9%), fish (51%), shrimp (48.3%) and mussels, scallop, and periwinkle (28%). Similarly, Yang et al. [61] reported that the prevalence of V. parahaemolyticus was higher in oysters (30.4%) than in the other seafood samples. Further, the prevalence and distribution of V. parahaemolyticus are influenced by factors including water temperature, salinity, and oxygen concentrations, interactions with plankton, presence of sediment, suspended organic matter, and marine organisms [4,62]. Overall, it appears these associations are dependent on the geographical location, as well as the range of temperature and salinity occurring during the study period [5]. V. parahaemolyticus concentrations in oysters are known to increase in summer [20,21], which is not surprising given that their optimum growth temperature is 35–37 °C [60]. An examination of seafood in China from 2015 to 2017 conducted by Yang et al. [61] reported that the prevalence of V. parahaemolyticus in summer (33.4%) was higher than that in winter (14%). Other studies which have shown that V. parahaemolyticus outbreaks typically peak in the warmer months include Daniels et al., [16] who examined oysters in US waters. For this reason, elevated water temperature monitoring during harvest became an important parameter to measure early on to prevent outbreaks [20].
We confirmed the significant associations of V. vulnificus and total V. parahaemolyticus with temperature, as reported in previous studies, and the absence of a relationship between temperature and pathogenic tdh+ V. parahaemolyticus [5]. An inverse correlation between salinity and V. parahaemolyticus levels in oysters was observed by Johnson et al. [57] and Jones et al. [63] but they reported a non-significant relationship with V. vulnificus. In both these studies, the oysters were collected over a sufficiently wide range of salinities (i.e., 3 to 35‰). Similar trends were observed in the present study where samples correspond to a wide range of salinities (8.2 to 36‰) occurring across the bay. However, negative associations were greater in V. vulnificus (r = −0.53) compared to V. parahaemolyticus (r = −0.26). This contrasts with previous publications but agrees with the negative correlations between salinity and V. vulnificus observed by Randa et al. [64] in the North Atlantic (Barnegat Bay, NJ, USA). These inconsistencies suggest the temporal and spatial complexity of the environmental drivers of Vibrio spp. which have yet to be fully understood.

4.3. Vibrio spp. and P. marinus

P. marinus infection has been shown to result in poor oyster body condition and survival [28,31]. In addition, P. marinus is a disease that is positively correlated with increasing salinities [65] while V. vulnificus and V. parahaemolyticus will be reduced. To determine if oyster immune systems were compromised by the concurrent presence of these Vibrio spp., an analysis was performed to determine if there is a correlation with P. marinus disease. There was a significant correlation between V. vulnificus (r ≤ 0.42) (Figure 7A) and V. parahaemolyticus (r ≤ −0.31) (Figure 7B) but no correlation for tdh+ V. parahaemolyticus (r ≤ 0.21) (Figure 7C). The co-occurrence of high abundance of V. vulnificus and P. marinus was previously observed by Tall et al. [32] in the North Atlantic (ME, USA) and attributed to the production of serine protease produced by P. marinus that suppresses the activity of oysters hemocytes to eliminate V. vulnificus. These observations did not occur for V. vulnificus, total V. parahaemolyticus, and tdh+ V. parahaemolyticus further south, in Chesapeake Bay (VA, USA) [34]. Although the missing association observed for tdh+ V. parahaemolyticus coincides with Bienlien et al. [34], we attributed our results to the lack of a significant seasonal component of tdh+ V. parahaemolyticus when using long-term data (Figure S1C) and due to its low abundance in some of the years that overlapped with P. marinus (2001–2010, Figure S2).

4.4. Climate Change and Other Considerations

While it is known that ENSO-driven climate variability and local salinity patterns influence oyster survival [66], an additional consideration is the impact of climate on Vibrio spp. populations. ENSO, which happens every 30–36 months, causes an increase in seawater temperatures and precipitation in the Gulf of Mexico [67,68]. Temperature increases and corresponding precipitation-driven salinity decreases could play a role in V. vulnificus and V. parahaemolyticus proliferation, and, consequently, enhance the probability of cases and outbreaks by these bacteria. The hypothesis of Vibrio spp. outbreaks coinciding with ENSO phenomenon was examined in Raszl et al. [54] and others. In South America, there is some evidence for this being an important driver [54], but more work is needed, or specifically, more long-term (multi-decadal) data sets are needed. In Galveston Bay, we only found a positive correlation with total V. parahaemolyticus (r = 0.2), suggesting greater abundances of only this bacterium during El Niño events. This matched with the positive correlations between warmer temperatures and greater abundances of total V. parahaemolyticus (r = 0.51). Similarly, such trends were not observed for the Vibrio spp. indicating more work needs to be conducted to understand patterns observed in Galveston Bay and elsewhere.
Much of the historical literature has focused on single variables (i.e., temperature or salinity) when examining correlations between oysters and these bacteria [11], with some exceptions [6,27,31]. More recent efforts have focused on other factors such as dissolved oxygen, pH, chlorophyll, and/or sediment loads [28,33,58]. However, few studies have attempted multi-variate statistical analyses. In the current study, the limitation in examining long-term multi-factor variables is the limitation of the data collected and/or retained in some studies, that is, variables aside from water temperature and salinity are simply not available. Nonetheless, the applied time series analyses used in the current study did reveal time-lags and relationships between these pathogenic bacteria and the parasite P. marinus not previously reported. Hence, more studies are needed to determine if these observations are unique to Galveston Bay or represent more general patterns.
The lack of recent (2018 to present) monitoring programs by state agencies to collect oyster and Vibrio data does not allow this meta-analysis to examine the impact of accelerated climate change, increased pollution and extreme weather events on these estuarine communities and thus create a timely connection to current public health risk assessments. Ongoing monitoring programs are needed, especially as vibriosis and other diseases in oysters continue to rise in the United States and elsewhere [7,69]. Recently, Okon et al. [70] performed a global analysis of climate change and impacts on oyster diseases. They found that rising temperatures, driven by climate change, have created favorable conditions for bacteria and viruses, and concurrently, this has adversely affected oysters. In addition, pollution and extreme events are potentially more lethal when oyster health is already diminished because of pathogen loads [31,70]. To determine if oyster microbiomes (and viromes) could be used as suitable sentinels of pathogens and environmental water quality, Walker et al. [71] showed that the bacterial and virus communities of oysters were unique and largely made up of core constituents not abundant in the surrounding water or sediment. Hence, examinations of microbiomes in the water column of estuaries where oysters are located alone cannot accurately predict the community present within the oyster tissue. It is truly the oyster tissues which have the greatest value in acting as bioindicators of past and present estuarine health [68,72]. This information is critical as aquaculture and restoration projects choose areas and approaches aimed at increasing oyster populations [66,70,73].

Supplementary Materials

The following supporting information can be downloaded at: https://www.mdpi.com/article/10.3390/bacteria4020017/s1, Figure S1: Autocorrelation coefficients (ACF) for Vibrio spp. and P. marinus to detect seasonal and cyclical components. (a) V. vulnificus, (b) total V. parahaemolyticus, (c) pathogenic tdh+ V. parahaemolyticus, and (d) P. marinus. ACFs were estimated to produce time lags up to 40% of the length of the time series (2000–2017, except V. vulnificus that starts at 2001) as suggested by Zuur et al. (2007). Blue lines indicate the 95% confidence interval, any bar outside the interval suggests a significant correlation of a time series with itself after applying a shift (lag) of k years; Figure S2: Spatial distribution of (a) V. vulnificus, (b) total V. parahaemolyticus, and (c) pathogenic tdh+ V. parahaemolyticus abundance. Circles and color scales represent annual averages per station from 2000 to 2018. Units are MPN g−1 for V. vulnifus and total V. parahaemolyticus, and cfu g−1 transformed to log (x + 1) for pathogenic tdh+ V. parahaemolyticus. Gray dashed line indicates the Houston Ship Channel; Figure S3: Cross-correlation coefficients (CCF) between environmental variables and Vibrio spp. Panels represent CCF between temperature, salinity and the Oceanic Niño Index with V. vulnificus (A,D,G), total V. parahaemolyticus (B,E,H) and pathogenic tdh+ V. parahaemolyticus (C,F,I). Y-axes represent CCF for each pair of variables and X-axes the time lags. We used negative lag values to interpret if environmental variables infer the abundance of Vibrio spp. Blue lines indicate the 95% confidence interval, any bar outside the interval suggests a significant correlation of the environmental time series and Vibrio spp. after applying a shift (lag) of k years.

Author Contributions

Conceptualization, A.Q. and A.G.-H.; methodology, M.S.H., S.M.R. and J.R.S.; formal analysis, A.Q. and A.G.-H.; resources, S.M.R. and J.R.S.; data curation, M.S.H.; writing—original draft preparation, A.Q.; writing—review and editing, All authors; visualization, A.G.-H.; funding acquisition, S.M.R. and J.R.S. All authors have read and agreed to the published version of the manuscript.

Funding

This research was funded over an almost 20-year period by a variety of agencies and individuals. The majority of funds were provided by Texas Department of State Health Services. HB 1903. Study and Analysis of Texas Oysters, the State of Texas Advanced Technology Program, the U.S. FDA, ISSC and Texas Dept. of Health-Shellfish Safety Division to J.R.S.

Institutional Review Board Statement

Not applicable.

Informed Consent Statement

Not applicable.

Data Availability Statement

The Vibrio spp. and associated environmental data has been deposited in the Texas Data Repository (https://doi.org/10.18738/T8/JX3C0W, accessed on 2 August 2024). The P. marinus and associated environmental data can be found on the oyster sentinel website (www.oystersentinel.cs.uno.edu; accessed on 2 August 2024).

Acknowledgments

We thank the numerous members of the Seafood Safety Laboratory that have assisted in these analyses since 1999, especially Stephen Burkett, Meilan Lin, Richard Bielby, Katherine Perschau Wong, Tara Hans Saxton, Catalina Schultze-Kraft, Claudia Knofla Schinnie and Jessica Hillhouse. A.Q. and J.R.S. are particularly indebted to Sammy M. Ray (1919–2013) for his mentoring and friendship over many years. This manuscript was developed as a result of his shared wisdom that data collections such as those presented in this paper should be made publicly available and not buried amongst the paper archives and dusty desks of scientists.

Conflicts of Interest

The authors declare no conflicts of interest. The funders had no role in the design of the study; in the collection, analyses, or interpretation of data; in the writing of the manuscript; or in the decision to publish the results.

References

  1. Ceccarelli, D.; Hasan, N.A.; Hug, A.; Colwell, R.R. Distribution; and dynamics of epidemic; and pandemic Vibrio parahaemolyticus virulence factors. Front. Cell. Infect. Microbiol. 2013, 3, 97. [Google Scholar] [CrossRef]
  2. Iwamoto, M.; Ayers, T.; Mahon, B.E.; Swerdlow, D.L. Epidemiology of seafood-associated infections in the United States. Clin. Microbiol. Rev. 2010, 23, 399–411. [Google Scholar] [CrossRef] [PubMed]
  3. Velusamy, V.; Arshakm, K.; Korostynska, O.; Oliwa, K.; Adley, C. An Overview of food borne pathogen detection: In the perspective of biosensors. Biotechnol. Adv. 2010, 28, 232–254. [Google Scholar] [CrossRef]
  4. Letchumanan, V.; Chan, K.-G.; Lee, L.-H. Vibrio parahaemolyticus: A review on the pathogenesis; prevalence; and advance molecular identification techniques. Front. Microbiol. 2014, 5, 705. [Google Scholar] [CrossRef]
  5. Jones, J.L.; Lüdeke, C.H.M.; Bowers, J.C.; DeRosia-Banick, K.; Carey, D.H.; Hastbacke, W. Abundance of Vibrio cholerae, V. vulnificus, and V. parahaemolyticus in Oysters Crassostrea virginica and Clams Mercenaria mercenaria from Long Island Sound. Appl. Environ. Microbiol. 2014, 80, 7667–7672. [Google Scholar]
  6. Shapiro, R.; Altekruse, S.; Hutwagner, L.; Bishop, R.; Hammond, R.; Wilson, S.; Ray, B.; Thompson, S.; Tauxe, V.; Griffin, P. The role of Gulf Coast oysters harvested in warmer months in Vibrio vulnificus infections in the United States. J. Infect. Dis. 1998, 178, 752–759. [Google Scholar] [CrossRef]
  7. Archer, E.J.; Baker-Austin, C.; Osborn, T.J.; Jones, N.R.; Martínez-Urtaza, J.; Trinanes, J.; Oliver, J.D.; González, F.J.C.; Lake, I.R. Climate warming and increasing Vibrio vulnificus infections in North America. Sci. Rep. 2023, 13, 3893. [Google Scholar] [CrossRef]
  8. Daniels, N.A. Vibrio vulnificus oysters: Pearls and perils. Clin. Infect. Dis. 2011, 52, 788–792. [Google Scholar] [CrossRef]
  9. Strom, M.; Paranjpye, R.N.; Nilsson, W.B.; Turner, J.W.; Yanagida, G.K. Pathogen update: Vibrio species. In Woodhead Publishing Series in Food Science, Technology and Nutrition; Advances in Microbial Food Safety; Sofos, J., Ed.; Woodhead Publishing: Cambridge, UK, 2013; pp. 97–113. [Google Scholar] [CrossRef]
  10. Warner, E.B.; Oliver, J.D. Population structures of two genotypes of Vibrio vulnificus in oysters Crassostrea virginica and seawater. Appl. Environ. Microbiol. 2007, 741, 80–85. [Google Scholar]
  11. Froelich, B.; Oliver, J. The interactions of Vibrio vulnificus and the oyster Crassostrea virginica. Microb. Ecol. 2013, 65, 807–816. [Google Scholar] [CrossRef]
  12. Food and Drug Administration (FDA). Bad Bug Book: Foodborne Pathogenic Microorganisms and Natural Toxins, 2nd ed.; Food and Drug Administration: Washington, DC, USA, 2012; pp. 46–49. [Google Scholar]
  13. Velazquez-Roman, J.; Leon-Sicairos, N.; Flores-Villasenor, H.; Villafana-Rauda, S.; Canizalez-Roman, A. Association of pandemic Vibrio parahaemolyticus O3: K6 present in the coastal environment of Northwest Mexico with cases of recurrent diarrhea between 2004 and 2010. Appl. Environ. Microbiol. 2012, 78, 1794–1803. [Google Scholar] [CrossRef] [PubMed]
  14. Qadri, F.; Chowdhury, N.R.; Takeda, Y.; Nair, G.B. Vibrio parahaemolyticus—Seafood Safety and Associations with Higher Organisms; Belkin, S., Colwell, R.R., Eds.; Oceans and Health: Pathogens in the Marine Environment; Springer: New York, NY, USA, 2005. [Google Scholar]
  15. Morris, J.; Black, R. Cholera & other vibrioses in the United States. N. Engl. J. Med. 1985, 312, 343–350. [Google Scholar] [PubMed]
  16. Daniels, N.A.; MacKinnon, L.; Bishop, R.; Altekruse, S.; Ray, B.; Hammond, R.M.; Thompson, S.; Wilson, S.; Bean, N.H.; Griffin, P.M.; et al. Vibrio parahaemolyticus infections in the United States, 1973–1998. J. Infect. Dis. 2000, 181, 1661–1666. [Google Scholar] [CrossRef] [PubMed]
  17. Okuda, J.; Ishibashi, M.; Hayakawa, E.; Nishino, T.; Takeda, Y.; Mukhopadhyay, A.K.; Garg, S.; Bhattacharya, S.K.; Nair, G.B.; Nishibuchi, M. Emergence of a unique O3:K6 clone of Vibrio parahaemolyticus in Calcutta, India, and isolation of strains from the same clonal group from Southeast Asian travelers arriving in Japan. J. Clin. Microbiol. 1997, 35, 3150–3155. [Google Scholar] [CrossRef]
  18. Matsumoto, C.; Okuda, J.; Ishibashi, M.; Iwanaga, M.; Garg, P.; Ramamurthy, T.; Wong, H.C.; DePaola, A.; Kim, Y.B.; Albert, M.J.; et al. Pandemic spread of an O3:K6 clone of Vibrio parahaemolyticus and emergence of related strains evidenced by Arbitrarily Primed PCR & toxRS sequence analysis. J. Clin. Microbiol. 2000, 38, 578–585. [Google Scholar]
  19. Molenda, J.R.; Johnson, W.G.; Fishbein, M.; Wentz, B.; Mehlman, I.J.; Dadisman, T.A., Jr. Vibrio parahaemolyticus gastroenteritis in Maryland: Laboratory aspects. Appl. Microbiol. 1972, 24, 444–448. [Google Scholar] [CrossRef]
  20. Centers for Disease Control and Prevention (CDC). Outbreak of Vibrio parahaemolyticus infections associated with eating raw oysters, Pacific Northwest, 1997. Morb. Mortal. Wkly. Rep. 1998, 47, 457–462. [Google Scholar]
  21. Centers for Disease Control and Prevention (CDC). Outbreak of Vibrio parahaemolyticus infection associated with eating raw oysters or clams harvested from Long Island Sound, Connecticut, New Jersey, and New York, 1998. Morb. Mortal. Wkly. Rep. 1999, 48, 48–51. [Google Scholar]
  22. DePaola, A.; Jones, J.L.; Woods, J.; Burkhardt, W.; Calci, K.R., III; Krantz, J.A.; Bowers, J.C.; Kasturi, K.; Byars, R.H.; Jacobs, E.; et al. Bacterial and viral pathogens in live oysters: 2007 United States market survey. Appl. Environ. Microbiol. 2010, 76, 2754–2768. [Google Scholar] [CrossRef]
  23. Kaneko, T.; Colwell, R.R. Ecology of Vibrio parahaemolyticus in Chesapeake Bay. J. Bacteriol. 1973, 113, 24–32. [Google Scholar] [CrossRef]
  24. Sarkar, B.L.; Nair, G.B.; Banerjee, A.K.; Pal, S.C. Seasonal distribution of Vibrio parahaemolyticus in freshwater environs and in association with freshwater fishes in Calcutta. Appl. Environ. Microbiol. 1985, 49, 132–136. [Google Scholar] [PubMed]
  25. Davis, J.W.; Sizemore, R.K. Incidence of Vibrio species associated with blue crabs Callinectes sapidus collected from Galveston Bay, Texas. Appl. Environ. Microbiol. 1982, 43, 1092–1097. [Google Scholar] [PubMed]
  26. White, M.E.; Powell, E.N.; Wilson, E.A.; Ray, S.M. The Spatial Distribution of Perkinsus Marinus, a Protozoan Parasite, in Relation to its Oyster Host Crassostrea Virginica and an Ectoparasitic Gastropod Boonea Impressa. J. Mar. Biol. Assoc. UK 1989, 693, 703–717. [Google Scholar] [CrossRef]
  27. Powell, E.N.; Klinck, J.M.; Guo, X.; Hofmann, E.E.; Ford, S.E.; Bushek, D. Can oysters Crassostrea virginica develop resistance to dermo disease in the field: The impediment posed by climate cycles. J. Mar. Res. 2012, 702–703, 309–355. [Google Scholar]
  28. Ray, S.M. A culture technique for diagnosis of infections with Dermocystidium marinum Mackin, Owen, and Collier in oysters. Science 1952, 116, 306–361. [Google Scholar]
  29. Craig, A.; Powell, E.N.; Fay, R.R.; Brooks, J.M. Distribution of Perkinsus marinus in gulf coast oyster populations. Estuaries 1989, 12, 82–91. [Google Scholar] [CrossRef]
  30. Silvy, E.; Gelwick, F.; Silvy, N. Factors affecting Dermo disease Perkinsus marinus in eastern oysters Crassostrea virginica in Galveston Bay, Texas. J. Environ. Sci. Eng. 2020, A9, 227–245. [Google Scholar] [CrossRef]
  31. Gaona-Hernández, A.; Jurgens, L.J.; Pollack, J.B.; Du, J.; Jensen, C.C.; Quigg, A. Impact of Perkinsus marinus on oyster health: A survey after a regional data gap. J. Shellfish Res. 2025; In review. [Google Scholar]
  32. Tall, B.D.; La Peyre, J.F.; Bier, J.W.; Miliotis, M.D.; Hanes, D.E.; Kothary, M.H.; Shah, D.B.; Faisal, M. Perkinsus marinus extracellular protease modulates survival of Vibrio vulnificus in Eastern oyster Crassostrea virginica hemocytes. Appl. Environ. Microbiol. 1999, 659, 4261–4263. [Google Scholar] [CrossRef]
  33. Walther, B.D.; Bachand, P.T.; Hinson, A.; O’Donnell, C.A.; Turner, J.W. Investigating reconstructed inflows and pathogen infection patterns between low-relief and high-relief subtropical oyster reefs. Exp. Results 2020, 1, e23. [Google Scholar] [CrossRef]
  34. Bienlien, L.M.; Audemard, C.; Reece, K.S.; Carnegie, R.B. Impact of parasitism on levels of human-pathogenic Vibrio species in eastern oysters. J. Appl. Microbiol. 2022, 1322, 760–771. [Google Scholar]
  35. Stanley, J.G.; Sessers, M.A. Species profiles: Life histories of environmental requirements of coastal fishes and invertebrates Gulf of Mexico—American oyster. U.S. Fish. Wildl. Serv. Biol. Rep. 1986, 11, 25. [Google Scholar]
  36. Eastern Oyster Biological Review Team (EOBRT). Status Review of the Eastern Oyster Crassostrea virginica; Report to the National Marine Fisheries Service; Northeast Regional Office: Gloucester, UK, 2007. [Google Scholar]
  37. Vanoy, R.W.; Tamplin, M.L.; Schwarz, J.R. Ecology of Vibrio vulnificus in Galveston Bay oysters, suspended particulate matter; sediment and seawater: Detection by monoclonal anti body immunoassay-most probable number procedures. J. Ind. Microbiol. Biot. 1992, 93, 219–223. [Google Scholar] [CrossRef]
  38. Montagna, P.A.; Douglas, A.R. Freshwater Inflows to Texas Bays and Estuaries. A Regional-Scale Review, Synthesis, and Recommendations; Springer Nature: Cham, Switzerland, 2025; 411p, Available online: https://library.oapen.org/handle/20.500.12657/96985 (accessed on 5 January 2025).
  39. Kaysner, C.A.; DePaola, A.; Jones, J.; Vibrio. Bacteriological Analytical Manual Online. 2004. Available online: https://www.fda.gov/food/laboratory-methods-food/bam-chapter-9-vibrio (accessed on 28 June 2024).
  40. Tamplin, M.L.; Martin, A.L.; Ruple, A.D.; Cook, D.W.; Kaspar, C.W. Enzyme immunoassay for identification of Vibrio vulnificus in seawater, sediment, and oysters. Appl. Environ. Microbiol. 1991, 574, 1235–1240. [Google Scholar]
  41. Wright, A.C.; Miceli, G.A.; Landry, W.L.; Christy, J.B.; Watkins, W.D.; Morris, J.G., Jr. Rapid identification of Vibrio vulnificus on nonselective media with an alkaline phosphatase-labeled oligonucleotide probe. Appl. Environ. Microbiol. 1993, 592, 541–546. [Google Scholar]
  42. McCarthy, S.A.; DePaola, A.; Cook, D.W.; Kaysner, C.A.; Hill, W.E. Evaluation of alkaline phosphatase-and digoxigenin-labelled probes for detection of the thermolabile hemolysin tlh gene of Vibrio parahaemolyticus. Lett. Appl. Microbiol. 1999, 281, 66–70. [Google Scholar]
  43. McCarthy, S.A.; DePaola, A.; Kaysner, C.A.; Hill, W.E.; Cook, D.W. Evaluation of nonisotopic DNA hybridization methods for detection of the tdh gene of Vibrio parahaemolyticus. J. Food Prot. 2000, 6312, 1660–1664. [Google Scholar]
  44. Mackin, J.G. Oyster diseases caused by Dermocystidium marinum and other microorganisms in Louisiana. Publ. Inst. Mar. Sci. Univ. Tex. 1962, 7, 132–229. [Google Scholar]
  45. Benavides, I.F.; Santacruz, M.; Romero-Leiton, J.P.; Barreto, C.; Selvaraj, J.J. Assessing methods for multiple imputation of systematic missing data in marine fisheries time series with a new validation algorithm. Aquac. Fish. 2023, 8, 587–599. [Google Scholar]
  46. R Core Team. R: A Language and Environment for Statistical Computing. R Foundation 776 for Statistical Computing; R Core Team: Vienna, Austria, 2021. [Google Scholar]
  47. Posit Team. RStudio: Integrated Development Environment for R. Posit Software; PBC, 756; Posit Team: Boston, MA, USA, 2023; Available online: http://www.posit.co/ (accessed on 30 May 2024).
  48. Trapletti, A.; Hornik, K. tseries: Time Series Analysis and Computational Finance. R Package Version 0.10-58. 2024. Available online: https://CRAN.R-project.org/package=tseries (accessed on 30 May 2024).
  49. Zeileis, A.; Grothendieck, G. zoo: S3 Infrastructure for Regular and Irregular Time Series. J. Stat. Softw. 2005, 14, 1–27. [Google Scholar] [CrossRef]
  50. Wickham, H. ggplot2: Elegant Graphics for Data Analysis; Springer: New York, NY, USA, 2016. [Google Scholar]
  51. Pebesma, E.; Bivand, R. Classes and methods for spatial data in R. R News 2005, 5, 9–13. Available online: https://CRAN.R-project.org/doc/Rnews/ (accessed on 30 May 2024).
  52. Encomio, V.G.; Stickler, S.M.; Allen, S.K.; Chu, F.L. Performance of “natural dermo-resistant” oyster stocks—Survival, disease, growth, condition and energy reserves. J. Shellfish Res. 2005, 241, 143–155. [Google Scholar]
  53. Kassambara, A. ggpubr: ‘ggplot2’ Based Publication Ready Plots. R Package Version 0.6.0. 2023. Available online: https://CRAN.R-project.org/package=ggpubr (accessed on 28 June 2024).
  54. Raszl, S.M.; Froelich, B.A.; Vieira1, C.R.W.; Blackwood, A.D.; Noble, R.T. Vibrio parahaemolyticus and Vibrio vulnificus in South America: Water, seafood and human infections. J. Appl. Microbiol. 2016, 121, 1201–1222. [Google Scholar] [CrossRef]
  55. Oliver, J.D.; Warner, R.A.; Cleland, D.R. Distribution of Vibrio vulnificus and other lactose-fermenting vibrios in the marine environment. Appl. Environ. Microbiol. 1983, 453, 985–998. [Google Scholar]
  56. Lin, M.; Payne, D.A.; Schwarz, J.R. Intraspecific diversity of Vibrio vulnificus in Galveston Bay water and oysters as determined by randomly amplified polymorphic DNA PCR. Appl. Environ. Microbiol. 2003, 696, 3170–3175. [Google Scholar]
  57. Johnson, C.N.; Flowers, A.R.; Noriea, N.F., III; Zimmerman, A.M.; Bowers, J.C.; DePaola, A.; Grimes, D.J. Relationships between environmental factors and pathogenic vibrios in the Northern Gulf of Mexico. Appl. Environ. Microbiol. 2010, 76, 7076–7084. [Google Scholar] [CrossRef]
  58. Parvathi, A.; Kumar, H.S.; Karunasagar, I.; Karunasagar, I. Detection and enumeration of Vibrio vulnificus in oysters from two estuaries along the southwest coast of India, using molecular methods. Appl. Environ. Microbiol. 2004, 7011, 6909–6913. [Google Scholar] [CrossRef]
  59. Motes, M.L.; DePaola, A.; Cook, D.W.; Veazey, J.E.; Hunsucker, J.C.; Garthright, W.E.; Blodgett, R.J.; Chirtel, S.J. Influence of water temperature and salinity on Vibrio vulnificus in Northern Gulf and Atlantic coast oysters Crassostrea virginica. Appl. Environ. Microbiol. 1998, 644, 1459–1465. [Google Scholar]
  60. Odeyemi, O.A. Incidence and prevalence of Vibrio parahaemolyticus in seafood: A systematic review and meta-analysis. SpringerPlus 2016, 5, 464. [Google Scholar] [CrossRef]
  61. Yang, Y.; Xie, J.; Li, H.; Tan, S.; Chen, Y.; Yu, H. Prevalence; Antibiotic Susceptibility and Diversity of Vibrio parahaemolyticus Isolates in Seafood from South China. Front. Microbiol. 2017, 8, 2566. [Google Scholar] [CrossRef]
  62. Cabrera-Garcia, M.E.; Vazquez-Salinas, C.; Quinones-Ramirez, E.I. Serologic and molecular characterization of Vibrio parahaemolyticus strains isolated from seawater and fish products of the Gulf of Mexico. Appl. Environ. Microbiol. 2004, 70, 6401–6406. [Google Scholar] [CrossRef] [PubMed]
  63. Jones, J.L.; Hara-Kudo, Y.; Krantz, J.A.; Benner, R.A., Jr.; Smith, A.B.; Dambaugh, T.R.; Bowers, J.C.; DePaola, A. Comparison of molecular detection methods for Vibrio parahaemolyticus and Vibrio vulnificus. Food Microbiol. 2012, 30, 105–111. [Google Scholar] [CrossRef] [PubMed]
  64. Randa, M.A.; Polz, M.F.; Lim, E. Effects of temperature and salinity on Vibrio vulnificus population dynamics as assessed by quantitative PCR. Appl. Environ. Microbiol. 2004, 709, 5469–5476. [Google Scholar] [CrossRef]
  65. Hofmann, E.E.; Powell, E.N.; Klinck, J.M.; Saunders, G. Modelling diseased oyster populations I. Perkinsus marinus infections in oysters. J. Shellfish Res. 1995, 14, 121–151. [Google Scholar]
  66. Beseres Pollack, J.; Palmer, T.A.; Williams, A.E. Medium-term monitoring reveals effects of El Niño Southern Oscillation climate variability on local salinity and faunal dynamics on a restored oyster reef. PLoS ONE 2021, 16, e0255931. [Google Scholar] [CrossRef]
  67. Camelo, J.; Mayo, T.L.; Gutmann, E.D. Projected Climate Change Impacts on Hurricane Storm Surge Inundation in the Coastal United States. Front. Built Environ. 2020, 6, 588049. [Google Scholar] [CrossRef]
  68. Fasullo, J.T.; Otto-Bliesner, B.L.; Stevenson, S. ENSO’s changing influence on temperature; precipitation; and wildfire in a warming climate. Geophys. Res. Lett. 2018, 45, 9216–9225. [Google Scholar] [CrossRef]
  69. Neokye, E.O.; Wang, X.; Thakur, K.K.; Quijón, P.A.; Nawaz, R.A. Climate change impacts on oyster aquaculture—Part II: Impact assessment and adaptation measures. Environ. Res. 2024, 259, 119535. [Google Scholar] [CrossRef]
  70. Okon, E.M.; Birikorang, H.N.; Munir, M.B.; Kari, Z.A.; Téllez-Isaías, G.; Khalifa, N.E.; Abdelnour, S.A.; Eissa, M.E.H.; Al-Farga, A.; Dighiesh, H.S.; et al. A Global Analysis of Climate Change and the Impacts on Oyster Diseases. Sustainability 2023, 15, 12775. [Google Scholar] [CrossRef]
  71. Walker, J.R.; Bente, D.A.; Burch, M.T.; Cerqueira, F.M.; Ren, P.; Labonté, J.M. Molecular assessment of oyster microbiomes and viromes reveals their potential as pathogen and ecological sentinels. One Health 2025, 20, 100973. [Google Scholar] [CrossRef]
  72. Palmer, T.A.; Ueling, P.; Pollack, J.B. Using oyster tissue toxicity as an indicator of disturbed environments. Int. J. Environ. Sci. Technol. 2015, 12, 2111–2116. [Google Scholar]
  73. Quigg, A.; Windham, R.; Zhang, Z.; Fleur Swartz, R.; Anis, A.; Ray, S. Swan Lake: Pilot Study Site Utilizing Processed Industrial Wastewater to Manage Salinity in Lower Galveston Bay; Final Report of the Coastal Coordination Council Pursuant to National Oceanic and Atmospheric Administration Award No. NA08NOS4190458; Texas A&M University: College Station, TX, USA, 2010; p. 82. Available online: https://www.glo.texas.gov/coastal/coastal-projects/swan-lake-pilot-study-site-utilizing-processed-industrial-wastewater (accessed on 2 August 2024).
Figure 1. Map of Galveston Bay (Texas) showing the reef sites where the oysters were collected. These include Sammy’s Reef in West Bay and five reefs in the central part of the bay. The black line corresponds to the Houston Ship Channel (HSC), which transects the bay.
Bacteria 04 00017 g001
Figure 2. Decomposition of V. vulnificus time series (2001–2017) in Galveston Bay. Panels represent from top to bottom: original data (monthly averages), trend, seasonal effect, and random error. Blue and red squares support the interpretation of the trend which changed every 7–8 years.
Bacteria 04 00017 g002
Figure 3. Decomposition of total V. parahaemolyticus time series (2000–2017) in Galveston Bay. Panels represent from top to bottom: original data (monthly averages), trend, seasonal effect, and random error. Colored rectangles support the interpretation of the trend to indicate high abundance (red rectangles) and brief periods of decreases (blue rectangles).
Bacteria 04 00017 g003
Figure 4. Decomposition of pathogenic tdh+ V. parahaemolyticus time series (2000–2017) in Galveston Bay. Panels represent from top to bottom: original data (monthly averages), trend, seasonal effect, and random error. Colored rectangles support the interpretation of the trend to indicate high abundance (red), periods of decreases (blue) and constant changes in trend (dark gray).
Bacteria 04 00017 g004
Figure 5. Monthly spatial distribution of (A) V. vulnificus, (B) total V. parahaemolyticus, and (C) pathogenic tdh+ V. parahaemolyticus estimated from 2000 to 2018. Circles and color scale represent monthly abundances per station. Units are MPN g−1 for V. vulnifus and total V. parahaemolyticus, and cfu g−1 transformed to log (x + 1) for pathogenic tdh+ V. parahaemolyticus. Gray dashed line indicates the Houston Ship Channel.
Bacteria 04 00017 g005aBacteria 04 00017 g005b
Figure 6. Seasonal effect of (A) P. marinus (B) V. vulnificus, (C) total V. parahaemolyticus, and (D) pathogenic tdh+ V. parahaemolyticus. Symbol (*) indicates reference point of high P. marinus to support interpretation. Blue arrows indicate if and when high or low abundances of Vibrio spp. occurred before or after high P. marinus. On the x-axis, the 2 = February, through to 12 = December.
Bacteria 04 00017 g006
Figure 7. Cross-correlations between P. marinus and Vibrio spp. For the time series, we only used negative lag values to test if P. marinus infers V. vulnificus abundance. The blue lines indicate the 95% confidence intervals (any bars outside the interval suggest a significant correlation). Plots show cross-correlations with (A) V. vulnificus, for which significant correlations occurred at lags −1, −2, −4, −5, −6, and −7, (B) total V. parahaemolyticus, for which significant correlations at lags −4, −5, and −6, and (C) pathogenic tdh+ V. parahaemolyticus, for which significant correlations at lag −3.
Bacteria 04 00017 g007
Figure 8. Pearson correlation coefficients (r) between environmental variables and Vibrio spp. Panels indicate a correlation of temperature, salinity, and Oceanic Niño Index with V. vulnificus (A,D,G), total V. parahaemolyticus (B,E,H), and pathogenic tdh+ V. parahaemolyticus (C,F,I). The x-axes represent temperature (°F), salinity (ppt) and the Oceanic Niño Index (3-month mean SST anomaly for the Niño 3.4 region), whereas y-axes represent the abundance of Vibrio spp. in logarithmic scale x + 1. Solid color lines represent linear regression and color bands at the 95% confidence interval.
Bacteria 04 00017 g008
Disclaimer/Publisher’s Note: The statements, opinions and data contained in all publications are solely those of the individual author(s) and contributor(s) and not of MDPI and/or the editor(s). MDPI and/or the editor(s) disclaim responsibility for any injury to people or property resulting from any ideas, methods, instructions or products referred to in the content.

