Article

Hepatic Fatty Acid Profile and Gut Microbiota Changes in Response to Dietary Bile Acid Supplementation in Late-Laying Hens


1
Key Laboratory of Efficient Utilization of Non-Grain Feed Resources of the Ministry of Agriculture and Rural Affairs and Shandong Province, Key Laboratory of Animal Nutrition and High-Efficiency Feeding of Shandong Province, College of Animal Science and Technology, Shandong Agricultural University, Tai’an 271018, China
2
Shandong Provincial Center for Quality and Safety of Animal Products, Jinan 250010, China
*
Authors to whom correspondence should be addressed.
Poultry 2026, 5(4), 58; https://doi.org/10.3390/poultry5040058
Submission received: 2 July 2026 / Revised: 26 July 2026 / Accepted: 11 August 2026 / Published: 17 August 2026

Abstract

This research examined how dietary bile acids (BAs) influence hepatic fatty acid composition and cecal microbial community of late-laying hens. A total of 1080 Hy-Line Brown hens, aged 76 weeks, were randomly divided into four groups, each receiving a basal diet with 0 (CON), 200 (BA200), 300 (BA300), or 500 (BA500) mg/kg BAs for 35 days. Results showed that hepatic stearic acid (C18:0) concentrations were significantly reduced in all BAs-supplemented groups (p < 0.05). The BA300 group exhibited a significant increase in oleic acid (C18:1n9c), total monounsaturated fatty acids (MUFAs), and n-3 polyunsaturated fatty acids (PUFAs), alongside a decreased n-6/n-3 PUFA ratio (p < 0.05). Furthermore, the Chao1 index increased in all BAs-supplemented groups (p < 0.05), and the Simpson index was higher in BA300 (p < 0.05). LEfSe analysis indicated that the CON group had a higher abundance of opportunistic pathogens, while BA supplementation altered the cecal microbial composition. Notably, the BA300 group exhibited the most favorable microbial profile, characterized by enrichment of beneficial Enterococcus and improved microbial stability. In conclusion, supplementation with 300 mg/kg BAs most effectively improved hepatic fatty acid composition and cecal microbial diversity in late-laying hens, supporting its use as a nutritional strategy in the late laying phase.

1. Introduction

The egg industry represents a cornerstone of global sustainable food production, supplying essential nutrients vital for human health and nutrition [1,2]. With the increasing global population, eggs serve as an affordable and accessible source of high-quality protein sources and essential micronutrients [3]. However, a significant metabolic challenge arises during the late laying phase, when declining egg production leads to surplus energy intake exceeding the requirements for maintenance and egg synthesis, thereby promoting excessive lipid deposition in the liver. This metabolic imbalance leads to hepatic lipid accumulation, which precipitates a marked decline in laying performance and an increase in mortality, thereby constraining the economic sustainability of egg production [4,5,6]. Consequently, optimizing hepatic lipid metabolism in late-laying hens is a critical strategy for sustaining production efficiency.
Bile acids (BAs), synthesized from hepatic cholesterol, are essential hydroxysteroids involved in lipid metabolism [7]. During enterohepatic circulation, the molecular structure of BAs undergoes modifications through the action of hepatic enzymes and gut microbiota, thereby conferring the physicochemical properties that enable BAs to perform multiple physiological functions, including metabolic regulation, antimicrobial activity, and lipid solubilization during digestion [8]. Dietary supplementation with exogenous BAs has been shown to enhance growth performance, improve nutrient digestibility, and modulate hepatic lipid metabolism in broilers and laying hens [9,10,11]. BAs serve as signaling molecules influencing gut microbial community structure through their antimicrobial properties and activation of host receptors like farnesoid X receptor and Takeda G protein-coupled receptor 5, which regulate microbial BAs biotransformation [12,13]. The gut–liver axis represents a crucial mechanism by which dietary BAs can influence both liver metabolism and the balance of intestinal microbiota. Although prior studies have examined the impacts of BA supplementation on lipid metabolism and intestinal microbiota in poultry, most investigations have focused on broilers or hens during peak production, with limited data available specifically for the late laying phase [9,10,12,13]. A recent study by Fan et al. demonstrated that dietary bile acids supplementation decreased hepatic C20:0, C22:0, and C24:0 levels and reduced triglyceride accumulation, alongside downregulation of fatty acid synthase and stearoyl-CoA desaturase 1 mRNA expression in late-laying hens [14]. However, that study did not examine cecal microbiota responses, leaving the gut–liver axis dimension of BA supplementation unexplored. During this critical period, the concurrent decline in hepatic lipid clearance capacity and shifts in gut microbial composition may exacerbate metabolic dysfunction, yet the effects of exogenous BAs on hepatic fatty acid profiles and cecal microbiota in aged laying hens remain poorly understood. The present study addresses this gap by simultaneously evaluating hepatic fatty acid profiles and cecal microbiota composition in response to graded BAs doses, providing an integrated perspective on the gut–liver axis. Late-laying hens are particularly relevant for such investigation because aging is accompanied by declining hepatic metabolic capacity, hormonal changes, and progressive shifts in gut microbial composition, all of which may alter the response to exogenous BAs compared with younger birds.
This study evaluated the impact of dietary BAs supplementation at varying doses (200, 300, and 500 mg/kg) on hepatic total fatty acid composition and cecal microbial community structure in Hy-Line Brown laying hens aged 76 weeks. We hypothesized that dietary BAs supplementation would modulate hepatic fatty acid profiles and cecal microbiota composition in late-laying hens in a dose-dependent manner. The present study addresses this gap by simultaneously evaluating hepatic fatty acid profiles and cecal microbiota composition in response to graded BA doses, providing an integrated perspective on the gut–liver axis.

2. Materials and Methods

2.1. Animals and Treatments

The experiment took place at a commercial family farm in Kongjia Village, Ciyao Town, Ningyang County, Shandong Province, China. All animal experimental procedures and protocols were approved by the Animal Welfare and Use Committee of Shandong Agricultural University (SDAUA-2023-817). A total of 1080 Hy-Line Brown laying hens aged 76 weeks, maintaining consistent egg production and showing no clinical disease symptoms, were randomly allocated to four dietary treatment groups: a basal diet (CON) and the basal diet supplemented with 200 mg/kg (BA200), 300 mg/kg (BA300), or 500 mg/kg (BA500) of BAs. Each treatment comprised six replicates of 45 hens per replicate. The hens were housed in a three-tier cage system under a 16 h light/8 h dark photoperiod. The experiment consisted of a 7-day acclimation period followed by a 35-day experimental period. Animals were provided with ad libitum access to feed and water throughout the trial. The basal diet (Table 1) was designed based on the Chinese Chicken Feeding Standard (NY/T 33-2004) to fulfill or surpass the nutrient needs for laying hens [15]. The BAs product, sourced from porcine origin and supplied by Shandong Zhongjing Biotechnology Co., Ltd. (Tai’an, China), contained 21.53% active components. These included 3.05% chenodeoxycholic acid, 6.59% phocaecholic acid, 0.24% hyocholic acid, 0.49% hyodeoxycholic acid, and 11.16% cholic acid.

2.2. Sample Collection

On day 35 of the experiment, two healthy laying hens per replicate, with body weights near the replicate mean, were selected after a 12 h fast. After euthanasia, cecal contents were placed in labeled cryogenic tubes and snap-frozen in liquid nitrogen and stored for downstream 16S rRNA gene sequencing. Liver tissue samples were collected, rapidly frozen in liquid nitrogen, and stored at −80 °C for analysis of hepatic total fatty acid composition. For hepatic fatty acid analysis, one liver sample per replicate was used (n = 6 per treatment group), while seven cecal content samples per treatment group (n = 7, 28 samples in total) were collected for 16S rRNA gene sequencing.

2.3. Determination of Hepatic Fatty Acid Composition

Hepatic fatty acid composition was analyzed using a fatty acid methyl ester (FAME) method in accordance with AOAC/AOCS guidelines, utilizing gas chromatography–mass spectrometry (GC-MS). Liver samples stored at −80 °C were thawed at 4 °C prior to analysis. About 50 mg of liver tissue was precisely weighed, homogenized, and combined with 3 mL of n-hexane. The mixture was vortexed and incubated at 50 °C for 30 min. Then, 3 mL of 0.4 mol/L KOH–methanol solution was added for derivatization, and the reaction was continued at 50 °C for another 30 min. After cooling to room temperature, 1 mL of distilled water was added, followed by thorough vortexing. After phase separation, 90 μL of the upper organic phase was mixed with 10 μL of a methyl nonadecanoate internal standard solution (100 μg/mL) for GC-MS analysis.
A DB-FastFAME capillary column (Agilent G3903-63011, Agilent Technologies, Santa Clara, CA, USA) was used for gas chromatographic separation. The injector was set at 250 °C with a split ratio of 10:1 and an injection volume of 1 μL. A constant flow rate of helium was used as the carrier gas. The oven temperature was initially set to 50 °C for 0.5 min, then increased to 194 °C at a rate of 35 °C/min and maintained for 3.5 min, followed by a rise to 240 °C at 9 °C/min, held for 1.0 min. Fatty acid composition was determined and measured using chromatographic retention times and mass spectrometric fragmentation patterns. Individual fatty acids were quantified by peak area and expressed as a percentage of total fatty acids.

2.4. 16S rRNA Gene Sequencing and Analysis

Composition of the cecal microbiota was characterized by 16S rRNA gene sequencing, following the method described by Wu et al. [16]. Genomic DNA was isolated from cecal chyme samples using the CTAB extraction method. DNA concentration and purity were determined using a NanoDrop spectrophotometer (Thermo Fisher Scientific, Waltham, MA, USA), and DNA integrity was verified by 1% agarose gel electrophoresis (100 V, 40 min). DNA samples were diluted to 1 ng/μL using sterile nuclease-free water for PCR amplification. The V4 region of the bacterial 16S rRNA gene was amplified using barcoded primers 515F/806R and Phusion® High-Fidelity PCR Master Mix with GC Buffer (New England Biolabs, Ipswich, MA, USA). PCR products were analyzed via 2% agarose gel electrophoresis, purified with magnetic beads, quantified, and combined at equimolar concentrations. Target DNA fragments were extracted with a QIAquick Gel Extraction Kit (Qiagen, Hilden, Germany). Libraries were prepared with the TruSeq® DNA PCR-Free Sample Preparation Kit (Illumina, San Diego, CA, USA), and their quality was evaluated using Qubit fluorometric quantification and quantitative PCR (qPCR). Qualified libraries were sequenced on the NovaSeq 6000 platform (Illumina, San Diego, CA, USA). Raw sequencing reads were assigned to samples according to unique barcode sequences and processed using the QIIME2 platform (version QIIME2-202202). Paired-end reads were processed by merging with FLASH (v1.2.11), quality filtering with fastp (v0.23.1), and chimera screening using the UCHIME algorithm. The DADA2 denoising pipeline was employed to generate amplicon sequence variants (ASVs). Taxonomic annotation utilized the SILVA SSU rRNA database (release 138). Subsequent analyses, including alpha diversity, beta diversity, principal coordinate analysis (PCoA), and linear discriminant analysis effect size (LEfSe), were performed on the obtained ASVs. Sequencing depth was normalized by rarefaction to approximately 64,687 sequences per sample for alpha and beta diversity analyses.

2.5. Statistical Analysis

Data normality was evaluated using IBM SPSS Statistics 27, with variables showing a Shapiro–Wilk test p-value above 0.05 deemed to satisfy the normality assumption. Data were analyzed using SAS software (version 9.4, SAS Institute Inc., Cary, NC, USA). A one-way ANOVA using the GLM procedure was conducted, followed by Tukey’s test for multiple comparisons of treatment means. In addition, linear and quadratic regression analyses were conducted using the REG procedure to evaluate dose–response effects of increasing dietary BAs levels. The experimental unit was defined as the replicate. For hepatic fatty acid analysis, one sample per replicate was analyzed (n = 6 per group), whereas for 16S rRNA sequencing, seven individual cecal samples per treatment group (n = 7) were used. Statistical significance was determined at p < 0.05. Pairwise comparisons of beta diversity were conducted using the Mann–Whitney U test based on UniFrac distance matrices, with 95% confidence intervals calculated. Alpha diversity indices were assessed using one-way ANOVA followed by Tukey’s multiple comparison test.

3. Results

3.1. Effects of Dietary BAs Supplementation on Hepatic Saturated Fatty Acid Composition

Table 2 illustrates the impact of dietary BAs supplementation on saturated fatty acid composition. Compared with the CON group, dietary BAs supplementation significantly reduced the proportion of C18:0 (p < 0.05), with the lowest value observed in the BA300 group. Furthermore, C18:0 and C16:0 both exhibited linear and quadratic effects in response to increasing dietary BA levels (linear and quadratic, p < 0.05), while C14:0 demonstrated a quadratic increase (quadratic, p < 0.05).

3.2. Effects of Dietary BAs Supplementation on Hepatic Monounsaturated Fatty Acid Composition

Table 3 illustrates the impact of dietary BAs supplementation on monounsaturated fatty acid composition. The BA300 group exhibited a significant increase in the proportion of C18:1n9c and total monounsaturated fatty acid (MUFA) content compared to the CON group (p < 0.05). Furthermore, both C18:1n9c and total MUFA exhibited linear and quadratic increases as dietary BAs levels rose (linear and quadratic, p < 0.05).

3.3. Effects of Dietary BAs Supplementation on Hepatic Polyunsaturated Fatty Acid Composition

Table 4 illustrates the impact of dietary BAs supplementation on the composition of polyunsaturated fatty acids. The BA300 group exhibited a significant increase in total n-3 polyunsaturated fatty acids (PUFAs) compared to the CON group (p < 0.05). In addition, C18:3n3 and total n-3 PUFA exhibited quadratic responses with increasing dietary BAs levels (quadratic, p < 0.05). Within the n-6 PUFA group, C18:2n6c exhibited both linear and quadratic reductions as dietary BAs levels (linear and quadratic, p < 0.05), while C20:2n6 demonstrated a tendency for a quadratic response (quadratic, p < 0.05). The BA300 group exhibited a significantly lower n-6 PUFA to n-3 PUFA ratio compared to the CON group (p < 0.05), with a notable quadratic response as dietary BAs levels increased (quadratic, p < 0.05).

3.4. Effects of Dietary BAs Supplementation on Hepatic Unsaturated Fatty Acid Composition

Table 5 illustrates the impact of dietary BAs supplementation on the composition of unsaturated fatty acids (UFAs). There were no notable differences in total unsaturated fatty acid content or the PUFA/UFA ratio across the treatment groups (p > 0.05).

3.5. Effects of Dietary BAs Supplementation on Cecal Microbial Diversity

The species accumulation curve (Figure 1A) plateaued as sample size reached 28, suggesting sufficient sampling to capture most microbial species and accurately reflect community richness. Similarly, the rarefaction curves (Figure 1B) for all groups tended to level off at approximately 64,687 sequences, suggesting that the sequencing depth was sufficient and that the obtained data reliably represented microbial composition and diversity.
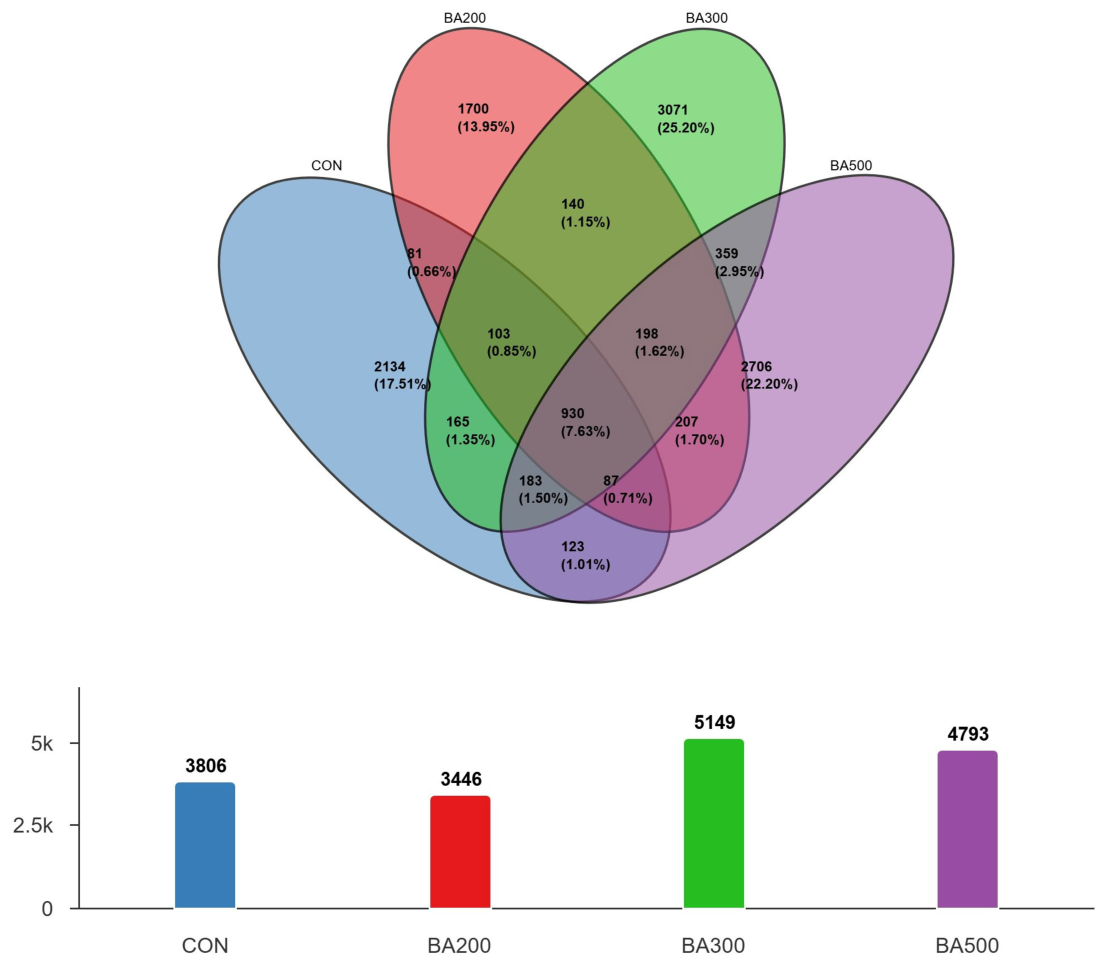
Effective sequences were processed into ASVs using the DADA2 pipeline. A total of 3806, 3446, 5149, and 4793 ASVs were identified in the CON, BA200, BA300, and BA500 groups, respectively. Among these, 2134, 1700, 3071, and 2706 ASVs were unique to each group, respectively, while 930 ASVs were shared among all groups (Figure 2).
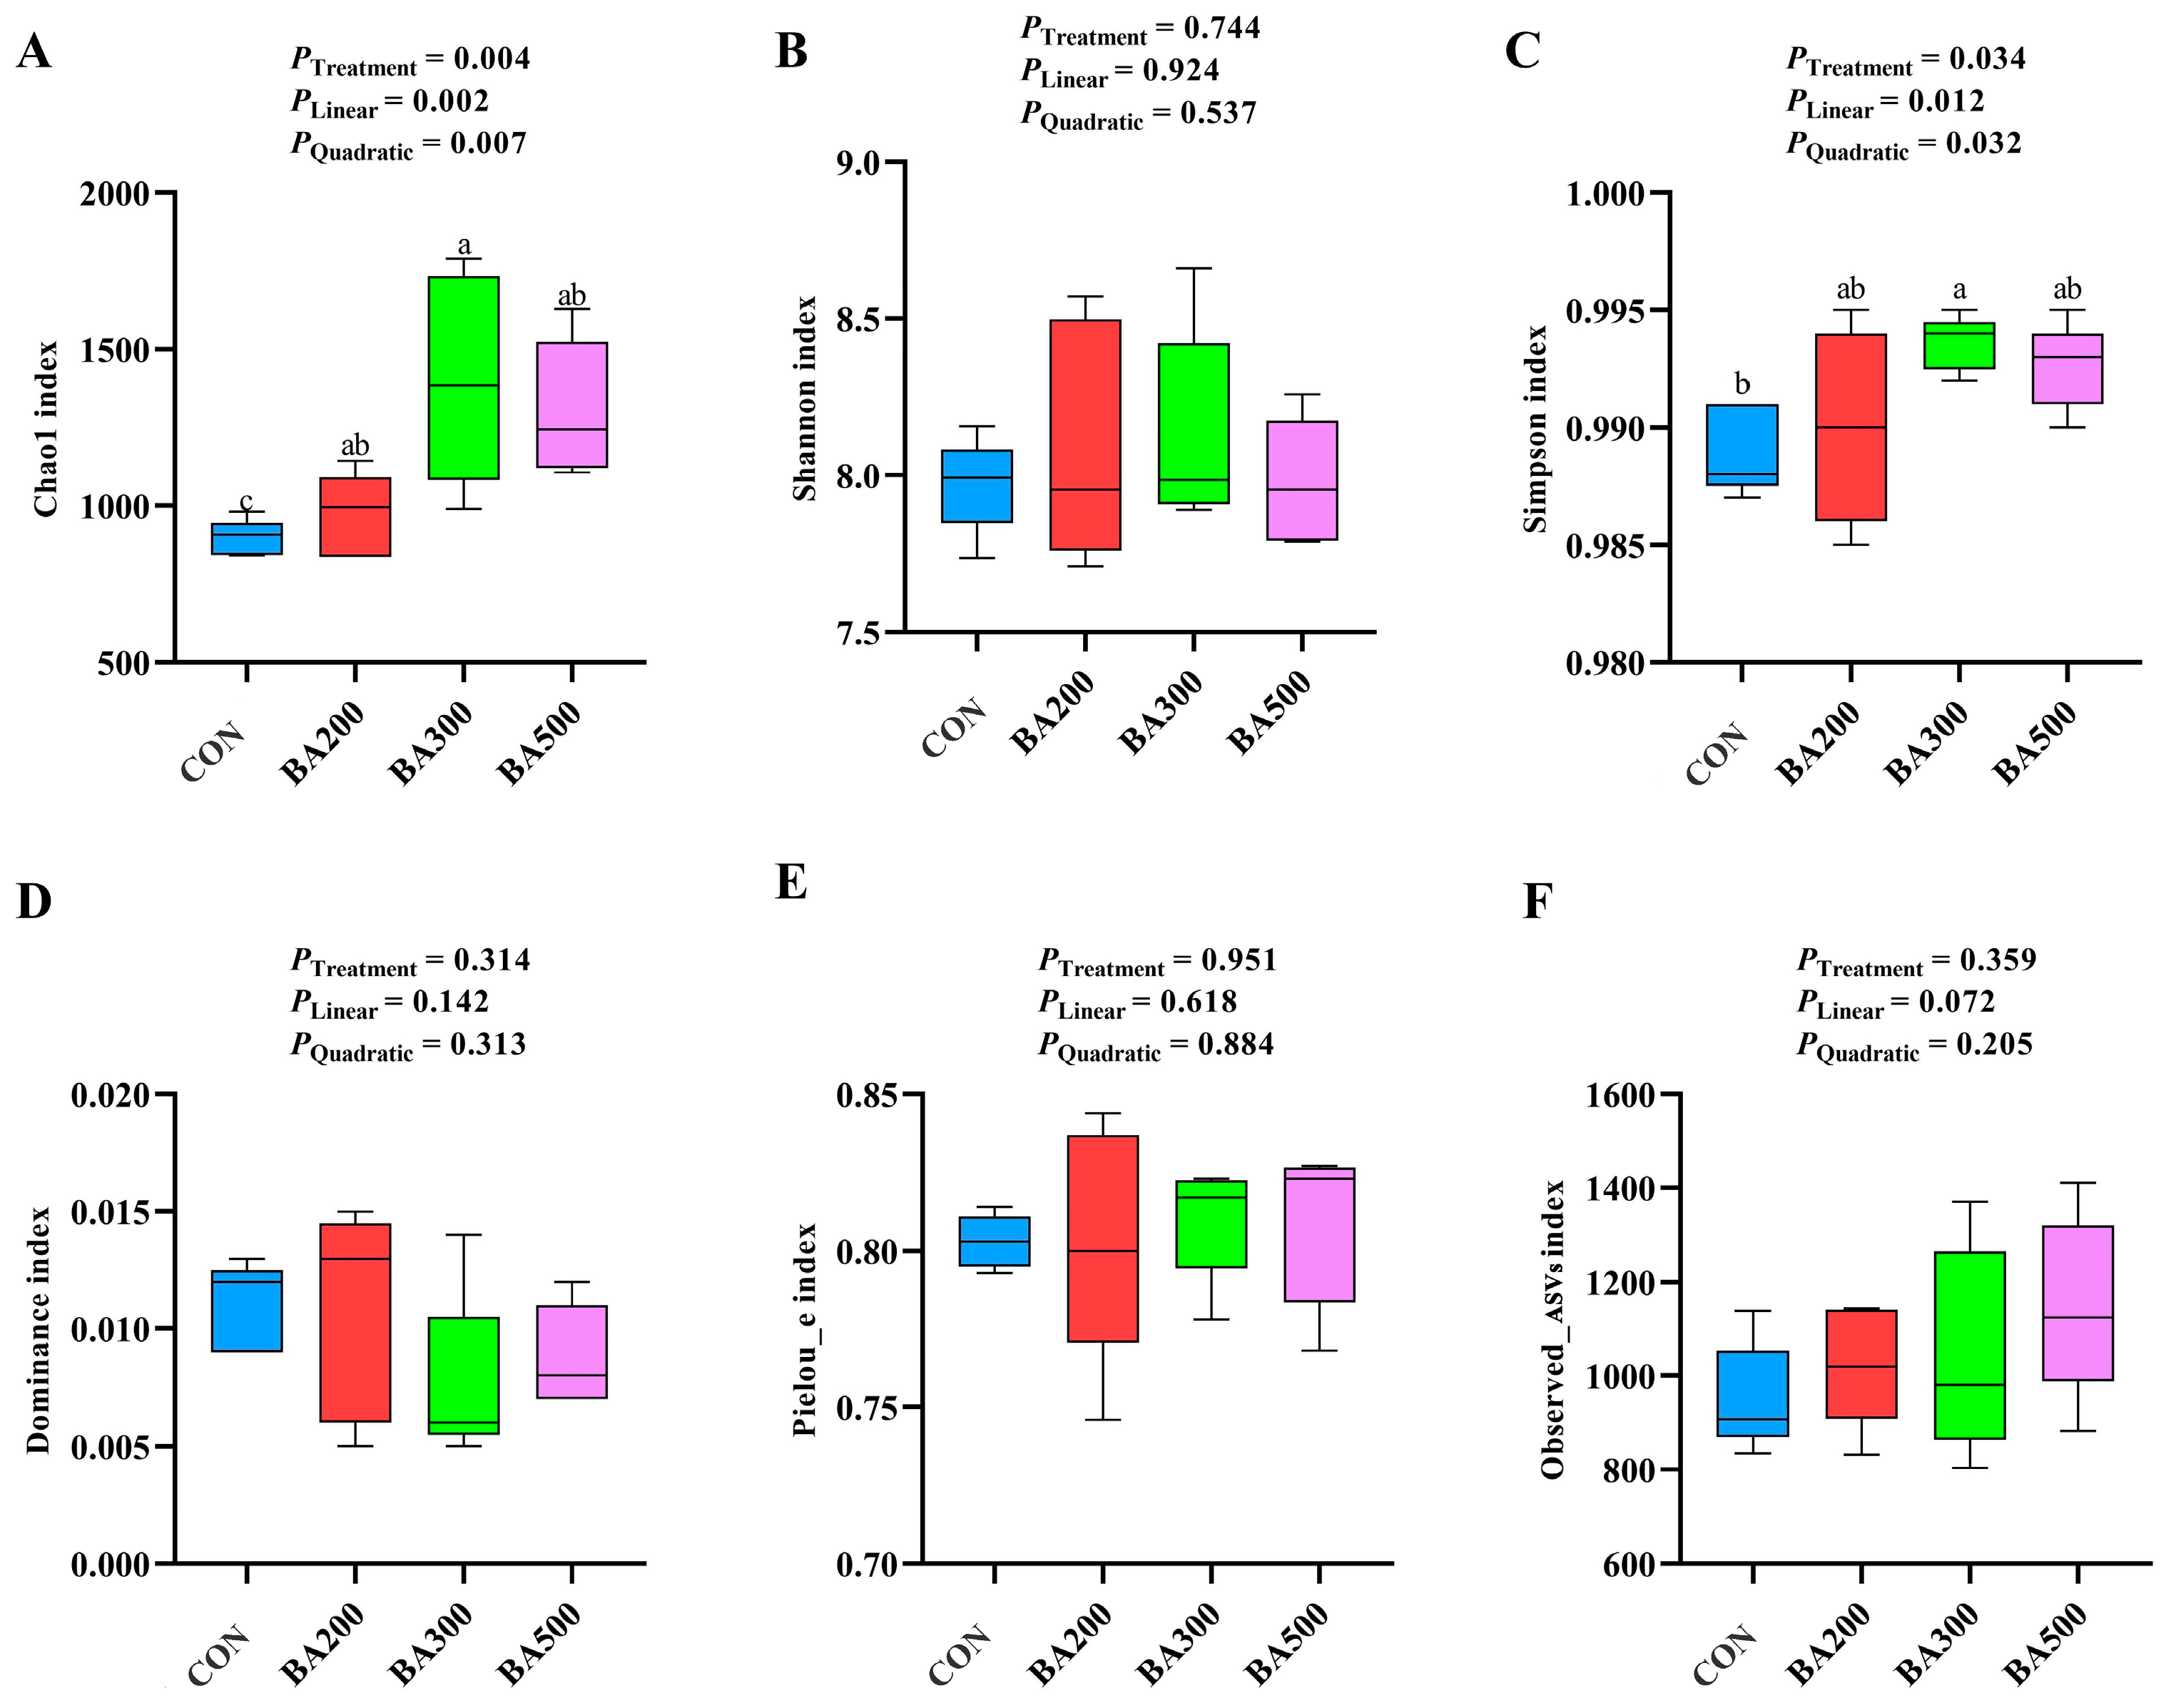
The richness and evenness of the cecal microbial community were evaluated using the Chao1 index (Figure 3A), Shannon index (Figure 3B), Simpson index (Figure 3C), Dominance index (Figure 3D), Pielou_e index (Figure 3E), and observed ASV richness index (Figure 3F). In all groups supplemented with BAs, the Chao1 index showed a significant increase compared to the CON group (p < 0.05), with both linear and quadratic trends observed as dietary BAs levels increased (linear and quadratic, p < 0.05). Among all groups, the BA300 group exhibited the highest Chao1 value. The Simpson index significantly increased in the BA300 group (p < 0.05), with notable linear and quadratic increases corresponding to rising dietary BAs levels (linear and quadratic, p < 0.05).
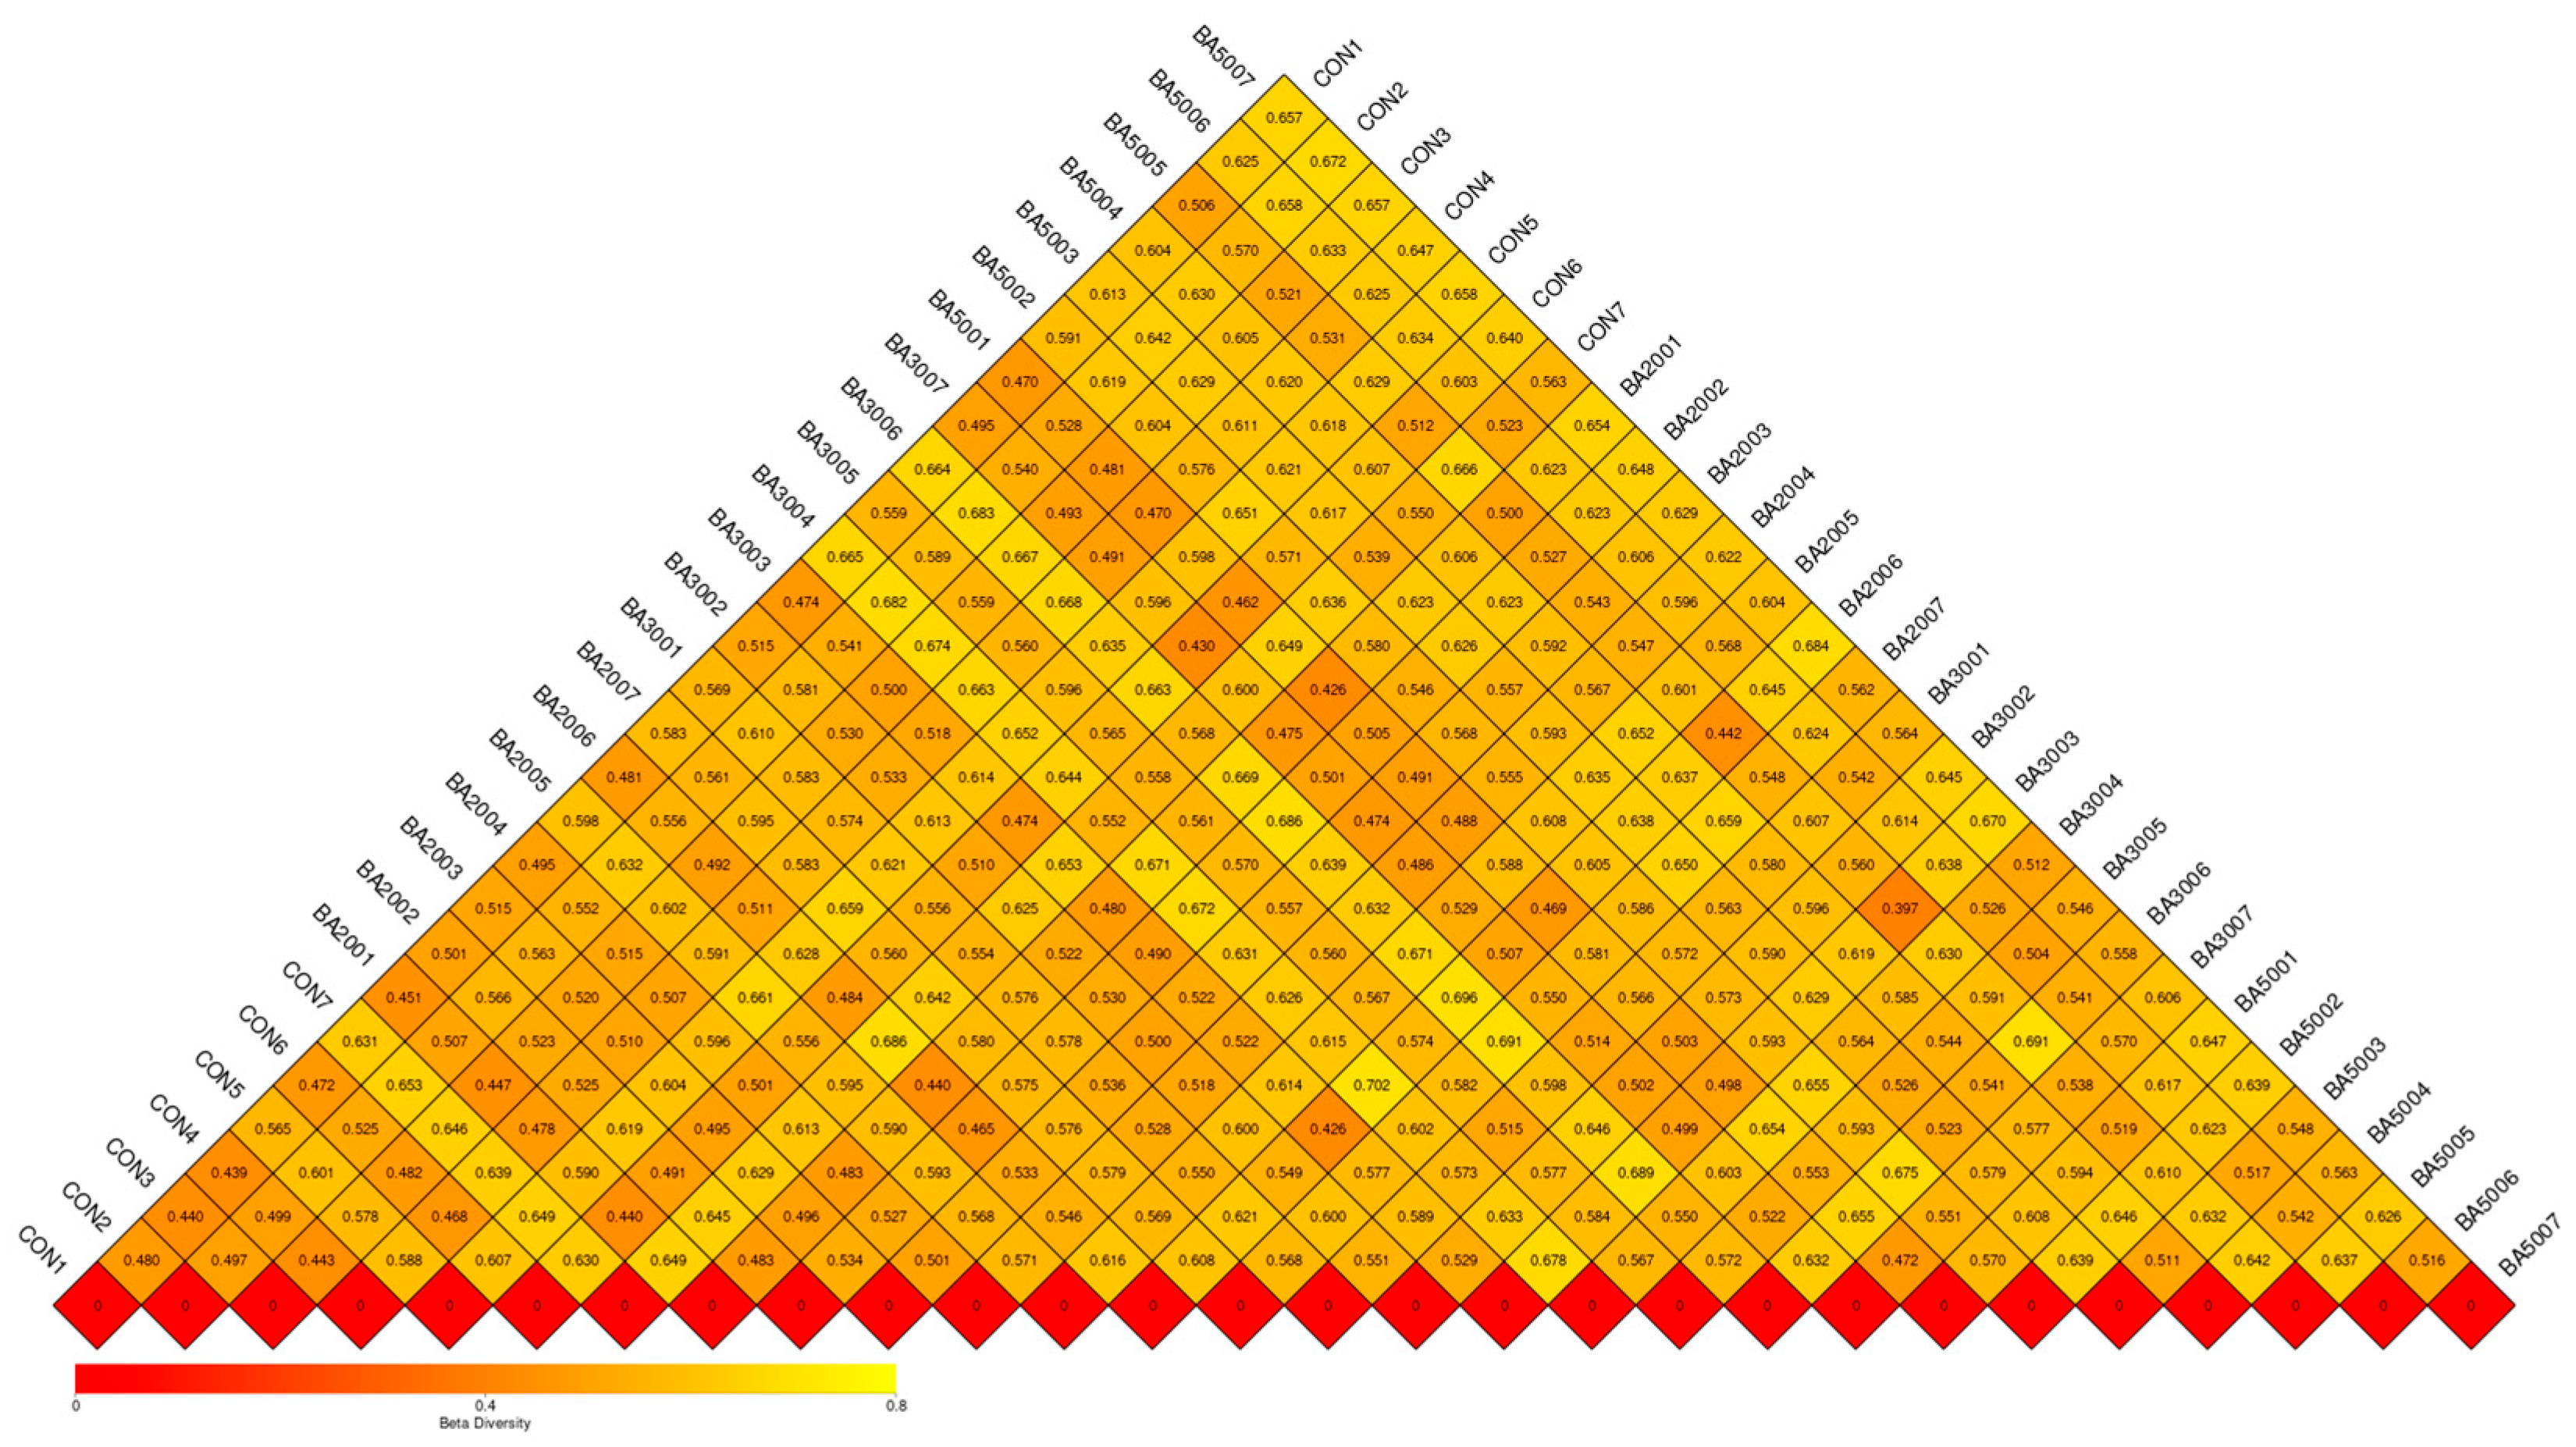
Beta-diversity analysis of the cecal microbiota is presented in Figure 4. The Unweighted Unifrac distance heatmap (Figure 4) demonstrated variations in microbial community composition across samples, with pairwise dissimilarity values between 0.40 and 0.70. Samples within the same treatment group generally exhibited lower Unweighted Unifrac distances than those from different treatment groups, suggesting that dietary BAs supplementation influenced the overall cecal microbial community structure.
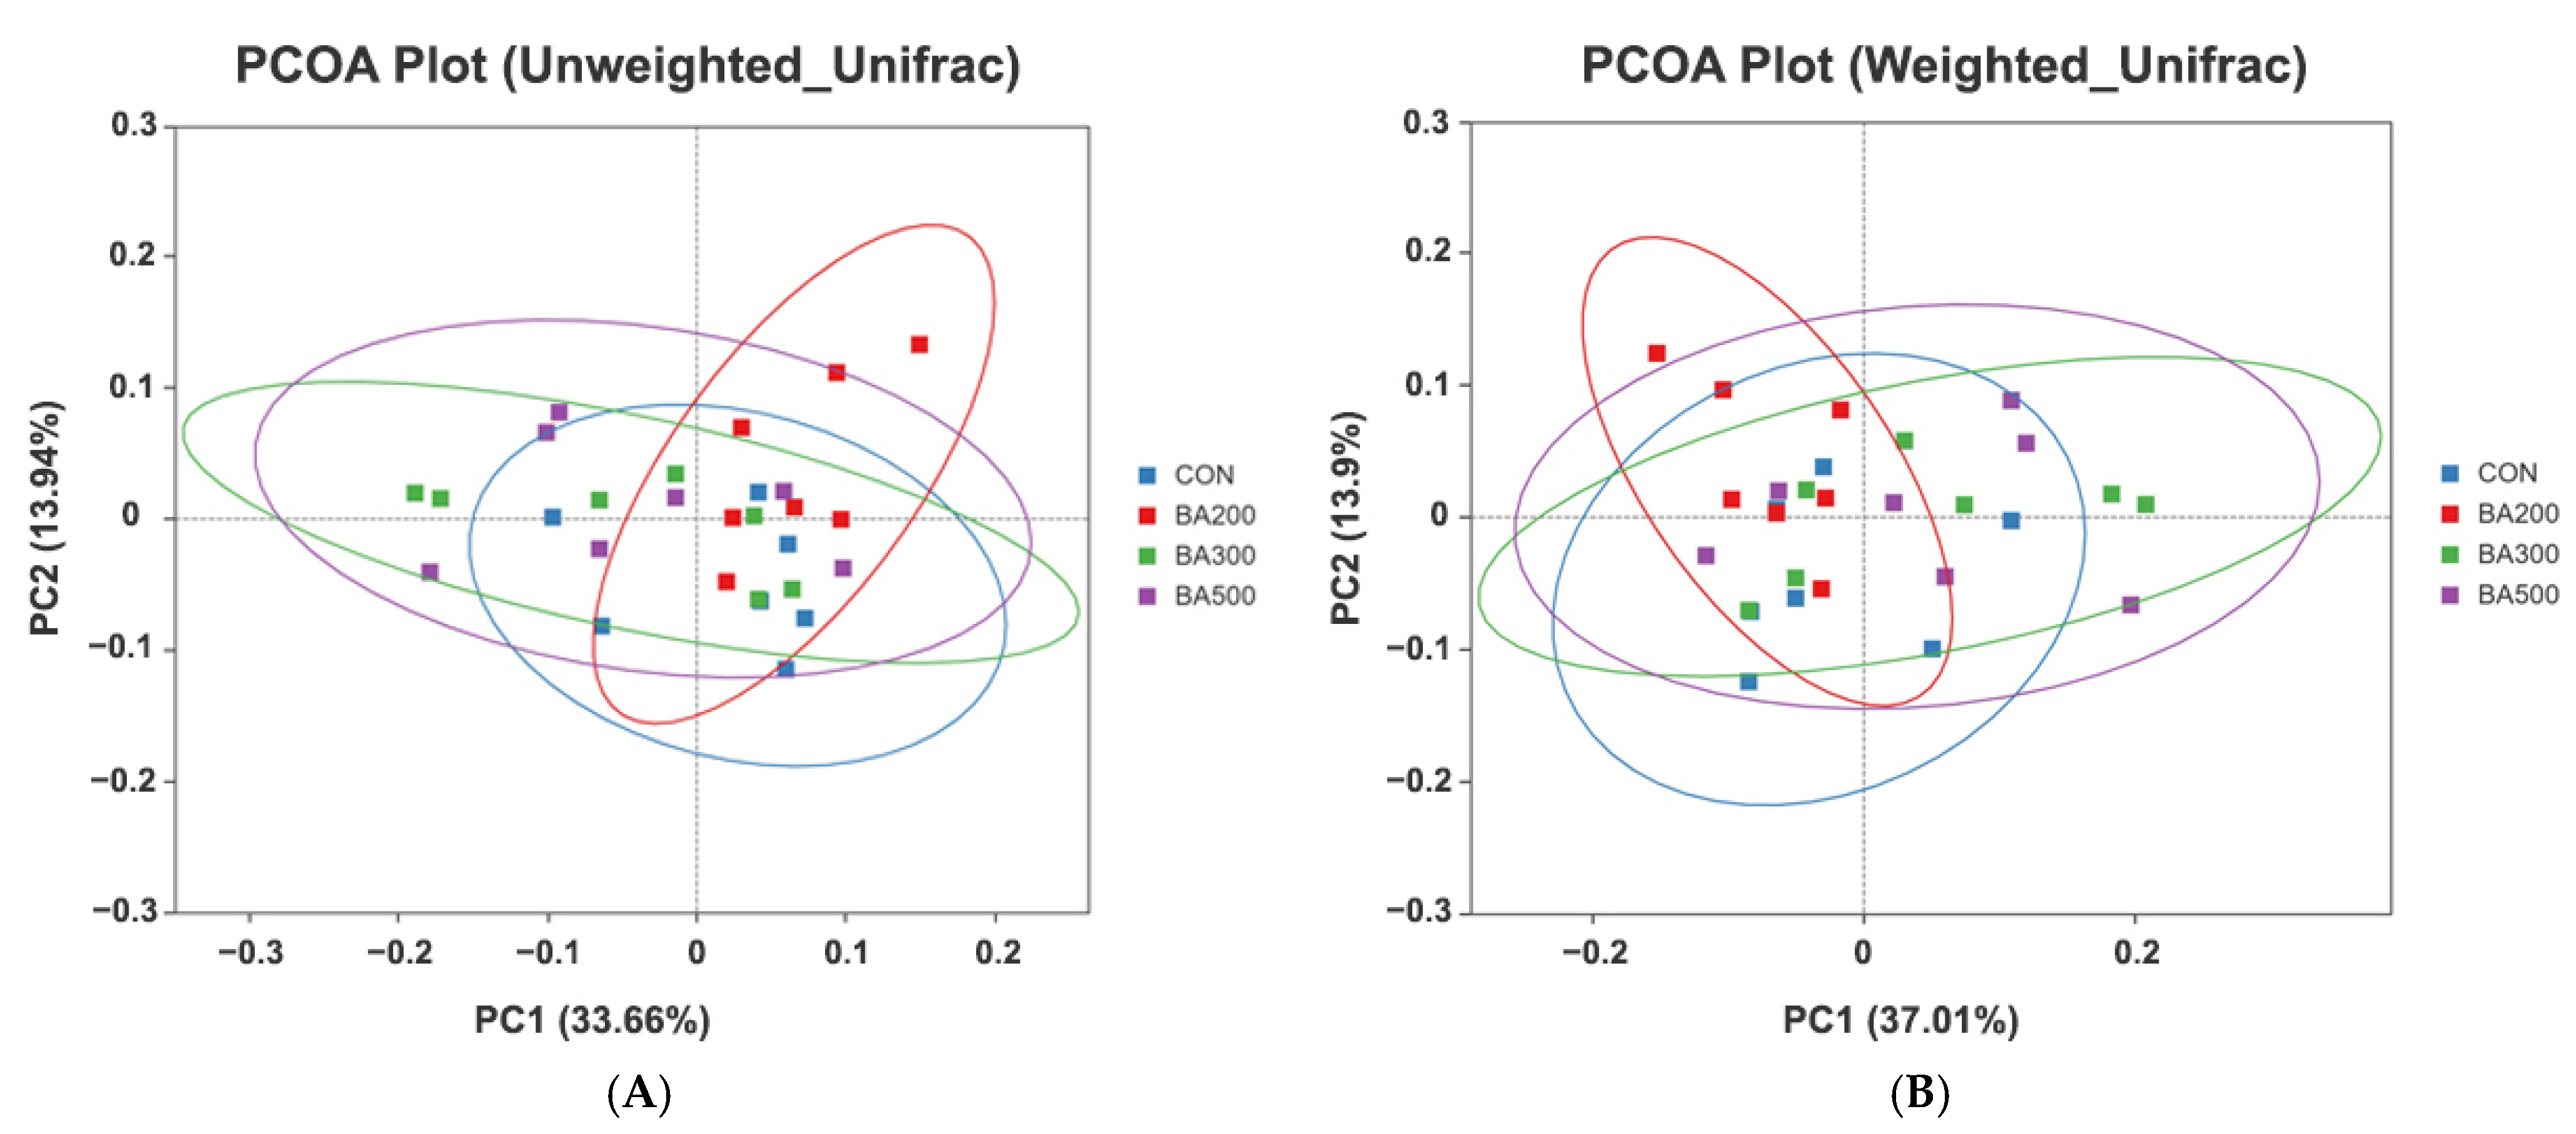
PCoA using unweighted UniFrac distances demonstrated that dietary BAs supplementation modified the cecal microbial community structure in late-laying hens (Figure 5A). The first principal coordinate accounted for 33.66% of the total variation, while the second explained 13.94%. A partial separation among treatment groups was observed along the ordination space. The BA300 and BA500 groups shifted positively along PC1, partially separating from the CON group, while the BA200 group exhibited a minor shift along PC2. Notably, the BA300 group occupied an intermediate position between the CON and BA500 groups along PC1, suggesting a gradual dose-dependent shift in microbial community structure with increasing BAs supplementation. The CON group showed a tight clustering near the center of the ordination space, indicating low inter-individual variation. In contrast, the BA500 group displayed a more dispersed distribution along PC1, suggesting increased heterogeneity in microbial composition with high-dose BAs supplementation. Despite these differences, partial overlap among groups remained, suggesting that the cecal microbiota retained a degree of compositional stability across treatments. Table S1 presents pairwise comparisons using unweighted UniFrac distances. A significant difference was observed between the CON and BA500 groups (p < 0.05), and between the BA200 and BA500 groups (p < 0.05). No significant differences were detected for the comparisons of CON vs. BA200, CON vs. BA300, BA200 vs. BA300, or BA300 vs. BA500 (p > 0.05).
Weighted UniFrac-based PCoA (Figure 5B) further indicated marked alterations in the cecal microbial community structure following dietary BA supplementation. The first principal coordinate accounted for 37.01% of the total variation, while the second explained 13.90%. The BA300 and BA500 groups exhibited a clearer distinction from the control, indicating that moderate-to-high BA levels more significantly influence the phylogenetically weighted microbial community composition. Nevertheless, partial overlap among groups indicated that the cecal microbiota maintained a certain degree of compositional stability across treatments. Weighted UniFrac-based pairwise comparisons (Table S2) revealed a significant difference only between the CON and BA300 groups (p < 0.05), with no significant differences found among the other group comparisons (p > 0.05).

3.6. Effects of Dietary BAs Supplementation on Cecal Microbial Relative Abundances

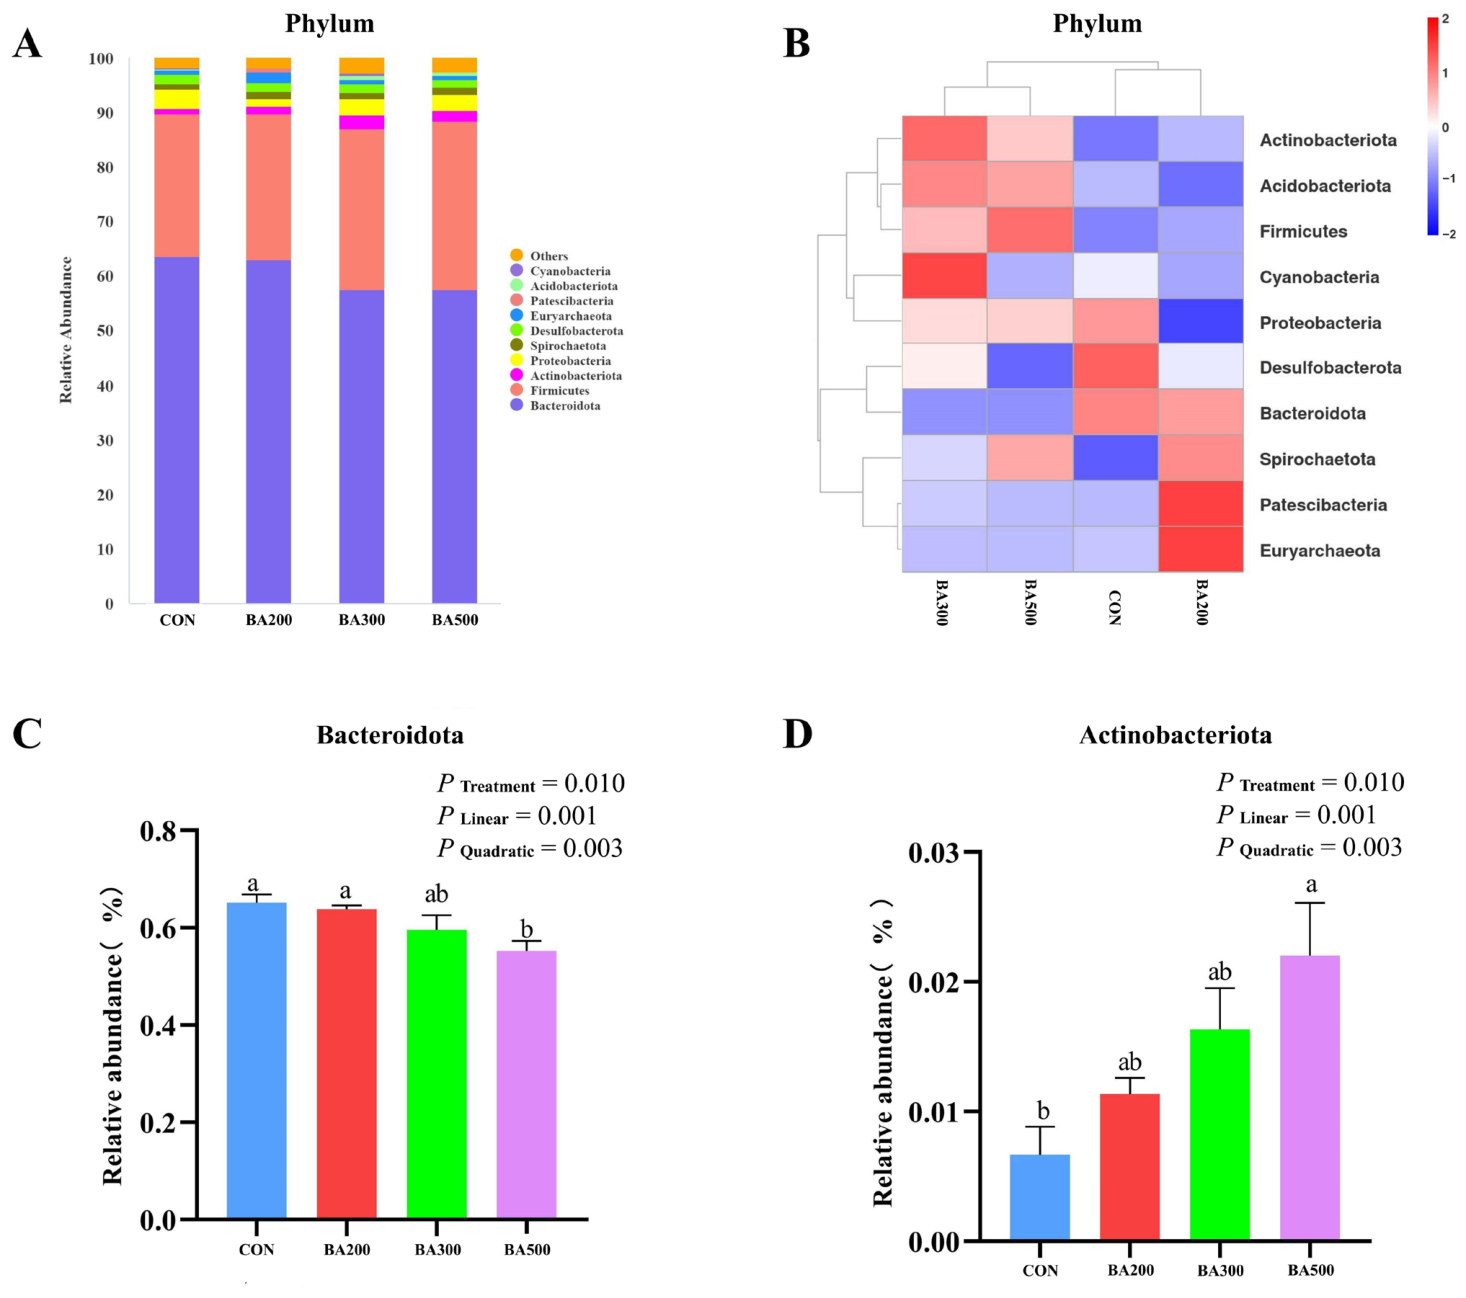
Figure 6 illustrates the impact of dietary BAs supplementation on the cecal microbial composition, highlighting the top 10 phyla. In all treatment groups, the predominant phyla were Bacteroidota and Firmicutes (Figure 6A). The heatmap analysis in Figure 6B indicated variations in microbial community composition across the treatment groups. The BA500 group exhibited a significant reduction in the relative abundance of Bacteroidota compared to the CON group (p < 0.05), with both linear and quadratic decreases correlating with higher dietary BAs levels (linear and quadratic, p < 0.05; Figure 6C). The BA500 group exhibited a significant increase in the relative abundance of Actinobacteriota compared to the CON group (p < 0.05). Additionally, both linear and quadratic trends were observed with rising dietary BAs levels (linear and quadratic, p < 0.05; Figure 6D).
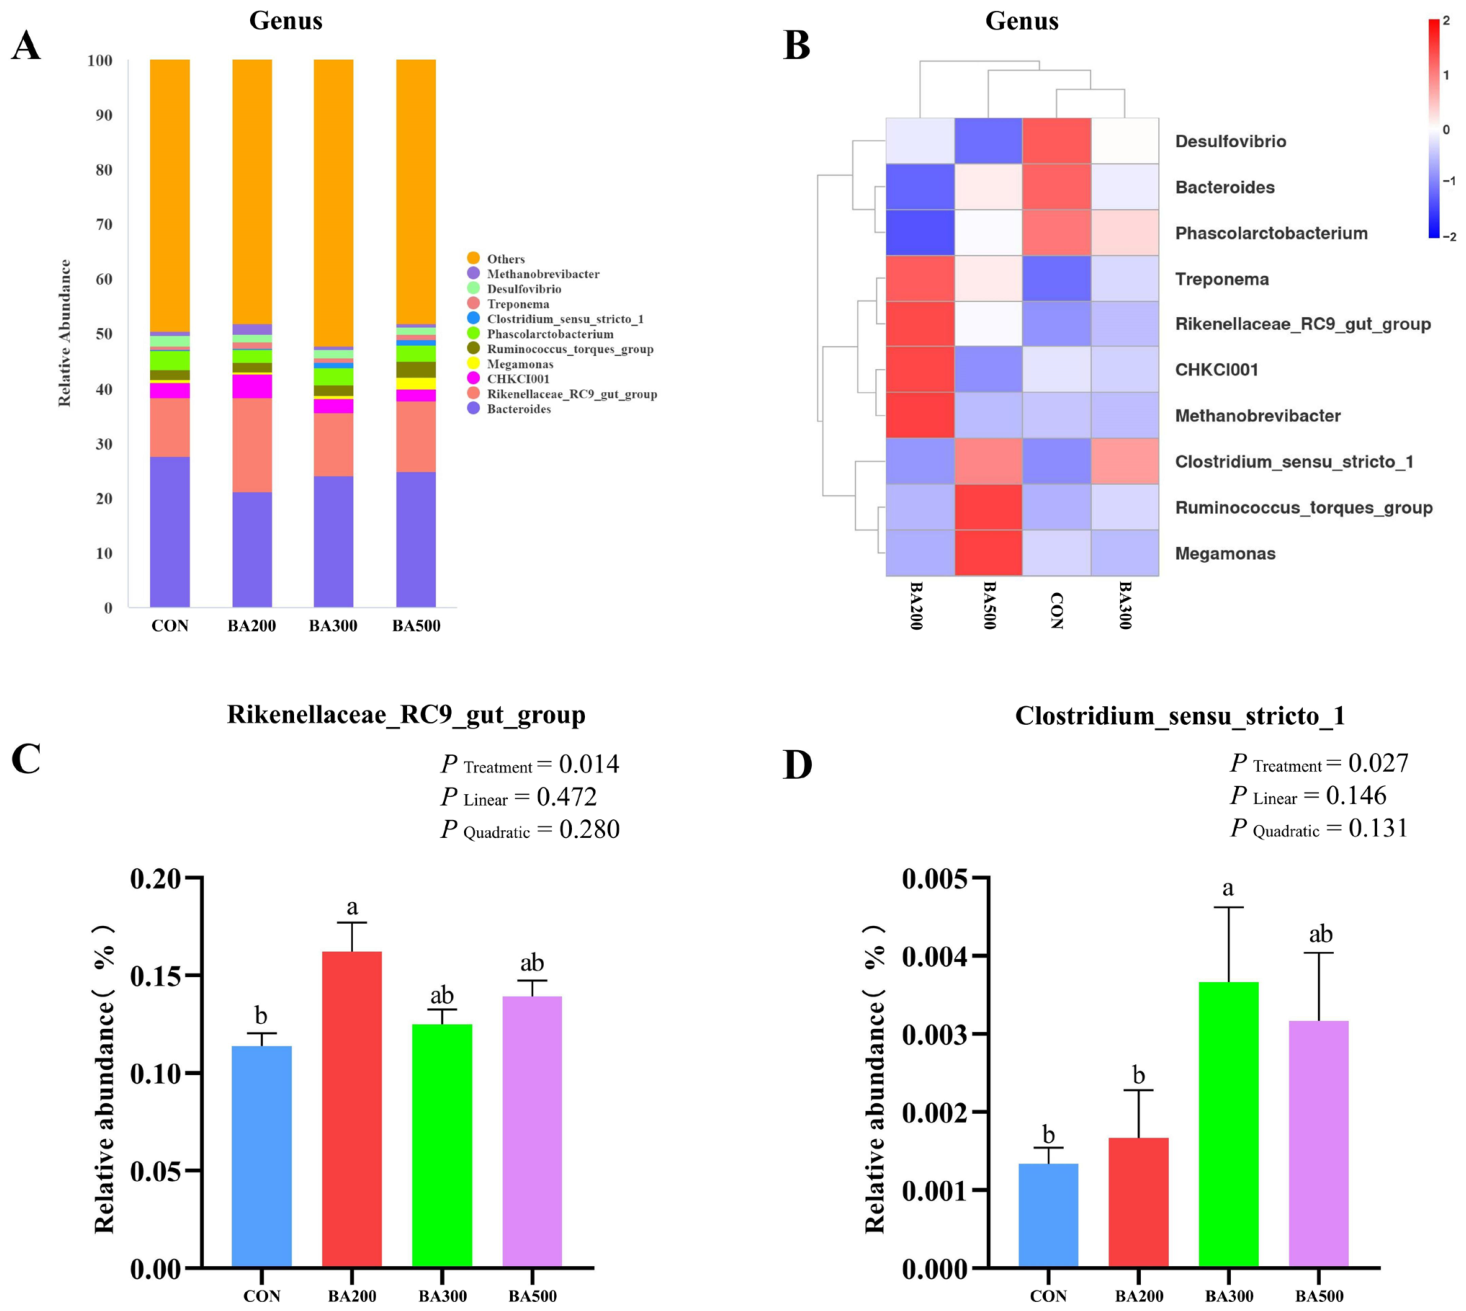
Figure 7 illustrates the impact of dietary BAs supplementation on the cecal microbial composition, highlighting the top 10 genera. Bacteroides predominated in all treatment groups, with Rikenellaceae_RC9_gut_group and CHKCI001 following (Figure 7A). The heatmap analysis indicated variations in the relative abundance of dominant genera across the treatment groups (Figure 7B). The BA200 group exhibited a significant increase in the relative abundance of Rikenellaceae_RC9_gut_group compared to the CON group (p < 0.05; Figure 7C). The BA300 group exhibited a significant increase in the relative abundance of Clostridium_sensu_stricto_1 compared to the CON group (p < 0.05; Figure 7D).
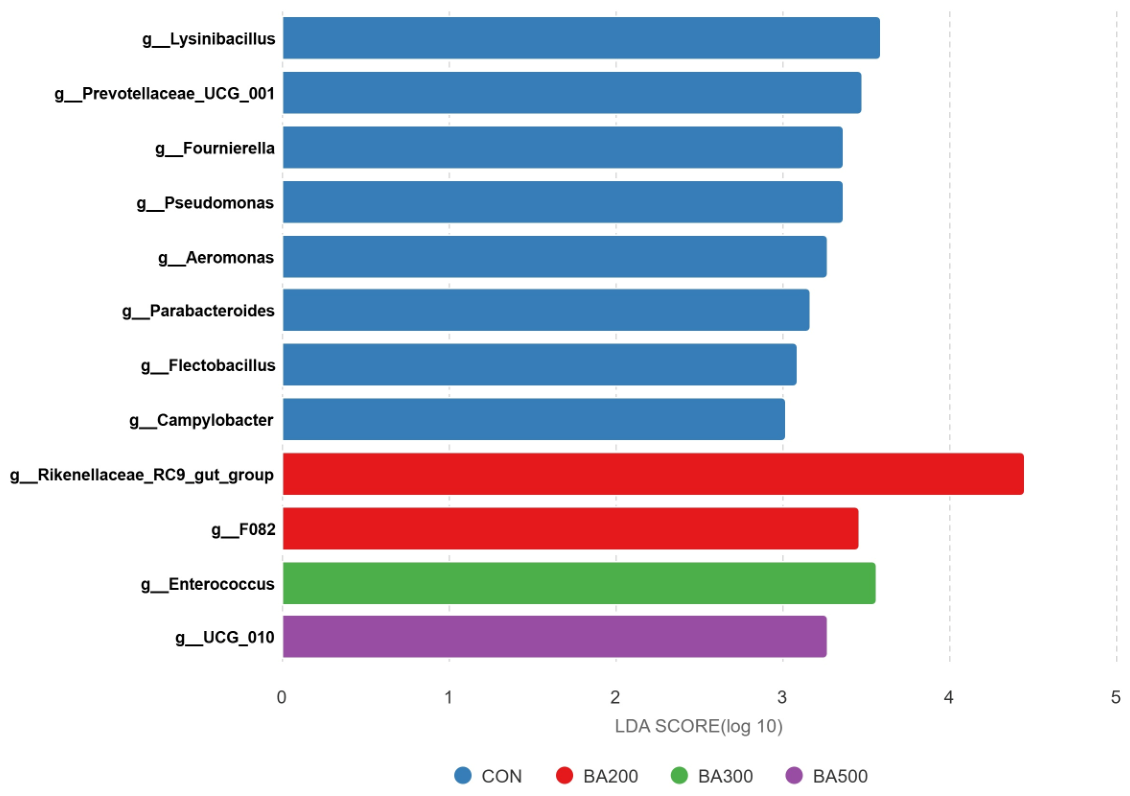
LEfSe analysis identified bacterial taxa with significant differences among the treatment groups (Figure 8). The findings indicated a significant enrichment of Lysinibacillus, Prevotellaceae_UCG_001, Fournierella, Pseudomonas, Aeromonas, Parabacteroides, Flectobacillus, and Campylobacter in the CON group. The BA200 group was primarily distinguished by the abundance of Rikenellaceae_RC9_gut_group and F082. In contrast, Enterococcus and UCG_010 were identified as the predominant biomarkers in the BA300 and BA500 groups, respectively.

4. Discussion

In poultry, the liver serves as the central organ for fatty acid synthesis, oxidation, transport, and BAs biosynthesis. Consequently, alterations in hepatic fatty acid composition are considered important indicators of lipid metabolic status and hepatic health [17]. In this study, dietary BAs supplementation significantly altered the hepatic total fatty acid profile in late-laying hens, with the most pronounced responses observed in the BA300 group, including lower stearic acid (C18:0) and n-6/n-3 PUFA ratio, and higher oleic acid (C18:1n9c), total MUFA, and n-3 PUFA. In the liver, C18:0 is converted to C18:1n9c via the rate-limiting enzyme stearoyl-CoA desaturase 1 (SCD1) [18]. Enhanced SCD1 activity may contribute to increased cellular membrane fluidity and improved lipoprotein assembly efficiency, which may facilitate hepatic lipid export and reduce the risk of fatty liver syndrome in aging hens [19,20,21]. The concurrent decrease in C18:0 and increase in C18:1n9c observed in BA300 is consistent with potential benefits of BAs supplementation for hepatic health. Oleic acid is a major component of egg yolk lipids, and its increased hepatic availability may provide favorable substrates for yolk lipid synthesis; elevated oleic acid levels have been associated with enhanced yolk color intensity and improved egg production rates in laying hens [22,23]. Moreover, increasing n-3 PUFA levels and decreasing the n-6/n-3 PUFA ratio have important physiological effects. n-3 PUFAs exert well-established anti-inflammatory effects, regulate lipid metabolism, and maintain cell membrane integrity [24,25,26]. Their relative increase in the BA300 group may help mitigate the low-grade inflammatory state commonly observed in late-laying hens, thereby potentially supporting liver function [27,28]. The absence of significant changes in total saturated fatty acids or n-6 PUFA across groups suggested that BA supplementation may selectively influence specific fatty acid desaturation and elongation processes rather than broadly affecting overall fatty acid synthesis. The differences between the BA300 and BA500 groups were modest, suggesting that both doses exert beneficial effects on hepatic fatty acid composition, but the BA300 dose appeared to be the most effective overall. Although the percentage changes in individual fatty acids were relatively small, even modest shifts in hepatic fatty acid composition can be biologically meaningful, particularly when involving functionally important fatty acids such as oleic acid and n-3 PUFA. Notably, Fan et al. reported that BA supplementation decreased hepatic C20:0, C22:0, and C24:0 in late-laying hens, whereas the present study found no significant changes in these very-long-chain saturated fatty acids, possibly due to differences in basal diet composition; they also showed that BA200 increased C17:0 and C20:2, while BA300 reduced hepatic triglyceride content and downregulated FAS and SCD1 mRNA expression, providing complementary molecular evidence supporting the fatty acid profile changes observed herein [14].
The cecal microbiota is intricately connected to host metabolism through the gut–liver axis [29,30]. Alpha and beta diversity are widely utilized metrics in microbiome research [31]. This study found that dietary supplementation with BAs significantly impacted both alpha and beta diversity of the cecal microbiota. The Chao1 index was significantly increased in all BAs-supplemented groups, and the Simpson index was also significantly elevated in the BA300 group. The increases in the Chao1 and Simpson indices indicated that BAs supplementation enhanced both species richness and diversity [31]. This finding contrasts with the report by Yang et al., who observed that supplementation with 30, 60, or 90 mg/kg BAs had no significant effect on alpha diversity in the cecal microbiota of 69-week-old Hy-Line Brown laying hens [12]. This variation could be due to differing BAs concentrations and the age of the hens. PCoA using unweighted and weighted UniFrac distances demonstrated significant changes in microbial community structure across treatment groups, suggesting that dietary BAs supplementation may have modulated microbial diversity and community composition, although partial overlap among groups in PCoA plots suggests that these shifts were not complete. The discrepancy between unweighted and weighted UniFrac results suggests that BAs supplementation altered both the presence/absence of rare taxa (captured by unweighted UniFrac) and the relative abundance of dominant taxa (captured by weighted UniFrac), though the specific taxa driving these patterns differed between dose levels. Similar changes in beta diversity have been reported by Li et al. [32]. Because BAs possess antimicrobial activity and function as signaling molecules regulating both host metabolism and microbial ecology, dietary BAs supplementation may influence cecal microbial community assembly and composition [33,34]. Increased microbial diversity is generally associated with enhanced gut functional stability and improved resistance to environmental perturbations [35], which may underlie the changes in hepatic fatty acid composition observed in BAs-supplemented hens.
Bacteroidota and Firmicutes were the predominant phyla across all groups at the phylum level, aligning with the typical features of avian cecal microbiota [36]. Notably, the BA500 group exhibited a significantly reduced abundance of Bacteroidota and a markedly elevated abundance of Actinobacteriota. Members of Bacteroidota primarily degrade complex carbohydrates and produce short-chain fatty acids (SCFA) such as butyrate, which serves as an energy source for intestinal epithelial cells and helps maintain mucosal integrity [37,38], while also participating in BAs metabolism and facilitating the excretion of toxic compounds [39]. Certain genera within Actinobacteriota produce bioactive metabolites and contribute to intestinal homeostasis [40]. The shift in phylum-level composition at the highest BAs dose may therefore reflect a dose-dependent shift in the microbial metabolic landscape. At the genus level, BA200 showed a significant enrichment of Rikenellaceae_RC9_gut_group. This genus is associated with enhanced nutrient absorption and promotion of fatty acid metabolism, and its enrichment may be related to BAs-mediated improvements in gut health [41,42,43]. Clostridium sensu stricto 1 was significantly enriched in BA300; some species within this genus possess butyrate-producing capabilities [44], and butyrate serves as the primary energy source for intestinal epithelial cells while promoting barrier repair and anti-inflammatory responses [45]. This finding is mechanistically consistent with the favorable hepatic fatty acid profile observed in BA300, as butyrate-mediated improvements in intestinal barrier function may reduce the translocation of lipopolysaccharides into the portal circulation, thereby alleviating hepatic inflammatory burden. It should be noted, however, that intestinal barrier function and endotoxin translocation were not directly assessed in this study, and the proposed link between butyrate-producing taxa and hepatic inflammatory burden remains to be verified.
LEfSe analysis further demonstrated that dietary BAs supplementation significantly altered the composition of the cecal microbiota and promoted the enrichment of specific bacterial taxa at different supplementation levels. In this study, the CON group showed an enrichment of Pseudomonas, Aeromonas, Campylobacter, and Lysinibacillus. Several members of the genera Pseudomonas and Aeromonas are recognized as opportunistic pathogens, and their enrichment is often associated with microbial dysbiosis, intestinal inflammation, and potential gut barrier dysfunction, suggesting a less favorable intestinal environment [46]. Similarly, Lysinibacillus are generally maintained at low abundance in the healthy avian gut, and their overrepresentation is frequently associated with intestinal pathological conditions [47]. In addition, Campylobacter is a key colonizer of the poultry gut, linked to changes in microbial composition and host inflammation [48]. Therefore, the relatively high abundance of these taxa in the absence of BAs supplementation may reflect a less desirable microbial ecosystem in late-laying hens [49,50]. In contrast, BAs supplementation promoted the enrichment of bacterial taxa associated with improved gut function and host metabolism. The BA200 group was characterized by a higher abundance of Rikenellaceae_RC9_gut_group. Members of the family Rikenellaceae are considered important degraders of complex polysaccharides and have been positively associated with microbial fermentation and the production of SCFA, particularly acetate and propionate, which contribute to intestinal homeostasis and host energy homeostasis [51,52,53]. Previous studies have also reported positive associations between the abundance of Rikenellaceae_RC9_gut_group and improved gut metabolic function [54], suggesting that moderate BAs supplementation may enhance microbial fermentative capacity and nutrient utilization. The BA300 group was primarily characterized by the enrichment of Enterococcus. Although certain Enterococcus species may act as opportunistic pathogens, many commensal strains are regarded as beneficial members of the gut microbiota because of their ability to produce lactic acid, bacteriocins, and other antimicrobial compounds that inhibit pathogenic bacteria and contribute to microbial stability [55]. Therefore, the enrichment of Enterococcus in the BA300 group may indicate a more balanced microbial community with potentially enhanced colonization resistance against undesirable microorganisms [56,57]. In the BA500 group, UCG_010 was identified as the discriminative taxon. Although the ecological role of this taxon remains poorly characterized, previous microbiome studies have linked members of the Ruminococcaceae-related lineage to carbohydrate fermentation and gut metabolic activity [58,59]. The increased abundance of UCG_010 may therefore reflect a microbial response to higher dietary BAs supplementation and the accompanying alterations in cecal nutrient metabolism. Collectively, these findings suggested that dietary BAs supplementation modulated the cecal microbial community by reducing the relative abundance of potentially harmful bacteria while promoting taxa associated with carbohydrate fermentation, microbial stability, and metabolic health. Among the tested supplementation levels, 300 mg/kg BAs appeared to exert the pronounced effects on gut microbiota composition, which is consistent with its beneficial effects on microbial diversity and community structure observed in the present study.

5. Conclusions

In summary, under the conditions of this experiment, dietary supplementation with 300 mg/kg BAs improved hepatic lipid metabolism and gut microbiota composition in aged laying hens, and thus represents a practical nutritional strategy to mitigate metabolic decline during the late laying phase.

Supplementary Materials

The following supporting information can be downloaded at: https://www.mdpi.com/article/10.3390/poultry5040058/s1, Table S1: Between-group difference test of Beta diversity based on unweighted UniFrac Distance; Table S2: Between-group difference test of Beta diversity based on weighted UniFrac distance.

Author Contributions

Conceptualization, Z.L. and Y.J.; Methodology, Z.L., Y.J., Y.Z., Y.F., G.Z. and Q.F.; Software, Z.L. and G.Z.; Validation, Z.L., Y.J., Y.Z., G.Z. and Y.F.; Formal Analysis, Z.L.; Investigation, Z.L., Y.J., Y.Z., Y.F., G.Z. and Q.F.; Resources, J.L., S.J. and W.Y.; Data Curation, Z.L.; Writing—Original Draft Preparation, Z.L.; Writing—Review & Editing, J.L., S.J. and W.Y.; Visualization, Z.L. and J.L.; Supervision, W.Y.; Project Administration, J.L. and W.Y.; Funding Acquisition, W.Y. All authors have read and agreed to the published version of the manuscript.

Funding

This research was funded by the National Key Research and Development Program of China, Grant No. 2023YFD1301605.

Institutional Review Board Statement

All experimental procedures were approved by the Animal Welfare and Use Committee of Shandong Agricultural University (Tai’an, China; approval code SDAUA-2023-817, approved on 17 August 2023).

Informed Consent Statement

Informed consent was obtained from all individual participants included in the study.

Data Availability Statement

The original contributions presented in this study are included in the article and Supplementary Material. Further inquiries can be directed to the corresponding authors.

Acknowledgments

The authors sincerely thank the family farm in Kongjia Village, Ciyao Town, Ningyang County, Shandong Province, China, for providing feeding management and support for the experimental animals during the trial.

Conflicts of Interest

The authors declare no conflicts of interest.

Abbreviations

The following abbreviations are used in this manuscript:
BAsBile acids
GC-MSGas chromatography–mass spectrometry
FAMEFatty acid methyl ester
ASVsAmplicon sequence variants
PCRPolymerase chain reaction
qPCRQuantitative PCR
ANOVAAnalysis of variance
SEMStandard error of the mean
SFASaturated fatty acids
MUFAMonounsaturated fatty acids
PUFAPolyunsaturated fatty acids
UFAUnsaturated fatty acids
PCoAPrincipal coordinate analysis
LEfSeLinear discriminant analysis effect size
LDALinear discriminant analysis
SCFAShort-chain fatty acids
SCD1Stearoyl-CoA desaturase 1

References

  1. Gunjan, K.; Pandey, R.P.; Himanshu, K.; Mukherjee, R.; Chang, C.-M. Navigating the Global Egg Shortage: A Comprehensive Study of Interconnected Challenges. Food Humanit. 2026, 6, 101093. [Google Scholar] [CrossRef] [Scilit]
  2. Nassar, F.S. Strategic Role of Poultry Production Sciences in Shaping the Future of Global Food Security and Strengthen Sustainability. Poult. Sci. 2026, 105, 106617. [Google Scholar] [CrossRef] [Scilit] [PubMed]
  3. van Eck, L.M.; Enting, H.; Carvalhido, I.J.; Chen, H.; Kwakkel, R.P. Lipid Metabolism and Body Composition in Long-Term Producing Hens. World’s Poult. Sci. J. 2023, 79, 243–264. [Google Scholar] [CrossRef] [Scilit]
  4. Anene, D.O.; Akter, Y.; Groves, P.J.; Horadagoda, N.; Liu, S.Y.; Moss, A.; Hutchison, C.; O’Shea, C.J. Association of Feed Efficiency with Organ Characteristics and Fatty Liver Haemorrhagic Syndrome in Laying Hens. Sci. Rep. 2023, 13, 5872. [Google Scholar] [CrossRef] [Scilit] [PubMed]
  5. Yao, W.; Wang, E.; Zhou, Y.; Han, Y.; Li, S.; Yin, X.; Huang, X.; Huang, F. Effects of Garcinol Supplementation on the Performance, Egg Quality, and Intestinal Health of Laying Hens in the Late Laying Period. Poult. Sci. 2023, 102, 102939. [Google Scholar] [CrossRef] [Scilit] [PubMed]
  6. Xing, R.; Fan, K.; Fan, Z.; Wang, L.; Huang, Y.; Zhang, H.; Chen, W.; Si, X. Porcine Bile Acids Improve Performance by Altering Hepatic Lipid Metabolism and Amino Acid Metabolism with Different Protein Level Diets in Late Laying Hens. Poult. Sci. 2025, 104, 104777. [Google Scholar] [CrossRef] [Scilit] [PubMed]
  7. Sun, L.; Xin, Q.; Jiao, H.; Wang, X.; Zhao, J.; Li, H.; Zhou, Y.; Cao, A.; Wang, J.; Lin, H. Effect of Exogenous Bile Salts Supplementation on the Performance and Hepatic Lipid Metabolism of Aged Laying Hens. J. Anim. Sci. 2023, 101, skad334. [Google Scholar] [CrossRef] [Scilit] [PubMed]
  8. Di Gregorio, M.C.; Cautela, J.; Galantini, L. Physiology and Physical Chemistry of Bile Acids. Int. J. Mol. Sci. 2021, 22, 1780. [Google Scholar] [CrossRef] [Scilit] [PubMed]
  9. Lai, W.; Huang, W.; Dong, B.; Cao, A.; Zhang, W.; Li, J.; Wu, H.; Zhang, L. Effects of Dietary Supplemental Bile Acids on Performance, Carcass Characteristics, Serum Lipid Metabolites and Intestinal Enzyme Activities of Broiler Chickens. Poult. Sci. 2018, 97, 196–202. [Google Scholar] [CrossRef] [Scilit] [PubMed]
  10. Ge, X.K.; Wang, A.A.; Ying, Z.X.; Zhang, L.G.; Su, W.P.; Cheng, K.; Feng, C.C.; Zhou, Y.M.; Zhang, L.L.; Wang, T. Effects of Diets with Different Energy and Bile Acids Levels on Growth Performance and Lipid Metabolism in Broilers. Poult. Sci. 2019, 98, 887–895. [Google Scholar] [CrossRef] [Scilit] [PubMed]
  11. Geng, S.; Zhang, Y.; Cao, A.; Liu, Y.; Di, Y.; Li, J.; Lou, Q.; Zhang, L. Effects of Fat Type and Exogenous Bile Acids on Growth Performance, Nutrient Digestibility, Lipid Metabolism and Breast Muscle Fatty Acid Composition in Broiler Chickens. Animals 2022, 12, 1258. [Google Scholar] [CrossRef] [Scilit] [PubMed]
  12. Yang, B.; Huang, S.; Zhao, G.; Ma, Q. Dietary Supplementation of Porcine Bile Acids Improves Laying Performance, Serum Lipid Metabolism and Cecal Microbiota in Late-Phase Laying Hens. Anim. Nutr. 2022, 11, 283–292. [Google Scholar] [CrossRef] [Scilit] [PubMed]
  13. Yu, X.; Cao, T.; Ipemba, E.; Bakala, G.B.; Leveut, L.G.D.; Peng, W.; Ji, F.; Li, H.; Xu, L.; Wu, H. Effects of Dietary Supplementation with Bile Acids on Growth Performance, Antioxidant Capacity, Lipid Metabolism, and Cecal Microbiota of Danzhou Chickens. Poult. Sci. 2025, 104, 105276. [Google Scholar] [CrossRef] [Scilit] [PubMed]
  14. Fan, Q.; Ge, Y.C.; Fu, Y.; Gao, Y.; Zhou, G.; Liu, Z.; Yuan, X.; Yang, W.; Jiao, N.; Ding, Y.; et al. Research note: Effects of Dietary Bile Acids Supplementation on Hepatic Lipid Accumulation and Fatty Acid Profile of Hens at Late Laying Cycle. Poult. Sci. 2025, 104, 106026. [Google Scholar] [CrossRef] [Scilit] [PubMed]
  15. NY/T 33-2004; Feeding Standard of Chicken. Ministry of Agriculture of the People’s Republic of China: Beijing, China, 2004.
  16. Wu, T.; Jiang, X.; Yang, F.; Wei, Y.; Zhao, S.; Jiao, T. Effects of Dietary Quinoa Seeds on Cecal Microorganisms and Muscle Fatty Acids of Female Luhua Chickens. Animals 2022, 12, 3334. [Google Scholar] [CrossRef] [Scilit] [PubMed]
  17. Imtiaz, A.; Bin Tahir, M.T.; Zhao, M.; Gong, D.; Ge, J.; Geng, T. Non-Alcoholic Fatty Liver Disease in Poultry: Risk Factors, Mechanism of Development, and Emerging Strategies. Int. J. Mol. Sci. 2025, 26, 8460. [Google Scholar] [CrossRef] [Scilit] [PubMed]
  18. Kłosok, M.; Gendosz de Carrillo, D.; Łaszczyca, P.; Płociniczak, T.; Jędrzejowska-Szypułka, H.; Sawczyn, T. Comparative Analysis of Fatty Acids Concentration in Liver and Muscle Tissues of Rats and Mice. Appl. Sci. 2024, 14, 3192. [Google Scholar] [CrossRef] [Scilit]
  19. Cohen, P.; Ntambi, J.M.; Friedman, J.M. Stearoyl-CoA Desaturase-1 and the Metabolic Syndrome. Curr. Drug Targets Immune Endocr. Metab. Disord. 2003, 3, 271–280. [Google Scholar] [CrossRef] [Scilit] [PubMed]
  20. Jeyakumar, S.M.; Vajreswari, A. Stearoyl-CoA Desaturase 1: A Potential Target for Non-Alcoholic Fatty Liver Disease?-Perspective on Emerging Experimental Evidence. World J. Hepatol. 2022, 14, 168–179. [Google Scholar] [CrossRef] [Scilit] [PubMed]
  21. Balatskyi, V.V.; Dobrzyn, P. Role of Stearoyl-CoA Desaturase 1 in Cardiovascular Physiology. Int. J. Mol. Sci. 2023, 24, 5531. [Google Scholar] [CrossRef] [Scilit] [PubMed]
  22. Xiao, N.; Zhao, Y.; Yao, Y.; Wu, N.; Xu, M.; Du, H.; Tu, Y. Biological Activities of Egg Yolk Lipids: A Review. J. Agric. Food Chem. 2020, 68, 1948–1957. [Google Scholar] [CrossRef] [Scilit] [PubMed]
  23. Toomer, O.T.; Vu, T.C.; Sanders, E.; Redhead, A.K.; Malheiros, R.; Anderson, K.E. Feeding Laying Hens a Diet Containing High-Oleic Peanuts or Oleic Acid Enriches Yolk Color and Beta-Carotene While Reducing the Saturated Fatty Acid Content in Eggs. Agriculture 2021, 11, 771. [Google Scholar] [CrossRef] [Scilit]
  24. Calder, P.C. Polyunsaturated Fatty Acids and Inflammation. Prostaglandins Leukot. Essent. Fat. Acids 2006, 75, 197–202. [Google Scholar] [CrossRef] [Scilit] [PubMed]
  25. Yang, L.G.; Song, Z.X.; Yin, H.; Wang, Y.Y.; Shu, G.F.; Lu, H.X.; Wang, S.K.; Sun, G.J. Low N-6/n-3 PUFA Ratio Improves Lipid Metabolism, Inflammation, Oxidative Stress and Endothelial Function in Rats Using Plant Oils as n-3 Fatty Acid Source. Lipids 2016, 51, 49–59. [Google Scholar] [CrossRef] [Scilit] [PubMed]
  26. Coniglio, S.; Shumskaya, M.; Vassiliou, E. Unsaturated Fatty Acids and Their Immunomodulatory Properties. Biology 2023, 12, 279. [Google Scholar] [CrossRef] [Scilit] [PubMed]
  27. Ali, O.; Szabó, A. Review of Eukaryote Cellular Membrane Lipid Composition, with Special Attention to the Fatty Acids. Int. J. Mol. Sci. 2023, 24, 15693. [Google Scholar] [CrossRef] [Scilit] [PubMed]
  28. Yue, Y.; Bai, H.; Liu, T.; Jia, S.; Kou, X.; Wang, Z. The Anti-Inflammatory Ability of n-3 PUFAs: Optimization of Compositions and Concentrations in Mouse Hepatocytes. Nutr. Food Sci. 2025, 55, 753–771. [Google Scholar] [CrossRef] [Scilit]
  29. Pickard, J.M.; Zeng, M.Y.; Caruso, R.; Núñez, G. Gut Microbiota: Role in Pathogen Colonization, Immune Responses, and Inflammatory Disease. Immunol. Rev. 2017, 279, 70–89. [Google Scholar] [CrossRef] [Scilit] [PubMed]
  30. Beyaz Coşkun, A.; Sağdiçoğlu Celep, A.G. Therapeutic Modulation Methods of Gut Microbiota and Gut-Liver Axis. Crit. Rev. Food Sci. Nutr. 2022, 62, 6505–6515. [Google Scholar] [CrossRef] [Scilit] [PubMed]
  31. Xia, Y.; Sun, J. Alpha Diversity. In Bioinformatic and Statistical Analysis of Microbiome Data: From Raw Sequences to Advanced Modeling with QIIME 2 and R; Xia, Y., Sun, J., Eds.; Springer International Publishing: Cham, Switzerland, 2023; pp. 289–333. [Google Scholar]
  32. Li, G.; Wang, X.; Liu, Y.; Gong, S.; Yang, Y.; Wang, C.; Wang, H.; He, D. Bile Acids Supplementation Modulates Lipid Metabolism, Intestinal Function, and Cecal Microbiota in Geese. Front. Microbiol. 2023, 14, 1185218. [Google Scholar] [CrossRef] [Scilit] [PubMed]
  33. Begley, M.; Gahan, C.G.M.; Hill, C. The Interaction between Bacteria and Bile. FEMS Microbiol. Rev. 2005, 29, 625–651. [Google Scholar] [CrossRef] [Scilit] [PubMed]
  34. Wahlström, A.; Sayin, S.I.; Marschall, H.-U.; Bäckhed, F. Intestinal Crosstalk between Bile Acids and Microbiota and Its Impact on Host Metabolism. Cell Metab. 2016, 24, 41–50. [Google Scholar] [CrossRef] [Scilit] [PubMed]
  35. Upadhaya, S.D.; Kim, I.H. Maintenance of Gut Microbiome Stability for Optimum Intestinal Health in Pigs—A Review. J. Anim. Sci. Biotechnol. 2022, 13, 140. [Google Scholar] [CrossRef] [Scilit] [PubMed]
  36. Wang, J.; Hong, M.; Long, J.; Yin, Y.; Xie, J. Differences in Intestinal Microflora of Birds among Different Ecological Types. Front. Ecol. Evol. 2022, 10, 920869. [Google Scholar] [CrossRef] [Scilit]
  37. Zhang, B.; Zhang, H.; Yu, Y.; Zhang, R.; Wu, Y.; Yue, M.; Yang, C. Effects of Bacillus Coagulans on Growth Performance, Antioxidant Capacity, Immunity Function, and Gut Health in Broilers. Poult. Sci. 2021, 100, 101168. [Google Scholar] [CrossRef] [Scilit] [PubMed]
  38. Huber-Ruano, I.; Calvo, E.; Mayneris-Perxachs, J.; Rodríguez-Peña, M.-M.; Ceperuelo-Mallafré, V.; Cedó, L.; Núñez-Roa, C.; Miro-Blanch, J.; Arnoriaga-Rodríguez, M.; Balvay, A.; et al. Orally Administered Odoribacter Laneus Improves Glucose Control and Inflammatory Profile in Obese Mice by Depleting Circulating Succinate. Microbiome 2022, 10, 135. [Google Scholar] [CrossRef] [Scilit] [PubMed]
  39. Garcia, G.D.; Carvalho, M.A.R.; Diniz, C.G.; Marques, J.L.; Nicoli, J.R.; Farias, L.M. Isolation, Identification and Antimicrobial Susceptibility of Bacteroides Fragilis Group Strains Recovered from Broiler Faeces. Br. Poult. Sci. 2012, 53, 71–76. [Google Scholar] [CrossRef] [Scilit] [PubMed]
  40. Binda, C.; Lopetuso, L.R.; Rizzatti, G.; Gibiino, G.; Cennamo, V.; Gasbarrini, A. Actinobacteria: A Relevant Minority for the Maintenance of Gut Homeostasis. Dig. Liver Dis. 2018, 50, 421–428. [Google Scholar] [CrossRef] [Scilit] [PubMed]
  41. Zhou, L.; Xiao, X.; Zhang, Q.; Zheng, J.; Li, M.; Yu, M.; Wang, X.; Deng, M.; Zhai, X.; Li, R. Improved Glucose and Lipid Metabolism in the Early Life of Female Offspring by Maternal Dietary Genistein Is Associated with Alterations in the Gut Microbiota. Front. Endocrinol. 2018, 9, 516. [Google Scholar] [CrossRef] [Scilit] [PubMed]
  42. Han, H.; Zhang, L.; Shang, Y.; Wang, M.; Phillips, C.J.C.; Wang, Y.; Su, C.; Lian, H.; Fu, T.; Gao, T. Replacement of Maize Silage and Soyabean Meal with Mulberry Silage in the Diet of Hu Lambs on Growth, Gastrointestinal Tissue Morphology, Rumen Fermentation Parameters and Microbial Diversity. Animals 2022, 12, 1406. [Google Scholar] [CrossRef] [Scilit] [PubMed]
  43. Guo, X.; Liu, J.; Yang, J.; Gao, Q.; Zhang, J.; Yang, W.; Xin, G. Effects of Dietary Metabolizable Energy and Crude Protein Levels on the Nutrient Metabolism, Gut Development and Microbiota Composition in Jingyuan Chicken. Animals 2025, 15, 2387. [Google Scholar] [CrossRef] [Scilit] [PubMed]
  44. Xu, E.; Yang, H.; Ren, M.; Wang, Y.; Xiao, M.; Tang, Q.; Zhu, M.; Xiao, Y. Identification of Enterotype and Its Effects on Intestinal Butyrate Production in Pigs. Animals 2021, 11, 730. [Google Scholar] [CrossRef] [Scilit] [PubMed]
  45. Knudsen, K.E.B.; Lærke, H.N.; Hedemann, M.S.; Nielsen, T.S.; Ingerslev, A.K.; Nielsen, D.S.G.; Theil, P.K.; Purup, S.; Hald, S.; Schioldan, A.G.; et al. Impact of Diet-Modulated Butyrate Production on Intestinal Barrier Function and Inflammation. Nutrients 2018, 10, 1499. [Google Scholar] [CrossRef] [Scilit] [PubMed]
  46. Abd El-Ghany, W.A. Pseudomonas Aeruginosa Infection of Avian Origin: Zoonosis and One Health Implications. Vet. World 2021, 14, 2155–2159. [Google Scholar] [CrossRef] [Scilit] [PubMed]
  47. Macdonald, S.E.; Nolan, M.J.; Harman, K.; Boulton, K.; Hume, D.A.; Tomley, F.M.; Stabler, R.A.; Blake, D.P. Effects of Eimeria Tenella Infection on Chicken Caecal Microbiome Diversity, Exploring Variation Associated with Severity of Pathology. PLoS ONE 2017, 12, e0184890. [Google Scholar] [CrossRef] [Scilit] [PubMed]
  48. Al Hakeem, W.G.; Fathima, S.; Shanmugasundaram, R.; Selvaraj, R.K. Campylobacter Jejuni in Poultry: Pathogenesis and Control Strategies. Microorganisms 2022, 10, 2134. [Google Scholar] [CrossRef] [Scilit] [PubMed]
  49. Urgancı, N.N.; Yılmaz, N.; Alaşalvar, G.K.; Yıldırım, Z. Pseudomonas Aeruginosa and Its Pathogenicity. Turk. J. Agric. Food Sci. Technol. 2022, 10, 726–738. [Google Scholar] [CrossRef] [Scilit]
  50. Yu, K.; Choi, I.; Kim, M.; Pyung, Y.J.; Lee, J.-S.; Choi, Y.; Won, S.; Kim, Y.; Park, B.-C.; Han, S.H.; et al. Florfenicol-Induced Dysbiosis Impairs Intestinal Homeostasis and Host Immune System in Laying Hens. J. Anim. Sci. Biotechnol. 2025, 16, 56. [Google Scholar] [CrossRef] [Scilit] [PubMed]
  51. Ye, S.; Shah, B.R.; Li, J.; Liang, H.; Zhan, F.; Geng, F.; Li, B. A Critical Review on Interplay between Dietary Fibers and Gut Microbiota. Trends Food Sci. Technol. 2022, 124, 237–249. [Google Scholar] [CrossRef] [Scilit]
  52. Andrani, M.; Borghetti, P.; Ravanetti, F.; Cavalli, V.; Ferrari, L.; De Angelis, E.; Martelli, P.; Saleri, R. Acetate and Propionate Effects in Response to LPS in a Porcine Intestinal Co-Culture Model. Porc. Health Manag. 2023, 9, 23. [Google Scholar] [CrossRef] [Scilit] [PubMed]
  53. Zhang, D.; Jian, Y.-P.; Zhang, Y.-N.; Li, Y.; Gu, L.-T.; Sun, H.-H.; Liu, M.-D.; Zhou, H.-L.; Wang, Y.-S.; Xu, Z.-X. Short-Chain Fatty Acids in Diseases. Cell Commun. Signal. 2023, 21, 212. [Google Scholar] [CrossRef] [Scilit] [PubMed]
  54. Tavella, T.; Rampelli, S.; Guidarelli, G.; Bazzocchi, A.; Gasperini, C.; Pujos-Guillot, E.; Comte, B.; Barone, M.; Biagi, E.; Candela, M.; et al. Elevated Gut Microbiome Abundance of Christensenellaceae, Porphyromonadaceae and Rikenellaceae Is Associated with Reduced Visceral Adipose Tissue and Healthier Metabolic Profile in Italian Elderly. Gut Microbes 2021, 13, 1880221. [Google Scholar] [CrossRef] [Scilit] [PubMed]
  55. Krawczyk, B.; Wityk, P.; Gałęcka, M.; Michalik, M. The Many Faces of Enterococcus spp.—Commensal, Probiotic and Opportunistic Pathogen. Microorganisms 2021, 9, 1900. [Google Scholar] [CrossRef] [Scilit] [PubMed]
  56. Hanchi, H.; Mottawea, W.; Sebei, K.; Hammami, R. The Genus Enterococcus: Between Probiotic Potential and Safety Concerns—An Update. Front. Microbiol. 2018, 9, 1791. [Google Scholar] [CrossRef] [Scilit] [PubMed]
  57. Redweik, G.A.J.; Jochum, J.; Mellata, M. Live Bacterial Prophylactics in Modern Poultry. Front. Vet. Sci. 2020, 7, 592312. [Google Scholar] [CrossRef] [Scilit] [PubMed]
  58. Xu, H.; Fang, F.; Wu, K.; Song, J.; Li, Y.; Lu, X.; Liu, J.; Zhou, L.; Yu, W.; Yu, F.; et al. Gut Microbiota-Bile Acid Crosstalk Regulates Murine Lipid Metabolism via the Intestinal FXR-FGF19 Axis in Diet-Induced Humanized Dyslipidemia. Microbiome 2023, 11, 262. [Google Scholar] [CrossRef] [Scilit] [PubMed]
  59. Ren, Q.; Cui, C.; Peng, Y.; Zhou, Y.; Zhang, H.; Chen, L.; Liu, Z. Causal Relationship Between Gut Microbiota and Metabolic Syndrome: A Bidirectional Mendelian Randomization Study. Medicine 2025, 104, e42179. [Google Scholar] [CrossRef] [Scilit] [PubMed]
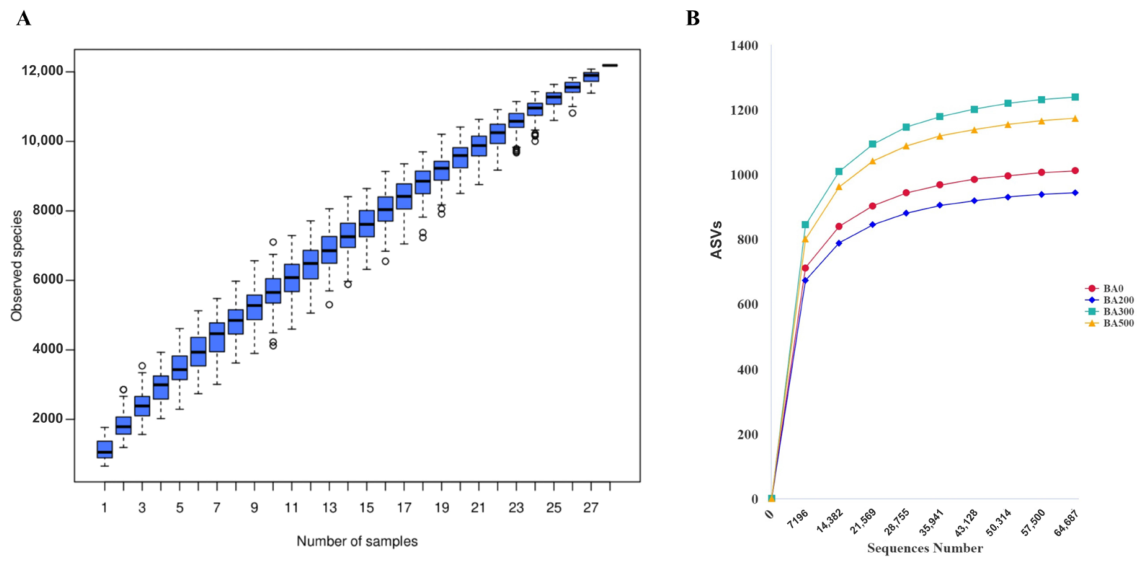
Figure 1. (A) Boxplot of species accumulation. (B) Rarefaction curves of the sequencing data.
Poultry 05 00058 g001
Figure 2. Venn diagram showing the distribution of ASVs among different treatment groups. Different colors represent different treatment groups. Numbers in overlapping regions denote shared ASVs among groups, while those in non-overlapping regions indicate group-specific unique ASVs. The study groups were defined as follows: CON, receiving a basal diet; BA200, receiving a basal diet with an additional 200 mg/kg of bile acids; BA300, receiving a basal diet with an additional 300 mg/kg of bile acids; and BA500, receiving a basal diet with an additional 500 mg/kg of bile acids. n = 7.
Poultry 05 00058 g002
Figure 3. Alpha diversity indices of the cecal microbiota. (A) Chao1 index; (B) Shannon index; (C) Simpson index; (D) Dominance index; (E) Pielou’s evenness; (F) observed ASV richness. The study groups were defined as follows: CON, receiving a basal diet; BA200, receiving a basal diet with an additional 200 mg/kg of bile acids; BA300, receiving a basal diet with an additional 300 mg/kg of bile acids; and BA500, receiving a basal diet with an additional 500 mg/kg of bile acids. n = 7. Means labeled with distinct lowercase letters (a, b, c) indicate significant differences among the four treatments (p < 0.05).
Poultry 05 00058 g003
Figure 4. Beta diversity indices of the cecal microbiota. Heatmap showing pairwise Beta-diversity distances among samples. Warmer colors represent higher similarity, while cooler colors denote increased dissimilarity among microbial communities. CON: basal diet group; BA200: basal diet with 200 mg/kg bile acids; BA300: basal diet with 300 mg/kg bile acids; BA500: basal diet with 500 mg/kg bile acids. n = 7.
Poultry 05 00058 g004
Figure 5. Beta diversity of cecal microbiota analyzed using principal coordinate analysis (PCoA). (A) PCoA using unweighted UniFrac distances; (B) PCoA using weighted UniFrac distances. Each point represents one sample, and samples from the same group are indicated by the same color. The X- and Y-axes display the variation percentages accounted for by each principal coordinate. CON: basal diet group; BA200: basal diet with 200 mg/kg bile acids; BA300: basal diet with 300 mg/kg bile acids; BA500: basal diet with 500 mg/kg bile acids. n = 7.
Poultry 05 00058 g005
Figure 6. Top 10 phyla in cecal microbial composition. (A) Relative abundance of microbial communities at the phylum level. (B) Cluster heatmap displaying microbial abundance categorized by phylum. (C,D) Variation in microbial taxa across different treatment groups. The study groups were defined as follows: CON, receiving a basal diet; BA200, receiving a basal diet with an additional 200 mg/kg of bile acids; BA300, receiving a basal diet with an additional 300 mg/kg of bile acids; and BA500, receiving a basal diet with an additional 500 mg/kg of bile acids. n = 7. Means labeled with distinct lowercase letters (a, b) indicate significant differences among the four treatments (p < 0.05).
Poultry 05 00058 g006
Figure 7. Cecal microbial composition at the genus level (top 10). (A) Relative abundance of microbial communities at the genus level. (B) Cluster heatmap of microbial abundance at the genus level. (C,D) Variation in microbial taxa across different treatment groups. The study groups were defined as follows: CON, receiving a basal diet; BA200, receiving a basal diet with an additional 200 mg/kg of bile acids; BA300, receiving a basal diet with an additional 300 mg/kg of bile acids; and BA500, receiving a basal diet with an additional 500 mg/kg of bile acids. n = 7. Means labeled with distinct lowercase letters (a, b) indicate significant differences among the four treatments (p < 0.05).
Poultry 05 00058 g007
Figure 8. LEfSe analysis of differential microbial taxa in the cecum among treatment groups. Comparison of LDA score of cecal microbiota from the genus level to the species level with significant changes among groups. Wilcoxon rank-sum test difference at p < 0.05 and LDA score (log10) > 3.0 was considered significant. The study groups were defined as follows: CON, receiving a basal diet; BA200, receiving a basal diet with an additional 200 mg/kg of bile acids; BA300, receiving a basal diet with an additional 300 mg/kg of bile acids; and BA500, receiving a basal diet with an additional 500 mg/kg of bile acids. n = 7.
Poultry 05 00058 g008
Table 1. Ingredients and nutrient levels of the basal diet (air-dry basis).
Ingredients, %ContentNutrient Levels 2, %Analyzed
Values
Corn61.00Metabolizable energy (MJ/kg)11.30
Soybean meal20.00Crude protein18.43
Wheat bran6.00Calcium3.54
Soybean oil2.00Total phosphorus0.80
Limestone8.00Non-phytate phosphorus0.54
Sodium chloride0.30Lysine0.71
DL-methionine0.20Methionine0.46
Calcium monophosphate2.00Threonine0.59
Premix 10.50Tryptophan0.18
Total100.00
1 The dietary premix per kilogram includes: 8000 IU of vitamin A, 1600 IU of vitamin D3, 12 IU of vitamin E, 0.5 mg of vitamin K, 2 mg of vitamin B1, 2.5 mg of vitamin B2, 3 mg of vitamin B6, 20 mg of nicotinamide, 15 mg of calcium D-pantothenate, 0.25 mg of folic acid, 8 mg of copper, 60 mg each of iron and manganese, 80 mg of zinc, 0.3 mg of selenium, and 0.35 mg of iodine. 2 Nutrient levels were calculated values.
Table 2. Effects of dietary BAs supplementation on hepatic saturated fatty acid composition (% of total fatty acids).
ItemsTreatments 1SEMp Value
CONBA200BA300BA500ANOVALinearQuadratic
C8:00.030.030.020.040.0030.2690.3760.332
C12:00.010.010.020.010.0010.1350.2040.144
C14:00.320.360.390.320.0120.0880.8020.046
C15:00.040.050.050.040.0020.2750.8450.147
C16:022.7224.1324.9424.360.3130.0700.0380.029
C17:00.070.080.070.070.0020.3610.4450.231
C18:015.02 a13.12 b11.59 b13.14 b0.306<0.0010.007<0.001
C20:00.100.100.080.110.0040.1390.6710.166
C21:00.030.030.020.030.0020.4130.4350.257
C22:00.050.050.040.060.0030.1930.6100.227
C23:00.040.030.030.030.0020.3610.6490.227
C24:00.020.020.020.030.0010.1470.7670.089
Total SFA38.4538.0137.2738.230.2270.2920.5050.248
1 CON: basal diet; BA200: basal diet + 200 mg/kg bile acids; BA300: basal diet + 300 mg/kg bile acids; BA500: basal diet + 500 mg/kg bile acids. n = 6. SEM stands for standard error of the means. Means labeled with distinct lowercase letters indicate significant differences among the four treatments (p < 0.05).
Table 3. Effects of dietary BAs supplementation on hepatic monounsaturated fatty acid composition (% of total fatty acids).
ItemsTreatments 1SEMp Value
CONBA200BA300BA500ANOVALinearQuadratic
C16:12.953.292.702.620.1160.1650.1250.209
C18:1n9c33.51 b33.66 ab34.83 a34.56 ab0.1850.0170.0070.022
C20:10.550.550.560.550.0160.9940.9820.967
Total MUFA37.00 b37.50 ab38.08 a37.72 ab0.1190.0070.0080.004
1 CON: basal diet; BA200: basal diet + 200 mg/kg bile acids; BA300: basal diet + 300 mg/kg bile acids; BA500: basal diet + 500 mg/kg bile acids. n = 6. SEM stands for standard error of the means. Means labeled with distinct lowercase letters indicate significant differences among the four treatments (p < 0.05).
Table 4. Effects of dietary BAs supplementation on hepatic polyunsaturated fatty acid composition (% of total fatty acids).
ItemsTreatments 1SEMp Value
CONBA200BA300BA500ANOVALinearQuadratic
n-3 PUFA
C18:3n30.330.380.380.350.0070.0510.3870.021
C20:5n30.250.250.290.250.0090.1830.7750.460
C22:6n30.510.450.380.470.0280.4410.4500.304
Total n-3 PUFA0.58 b0.63 ab0.67 a0.60 ab0.0110.0240.4300.018
n-6 PUFA
C18:2n6c16.3716.3916.2415.630.1100.0560.0150.016
C18:3n60.090.090.100.090.0040.8250.4540.693
C20:2n61.341.151.031.190.0480.1420.1800.071
C20:3n61.371.361.221.570.0600.2470.4150.246
C20:4n65.075.255.235.330.0650.5770.1960.422
Total n-6 PUFA22.9023.0922.7922.630.1100.5160.2620.391
Total PUFA25.3425.3224.8724.880.1360.4510.1400.342
n-6 PUFA/n-3 PUFA39.78 a36.90 ab34.42 b38.17 ab0.7020.0410.2500.025
1 CON: basal diet; BA200: basal diet + 200 mg/kg bile acids; BA300: basal diet + 300 mg/kg bile acids; BA500: basal diet + 500 mg/kg bile acids. n = 6. SEM stands for standard error of the means. Means labeled with distinct lowercase letters indicate significant differences among the four treatments (p < 0.05).
Table 5. Effects of dietary BAs supplementation on total unsaturated fatty acid composition (% of total fatty acids).
ItemsTreatments 1SEMp Value
CONBA200BA300BA500ANOVALinearQuadratic
UFA62.3462.8262.9562.610.1540.5470.5120.341
PUFA/
UFA
0.620.610.590.610.0040.2120.4310.151
1 CON: basal diet; BA200: basal diet + 200 mg/kg bile acids; BA300: basal diet + 300 mg/kg bile acids; BA500: basal diet + 500 mg/kg bile acids. n = 6. SEM stands for standard error of the means.
Disclaimer/Publisher’s Note: The statements, opinions and data contained in all publications are solely those of the individual author(s) and contributor(s) and not of MDPI and/or the editor(s). MDPI and/or the editor(s) disclaim responsibility for any injury to people or property resulting from any ideas, methods, instructions or products referred to in the content.