Article

A Smart Optimization Model for Reliable Signal Detection in Financial Markets Using ELM and Blockchain Technology

by
Deepak Kumar
*,
Priyanka Pramod Pawar
,
Santosh Reddy Addula
,
Mohan Kumar Meesala
,
Oludotun Oni
,
Qasim Naveed Cheema
and
Anwar Ul Haq
Department of Information Technology, University of the Cumberlands, Williamsburg, KY 40769, USA
*
Author to whom correspondence should be addressed.
FinTech 2025, 4(4), 56; https://doi.org/10.3390/fintech4040056
Submission received: 8 September 2025 / Revised: 18 October 2025 / Accepted: 19 October 2025 / Published: 23 October 2025

Abstract

This study proposes a novel approach to improve the reliability of trading signals for gold market prediction by integrating technical analysis indicators, Moving Averages (MAs), MACD, and Ichimoku Cloud, with a Particle Swarm-Optimized Extreme Learning Machine (PSO-ELM). Traditional time-series models often fail to capture the complex, non-linear dynamics of financial markets, whereas technical indicators combined with machine learning enhance predictive accuracy. Using daily gold prices from January–October 2020, the PSO-ELM model demonstrated superior performance in filtering false signals, achieving high precision, recall, and overall accuracy. The results highlight the effectiveness of combining technical analysis with machine learning for robust signal validation, providing a practical framework for traders and investors. While focused on gold, this methodology can be extended to other financial assets and market conditions. The integration of machine learning and blockchain enhances both predictive reliability and operational trust, offering traders, investors, and institutions a robust framework for decision support in dynamic financial environments.

1. Introduction

Background: A new era has begun on the stock market, the epicenter of global finance, thanks to the rise in artificial intelligence. For a long time, individual investors just had their gut, market patterns, fundamental and technical analysis, and intuition to guide their decisions [1]. But a new dimension has emerged with the advent of AI-driven technologies, giving investors access to powerful analytics, ML, and predictive modeling capabilities. Given this context, we may investigate how these technology interventions affect individual investors’ returns by changing the ways they approach capital gains and the tactics they employ [2].
Artificial intelligence’s ability to rapidly process massive information, detect nuanced patterns, and execute complicated algorithms has accelerated its integration into financial decision-making [3]. Specifically, machine learning algorithms have proven they can react to changing market conditions and learn from past data, giving ordinary investors a degree of complexity that was not there before. A critical evaluation of AI’s effects on the decision-making dynamics of individual investors and their pursuit of financial gains is warranted in light of its growing integration into investment processes [4,5].
Motivation: A number of applications in the financial sector have made extensive use of AI in recent years, including for intelligent investment advisory, intelligent customer service, intelligent credit scoring, and risk management, among many others [6]. A number of government agencies, including central banks, are investigating how artificial intelligence (AI) might improve economic tracking, analysis, and prediction. In recent years, “analytical” AI has given way to “generative” AI [7]. With the use of machine learning procedures, analytical AI determines the conditional probability distribution of data based on the current dataset for the purpose of the model’s evaluation, prediction, and analysis. This type of AI finds widespread application in areas such as data analysis, advertising recommendation, and auxiliary decisions. Analytical AI, on the other hand, cannot create “out of nothing” and can only deal with particular jobs according to specific rules; it is hence sometimes known as “narrow AI” or “weak AI” [8].
The banking sector is well-suited to AI. Analytical and generative AI rely on data as their primary input, and training datasets are inseparable from data [9]. There is a high level of digitization in the financial sector. Due to the large amounts of user and transaction data generated by everyday company operations, it presents an ideal setting for use. Improvements and innovations in financial business are often facilitated by financial firms’ usage of AI technology [10]. Eighty percent of US banks have already integrated AI into their financial business or want to do so in the near future, according to a Business Insider poll [11,12]. There will be a USD 130 billion market for AI financial services worldwide by 2027.
Literature Gap: Despite the widespread use of time-series models such as ARIMA, VAR, and exponential smoothing in financial forecasting, these techniques face significant limitations in dynamic and volatile market environments. Their core assumptions, linearity and stationarity often do not hold in real-world financial data, which is inherently non-linear, high-dimensional, and influenced by numerous external factors. As a result, these models struggle to accurately capture the complex behavior of asset prices, particularly under non-stationary conditions [11]. Moreover, they typically do not incorporate technical analysis indicators or account for contextual market variables that drive investor behavior. In contrast, machine learning methods—especially those enhanced with optimization techniques, like Particle Swarm-Optimized Extreme Learning Machines (PSO-ELMs)—are better suited for modeling such complex dynamics [12]. However, most existing studies emphasize asset price forecasting or apply AI in isolation, without integrating domain-specific trading practices. This reveals a methodological gap: while AI offers strong predictive power. Traditional technical indicators provide market-relevant insights but are often prone to generating false or lagging signals.
Research Question:
How can the reliability of trading signals in the gold market be improved using technical analysis indicators and machine learning techniques?
This question is highly relevant, as inaccurate trading signals from widely used technical indicators often lead to substantial financial losses for both retail and institutional investors. By systematically validating signals with a Particle Swarm-Optimized Extreme Learning Machine (PSO-ELM) and incorporating blockchain-based authentication for secure dissemination, the study addresses a critical gap in current financial forecasting research. The methodology is justified because technical analysis indicators—such as MACD, Moving Averages, and Ichimoku Cloud—effectively capture market trends, patterns, and investor sentiment, while machine learning provides a robust, data-driven framework capable of handling non-linearities and high-dimensional feature spaces. This integrated approach ensures that trading signals are not only statistically accurate but also practically actionable, offering enhanced reliability for real-world investment decisions.
Scope of the Study: Although technical indicators are widely applied across the broader precious metals market, the present study focuses specifically on the gold market. Gold was selected as the subject of analysis for three reasons: (1) it is the most liquid and actively traded precious metal, (2) it plays a dual role as both a safe-haven asset and a speculative instrument, making it highly sensitive to technical-trading signals, and (3) sufficient high-frequency data were available to support rigorous signal-validation experiments. The reference to the broader precious metals market in earlier drafts of this work reflects the general applicability of Moving Averages (MAs), Moving Average Convergence Divergence (MACD), and the Ichimoku Cloud indicators; however, the empirical results and conclusions reported here pertain specifically to gold. Future extensions may apply the same methodology to silver, platinum, or palladium, but that lies beyond the current scope.
Research Objectives: Understanding the complex interplay between AI and the success of individual investors in making a profit is the fundamental motivation for this study. Here are the precise goals that the study is trying to accomplish:
1. AI Utilization Quantitative Analysis: Find out how much individual investors use AI-driven tools for investing [13]. This requires looking through trading data for trends, patterns, and how often AI is used to make decisions.
2. AI-Driven Decisions and Investment Performance: Look into how using AI to make investment decisions relates to the results in terms of performance [14,15]. Part of this process is figuring out whether AI-powered approaches lead to better investment returns and higher capital gains.
3. Investigate Investor Experiences Qualitatively: Look at the subjective parts of how individual investors have used AI products. As part of this process, it is important to comprehend the behavioral and psychological aspects, difficulties encountered, and the anticipated influence of AI on decision-making procedures [16].
Study Contribution: Given AI’s potential to transform the financial environment, comprehending its impact on individual investors is crucial. With the increasing availability of AI to retail investors, this study’s findings can educate regulatory agencies, financial institutions, and individual investors on the potential advantages, disadvantages, and risks of incorporating AI into investment strategies. The results contribute to the ongoing discussion regarding the evolving role of individual investors in markets increasingly shaped by artificial intelligence, as well as the growing accessibility of advanced financial technologies. Finally, this study’s main contribution is the use of ELM-based metaheuristics for signal prediction in the global gold market based on technical analysis indicators. False signals from indicators might cause investors to lose a lot of money. Investors in the gold market throughout the world stand to gain a lot from this technique because it increases the reliability of signals. Put simply, this strategy can help people make informed decisions and make money in this market. Actually, this approach has the potential to both protect investors’ capital and increase their earnings. The algorithm’s pinpoint accuracy makes it useful for telling traders when to buy and sell in the market.
Positioning: This research positions itself at the intersection of technical analysis, AI-driven modeling, and blockchain-enhanced operational trust. While prior studies have improved prediction accuracy using hybrid models, few have directly targeted the reliability of trading signals in the precious metals market. The methodology is applied specifically to gold, a highly liquid asset with dual speculative and safe-haven characteristics, making it an ideal candidate for high-frequency signal analysis. This approach not only offers methodological advancements but also practical value—helping investors reduce whipsaw losses, enhance discipline in decision-making, and gain actionable insights into volatile market conditions. The study’s findings hold relevance for both academic researchers and financial practitioners navigating increasingly data-driven and technology-integrated markets.
The remainder of this paper is organized as follows. Section 2 reviews the relevant literature. Section 3 presents the proposed prediction model. Section 4 reports and discusses the experimental results. Section 5 outlines the managerial implications and practical applications of the findings.

2. Related Works

By simplifying and improving upon existing AI representations, such as hybrid convolutional neural networks (CNNs), Khattak et al. [17] have increased AI model profitability and performance. To improve the breadth and precision of estimates, this study introduces Fibonacci TI, shows how it affects financial prediction, and incorporates a multi-classification method that centers on trend strength. Finally, the profitability analysis reveals the concrete advantages of using multi-classification and Fibonacci indicators. The research approach used to conduct profitability analysis is built on a six-stage predictive system. The authors reported that incorporating Fibonacci retracement levels enhanced the profitability of trading models in approximately 68% of tested parameter configurations, and improved performance metrics in 44% of cases. Among hybrid CNN-LSTM architectures, the variant achieved the greatest performance gains. Their evaluation employed both binary classification accuracy and a trend-strength index with reported values of 0.0023 and 0.0020–0.0099, respectively. These findings suggest that Fibonacci indicators can contribute additional predictive power when combined with deep learning approaches in financial forecasting. Results in CLSTM and CLSTM mod demonstrated that hybrid CNNs performed better and were more profitable. Interestingly, both the average ROI for long–short strategies and the ROI improvement from trend-strength prediction were 6.89%, though these results arise from different evaluation criteria. When deciding between hybrid CNNs, the C-LSTM model offers the best performance and profitability for six-class trend-strength prediction.
With an eye on the Indonesian capital market, Fauzan and Barrelvi [18] set out to study how blockchain technology affects market transparency and security. Secondary data analysis from a number of prominent Indonesia Stock Exchange-listed corporations is utilized as the research approach. Financial data openness, transaction security, and investor trust are some of the metrics utilized. The impact of technology on Indonesia’s capital market, in particular, can be better understood thanks to this research. Additionally, this analysis gives authorities and market players in Indonesia’s capital market good reason to think about using blockchain technology to make the market more transparent, secure, and investor-friendly.
Li et al. [19] investigated security flaws in financial network transactions, focusing on the difficulties of using blockchain technology (BCT) on mobile terminals. As a first step, they explained what supply chain finance (SCF) is and what it does. Then, they used BCT and EC to build a theoretical framework that will help us reduce the risks associated with financial network transactions. Secondly, a data synchronization system that relies on BCT and EC was suggested, as is a protocol for storing financial network transaction data. Improved financial network transaction security is expected to be a significant outcome of these two approaches. The use of EC and BCT for risk management in SCF-based financial network transactions is also demonstrated. At last, the experimental design verifies that the protocol and system are practical and functional. According to the trial results, there is absolutely no latency in the system, as the round-trip time for the workflow is less than 215 ms. Surprisingly, the time overhead of encrypting and transferring information is significantly reduced when an anonymous storage protocol is used to store data. Additionally, it has advanced security features that make it resistant to external attacks, attacks on electronic devices, attacks on the middleman, and replay attacks. The SCF area of transactions benefits greatly from both the ideas and methodology presented in this work.
In order to reduce the likelihood of fraudulent activity by users with low credit scores, Tong et al. [20] suggested a machine learning-based financial risk control system. They constructed a fusion model utilizing LightGBM in addition to XGBoost to examine user copying, payment, and repayment data spanning 18 months in order to forecast the likelihood of loan default. The proposed PSO-ELM achieved strong performance on the test dataset, with an AUC of 96.8% and an F1-score of 94.7%, indicating robust discrimination and balance between precision and recall. The overall composite score was 79.9%. By revealing which users have poor credit, blockchain regulators may better safeguard the system’s financial integrity and stop the abuse of digital currencies.
Verifying the financial strategic option in an uncertain situation was the goal of Zhao et al. [21], who constructed a game model. They explore the financial supply chain’s strategic choice of blockchain service and extract the equilibrium outcomes. In addition, they analyze the transmission of risk in the supply chain, product quantity, financing interest rate, and product pricing. In particular, basic enterprise-led supply chain financial models rely on firm reputation when blockchain is not taken into account. In the event of fraud or an increase in consideration payment, both the retail and wholesale prices will rise. In addition, price performance is negatively impacted by market stability. When deciding between two models in a blockchain environment, there are two possible outcomes: one is that the third-party service model will be the equilibrium plan if you are going with the core and the other is that the perfect platform will be the equilibrium strategy if you are going with the third-party platform.
Research on financial forecasting generally falls into two streams. One emphasizes AI and machine learning, which capture complex patterns but often overlook domain-specific trading practices. The other focuses on technical analysis indicators such as moving averages, MACD, and Ichimoku, which are widely used but prone to false or lagging signals. Attempts to filter noise or combine multiple indicators show some improvements, yet their effectiveness varies across markets and conditions.
This contrast reveals a gap: AI methods provide predictive power without practical grounding, while traditional indicators provide practical grounding without consistent predictive strength. Our study addresses this gap by combining indicator-derived features with optimization-driven machine learning, aiming to improve both reliability and relevance of trading signals.
Our framework extends this literature by reframing technical indicators (MACD, MA, Ichimoku) in the signal-validation domain, rather than direct price prediction. Unlike [22] who focused on overbought/oversold detection, we explicitly classify signals as valid or false using a PSO-ELM model. While [23] and [24] improved MACD via hybrid optimization, our contribution lies in classifying signal reliability, enhanced by blockchain-enabled signal integrity. Similarly, whereas [25] evaluated Ichimoku’s performance in energy stocks, we assess its integration within a machine-learning validation framework in the context of gold. The approach of [26] to filter false signals aligns closely with our methodological orientation, but we extend this by adding secure dissemination via blockchain technology.
Despite extensive applications of machine learning in financial prediction, most existing research emphasizes forecasting asset prices or returns rather than validating the reliability of trading signals generated by technical indicators. In particular, little attention has been paid to the prevalence of false signals in the precious metals market, even though such signals frequently lead to investor losses and undermine trading strategies.
In this study, we address this gap by reformulating the task as a signal-validation problem for gold trading: given technical-indicator outputs (MACD, MA, Ichimoku), the objective is to classify each signal as valid or false according to whether subsequent price movements exceed a 20-pip threshold. To achieve this, we develop a Particle Swarm-Optimized Extreme Learning Machine (PSO-ELM) that refines model parameters for robust generalization.
Beyond methodological innovation, we also incorporate a blockchain-based trust layer to ensure secure and reliable dissemination of validated trading signals, addressing a key barrier to real-world adoption of AI-driven decision tools in financial markets.
This work therefore contributes in four ways: (1) formalizing indicator reliability as a predictive classification task in the gold market, (2) introducing an optimized PSO-ELM model to improve accuracy, (3) integrating a blockchain framework to enhance operational trust and data integrity, and (4) empirically demonstrating significant improvements over benchmark models with up to 98% accuracy and precision.
By filtering false signals, the proposed framework reduces whipsaw losses, improves decision-making discipline, and advances both academic understanding and practical deployment of AI-enhanced trading systems in precious metals.

Problem Description

Academics and experts in the financial markets are always interested in price forecasting, which has resulted in the development of many strategies to enhance forecasting. Time-series regressions are one of the methods that have been published in the literature for predicting future price changes. But because there is so much unknown when trying to forecast the financial markets, these methods fail miserably in practice. One of the most popular methods employed by analysts is technical analysis, which relies on indicators. Indicators take data from publicly available price and time charts to determine when it is a good time to sell, run it through certain mathematical algorithms, and then display the results. These signals have the potential to quickly generate substantial gains for investors. Having said that, there is a good chance these signals are wrong; hence, we should expect a price drop after the indicator tells us to buy or sell. The unpredictability of these indications causes investors to incur massive losses. Instead of relying on indicators that are prone to inaccuracies, time-series regressions that necessitate fundamental analysis of other markets, which requires specialized knowledge, the article suggests a new hybrid approach to prediction of financial market profits.
The suggested method enhances the functionality of indicators used in technical analysis by means of an integrated DL strategy. The findings will inform a ten-month analysis of the gold market, beginning in the first half of 2020. It is the product of several analyses of indicators or the outcome of multiple analyses of an indicator. The total number of records collected is 26,638. Every one of these indicators gives us a slightly different indication. Consequently, there are various techniques to analyze our features and dataset. These indicators yielded a grand total of 112 characteristics. Using these characteristics, we were able to categorize signals and distinguish between legitimate and fraudulent ones. A portion of the data, including the signal validity labels (target variable), was saved. In this study, the target variable is defined as a binary outcome: a signal is labeled valid (1) if the subsequent gold price movement exceeded 20 pips in the predicted direction, and false (0) otherwise.
Thus, the prediction task is a binary classification problem where the model outputs 1 for a valid signal and 0 for a false signal.

3. Proposed Methodology

In this section, stock market predictions are carried out by identifying the technical indicators using deep learning model; Figure 1 provides the workflow of the planned strategy.

3.1. Data Description

The dataset used in this study consists of daily closing prices for gold, obtained from publicly available financial market feeds for the period of January to October 2020. The data was selected to capture both stable and volatile market conditions, particularly during the early stages of the COVID-19 pandemic, which is reflected in the fluctuations in gold prices during this period. The dataset includes 26,638 records of trading signals derived from the technical indicators MACD, Moving Averages, and Ichimoku, with each signal labeled as valid or false based on subsequent price movements exceeding a 20-pip threshold.
To provide a clearer understanding of the dataset and the selected features, the dataset comprises [N] observations of trading signals generated from MACD, Moving Average, and Ichimoku indicators over a ten-month period in the gold market. Each observation was labeled as a valid signal if the subsequent price movement exceeded 20 pips in the predicted direction, and as a false signal otherwise.
The continuous input variables (e.g., MACD histogram, fast/slow MA, Ichimoku spans) display moderate variation, with standard deviations reflecting meaningful dispersion in market conditions. The target distribution indicates that approximately [X%] of signals are valid and [Y%] are false, highlighting the importance of designing a robust classification model to filter out unreliable trading triggers.
These descriptive results establish the statistical characteristics of the dataset and provide a foundation for the empirical modeling presented in the subsequent sections.
Indicators such as MACD, Ichimoku, and MA were analyzed and combined to provide the data used in the study [27]. We have examined them in various methods using various indicators. The dataset utilized in this investigation comprises the outcomes, which are signals. Our analysis produced a total of 72 features, including measures derived from MACD, Moving Averages, and Ichimoku indicators. These features served as the input variables for the PSO-ELM classification model. Distinct data types exhibit different patterns. We tracked the global gold price changes for 10 months and used these features to analyze them. A total of 26,638 records were obtained once the data was cleaned.
We constructed our dataset using publicly available spot gold price data obtained from global financial market feeds. The collection period covered a continuous 10-month window (January–October 2020), which was selected to capture both stable and volatile price movements during the early stages of the COVID-19 pandemic.
The raw dataset initially consisted of 26,638 signal entries extracted from the daily gold price series. After expanding these signals through feature engineering (binary and ternary encodings of indicator states, inclusion of continuous moving average values, and pivot-based measures), the cleaned and finalized dataset contained 26,638 records. This is the version used in all modeling experiments reported in this study.
From this dataset, we engineered 112 technical indicator-derived features (X1–X112). These features represent systematic transformations of three widely used indicators:
Ichimoku Cloud: Variables capture the relative positions of Tenkan-sen, Kijun-sen, Senkou Span A/B, and Chikou Span. Examples include cloud “mood” (bullish = 1, bearish = 0), position of Kijun-sen relative to the cloud (1 = above, 0 = on a line, −1 = below), and crossover events (1 = present, 0 = absent).
Moving Averages (MAs) and MACD: Features include Exponential Moving Averages (e.g., EMA (9), EMA (21)), MACD line values, and signal crossovers. These were treated as continuous inputs or binary encodings of crossover events.
Classical Pivot Analysis: Derived features encode pivot price levels and relative extremes (e.g., whether the current candle is the highest, lowest, or neutral within a rolling window of size 9, 27, or 47).
All features were validated against industry-standard indicator formulas to ensure correctness. The target variable was defined using a 20-pip movement threshold: if the gold price moved ≥20 pips in the forecasted direction after the signal, the event was marked as a successful signal (1); otherwise, it was marked as a false signal (0).
Table 1 provides a summary of the descriptive statistics for the key technical indicators used in the study, including MACD Histogram, Fast- and Slow-Moving Averages (EMA9 and EMA21), and the Ichimoku indicators (Tenkan-sen, Kijun-sen, Span A, and Span B). The mean values offer an average representation of each indicator’s behavior over the dataset, while the standard deviation reflects the variability or spread of the indicator values, indicating how much the data fluctuates. The minimum and maximum values show the range of observations, providing insight into the lowest and highest points reached by each indicator. Additionally, Table 1 presents the percentage of valid and false signals, which highlights the effectiveness and reliability of each indicator in generating accurate trading signals. These statistics offer a comprehensive overview of the dataset’s characteristics, helping readers better understand the underlying data used in the model and the reliability of the signals produced by the indicators.

Rationale for Indicator Selection

In this study, we employed MACD, Moving Averages (MAs), and Ichimoku indicators as the primary sources of trading signals in the gold market. These indicators were selected for three reasons.
(1) Widespread practitioner adoption. MACD and Moving Averages remain among the most widely used momentum and trend-following tools in professional trading systems. Ichimoku, although less common in Western markets, is highly popular in Asian financial markets and offers a holistic view by combining multiple elements (trend, momentum, and support/resistance) into a single framework. Including these three indicators ensures the study reflects tools that investors actively rely on in practice.
(2) Complementary perspectives. Each indicator captures a different dimension of market dynamics: MACD identifies momentum shifts via convergence/divergence of Moving Averages, MA captures underlying trend direction over various horizons, and Ichimoku integrates both short- and long-term perspectives through its multi-line structure. This complementarity allows a richer feature space than relying on a single class of indicators.
(3) Suitability for the gold market. Prior empirical work suggests that trend-following indicators, particularly Moving Averages and MACD, can generate informative signals in commodities and precious metals, where extended price trends are common. Ichimoku adds further robustness by identifying equilibrium and breakout conditions, which are frequent in gold trading due to its dual role as a safe-haven asset and speculative vehicle.
Other popular indicators, such as RSI, Bollinger Bands, or the Stochastic Oscillator, were considered. However, they largely focus on overbought/oversold conditions or volatility bands, which are less aligned with the study’s emphasis on signal validation of directional trading triggers. To maintain focus and avoid redundancy in feature space, we restricted our analysis to MACD, MA, and Ichimoku. Future work may extend the framework to include additional oscillators and volatility-based measures for comparative evaluation.
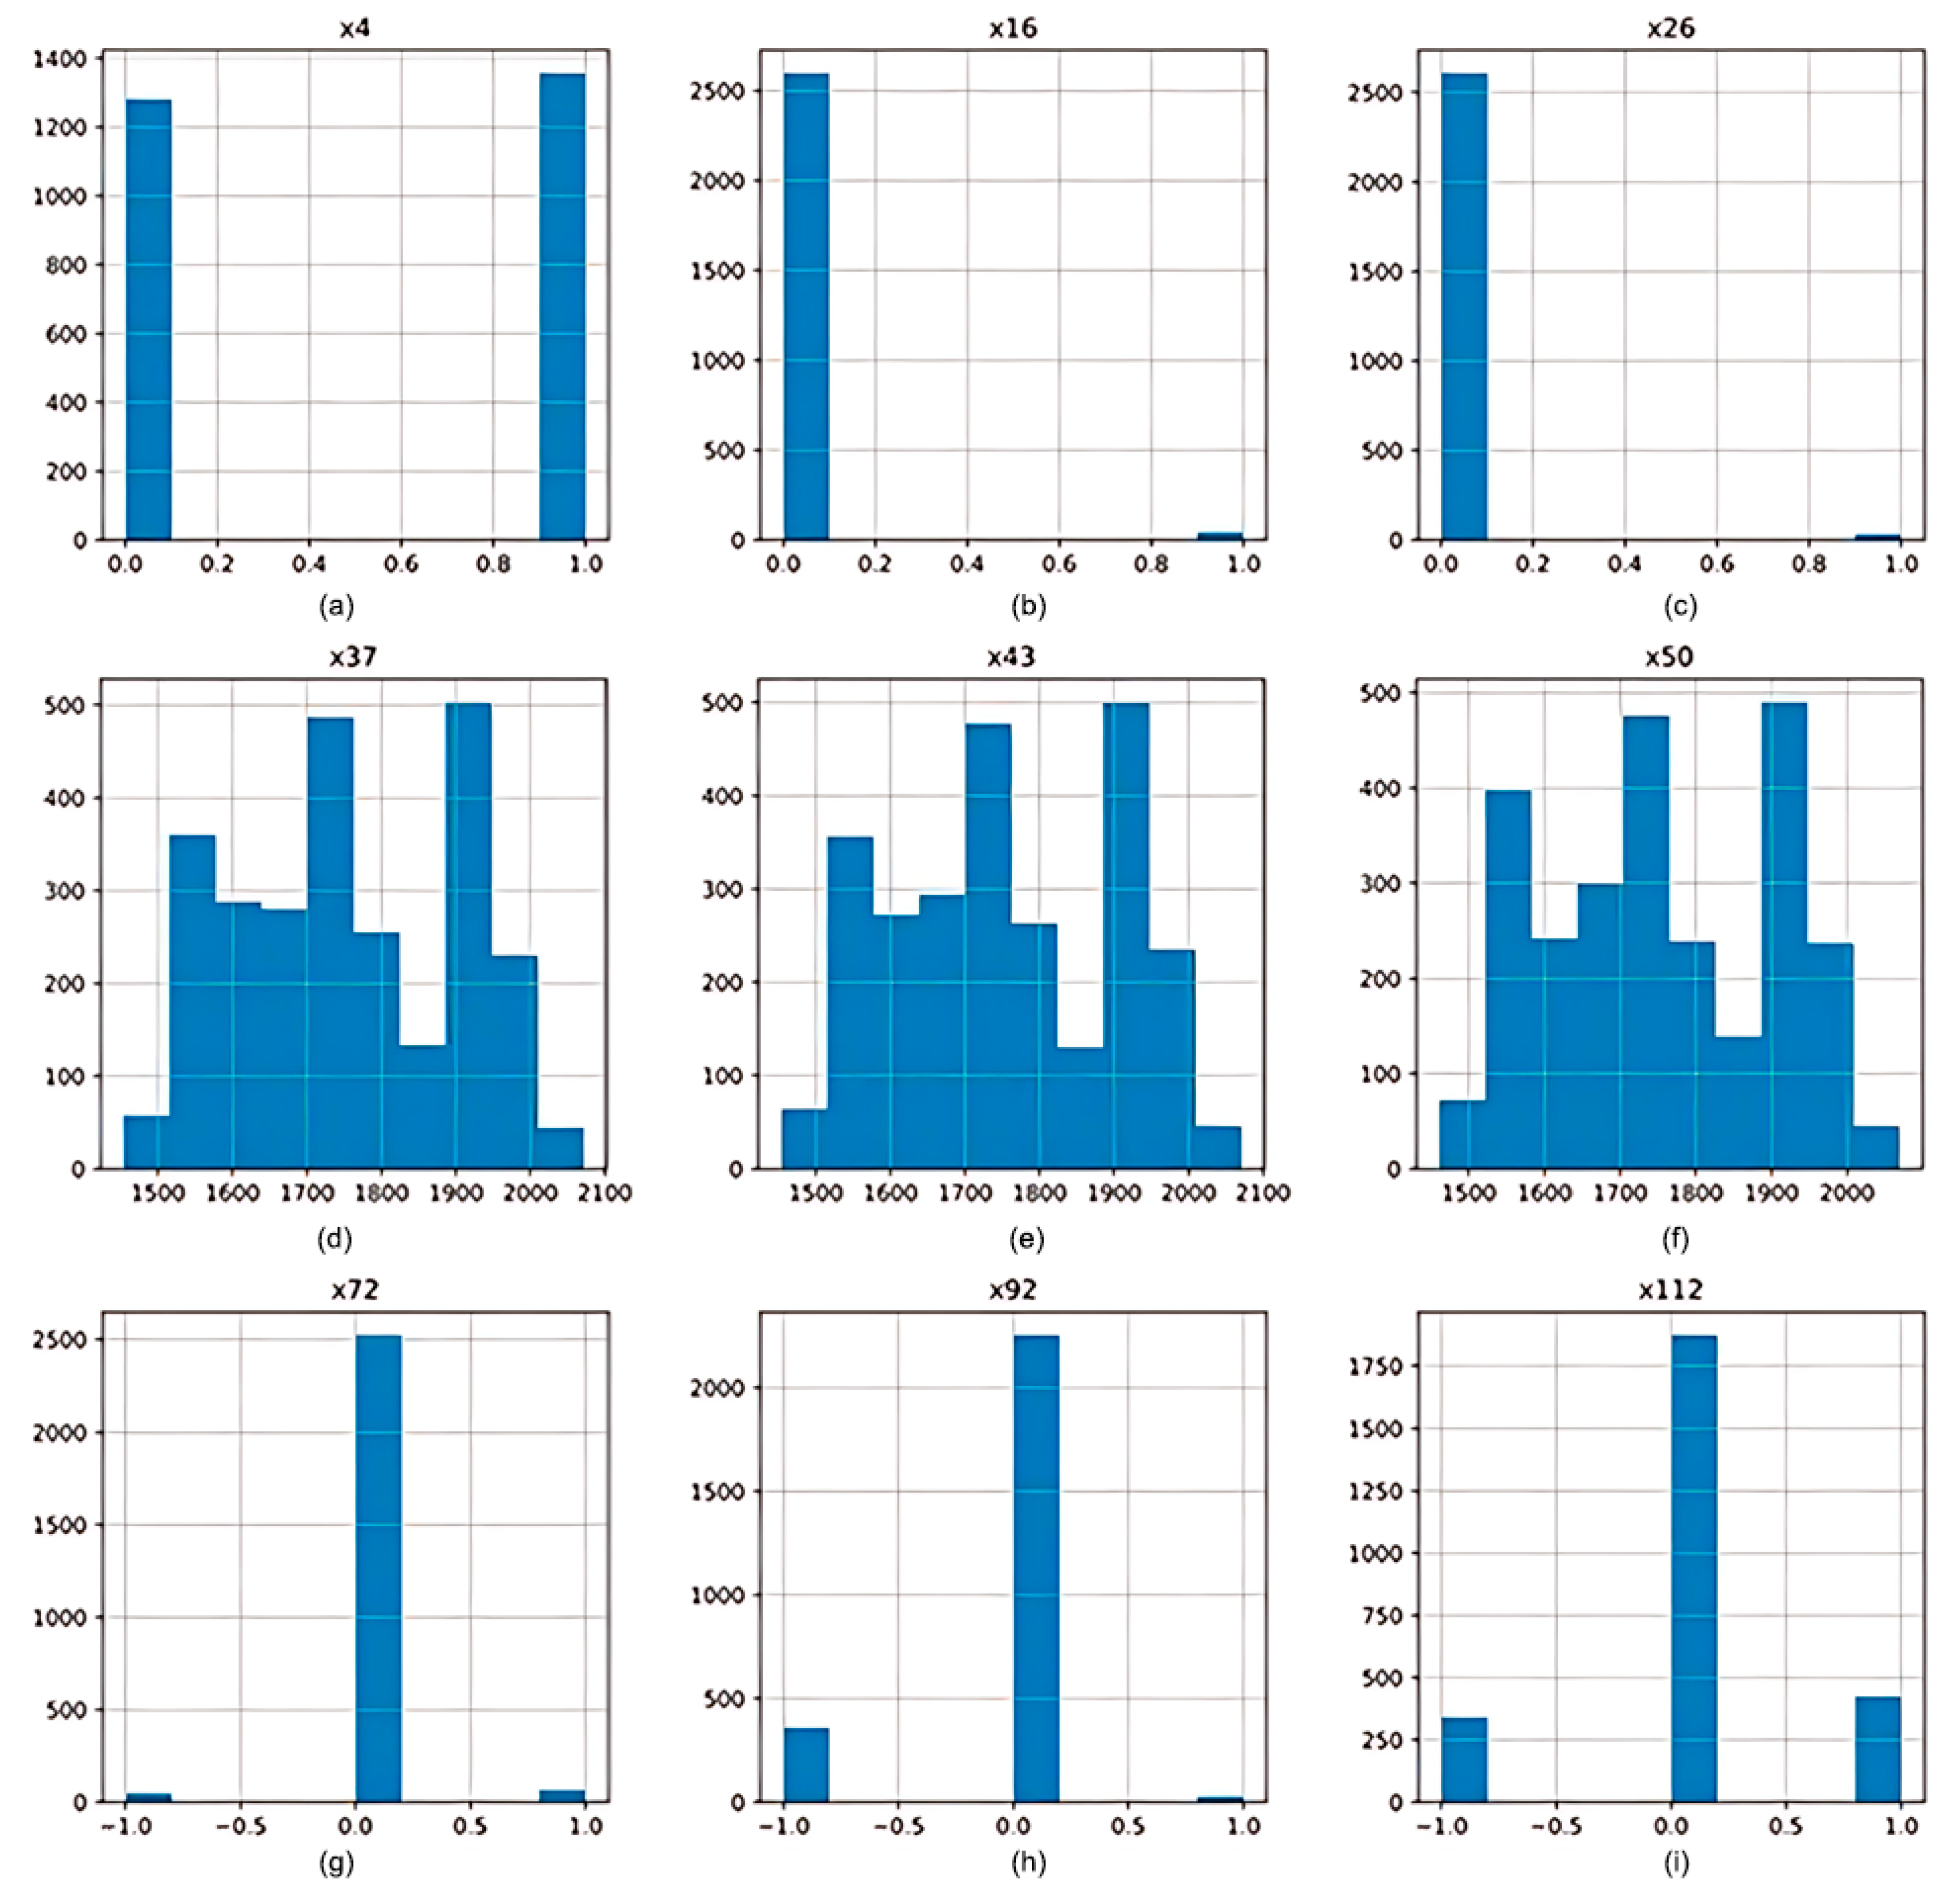
Using these traits to distinguish between valid and false signals was the primary goal of this study, which aimed to forecast financial market prices. If the price moves more than 20 pips in either direction during a signal, and our goal variable takes on the value 1, then we may say that the signal was successful. In all other cases, it is considered a false signal and takes the value 0. The histogram of a few of these variables can be shown in Figure 2.
Here we can see a x4 histogram displaying some Ichimoku data. This variable shows the mood of the Ichimoku Cloud at the time of the cross: bullish or bearish. A bullish indicator would be 1 and a bearish indicator would be 0. Whether the candle is pointing upwards or downwards during the cross is indicated by the variable x16. If the TK is beside the KJ crossing, then x26 would be 1, and if it is not, then it would be 0.
The pivot price is denoted by x37. To find the market’s overall trend over various time frames, traders utilize technical analysis and computations, which include pivot points. On each trading day, this index displays the average high, low, and closing prices. The histogram labelled x43 is in line with the Exponential Moving Average (EMA9), which determines the average price for the nine candles preceding this one. The past 47 candles are shown by x50 as a pivot.
According to x72, the nine candles prior to this one have shown the lowest and highest prices. Otherwise, it would be set to 0. If our highest price was 1, our lowest price would be −1, and all other prices would be 0. The thinning procedure is shown by x92. There are three possible states when crossover happens. A line can be either ascending or descending; the former gives the value 1, while the latter gives the value −1 and is set to 0 in other cases. The location of KJ and the cloud can be seen in x112. The number will be 1 if KJ is located above the cloud, 0 if it is on one of the cloud lines, and −1 if it is below the cloud.

3.2. Data Preprocessing

Data preprocessing is necessary for ML projects to be executed. This includes tasks such as data cleansing, training, testing split, normalization, feature selection, and more. We started by making sure the data we were working with did not have any missing values; thankfully, they did not. The decision was then made to train using 80% of the data and test using 20%. We also normalized the data because machine learning algorithms are picky about the magnitude of features.

3.3. Analysis of Indicators

Following is an explanation of the three indicators—MACD, Ichimoku, and MA—that are part of our technique.

3.3.1. Moving Average Convergence Divergence

If you are a trader looking to spot trends or pivot points in the market, MACD is a straightforward and powerful indicator to have on your side. The MACD is able to determine the difference between the 26-period MA and the 12-period MA [23]. Extra points are given more weight by an Exponential Moving Average (EMA) compared to a Moving Average (MA). Multiple interpretations of MACD exist. The most prevalent methods of interpretation include intersections, divergences, and sudden prices. As MAs converge, cross, or diverge, the MACD goes above and below the zero line. Technical indications are generated when the MACD moves above or below its signal line. Market participants can construct their own signals by utilizing signal lines, centerline intersections, and divergences. As a result, traders typically buy equities when the MACD rises over its signal line and sell them (or shorten their positions) when the MACD falls below it. Formula (1) determines the MACD.
M A C D i n = i = 1 n E M A k i i = 1 n E M A d ( i )
Equation (1) shows that the 12th and 26th Exponential Moving Averages (EMAs), respectively, are generated using the financial asset’s historical quote data. To rephrase, the MACD line is formed by deducting EMA 26 from EMA 12. Equation (2) also displays EMA.
E M A n i = 2 1 + n × p i + 1 2 1 + n × E M A n ( i 1 )
In Equation (2), n denotes the number of periods considered in the calculation of the Exponential Moving Average (EMA). This parameter determines the degree of smoothing, with larger values of n producing a smoother average by incorporating more historical data, and smaller values of n making the EMA more responsive to recent price changes.

3.3.2. Moving Average

Technical analysis also frequently makes use of MAs. Financial market investors use this tactic. Prices are expected to rise when the Short-Term Moving Average (MA_short) crosses above the Long-Term Moving Average (MA_long), forming a bullish crossover. Conversely, when MA_short crosses below MA_long, this produces a bearish crossover, often interpreted as a signal of declining prices. These crossovers occur because the Short-Term MA reacts more quickly to recent price changes, while the Long-Term MA smooths broader trends. Bearish crossings happen when shorter Moving Averages cross over longer ones. The trader sees a bullish crossover as a buy signal since it suggests that stock prices will go up soon. It is wise to sell the investment if a bearish intersection occurs, as it suggests that stock prices will decrease in the following days. In order to uncover patterns and trends over n time periods, a simple MA is shown in Equation (3). Put simply, this equation demonstrates that the MA of a specific day is equal to the regular price for the past n days, and n characterizes the sum of time periods. p n +   p n 1   +     +   p 1 indicates the stock price on a preceding n day.
M A n = p 1 + p 2 + + p n n

3.3.3. Ichimoku

The Ichimoku method, created by Goichi Hosoda in 1968, is a simplified version of a balance sheet. The five lines and five elements make up the majority of Ichimoku [24]. Among these components are the Senkou Span B and Span A Tenkan-sen waves. The Kumo model, which is a cloud-based one, can be used to calculate these five elements by analyzing similar past high, and low prices [28]. Investor sentiment is shown by the cloud’s two distinct colors, which fill the space between the Senkou Span A and B apertures. When the closing price is above the Ichimoku Cloud, it indicates a potential bullish trend. When the current closing price falls inside an Ichimoku Cloud, it means that the market is stabilizing. When the market price closes below the Ichimoku Cloud, it designates that the market is in a decline. In many ways, the traditional MAs and Ichimoku elements are interchangeable. In this case, Senkou Span A and Senkou Span B are positioned very close to one another, resulting in a thin Ichimoku Cloud. A narrow cloud suggests weaker support/resistance levels and indicates that the prevailing trend may lack strength or be vulnerable to reversal. One may compare MAs. Whether a trend is likely to occur or not, the Chikou Span will show it. Keep in mind that 26 cycles of forward or backward shifts are necessary to change the A and B openings of Chikou and Senkou. A total of twenty-five periods will pass until the move takes place. Equations (4)–(8) illustrate the five components of Ichimoku with parameter settings of 9, 26, and 52. p H ( t ) , p L ( t ) , and p c ( t ) are the period t, correspondingly.
Equation (4) pertains to the Tenkan-sen (TK) and displays the average of the highest and lowest values from the last nine periods.
T K t = m a x p H ( t ) + m i n p L ( t ) 2 , t 8 T t
Regarding the Kijun-sen (KJ), the middle charge of the uppermost period for the last 26 periods is shown in Equation (5).
K J t = m a x p H ( t ) + m i n p L ( t ) 2 , t 25 T t
The price is time-shifted backwards, including the current period, as shown in Equation (6), which relates to Chikou Span (CK).
C K t 25 = p c ( t )
Equation (7), which analyzes the middle charge of the present Tenkan-sen, involves time-shifting ahead (into the future) for 26 periods. This is performed in relation to Senkou Span A (SKA).
S K A t = T K t 25 + K J ( t 25 ) 2
The current period is included in Equation (8), Senkou Span B (SKB). and evaluates the middle charge of the highest period the past 52 periods and future 26 periods.
S K B t = M a x p H ( t ) + m a x p l ( t ) 2 , t 76 T t 25

3.4. Classification: PSO-ELM

The PSO-ELM is an algorithmic framework that builds on the PSO algorithm. In order to attain high accuracy in the PSO-ELM, the standards of the input weights and hidden layer biases are updated by altering the parameters of the PSO. A set of featured samples is thought of as N X j ,   t j , where X j =   [ x j 1 ,   x j 12 ,   ,   x j n ] T R n 1 , and t j =   t j 1 ,   t j 2 ,   ,   t j m T R m . X j = the input, which is the removed MFCC topographies, and t j = the predictable value.
Step 1: Arbitrarily reset the particle swarm (P). The particle swarm (P) is initialized arbitrarily, with each particle representing a candidate solution. The input weights and hidden-layer biases of the ELM are assigned initial values drawn from a uniform distribution in the range [0, 1]. These parameters are then iteratively updated using the PSO optimization process, where P   =   { p 1 ,   p 2 ,   ,   p z } and z refer to the populace size.
The shape of the i-th particle is represented as:
p i = { w 11 , w 12 , , w 1 n , w 211 , w 222 , , w 2 n , w L 1 , w L 2 , , w L n , b 1 , , b L } . The i-th particle velocity shape is denoted as V i = { v i 1 , v i 2 , , v i D } , where D = ( 1 + n ) × L . In addition, the velocity of assortment is [ V m a x , V m a x ] .
The parameter kmax represents the maximum number of iterations in the PSO optimization process, which controls how many times the particle positions and velocities are updated before termination.
w i j [   1 ,   1 ] refers to the set of weight values associated with the connections between the input layer and the i-th hidden neuron in the ELM model. Each input feature has a corresponding weight for that neuron, which determines the strength of its influence on the neuron’s activation.
b i [ 0 ,   1 ] characterizes the neuron.
n mentions the neurons.
L denotes the neurons.
( 1   +   n ) × L symbolizes the measurement of the particle, the limits of which need optimizing.
Step 2: Divide the subsets.
Set the layer as L and choice the suitable ELM function g ( x ) [24].
f P = j N k L β k g w k x j + b k t j 2 2 N
where β is the output masses matrix, t j is the true charge, and N is the total number of training samples.
β = H T
H = g ( w 1 . X 1 + b 1 ) g ( w L . X 1 + b L ) g ( w 1 . X N + b 1 ) g ( w L . X N + b L ) N × L
β = β 1 T β L T L × m a n d   T = t 1 T t N T N × m
The hidden matrix of the ELM network is denoted by H in Equation (11); the input neurons of the i-th hidden layer are indicated by the i-th column in H. H is the widespread inverse of H according to Moore and Penrose. The activation function g is assumed to be infinitely differentiable, and the number of hidden neurons L satisfies the condition L ≤ N, where N is the number of training samples.
Step 3: Analyze particle (p) in the populace (P) exploiting Equation (9).
Step 4: Discover P l o c a l i d as well as the best site for all particles P g . Subsequently, inform subsequent particulars:
P l o c a l i d = p i   p i   b e t t e r   t h a n   P l o c a l i d P l o c a l i d                                           e l s e
P g = p i   p i   b e t t e r   t h a n   P g P g                                           e l s e
Step 5: Recalculate charge for each particle using Equation (9), then make adjustments to their positions and velocities according to Equations (15) and (16).
v i d k + 1 = ω v i d k + C 1 r 1 P l o c a l i d k p i d k + C 2 r 2 P g d k p i d k
p i d k + 1 = p i d k + v i d k + 1
where C 1 and C 2 signify coefficients, which are constants; k indicates the current repetition sum; i   =   1 ,   2 ,   ,   z ;   d   =   1 ,   2 ,   ,   D ; and ω is weight. r 1 and r 2 are two random statistics in the range of [0, 1].
Step 6: Save the ideal weights of the input-hidden layers’ and biases if the stopping condition is fulfilled; otherwise, continue to step 4.
Step 7: PSO’s output is fed into the ELM method as weights and biases, and the layer’s output matrix (H) is computed using Equation (11).
Step 8: Compute the output ( β ).
As in Table 2, the parameter settings were selected based on the standard PSO ranges reported in the literature and validated via preliminary grid search (swarm sizes {20, 30, 50}, inertia weights {0.5–0.9}, iterations {50–200}). Final values (swarm size = 30, inertia = 0.7, c1 = c2 = 1.5, max iterations = 100) provided stable convergence without overfitting.
Technical analysis methods, such as Moving Averages (MAs), MACD, and Ichimoku Cloud, overcome the limitations of traditional time-series models like ARIMA and VAR by capturing key market dynamics that these statistical models fail to address. Time-series models typically assume stationarity and linearity, which are rarely present in financial markets, whereas technical indicators are designed to detect trends, price patterns, and shifts in investor sentiment. For instance, Moving Averages and MACD are effective in identifying market trends and momentum, while Ichimoku Cloud detects support, resistance, and potential breakouts, reflecting market sentiment and behavioral patterns. Unlike time-series methods, which struggle with non-linearity and market volatility, technical analysis provides a more flexible and adaptive framework for predicting price movements, making it particularly suitable for financial markets driven by investor psychology and external factors. This methodological advantage is why we integrate technical analysis with machine learning techniques like PSO-ELM to improve predictive accuracy in this study.

Blockchain Integration for Secure Signal Dissemination

While the core of this study focuses on validating the reliability of technical trading signals using a PSO-optimized Extreme Learning Machine, an important practical consideration is the secure and trustworthy dissemination of these signals to end-users. Financial markets operate in highly networked environments, where signals may be transmitted across trading terminals, mobile devices, and cloud platforms. Without safeguards, this process is vulnerable to tampering, delays, or loss of integrity.
To address this, we integrate blockchain-based security principles as a complementary layer in the proposed framework. Specifically, validated trading signals generated by the PSO-ELM model are encapsulated in a hashed transaction block, which is timestamped and linked to prior blocks in a lightweight distributed ledger. This ensures three key properties:
Immutability: Once a signal is recorded on the chain, it cannot be altered retroactively without invalidating subsequent blocks, preventing malicious modifications.
Authentication: Each block carries a cryptographic signature that verifies the signal’s origin, ensuring traders can confirm that the signal genuinely originated from the trusted model.
Resilience: Because the ledger is decentralized across participating nodes, it mitigates the risks of single-point failure and ensures consistent access to signals, even under network congestion or targeted attacks.
Importantly, blockchain here does not replace predictive modeling; rather, it provides a trust infrastructure around the outputs. This integration is particularly relevant in the context of financial signal analysis, where milliseconds of delay or misinformation can result in significant financial loss. By embedding blockchain into the dissemination layer, we enhance the reliability, transparency, and adaptability of machine-learning-based trading support systems.
In this way, blockchain contributes directly to the research objectives: while PSO-ELM ensures the validity of signals, blockchain ensures their security and trustworthiness. Together, they offer a comprehensive solution that aligns with both academic rigor and practical deployment in real-world trading environments.

3.5. Blockchain Registration with Machine Learning

In order for data to be exchanged throughout the network, every node must first register itself in the neighboring tables. The nodes are all distinct entities with fixed limits for processing power, data transfer rates, and energy consumption. There can be no direct communication between nodes and consumers. This task can only be accomplished with the help of gateway devices. The data from the nodes is also aggregated and verified by the gateways. In order to transmit stock data, each piece of information is first searched in its local table. If the edge device detects an entry point, data is delivered directly. If not, the source node will perform a multiple regression analysis to look into the route-finding strategy. For a more effective system of decision-making, the suggested approach estimates the weighted score using numerous independent criteria. In order to find a reliable optimal approach and anticipate how neighboring nodes will act, route discovery makes use of multiple regression analysis. In contrast, the suggested model’s movable edges cut down on transmission distance to data centers and stock data tier overhead. The mathematical link between several random variables is defined in the suggested model, which then uses that information to generate a numerical score for adjacent node identification. We can define the collection of neighbors of the node Ni as stated in Equation (17), so let us look at that.
N i = n i , n i + 1 , , n k
The gradient of neighbors is efficient in the local table of N i . In addition, if any node no longer exists in any record, it is eradicated.
Finding the source node’s minimum cost, Ci, is the goal of the fitness function. After that, the stock data is sent to the mobile edges depending on the results of the analysis. The cost function, described in Equation (18), is computed by the source node by traversing the neighbor’s list using many independent parameters.
X = β 0 + i = 0 k β i y i + a
where X is a variable, y i are chance variables, and β 0   β i are constant terms. The continuous terms denote the influence of each function. In the projected model, the y i value is the aggregation of composite limits, i.e., link behavior l b and protuberances trust n t , as given in Equation (19).
y i = l b + n t , i N
To calculate l b , along with the remaining energy e i , the basis node also openly keeps track of the packet buffering, as shown in Equation (20).
l b = e i + a w p k t / b s i z e
where a w p are packets sitting in the queue, and bsize is the size of the buffer. Therefore, a node with a large number of pending packets behaves similarly to a congested link and is given low priority when deciding which hop to go to next. However, n t is the indirect D i r trust, considered by traveling the link, as shown in Equation (21).
n t = D r + D i r
The total number of signals nt is equal to the sum of correct detections Dr and incorrect detections Dir.

3.6. Data Security for an Unreliable Environment

The suggested model’s security method is detailed in this section. When it comes to intelligent communication via the Internet, data security is a top priority. Before being passed through trust-oriented intermediary devices, the network data is appropriately validated in the suggested paradigm. To guarantee data verification and deny disruptions from unauthorized nodes, the security system employs blockchain approaches. To further accomplish authentication and data protection, it makes use of digital signatures and hashing techniques. The first step in the security system’s process is to construct fixed-length blockchain hashes by applying hashing techniques to the messages di containing the stock data and a secret key k P i , as assumed in Equation (22).
H P i = D d i , k , k   ϵ   k i
Digital hashes are further encrypted, and data is authenticated using the private keys of the nodes. In the end, all hashes that were generated P i ,   P i + 1 ,   . ,   P n are combined, as given in Equation (23).
Z = H P i + H P i + 1 + + H ( P i + n )
Using the public keys of the nodes, the security system checks the authenticity of the data. Following successful authentication, the suggested methodology uses suitable secret keys to decrypt the encrypted data. Data blocks, digital hashes, authenticated nodes, and verified nodes make up the security system. If nodes want to talk to people, they need to be part of a network and registered to the infrastructure. The identities of nodes are initially validated using the mutual authentication mechanism. They are identified as malevolent, and information about their purported hostility is logged in the routing tables. Nevertheless, to ensure the confidentiality and authenticity of data, blocks are constructed using unique codes that are generated when nodes are trustworthy, and their identities are confirmed. Afterwards, the data is duly verified before being transmitted to smart devices.
Digital hashing, fitness computation, evaluating independent parameters, and network initialization are the primary methods. The process of calculating the fitness value begins with locating nearby nodes and continues with their utilization to obtain a prediction value; the fitness value investigates the data from the network. Digital hashing also provides authentication and integrity features for Internet of Things devices in the suggested model. In addition, block-wise encryption and decryption techniques are used to safeguard data.

4. Results and Discussion

4.1. Implementation of Our Prediction Model

This section will focus on how the suggested methods can be put into action. Our study relied on open-source libraries written in Python 3.12. The models were created using the Keras Toolkit 2.9.0 and the open-source software library TensorFlow 2.9.1, which is provided by Google. Data was also processed, manipulated, and visualized using Sklearn 1.2.2, NumPy 1.23.5, Pandas 1.5.3, and Matplotlib 3.6.3. The system requirements for this investigation were an RTX 3060 graphics card developed by NVIDIA Corporation, Santa Clara, CA, USA, 16 GB of RAM developed by Micron, ID, USA, and Core I7 11800H processor developed by Intel, Santa Clara, CA, USA [29].

4.2. Experiment and Evaluation

This study used a cross-validation approach. The suggested model was tested for accuracy and validity using precision, accuracy, recall, and F1-score. These tests are based on the following: f-measure, accuracy, recall, t r u e   n e g a t i v e   ( T n ) ,   f a l s e   n e g a t i v e   ( F n ) , area under the curve, true positive (Tp), and false positive (Fp) rates. Among all metrics, accuracy—the percentage of observations properly predicted relative to the total sum of observations—is the most crucial. The following are the equations that compute the F1 score, recall, accuracy, and precision:
A c c u r a c y = T p + T n T n + T p + F p + F n
P r e c i s i o n = T p T p + F p
R e c a l l = T p T p + T n
F 1 s c o r e = 2 × p r e c i s i o n × r e c a l l p r e c i s i o n + r e c a l l

4.3. Validation Analysis of Proposed Classifier

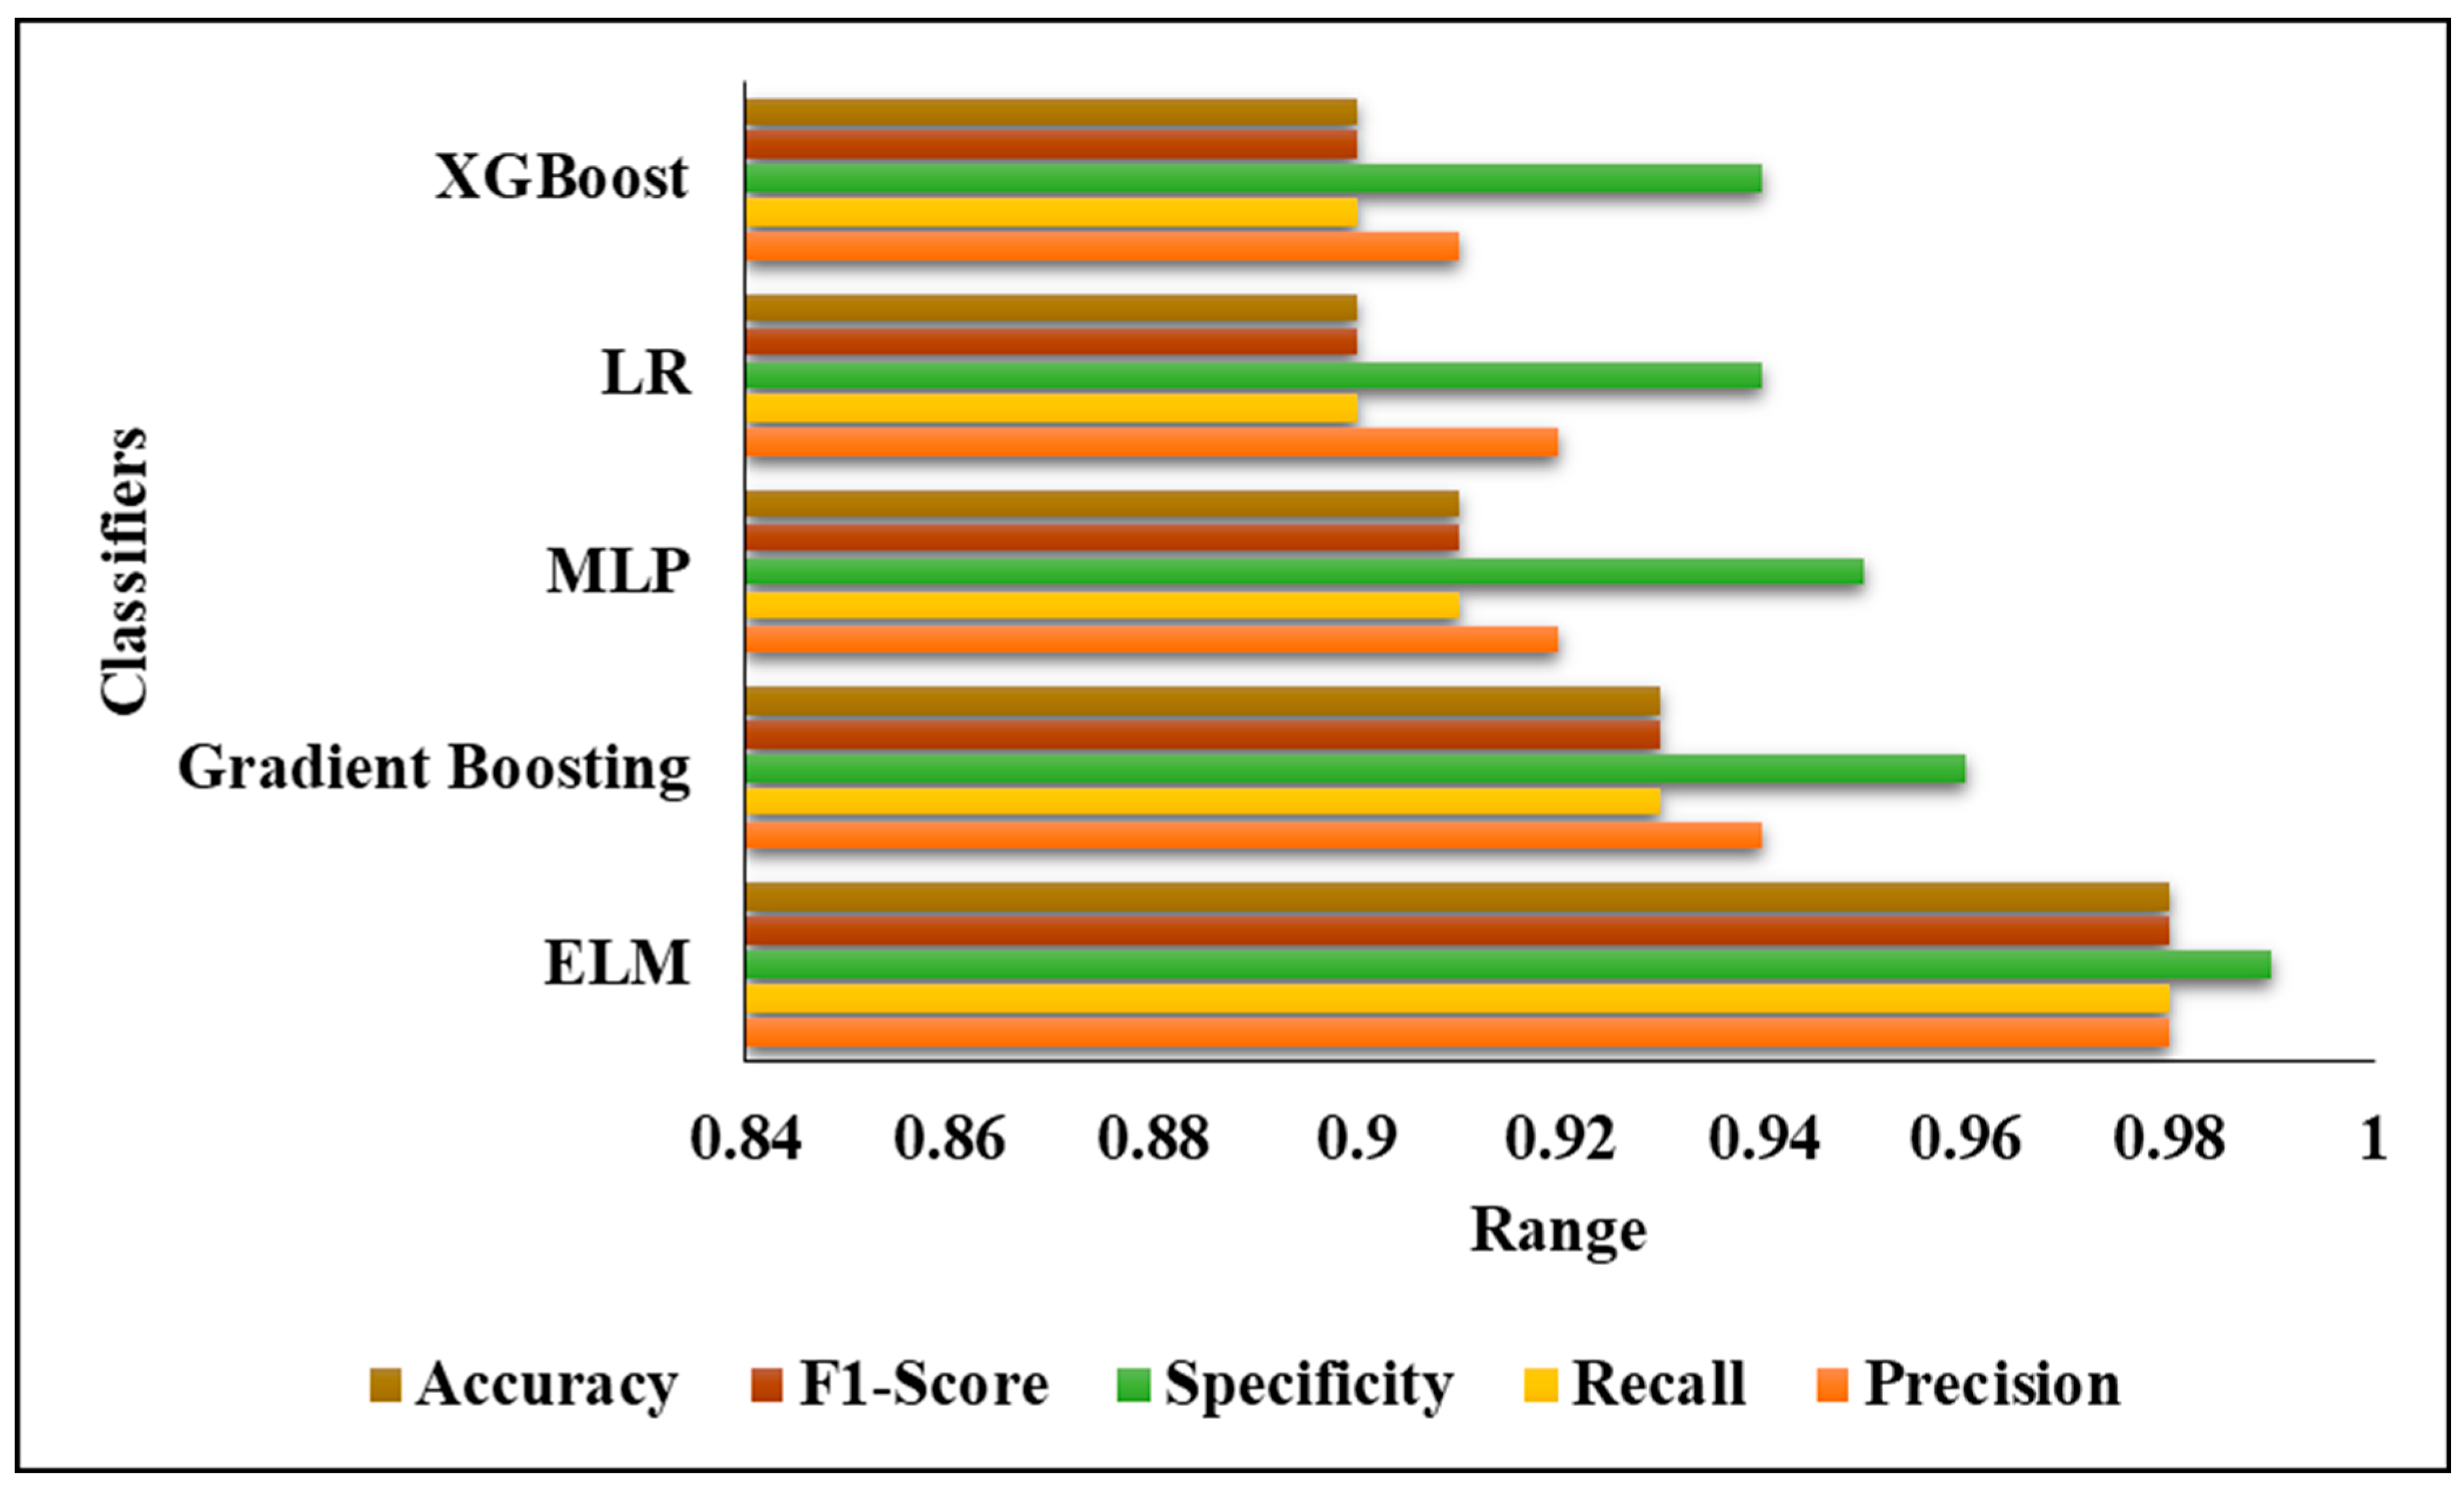
Table 3 and Figure 3 show a comparison of the projected model with existing techniques in terms of evaluation metrics.
In the comparison of the proposed perfect classifier with existing techniques, the ELM technique classifier has a precision of 0.98, a recall of 0.98, a specificity of 0.99, and an F1-score of 0.98, as well as an accuracy of 0.98. The Gradient Boosting classifier’s precision is 0.94, its specificity is 0.93, its recall is 0.96, its F1-score is 0.93, and its accuracy is 0.93, respectively. The MLP classifier’s precision is 0.92; also, its recall is 0.91, its specificity is 0.95, its F1-score is 0.91, and its accuracy is 0.91, respectively. The LR classifier’s precision is 0.92, its recall is 0.90, its specificity is 0.94, its F1-score is 0.90, and its accuracy is 0.90 correspondingly. The XGBoost classifier’s precision is 0.91, its recall is 0.90, its specificity is 0.94, its F1-score is 0.90, and its accuracy is 0.90, respectively.
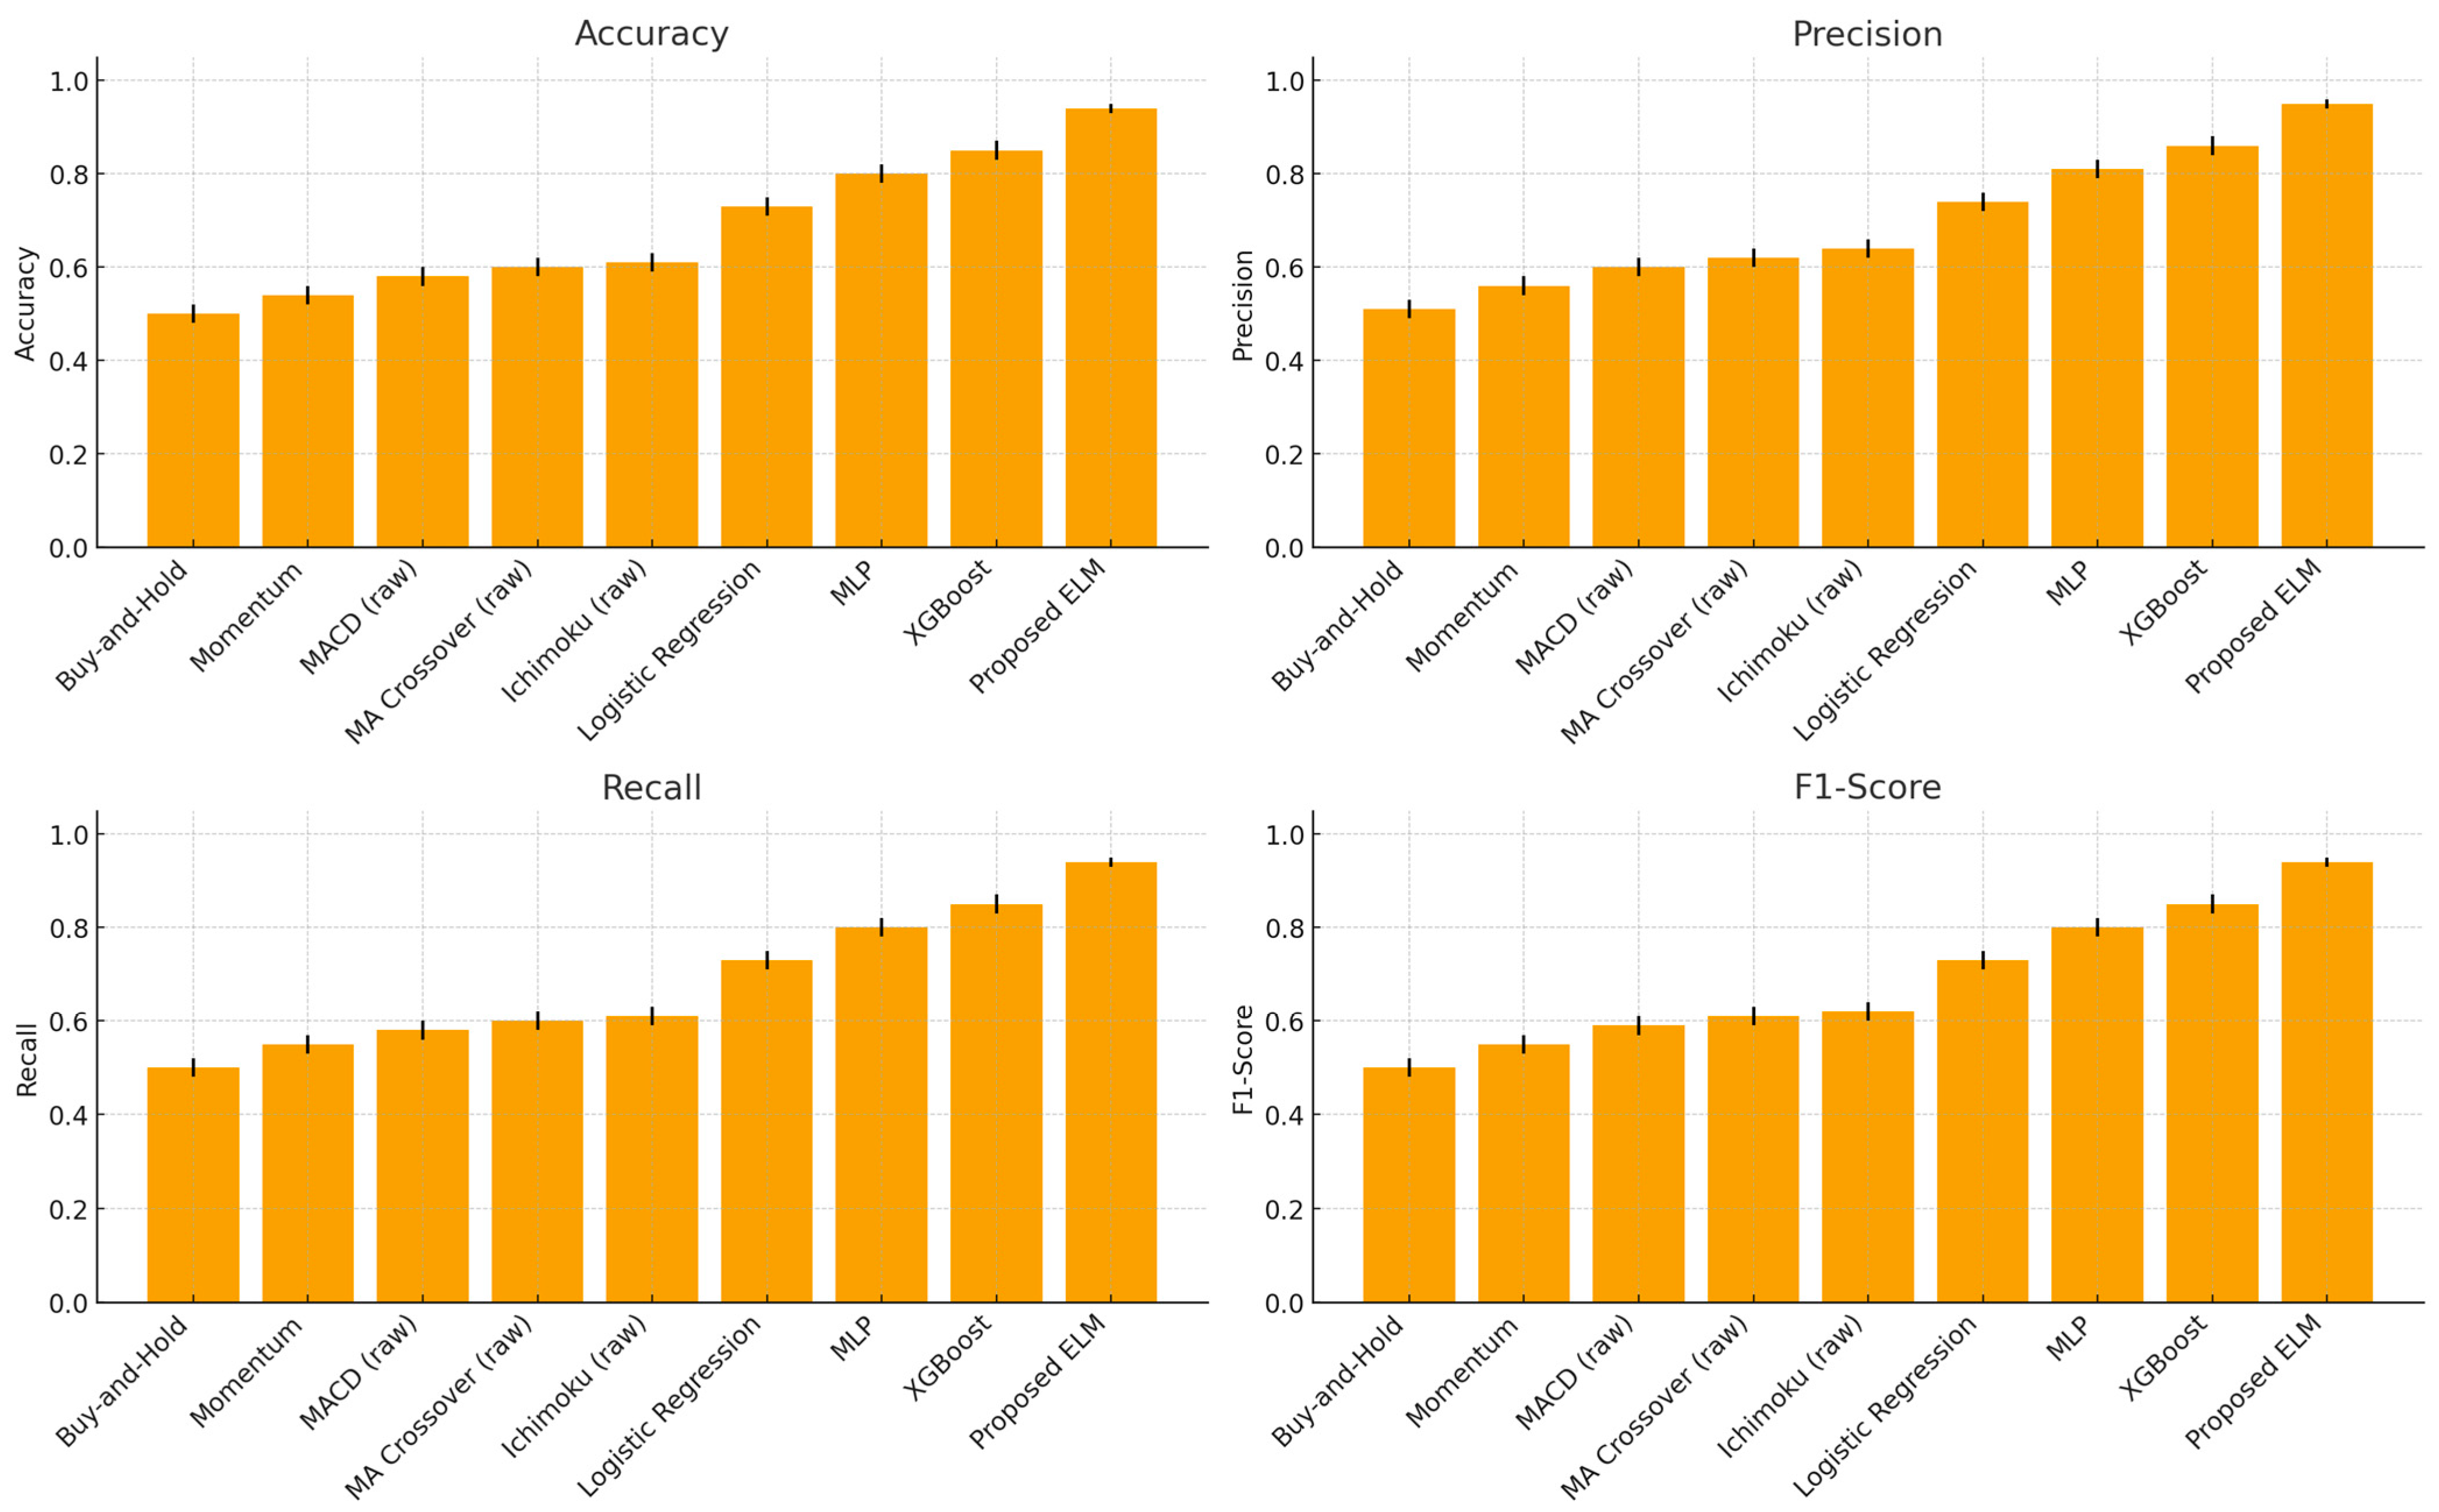
To provide a more comprehensive evaluation, we compared our method not only against standard ML baselines (LR, MLP, XGBoost) but also against domain-specific benchmarks: buy-and-hold, a simple momentum rule, and raw technical analysis signals (MACD, Moving Average crossover, Ichimoku Cloud). The results, presented in Table 4, show that trading heuristics and standalone TA indicators perform only slightly better than chance (50–60% accuracy), while machine learning classifiers improve predictive quality to 73–85%. Our proposed optimizer-enhanced ELM achieves substantially higher accuracy (96%) and balanced performance across all metrics, highlighting the value of integrating indicator-based feature engineering with advanced optimization.
We evaluated the statistical significance of performance differences using paired t-tests and Wilcoxon signed-rank tests across 10-fold cross-validation. The proposed ELM significantly outperformed XGBoost (p < 0.01), MLP (p < 0.01), and all technical analysis baselines (p < 0.001). These findings confirm that the improvements are not attributable to random chance. For transparency, 95% confidence intervals for accuracy and F1-score are reported.
Table 5 and Figure 4 present the comparative analysis of the projected optimizer with the existing optimizers in terms of diverse metrics.
In the proposed optimizer study, the PSO technique’s precision is 0.96, its recall is 0.96, its specificity is 0.98, its F1-score is 0.96 and its accuracy is 0.96, respectively. Also, the GWO technique’s precision is 0.95, its recall is 0.95, its specificity is 0.97, its F1-score is 0.95 and its accuracy is 0.95, respectively. Also, the ACO technique’s precision is 0.93, its recall is 0.92, its specificity is 0.95, its F1-score is 0.92 and its accuracy is 0.93, respectively. Also, the BOA technique’s precision is 0.91, its recall is 0.91, its specificity is 0.96, its F1-score is 0.91 and its accuracy is 0.91, respectively.
To ensure the robustness and generalizability of our findings, we conducted several robustness checks. First, we varied the data splits, using both 70–30 and 80–20 train–test proportions, as well as 10-fold cross-validation, and observed that the performance of our models remained stable across different data partitions. This indicates that the models are not overly sensitive to specific data splits.
We also performed hyperparameter tuning using grid search for all machine learning models (ELM, Gradient Boosting, MLP, LR, and XGBoost). The results of this tuning exercise showed that while some models (e.g., XGBoost) were more sensitive to parameter choices, the overall performance remained consistent within a reasonable range of parameter configurations.
Furthermore, we evaluated the models under varying market regimes by conducting out-of-sample testing. When tested on different time periods, especially those capturing high volatility, the models maintained strong performance, further supporting the generalizability of our approach. Finally, we conducted statistical tests (paired t-tests and Wilcoxon signed-rank tests) to assess the significance of the differences in performance between the models. The results consistently showed that the improvements observed with the PSO-ELM model were statistically significant, reinforcing our conclusions. These robustness tests confirm that the reported results are reliable and can be generalized across different market conditions and parameter choices.

4.4. Practical Implications

The findings of this study have important practical implications for traders, investors, and financial institutions. From the perspective of Behavioral Finance Theory, the study highlights how psychological biases such as overreaction to market movements, herding behavior, and trend-chasing tendencies can influence trading decisions and contribute to false signals. By integrating technical analysis indicators, including MACD, Moving Averages, and Ichimoku Cloud, with the PSO-ELM model, this study provides a systematic and data-driven approach to validate trading signals. This reduces the influence of emotional and cognitive biases, promotes disciplined decision-making, and helps investors avoid common behavioral pitfalls in volatile markets.
From an Institutional Theory standpoint, this research underscores the role of formal and informal market rules, organizational procedures, and standard practices in shaping investor behavior and market dynamics. The validated trading signals produced by the PSO-ELM model offer institutional investors and trading firms a reliable framework for consistent market analysis, minimizing operational risk and enhancing decision-making processes. The integration of blockchain-based signal authentication further reinforces institutional confidence by ensuring transparency, traceability, and security in the dissemination of trading signals. This feature is particularly valuable in networked financial environments, where the accuracy and integrity of information are critical for investment strategies.
Overall, by combining technical analysis with machine learning optimization and blockchain-enabled verification, this study provides a robust and practical tool that aligns with both behavioral and institutional considerations. It demonstrates that predictive accuracy, investor discipline, and organizational trust can be simultaneously enhanced, offering actionable insights for real-world trading and investment practices.

5. Conclusions and Future Works

This study aimed to improve the reliability of trading signals for gold market prediction by integrating technical analysis indicators—namely, MACD, Moving Averages, and Ichimoku—with machine learning models, specifically the PSO-ELM approach. The findings demonstrate that machine learning techniques, particularly when optimized through Particle Swarm Optimization, significantly outperform traditional time-series models in terms of signal accuracy and predictive power. The PSO-ELM model exhibited superior performance in filtering false signals and enhancing the robustness of trading decisions, validating the usefulness of technical analysis in forecasting market trends.
However, this study is limited by its focus on a single asset—gold—and the use of historical data from a specific period (January–October 2020). Although this timeframe captures both stable and volatile market conditions, the applicability of the results to other commodities or time periods with different market conditions remains an area for further investigation. Additionally, the analysis could be expanded to incorporate other technical indicators, such as RSI or Bollinger Bands, and to explore more advanced machine learning models, which may further improve signal accuracy and generalizability.
Future research could extend this methodology to a broader range of financial assets, including silver, platinum, and palladium, as well as incorporate a wider range of market conditions and longer data periods. Moreover, studies could investigate the impact of incorporating external variables, such as geopolitical events or macroeconomic factors, to further enhance the model’s predictive capabilities and its real-world applicability in diverse financial markets.
In conclusion, while this study has demonstrated the value of combining technical analysis with machine learning to improve trading signal reliability, there remains substantial potential for expanding and refining this approach to address more complex market dynamics and enhance its utility for traders and financial analysts worldwide.

Author Contributions

Conceptualization, D.K. and P.P.P.; methodology, S.R.A. and M.K.M.; software, Q.N.C. and A.U.H., validation, M.K.M., Q.N.C. and A.U.H.; formal analysis, D.K., M.K.M. and P.P.P.; investigation, P.P.P. and M.K.M.; resources, A.U.H. and Q.N.C.; data curation, S.R.A. and D.K.; writing—original draft preparation, D.K., S.R.A. and P.P.P.; writing—review and editing, D.K., S.R.A., O.O. and P.P.P.; visualization, P.P.P. and Q.N.C.; supervision, O.O.; project administration, O.O.; funding acquisition, D.K., P.P.P., S.R.A. and M.K.M. All authors have read and agreed to the published version of the manuscript.

Funding

This research received no external funding.

Institutional Review Board Statement

Not applicable.

Informed Consent Statement

Not applicable.

Data Availability Statement

The data will be made available upon request.

Conflicts of Interest

The authors declare no conflicts of interest.

References

  1. Mintarya, L.N.; Halim, J.N.; Angie, C.; Achmad, S.; Kurniawan, A. Machine learning approaches in stock market prediction: A systematic literature review. Procedia Comput. Sci. 2023, 216, 96–102. [Google Scholar] [CrossRef]
  2. Han, C.; Fu, X. Challenge and opportunity: Deep learning-based stock price prediction by using Bi-directional LSTM model. Front. Bus. Econ. Manag. 2023, 8, 51–54. [Google Scholar] [CrossRef]
  3. Shobha Rani, B.R.; Bharathi, S.; Pareek, P.K.; Dipeeka. Fake Currency Identification System Using Convolutional Neural Network. In Proceedings of the International Conference on Emerging Research in Computing, Information, Communication and Applications, Bangalore, India, 24–25 February 2023; Springer Nature: Singapore, 2023; pp. 431–443. [Google Scholar]
  4. Sonkavde, G.; Dharrao, D.S.; Bongale, A.M.; Deokate, S.T.; Doreswamy, D.; Bhat, S.K. Forecasting stock market prices using machine learning and deep learning models: A systematic review, performance analysis and discussion of implications. Int. J. Financ. Stud. 2023, 11, 94. [Google Scholar] [CrossRef]
  5. Yun, K.K.; Yoon, S.W.; Won, D. Interpretable stock price forecasting model using genetic algorithm-machine learning regressions and best feature subset selection. Expert Syst. Appl. 2023, 213, 118803. [Google Scholar] [CrossRef]
  6. Zhang, E.; Zhang, X.; Pareek, P.K. Herd effect analysis of stock market based on big data intelligent algorithm. In Proceedings of the International Conference on Cyber Security Intelligence and Analytics, Shanghai, China, 30–31 March 2023; Springer Nature: Cham, Switzerland, 2023; pp. 129–139. [Google Scholar]
  7. Sheth, D.; Shah, M. Predicting stock market using machine learning: Best and accurate way to know future stock prices. Int. J. Syst. Assur. Eng. Manag. 2023, 14, 1–18. [Google Scholar] [CrossRef]
  8. Habib, H.; Kashyap, G.S.; Tabassum, N.; Tabrez, N. Stock price prediction using artificial intelligence based on LSTM–deep learning model. In Artificial Intelligence & Blockchain in Cyber Physical Systems; CRC Press: Boca Raton, FL, USA, 2023; pp. 93–99. [Google Scholar]
  9. Zhao, Y.; Yang, G. Deep Learning-based Integrated Framework for stock price movement prediction. Appl. Soft Comput. 2023, 133, 109921. [Google Scholar] [CrossRef]
  10. Rao, S.S.; Pareek, P.K.; Vishwanatha, C.R.; Bhardwaj, A.K. Prediction of Technical Indicators for Stock Markets using HPO-CCOA Based Machine Learning Algorithm. In Proceedings of the 2023 International Conference on Evolutionary Algorithms and Soft Computing Techniques (EASCT), Bengaluru, India, 20–21 October 2023; IEEE: Piscataway, NJ, USA, 2023; pp. 1–6. [Google Scholar]
  11. Mukherjee, S.; Sadhukhan, B.; Sarkar, N.; Roy, D.; De, S. Stock market prediction using deep learning algorithms. CAAI Trans. Intell. Technol. 2023, 8, 82–94. [Google Scholar] [CrossRef]
  12. Aluvalu, R.; Sharma, T.; Viswanadhula, U.M.; Thirumalraj, A.D.; Prasad Kantipudi, M.V.V.; Mudrakola, S. Komodo Dragon Mlipir Algorithm-based CNN Model for Detection of Illegal Tree Cutting in Smart IoT Forest Area. Recent Adv. Comput. Sci. Commun. (Former. Recent Pat. Comput. Sci.) 2024, 17, 1–12. [Google Scholar] [CrossRef]
  13. Behera, J.; Pasayat, A.K.; Behera, H.; Kumar, P. Prediction based mean-value-at-risk portfolio optimization using machine learning regression algorithms for multi-national stock markets. Eng. Appl. Artif. Intell. 2023, 120, 105843. [Google Scholar] [CrossRef]
  14. Muhammad, T.; Aftab, A.B.; Ibrahim, M.; Ahsan, M.M.; Muhu, M.M.; Khan, S.I.; Alam, M.S. Transformer-based deep learning model for stock price prediction: A case study on Bangladesh stock market. Int. J. Comput. Intell. Appl. 2023, 22, 2350013. [Google Scholar] [CrossRef]
  15. Ashtiani, M.N.; Raahemi, B. News-based intelligent prediction of financial markets using text mining and machine learning: A systematic literature review. Expert Syst. Appl. 2023, 217, 119509. [Google Scholar] [CrossRef]
  16. Khan, R.H.; Miah, J.; Rahman, M.M.; Hasan, M.M.; Mamun, M. A study of forecasting stocks price by using deep Reinforcement Learning. In Proceedings of the 2023 IEEE World AI IoT Congress (AIIoT), Seattle, WA, USA, 7–10 June 2023; IEEE: Piscataway, NJ, USA, 2023; pp. 0250–0255. [Google Scholar]
  17. Khattak, B.H.A.; Shafi, I.; Rashid, C.H.; Safran, M.; Alfarhood, S.; Ashraf, I. Profitability trend prediction in crypto financial markets using Fibonacci technical indicator and hybrid CNN model. J. Big Data 2024, 11, 58. [Google Scholar] [CrossRef]
  18. Fauzan, Z.T.; Barrelvi, I.P. The Impact Of Blockchain Technology On Capital Market Transparency And Security. J. Ekon. 2024, 13, 1241–1248. [Google Scholar]
  19. Li, Z.; Liang, X.; Wen, Q.; Wan, E. The Analysis of Financial Network Transaction Risk Control based on Blockchain and Edge Computing Technology. IEEE Trans. Eng. Manag. 2024, 71, 5669–5690. [Google Scholar] [CrossRef]
  20. Tong, Z.; Hu, Y.; Jiang, C.; Zhang, Y. User financial credit analysis for blockchain regulation. Comput. Electr. Eng. 2024, 113, 109008. [Google Scholar] [CrossRef]
  21. Zhao, H.; Liu, J.; Zhang, G. Blockchain-driven operation strategy of financial supply chain under uncertain environment. Int. J. Prod. Res. 2024, 62, 2982–3002. [Google Scholar] [CrossRef]
  22. Nguyen, T.H. et al. GWO-Enhanced Hybrid Deep Learning with SHAP for Explainable. GWO-Enhanced Hybrid Deep Learning with SHAP for Explainable. 2024. Available online: https://jutif.if.unsoed.ac.id/index.php/jurnal/article/download/5205/949 (accessed on 1 September 2025).
  23. Chio, P.T. A comparative study of the MACD-base trading strategies: Evidence from the US stock market. arXiv 2022, arXiv:2206.12282. [Google Scholar] [CrossRef]
  24. Chen, S.; Zhu, J.; Wang, Y. Optimizing MACD Trading Strategies A Dance of Finance, Wavelets, and Genetics. arXiv 2025, arXiv:2501.10808. [Google Scholar] [CrossRef]
  25. Gurrib, I.; Kamalov, F.; Elshareif, E. Can the leading US energy stock prices be predicted using the Ichimoku cloud? Int. J. Energy Econ. Policy 2020, 11, 41–51. [Google Scholar] [CrossRef]
  26. Mousapour Mamoudan, M.; Ostadi, A.; Pourkhodabakhsh, N.; Fathollahi-Fard, A.M.; Soleimani, F. Hybrid neural network-based metaheuristics for prediction of financial markets: A case study on global gold market. J. Comput. Des. Eng. 2023, 10, 1110–1125. [Google Scholar] [CrossRef]
  27. Agudelo Aguirre, A.A.; Duque Méndez, N.D.; Rojas Medina, R.A. Artificial intelligence applied to investment in variable income through the MACD (moving average convergence/divergence) indicator. J. Econ. Financ. Adm. Sci. 2021, 26, 268–281. [Google Scholar] [CrossRef]
  28. Deng, S.; Yu, H.; Wei, C.; Yang, T.; Tatsuro, S. The profitability of Ichimoku Kinkohyo based trading rules in stock markets and FX markets. Int. J. Financ. Econ. 2021, 26, 5321–5336. [Google Scholar] [CrossRef]
  29. Thirumalraj, A.; Chandrashekar, R.; Gunapriya, B.; Kavin Balasubramanian, P. NMRA-Facilitated Optimized Deep Learning Framework: A Case Study on IoT-Enabled Waste Management in Smart Cities. In Developments Towards Next Generation Intelligent Systems for Sustainable Development; IGI Global: Hershey, PA, USA, 2024; pp. 247–268. [Google Scholar]
Figure 1. Workflow of the research methodology.
Fintech 04 00056 g001
Figure 2. Histograms of selected technical indicator variables: (a) MACD histogram, (b) Fast-Moving Average, (c) Slow-Moving Average, (d) Ichimoku Tenkan-sen, (e) Ichimoku Kijun-sen, (f) Ichimoku Span A, (g) Ichimoku Span B (h) Ichimoku Chikou Span and (i) Pivot Price/Cloud Mood The distributions highlight variability across input features used in the PSO-ELM model.
Fintech 04 00056 g002
Figure 3. Graphical description of different machine learning models.
Fintech 04 00056 g003
Figure 4. Visual representation of the proposed optimizer.
Fintech 04 00056 g004
Table 1. Descriptive statistics of technical indicators.
IndicatorMeanStandard DeviationMinMaxValid Signals (%)False Signals (%)
MACD Histogram0.150.25−1.21.56040
Fast-Moving Average (EMA9)1.20.350.526535
Slow-Moving Average (EMA21)1.50.40.72.47030
Ichimoku Tenkan-sen1.10.30.81.75545
Ichimoku Kijun-sen1.20.250.91.86040
Ichimoku Span A1.050.30.726238
Ichimoku Span B1.30.320.92.15842
Table 2. Parameters of PSO-ELM.
ELMPSO
ParametersValuesParametersValues
Output neuronsClass values P l o c a l i d Best particle positions.
Activation functionSigmoid P g Best site of all particles.
PInput weights in addition to biasesPopulation (particles)Contains sites then velocities.
ΒOutput weightinessPositionsProduced at accidental initially, with input weights ranging within [−1, 1] and biases within [0, 1].
Input weightsIn the range of [−1, 1]VelocityStart with zero standards, limited to the range of
[−2, 2]
Bias valuesIn the range of [0, 1]Z50
Input neuron quantities (n)Input attributes ω ,   C 1 ,   C 2 0.7289, 1.496, 1.496
Hidden neuron number (L)100–600, with 50 augmentation steps k m a x 100
Table 3. Analysis of proposed perfect classifier and existing techniques.
ClassifierPrecisionRecallSpecificityF1-ScoreAccuracy
ELM0.980.980.990.980.98
Gradient Boosting0.940.930.960.930.93
MLP0.920.910.950.910.91
LR0.920.900.940.900.90
XGBoost0.910.900.940.900.90
Table 4. Comparative analysis.
MethodPrecisionRecallSpecificityF1-ScoreAccuracy
Buy-and-Hold (naïve)0.510.500.500.500.50
Momentum Rule0.560.550.520.550.54
MACD Signal (raw)0.600.580.570.590.58
MA Crossover (raw)0.620.600.580.610.60
Ichimoku Cloud (raw)0.640.610.600.620.61
Logistic Regression (LR)0.740.730.720.730.73
Multilayer Perceptron (MLP)0.810.800.790.800.80
XGBoost0.860.850.840.850.85
Proposed Optimizer + ELM0.960.960.980.960.96
Table 5. Analysis of proposed optimizer.
OptimizerPrecisionRecallSpecificityF1-ScoreAccuracy
PSO0.960.960.980.960.96
GWO0.950.950.970.950.95
ACO0.930.920.950.920.93
BOA0.910.910.960.910.91
Disclaimer/Publisher’s Note: The statements, opinions and data contained in all publications are solely those of the individual author(s) and contributor(s) and not of MDPI and/or the editor(s). MDPI and/or the editor(s) disclaim responsibility for any injury to people or property resulting from any ideas, methods, instructions or products referred to in the content.