M&As and Corporate Financial Performance: An Empirical Study of DAX 40 Firms
Abstract
1. Introduction
2. Literature Review
2.1. Rationale for Mergers and Acquisitions: From Strategy to Value
2.2. Determinants of M&A Outcomes: Governance, Leadership, and Strategic Fit
2.3. Multi-Dimensional Evaluation of Post-M&A Financial Performance
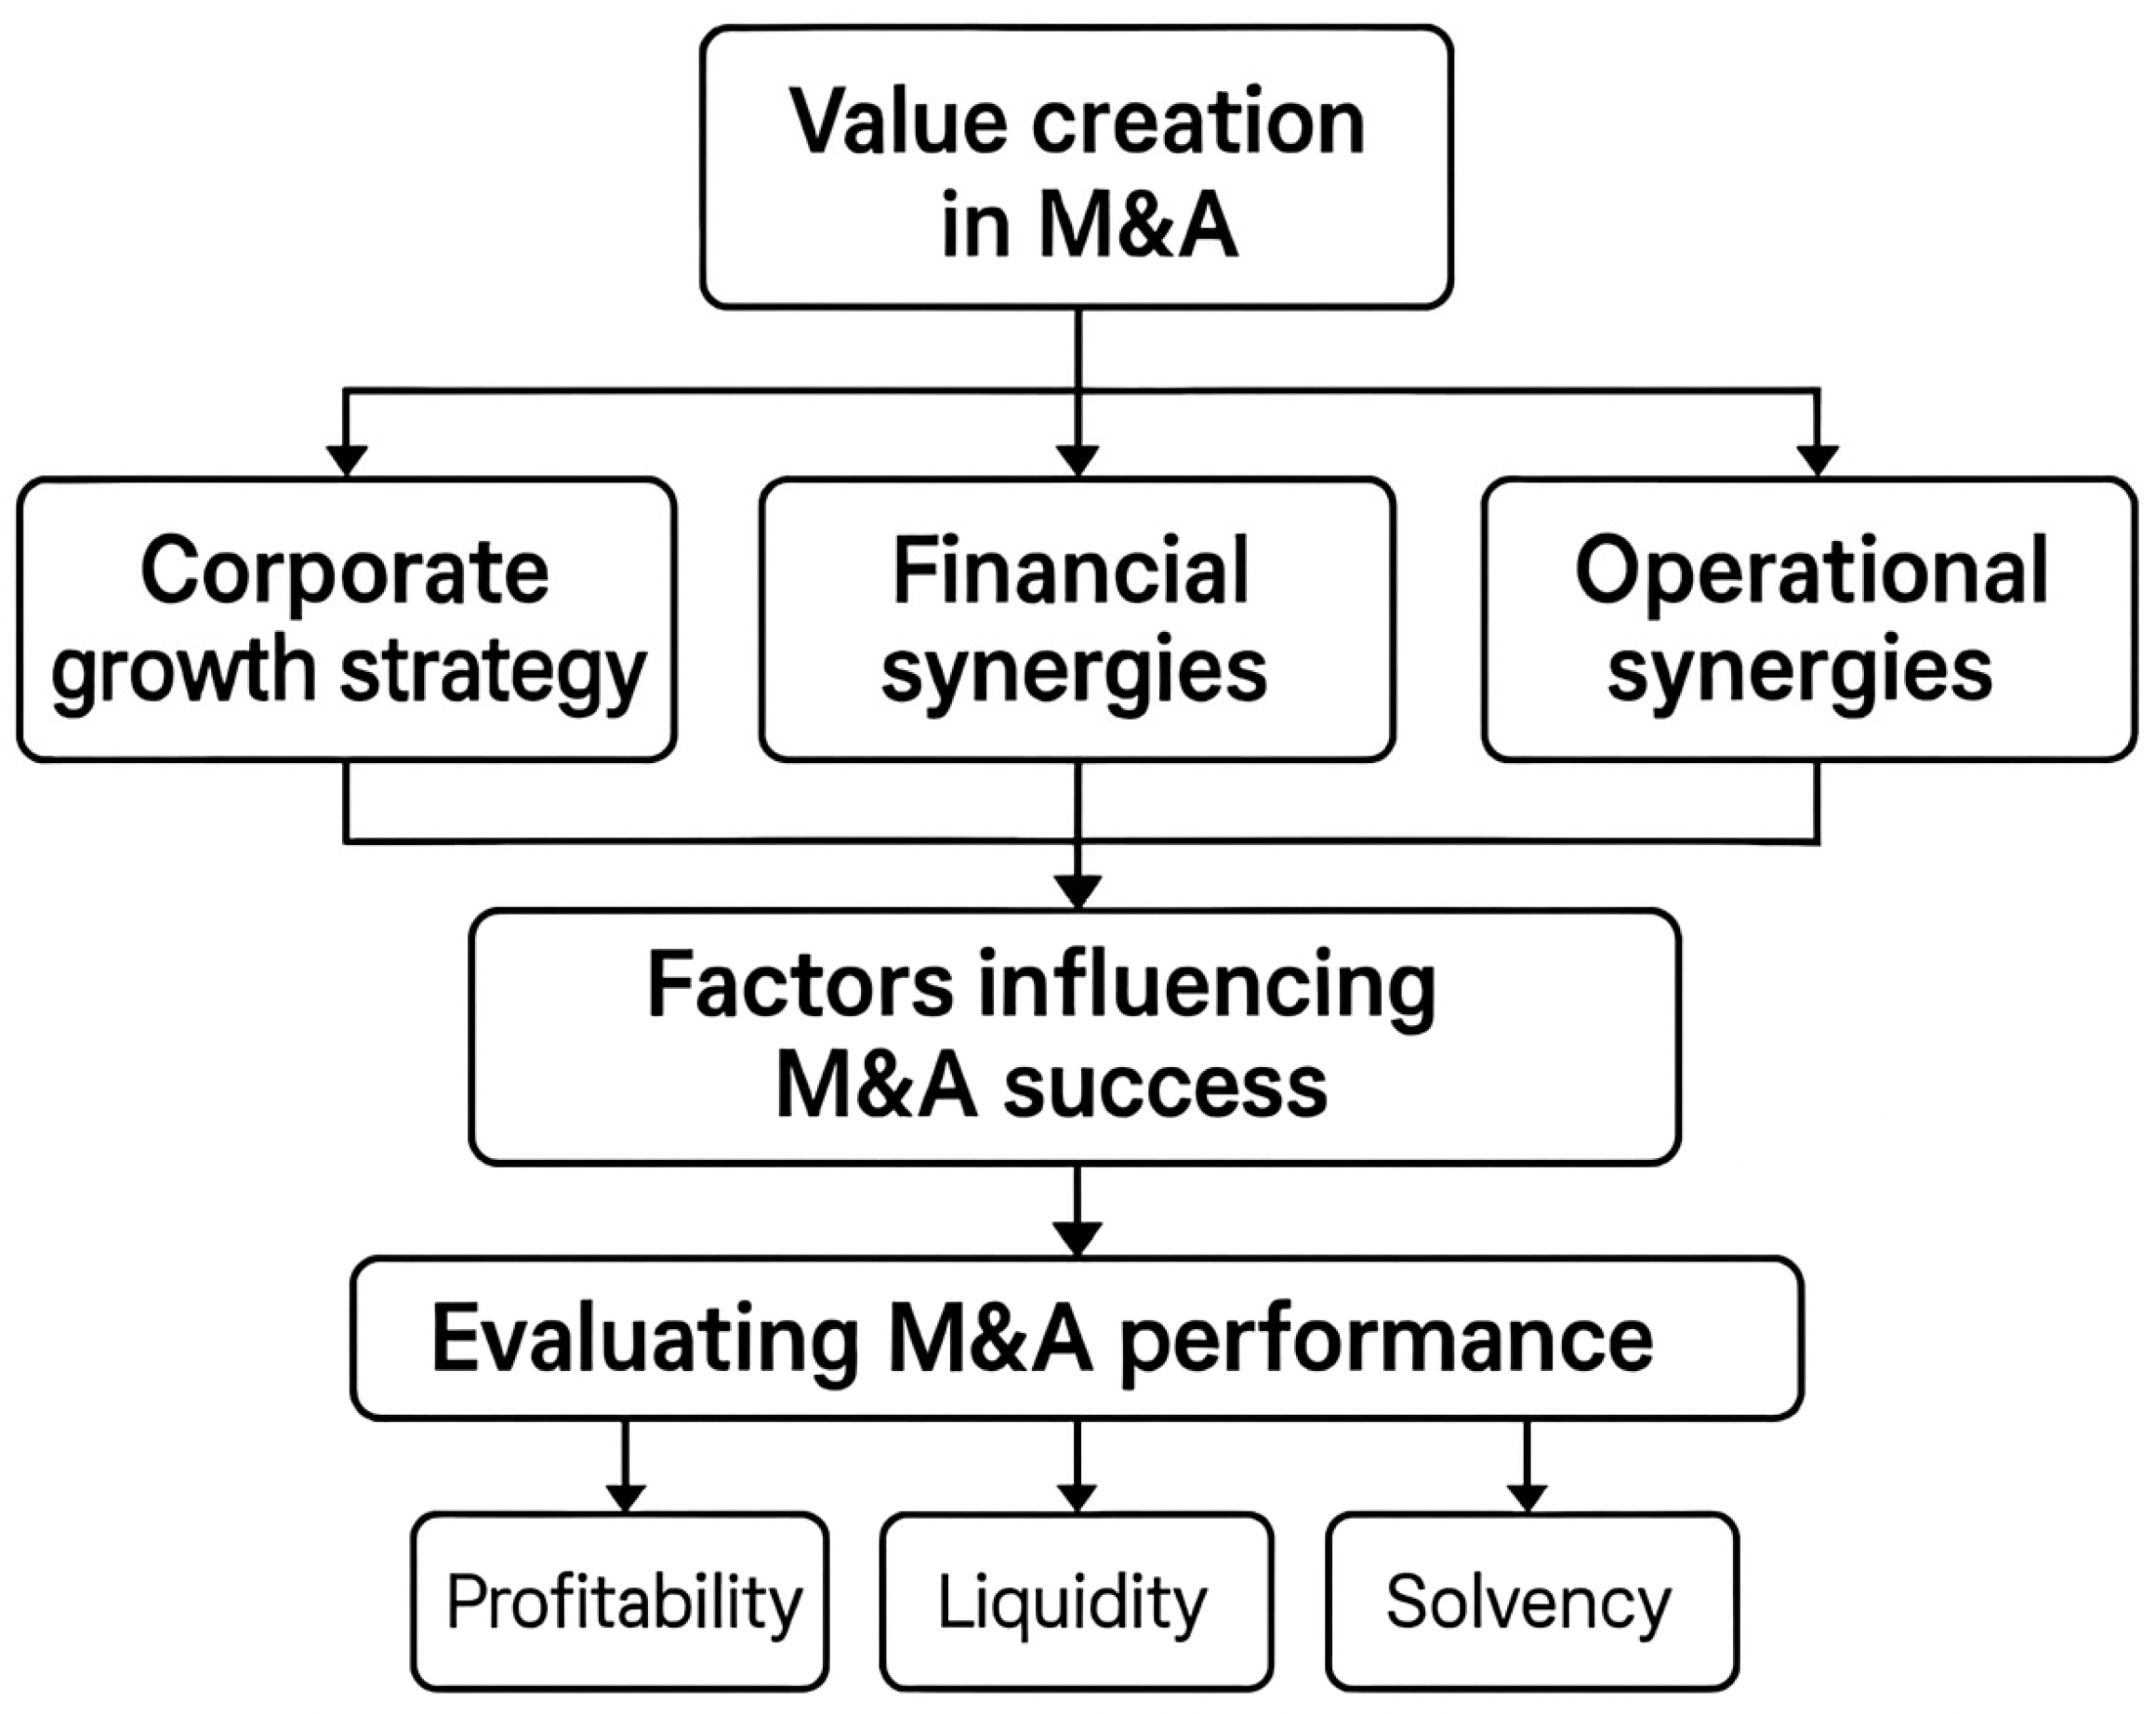
2.3.1. Conceptual Framework of M&A Performance Evaluation
2.3.2. Profitability as a Measure of M&A Success
2.3.3. Liquidity Dynamics Following M&A Transactions: A Review of Empirical Insights
2.3.4. Post-Merger Solvency Outcomes: Assessing Long-Term Financial Stability
3. Methodology
3.1. The Choice of Methodology
3.2. Data Collection and Sample
- -
- Acquirers had to be publicly traded companies.
- -
- Only companies possessing essential data, such as financial ratios relevant to the study’s timeframe and pertinent M&A characteristics, were considered.
- -
- Companies operating within the financial sector were excluded due to their distinct regulatory requirements.
4. Results
4.1. Data Description
4.2. Ratio Analysis Comparison
4.3. Paired Sample t-Test
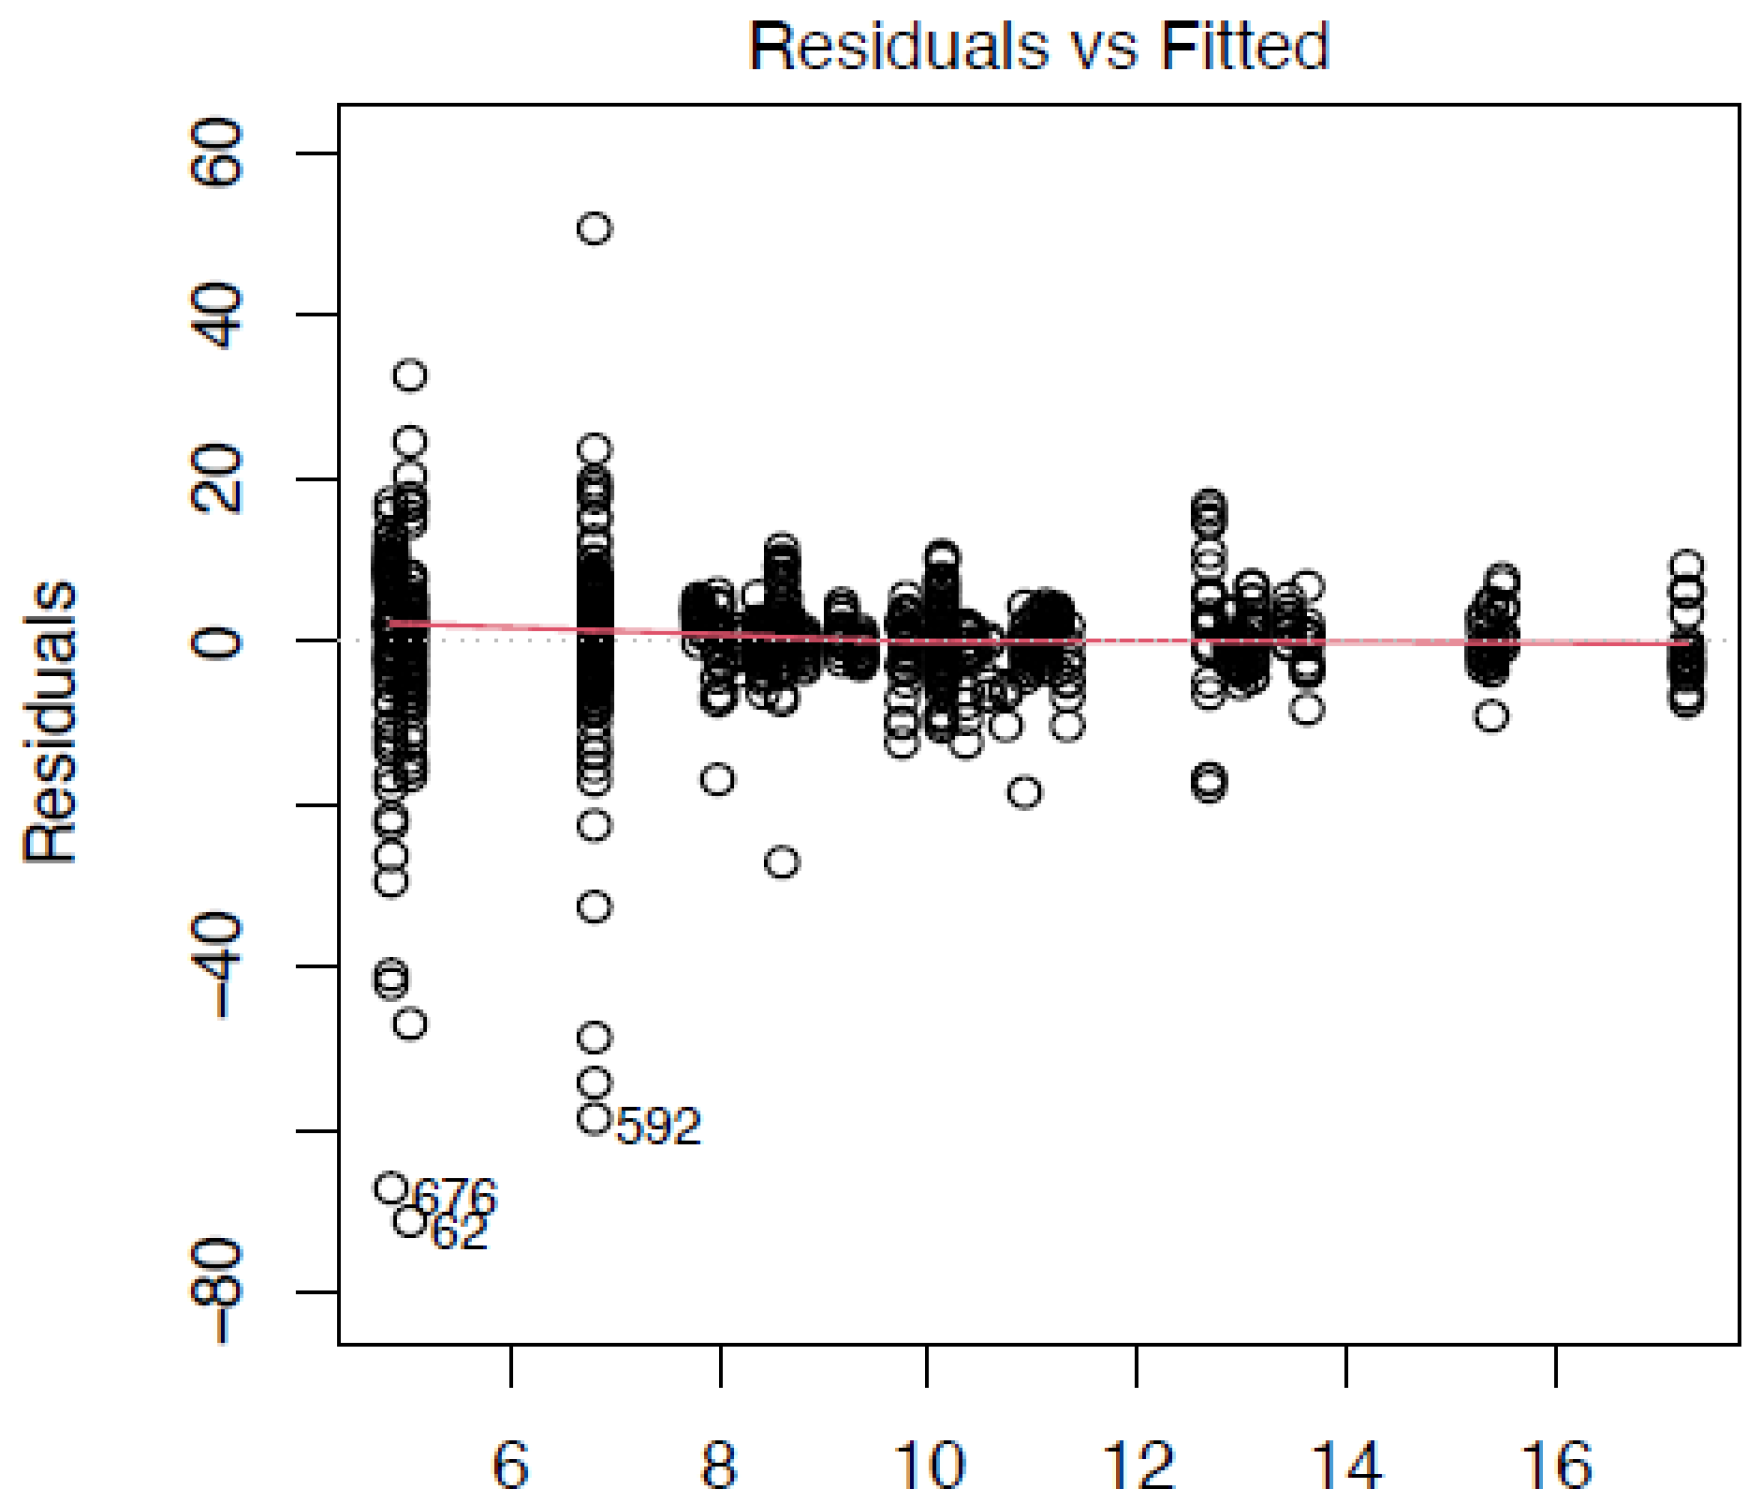
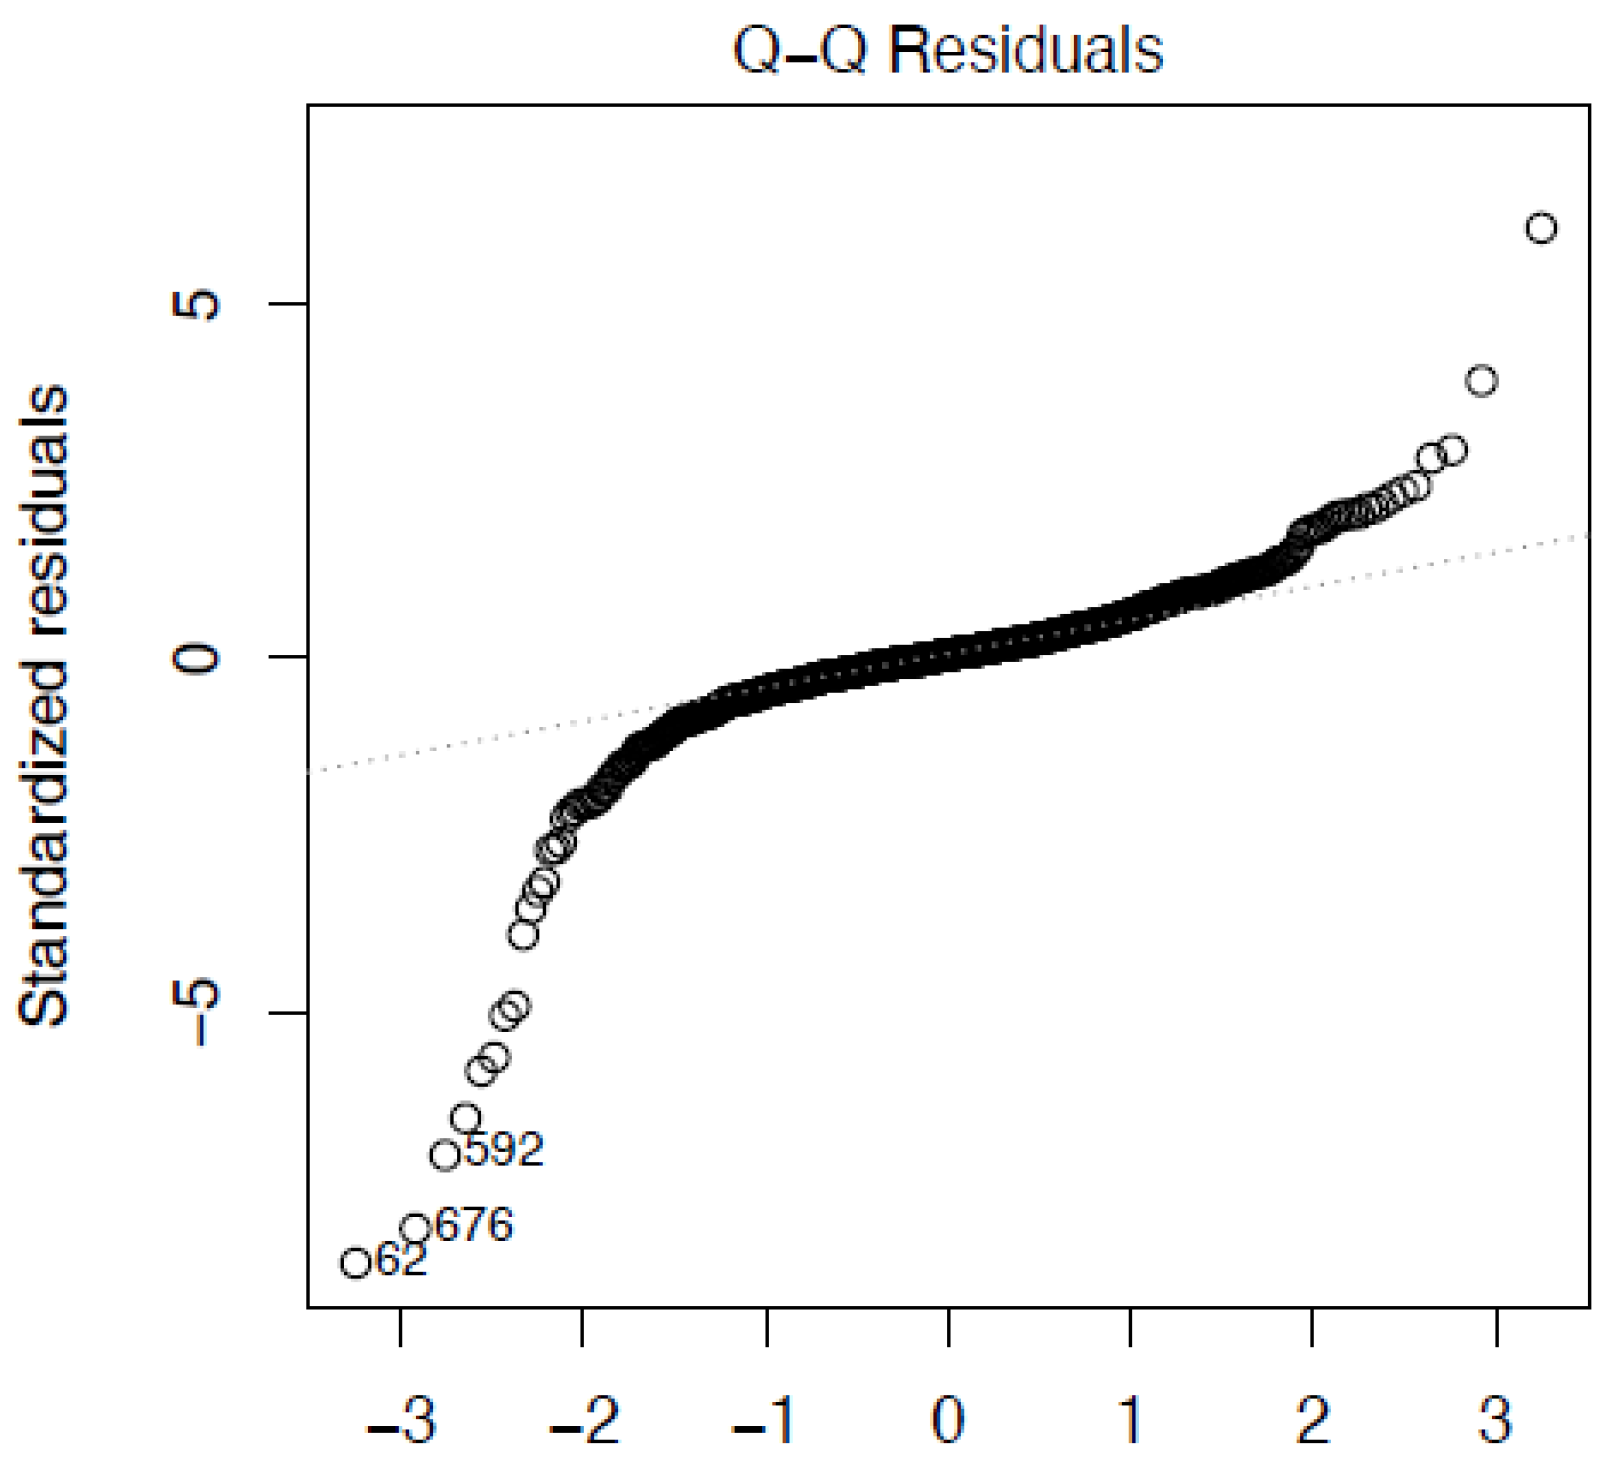
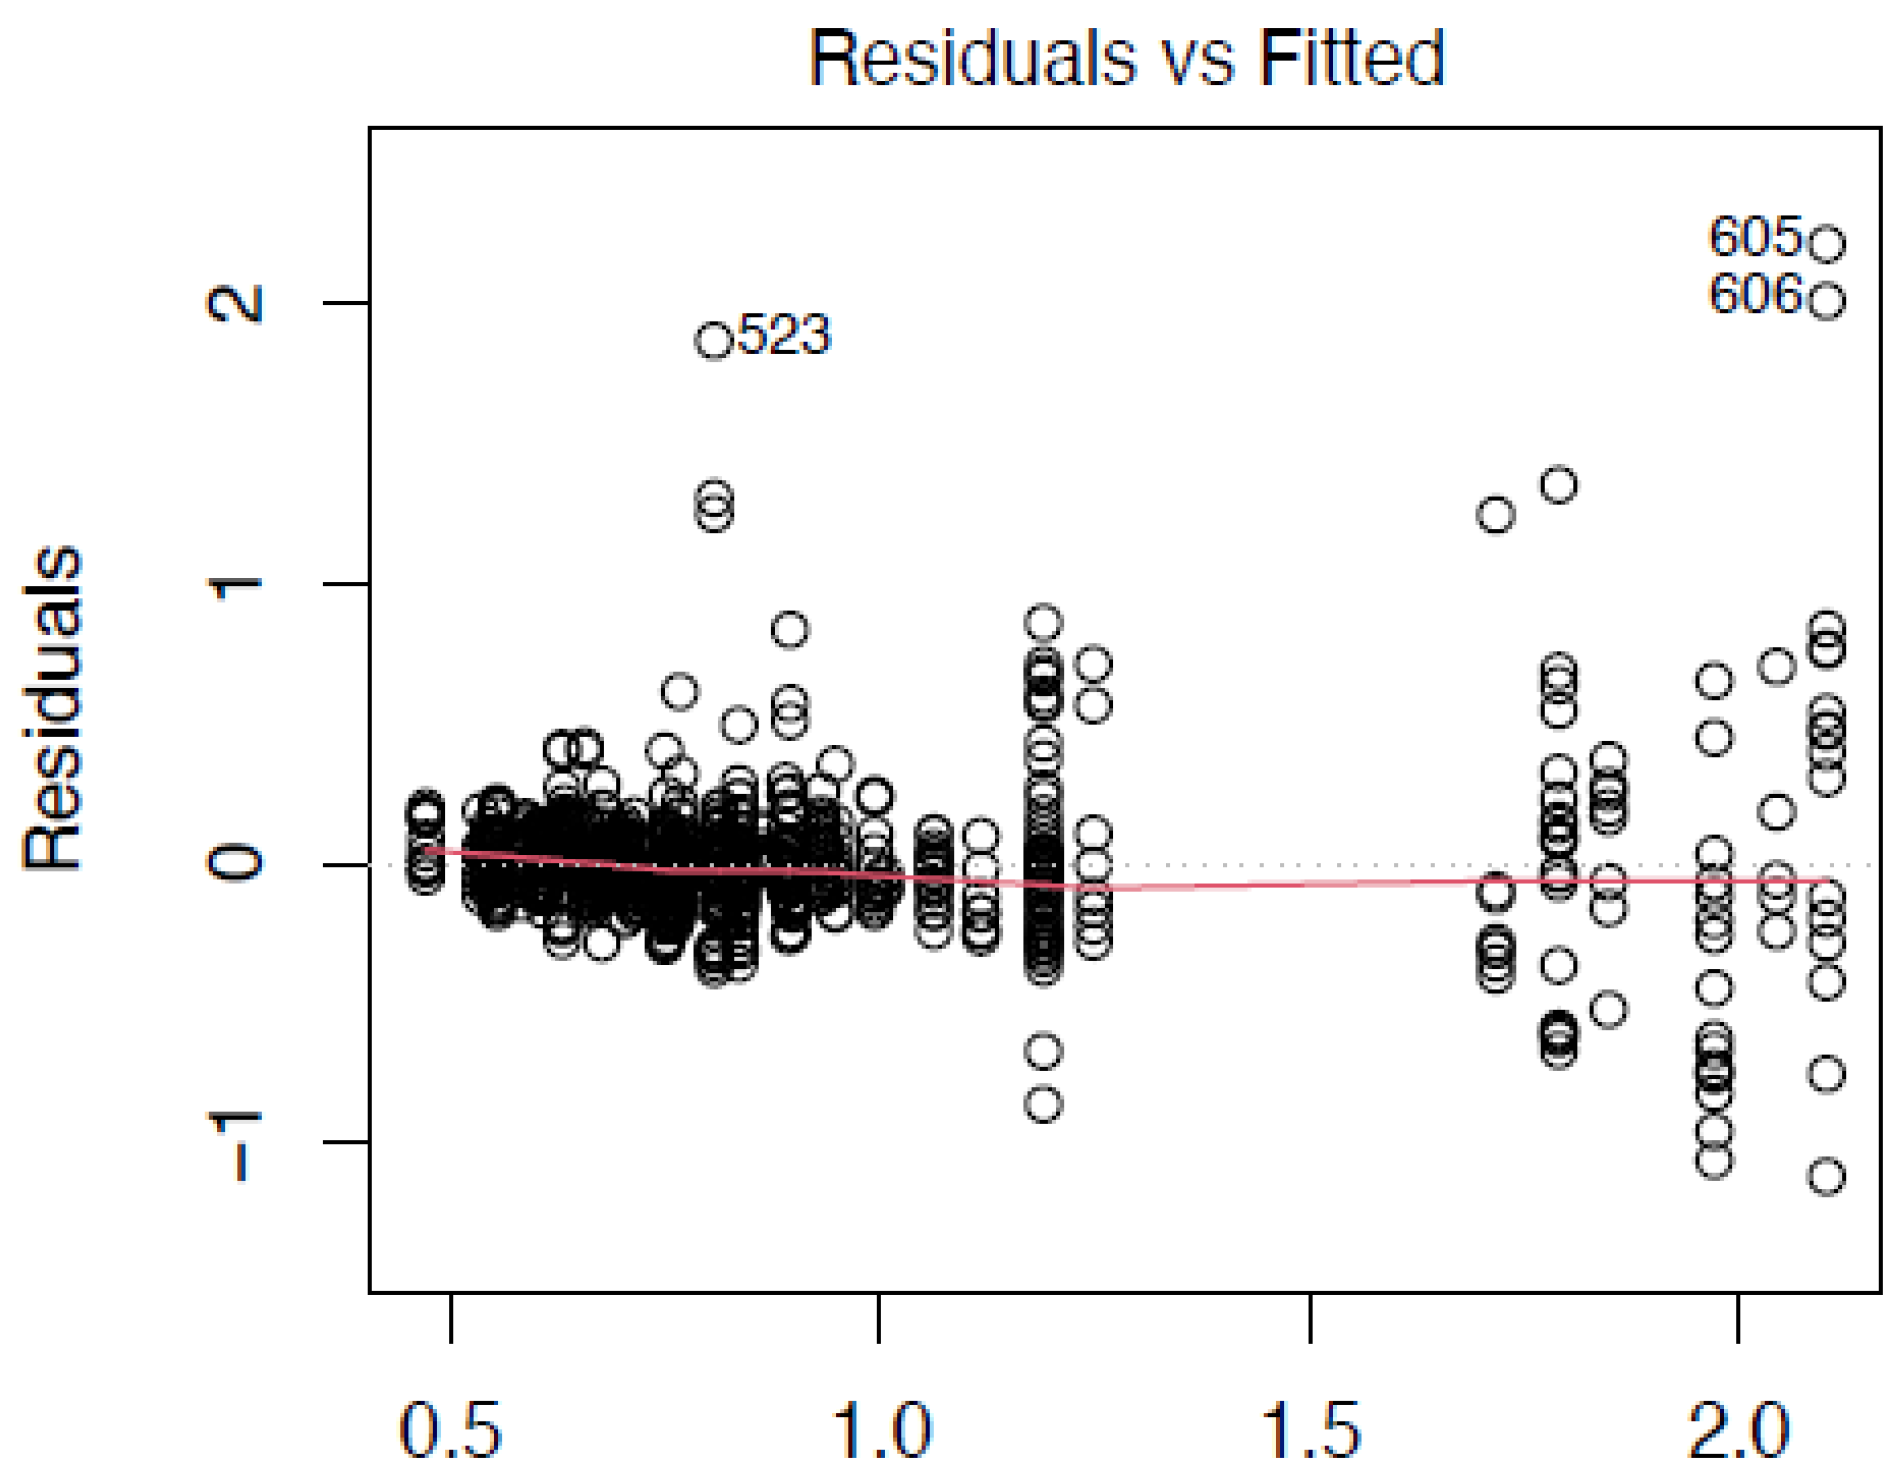
4.4. Results of the Regression Analysis
5. Discussion
6. Conclusions
6.1. Limitations
6.2. Practical Implications
6.3. Future Research
Author Contributions
Funding
Data Availability Statement
Conflicts of Interest
Abbreviations
| AR | Abnormal Return |
| CAR | Cumulative Abnormal Return |
| CFO | Chief Financial Officer |
| DAX40 | Deutscher Aktienindex 40 |
| D/E | Debt-to-Equity |
| EPS | Earnings per Share |
| ICR | Interest Coverage Ratio |
| IDX | Indonesia Stock Exchange |
| IMAA | Institute for Mergers, Acquisitions and Alliances |
| M&A | Mergers and Acquisitions |
| NPM | Net Profit Margin |
| QR | Quick Ratio |
| R&D | Research and Development |
| ROA | Return on Assets |
| ROCE | Return on Capital Employed |
| ROE | Return on Equity |
| RONW | Return on Net Worth |
| ROS | Return on Sales |
| TL/TA | Total Liabilities to Total Assets |
| US | United States |
Appendix A
| Parameter | Estimate | p-Value |
|---|---|---|
| Two_Years_After | −0.072709 | 8.081 × 10⁻⁵ *** |
| Two_Years_Before | 0.058183 | 0.01362 * |
| Adidas | −0.424093 | 4.585 × 10⁻¹³ *** |
| Airbus | −0.693616 | <2.2 × 10⁻¹⁶ *** |
| BASF | −0.302258 | 1.647 × 10⁻⁷ *** |
| Bayer | −0.400553 | 1.449 × 10⁻⁹ *** |
| BMW | −0.547117 | <2.2 × 10⁻¹⁶ *** |
| Brenntag | −0.233037 | 6.153 × 10⁻⁵ *** |
| Continental | −0.561724 | <2.2 × 10⁻¹⁶ *** |
| Covestro | −0.100446 | 0.18576 |
| DeutschePost | −0.577220 | <2.2 × 10⁻¹⁶ *** |
| DeutscheTelekom | −0.629511 | <2.2 × 10⁻¹⁶ *** |
| E.ON | −0.581763 | <2.2 × 10⁻¹⁶ *** |
| Fresenius | −0.538442 | <2.2 × 10⁻¹⁶ *** |
| InfineonTechnology | 0.552291 | 1.226 × 10⁻⁸ *** |
| MercedesBenz | −0.461634 | 2.527 × 10⁻¹⁶ *** |
| Merck | −0.488661 | 2.688 × 10⁻⁷ *** |
| MTUAeroEngine | −0.683372 | <2.2 × 10⁻¹⁶ *** |
| Qiagen | 0.806152 | 2.058 × 10⁻⁹ *** |
| Rheinmetall | −0.485586 | 2.443 × 10⁻¹⁶ *** |
| RWE | −0.534877 | <2.2 × 10⁻¹⁶ *** |
| SAP | −0.347850 | 3.370 × 10⁻⁹ *** |
| Sartorius | −0.401943 | 1.692 × 10⁻¹⁰ *** |
| SiemensAG | −0.397992 | 9.585 × 10⁻¹¹ *** |
| Volkswagen | −0.532013 | <2.2 × 10⁻¹⁶ *** |
References
- Renneboog, L.; Vansteenkiste, C. What Goes Wrong in M&As? On the Long-Run Success Factors in M&As. Soc. Sci. Res. Netw. 2018; preprint. [Google Scholar] [CrossRef]
- IMAA—Institute for Mergers, Acquisitions, and Alliances. Germany—M&A Statistics; IMAA—Institute for Mergers, Acquisitions, and Alliances: Vienna, Austria, 2021; Available online: https://imaa-institute.org/mergers-and-acquisitions-statistics/germany-ma-statistics/ (accessed on 3 January 2025).
- Renneboog, L.; Vansteenkiste, C. Failure and success in mergers and acquisitions. J. Corp. Financ. 2019, 58, 650–699. [Google Scholar] [CrossRef]
- Alexandridis, G.; Antypas, N.; Travlos, N.G. Value creation from M&As: New evidence. J. Corp. Financ. 2017, 45, 632–650. [Google Scholar] [CrossRef]
- Delis, M.D.; Iosifidi, M.; Kazakis, P.; Ongena, S.; Tsionas, M. Management practices and M&A success. J. Bank. Financ. 2022, 134, 106355. [Google Scholar] [CrossRef]
- Fich, E.M.; Nguyen, T. The value of CEOs’ supply chain experience: Evidence from mergers and acquisitions. J. Corp. Financ. 2020, 60, 101525. [Google Scholar] [CrossRef]
- Hu, N.; Li, L.; Li, H.; Wang, X. Do mega-mergers create value? The acquisition experience and mega-deal outcomes. J. Empir. Financ. 2020, 55, 119–142. [Google Scholar] [CrossRef]
- Schoenberg, R. Measuring the performance of corporate acquisitions: An empirical comparison of alternative metrics. Br. J. Manag. 2006, 17, 361–370. [Google Scholar] [CrossRef]
- Thanos, I.C.; Papadakis, V.G. The Use of Accounting-Based Measures in Measuring M&A Performance: A Review of Five Decades of Research. Adv. Merg. Acquis. 2012, 10, 103–120. [Google Scholar] [CrossRef]
- Cox, R.A.K. Mergers and acquisitions: A review of the literature. Corp. Ownersh. Control 2006, 3, 55–59. [Google Scholar] [CrossRef]
- Bauer, F.; Matzler, K. Antecedents of M&A success: The role of strategic complementarity, cultural fit, and degree and speed of integration. Strateg. Manag. J. 2013, 35, 269–291. [Google Scholar] [CrossRef]
- Williamson, R.; Yang, J. Tapping into financial synergies: Alleviating financial constraints through acquisitions. J. Corp. Financ. 2021, 68, 101947. [Google Scholar] [CrossRef]
- Cornaggia, J.; Li, J.Y. The value of access to finance: Evidence from M&As. J. Financ. Econ. 2019, 131, 232–250. [Google Scholar] [CrossRef]
- Rabier, M. Acquisition motives and the distribution of acquisition performance. Strateg. Manag. J. 2017, 38, 2666–2681. [Google Scholar] [CrossRef]
- Hanelt, A.; Firk, S.; Hildebrandt, B.; Kolbe, L. Digital M&A, digital innovation, and firm performance: An empirical investigation. Eur. J. Inf. Syst. 2020, 30, 3–26. [Google Scholar] [CrossRef]
- Hsu, P.; Huang, P.; Humphery-Jenner, M.; Powell, R. Cross-border mergers and acquisitions for innovation. J. Int. Money Financ. 2021, 112, 102320. [Google Scholar] [CrossRef]
- Cao, J.; Ellis, K.M.; Li, M. Inside the board room: The influence of nationality and cultural diversity on cross-border merger and acquisition outcomes. Rev. Quant. Financ. Account. 2018, 53, 1031–1068. [Google Scholar] [CrossRef]
- Wangerin, D. M&A due diligence, post-acquisition performance, and financial reporting for business combinations. Contemp. Account. Res. 2019, 36, 2344–2378. [Google Scholar] [CrossRef]
- Zhang, W.; Wang, K.; Li, L.; Chen, Y.; Wang, X. The impact of firms’ mergers and acquisitions on their performance in emerging economies. Technol. Forecast. Soc. Chang. 2018, 135, 208–216. [Google Scholar] [CrossRef]
- García, C.J.; Herrero, B. Corporate entrepreneurship and governance: Mergers and acquisitions in Europe. Technol. Forecast. Soc. Chang. 2022, 182, 121845. [Google Scholar] [CrossRef]
- Dandapani, K.; Hibbert, A.M.; Lawrence, E.R. The Shareholder’s response to a firm’s first international acquisition. J. Bank. Financ. 2020, 118, 105852. [Google Scholar] [CrossRef]
- Malmendier, U.; Moretti, E.; Peters, F.S. Winning by losing: Evidence on the long-run effects of mergers. Rev. Financ. Stud. 2018, 31, 3212–3264. [Google Scholar] [CrossRef]
- Leledakis, G.N.; Pyrgiotakis, E.G. U.S. bank M&As in the post-Dodd–Frank Act era: Do they create value? J. Bank. Financ. 2022, 135, 105576. [Google Scholar] [CrossRef]
- Ferris, S.P.; Sainani, S. Do CFOs matter? Evidence from the M&A process. J. Corp. Financ. 2021, 67, 101856. [Google Scholar] [CrossRef]
- Dong, F.; Doukas, J.A. The effect of managers on M&As. J. Corp. Financ. 2021, 68, 101934. [Google Scholar] [CrossRef]
- Trujillo, A.J.; Dutta, S.; Hasan, M.; Kim, J. Do mergers and acquisitions improve firms’ financial performance? The case of the U.S. generic drug industry. Manag. Decis. Econ. 2019, 41, 10–24. [Google Scholar] [CrossRef]
- Bedi, A. Post Acquisition Performance of Indian Telecom Companies: An Empirical Study. Pac. Bus. Rev. Int. 2018, 11, 2. Available online: http://www.pbr.co.in/2018/august6.aspx (accessed on 3 January 2025).
- Yang, M.; Ai, Q. The post-acquisition performance of cross-border mergers and acquisitions conducted by Chinese firms in the high-tech industries: Profitable or innovative? Thunderbird Int. Bus. Rev. 2021, 63, 355–367. [Google Scholar] [CrossRef]
- Landoni, M. The Quest for Corporate Control: Cross-Border Acquisitions and Foreign Takeovers in Italy, 2005–2015. Businesses 2024, 4, 241–258. [Google Scholar] [CrossRef]
- Rachman, R.; Kartika, D.; Marlina, T. The Effect of Merger and Acquisition on Financial Performance Per Company In Manufacturing Companies Listed On The IDX 2017–2021. J. Ilm. Akunt. Kesatuan 2025, 13, 149–158. [Google Scholar] [CrossRef]
- Celestin, M. The Role of Corporate Mergers and Acquisitions in Financial Performance: Analyzing the Success and Failures of Major M&A Deals. Brainae J. Bus. Sci. Technol. 2022, 6, 930–940. [Google Scholar]
- Aggarwal, R.; Garg, V. Impact of Mergers and Acquisitions on Accounting-Based Performance of Acquiring Firms in India. Glob. Bus. Rev. 2022, 23, 218–236. [Google Scholar] [CrossRef]
- Monaco, E.; Ibikunle, G.; Palumbo, R.; Zhang, Z. The Liquidity and Trading Activity Effects of Acquisition Payment Methods: Evidence from the Announcements of Private Firms’ Acquisitions. Int. Rev. Financ. Anal. 2022, 82, 102187. [Google Scholar] [CrossRef]
- Dogan, B.; Ugurlu, U. Financial Performance of the Target Companies: Before and After Acquisitions. J. Risk Financ. Manag. 2024, 17, 581. [Google Scholar] [CrossRef]
- Sendilvelu, K. Assessing Pre- and Post-Merger Financial Performance: A Global Study of B2B Companies across Four Sectors. Corp. Ownersh. Control 2025, 22, 21–33. [Google Scholar] [CrossRef]
- Wu, K.; Lu, Y.; Li, D. Contingent cash crunch: How do performance commitments affect acquirer liquidity? Res. Int. Bus. Financ. 2025, 73, 102592. [Google Scholar] [CrossRef]
- Mack, C.; Koschnick, C.; Brown, M.; Ritschel, J.D.; Lucas, B. A Panel Data Regression Model for Defense Merger and Acquisition Activity. J. Def. Anal. Logist. 2024, 8, 122–142. [Google Scholar] [CrossRef]
- Adhikari, B.; Kavanagh, M.; Hampson, B. Analysis of the pre-post-merger and acquisition financial performance of selected banks in Nepal. Asia Pac. Manag. Rev. 2023, 28, 449–458. [Google Scholar] [CrossRef]
- Kahil, B. Effects of pre and post-merger and acquisition on the financial performance of an organization. J. Adm. Bus. Stud. 2021, 7, 19–30. [Google Scholar] [CrossRef]
- Zuhri, S.; Fahlevi, M.; Nur Abdi, M.; Dasih, I.; Maemunah, S. The Impact of Merger and Acquisition on Financial Performance in Indonesia. J. Res. Bus. Econ. Educ. 2020, 2, 326–338. [Google Scholar]
- Muhammad, H.; Waqas, M.; Migliori, S. The impact of M&A on bank’s financial performance: Evidence from emerging economy. Corp. Ownersh. Control 2019, 16, 52–63. [Google Scholar] [CrossRef]
- Abbas, Q.; Hunjra, A.I.; Azam, R.I.; Ijaz, M.S.; Zahid, M. Financial performance of banks in Pakistan after Merger and Acquisition. J. Glob. Entrep. Res. 2014, 4, 13. [Google Scholar] [CrossRef]
- Saunders, M.; Lewis, P.; Thornhill, A. Research Methods for Business Students, 6th ed.; Financial Times/Prentice Hall: Harlow, UK, 2012. [Google Scholar]
- Bloomberg Finance L.P. What Is Bloomberg? Available online: https://www.bloomberg.com/company/stories/what-is-bloomberg/ (accessed on 8 February 2024).
- Galariotis, E.C.; Kosmidou, K.; Kousenidis, D.; Lazaridou, E.; Papapanagiotou, T. Measuring the effects of M&As on Eurozone bank efficiency: An innovative approach on concentration and credibility impacts. Ann. Oper. Res. 2020, 306, 343–368. [Google Scholar] [CrossRef]
- Ströbl, A.; Bauer, F.; Matzler, K. The impact of industry-wide and target market environmental hostility on entrepreneurial leadership in mergers and acquisitions. J. World Bus. 2020, 55, 100931. [Google Scholar] [CrossRef]
- Irayanti, L. How mergers and acquisition affect firm performance and its quality. J. Account. Financ. Audit. Stud. 2019, 5, 42–53. [Google Scholar] [CrossRef]
- Haakantu, M.; Phiri, J. Effects of mergers and acquisitions on the financial performance of commercial banks in developing countries—A case of Zambia. Open J. Bus. Manag. 2022, 10, 3114–3131. [Google Scholar] [CrossRef]
- Jallow, M.S.; Masazing, M.; Basit, A. The Effects of Mergers and Acquisitions on Financial Performance: Case Study of UK Companies. Int. J. Account. Bus. Manag. 2017, 5, 74–92. Available online: https://www.researchgate.net/publication/325734958 (accessed on 5 April 2025).
- Achtmeyer, W.F. Strategic Synergies: Fact or Fiction? In The Mergers and Acquisitions Handbook, 2nd ed.; McGraw Hill Professional: New York, NY, USA, 1994. [Google Scholar]
- Huntington-Klein, N. The Effect, 1st ed.; Chapman and Hall: New York, NY, USA, 2021. [Google Scholar] [CrossRef]
- Porter, D.C.; Gujarati, D.N. Basic Econometrics; McGraw-Hill Education: New York, NY, USA, 2008. [Google Scholar]
- Marshall, G.; Jonker, L. An introduction to inferential statistics: A review and practical guide. Radiography 2011, 17, e1–e6. [Google Scholar] [CrossRef]
- R Core Team. R: A Language and Environment for Statistical Computing; R Foundation for Statistical Computing: Vienna, Austria, 2024; Available online: https://www.r-project.org/ (accessed on 5 April 2025).
- Kronthaler, F.; Zöllner, S. Data Analysis with RStudio, 1st ed.; Springer Spektrum: Berlin/Heidelberg, Germany, 2021. [Google Scholar] [CrossRef]
- Tennant, F. Boom Time: Riding the Seventh Great ‘M&A Wave’; Financier Worldwide: Lichfield, UK, 2021; Available online: https://www.financierworldwide.com/boom-time-riding-the-seventh-great-ma-wave (accessed on 5 April 2025).
| Variable | Previous Findings |
|---|---|
| Return on Asset: A firm’s ability to achieve growing returns on its assets holds significant importance. This metric indicates efficiency with which the firm utilizes its assets to generate profits [32]. It is calculated as net income/total asset. | As per Aggarwal and Garg [32], the ROA saw a notable increase in the 3-and 5-year periods following the merger. It exhibited a significant rise of 5% within 3 years post-merger and a more pronounced increase of 1% within the 5-year period post-merger. In contrast, Abbas et al. [42] found a decline in ROA among 8 out of 10 analyzed companies following M&A. |
| Return on Equity: Equity shareholders, as the true proprietors of a firm, shoulder the highest investment risk. Consequently, it becomes paramount for any company to deliver anticipated returns to these stakeholders. This ratio is calculated as net income/shareholder’s equity. | As highlighted by Aggarwal and Gang [32] in their research, the ROE demonstrated a substantial increase over both the 3-year and 5-year periods. In contrast, Abbas et al.’s [42] study revealed a decline in ROE, specifically among the 10 companies analyzed, where the ROE decreased in 7 instances. |
| Operating margin: It is calculated in Bloomberg as operating income/revenue. Following a successful M&A operation there is potential for increased profitability and the operating margin stands out as a prominent and effective indicator for evaluating the efficiency of the M&A operation. | According to Irayanti [47], the operating margin ratio decreases post-M&A. |
| Current ratio: it assesses companies’ capability to fulfill short-term liabilities. It can be calculated by total current assets divided by total current liabilities. | As per Aggarwal and Gang [32], the current ratio experienced a remarkable increase following the merger. Within a 3-year period, the ratio increased by 10%, and over a 5-year span, it showed a notable improvement, rising by 5%. However, in the study conducted by Bedi [27], the overall average variance between the pre- and post-merger periods regarding the current ratio suggests that the liquidity position did not see improvement after the M&A. |
| Quick ratio: It aids in evaluating the post-M&A liquidity status of companies and is computed as (cash and cash equivalents + short-term investments + accounts and notes receivable) divided by total current liabilities [44]. | According to Bedi [27], following the M&A, the average quick ratio declined for 4 out of 5 companies. The total average variance between the pre- and post-merger periods was—0.26, signifying that, on average, the liquidity position of the analyzed companies did not improve. |
| Cash ratio: It is calculated as (cash + cash equivalent)/current liabilities | Haakantu and Phiri [48] employed cash ratios in their study on the post-M&A performance of banks in Zambia to assess company liquidity. The findings indicate an increase in the cash ratio following the merger activity. |
| Total debt-to-total equity ratio: It evaluates a company’s capacity to handle its capital, serving as collateral for corporate debt. It reflects the equilibrium between creditor- financed assets and owner-financed ones. This ratio is influenced by how the merger and acquisition was funded [32]. It can be calculated as follows: total debt/total assets. | Bedi [27] utilized the debt-to-equity ratio to assess the solvency position of companies around M&A transactions. The findings indicated that the solvency position did not improve after the merger; in fact, the debt-to-equity ratio decreased after the M&A event. Aligning with this perspective, Aggarwal and Gang [32] concluded that the debt-to-equity ratio did not show significant improvement after mergers, neither within a 3-year nor a 5-year timeframe. |
| Total debt-to-total asset ratio: it represents the aggregate debt financed by creditors and is utilized to assess the post-M&A solvency of the companies considered. The calculation involves dividing Total Debt by Total Assets. | Abbas et al. [42] observed that in 7 out of 10 cases, the Debt-to-Asset ratio increased when comparing pre- and post-merger data. This suggests an improvement in the solvency position of several companies following the M&A. |
| Liquidity | Solvency | Profitability | ||||
|---|---|---|---|---|---|---|
| Before M&A | Post M&A | Before M&A | Post M&A | Before M&A | Post M&A | |
| Min. | 0.4300 | 0.3533 | 4.555 | 15.02 | −62.327 | −66.187 |
| 1st Qu. | 0.6467 | 0.6500 | 35.490 | 43.46 | 7.133 | 6.368 |
| Median | 0.7750 | 0.7433 | 53.070 | 61.26 | 9.937 | 8.832 |
| Mean | 0.9603 | 0.8269 | 67.321 | 100.81 | 8.225 | 8.420 |
| 3rd Qu. | 0.9850 | 0.8833 | 84.410 | 88.36 | 12.517 | 12.527 |
| Max. | 4.3167 | 2.9633 | 960.860 | 6588.56 | 21.813 | 37.650 |
| Correlation Matrix Pre-M&A | |||
|---|---|---|---|
| Profitability | Liquidity | Solvency | |
| Profitability | 1.00000000 | ||
| Liquidity | 0.02430263 | 1.00000000 | |
| Solvency | −0.18910853 | −0.20628056 | 1.00000000 |
| Correlation matrix post-M&A | |||
| Profitability | 1.00000000 | ||
| Liquidity | 0.07712125 | 1.00000000 | |
| Solvency | −0.49937145 | −0.12728428 | 1.00000000 |
| Profitability Ratios | Before M&A | Post-M&A |
|---|---|---|
| Return on asset | 4.14 | 3.79 |
| Return on equity | 10.8 | 11.9 |
| Operating margin | 9.52 | 9.17 |
| Liquidity ratios | ||
| Current ratio | 1.50 | 1.35 |
| Quick ratio | 0.94 | 0.78 |
| Cash ratio | 0.43 | 0.35 |
| Solvency ratios | ||
| Debt-to-equity ratio | 1.07 | 1.71 |
| Debt-to-total asset ratio | 0.27 | 0.31 |
| Variable | t-Statistic | Degree of Freedom | p-Value | Confidence Interval | Mean of X | Mean of Y |
|---|---|---|---|---|---|---|
| Profitability | 0.23191 | 458.82 | 0.5916 | (−Inf, 1.581411) | 8.420043 | 8.224978 |
| Solvency | 1.1977 | 253.04 | 0.8839 | (−Inf 0.7965563) | 1.0081234 | 0.6732066 |
| Liquidity | −3.0498 | 377.61 | 0.001226 | (−Inf—0.06125929) | 0.8269038 | 0.9602684 |
| Parameter | Estimate | p-Value |
|---|---|---|
| Two_Years_After | −1.7927 | 0.020584 * |
| Two_Years_Before | −1.7864 | 0.020594 * |
| Adidas | 5.3831 | 0.006966 ** |
| Airbus | 5.3838 | 0.007298 ** |
| BASF | 4.9497 | 0.014440 * |
| Bayer | 0.3434 | 0.867403 |
| BMW | 5.0287 | 0.011414 * |
| Brenntag | 5.6299 | 0.005586 ** |
| Continental | 3.3721 | 0.092444 |
| Covestro | 7.9260 | 0.000182 *** |
| DeutschePost | 8.1028 | 5.65 × 10⁻⁵ *** |
| DeutscheTelekom | 5.3587 | 0.007151 ** |
| E.ON | 1.7369 | 0.388412 |
| Fresenius | 5.7748 | 0.004481 ** |
| InfineonTechnology | 8.3248 | 3.10 × 10⁻⁵ *** |
| MercedesBenz | 5.5721 | 0.005497 ** |
| Merck | 8.2031 | 4.58 × 10⁻⁵ *** |
| MTUAeroEngine | 3.7482 | 0.059968 |
| Qiagen | 5.5628 | 0.006176 ** |
| Rheinmetall | 2.9676 | 0.134983 |
| RWE | −3.3392 | 0.123094 |
| SAP | 10.6047 | 1.50 × 10⁻⁷ *** |
| Sartorius | 12.4887 | 5.31 × 10⁻¹⁰ *** |
| SiemensAG | 6.3136 | 0.001897 ** |
| Volkswagen | 2.1681 | 0.282540 |
| F-statistic | 5.557 | 3.328 × 10⁻¹⁶ |
| R-squared | 0.1428 |
| Parameter | Estimate | p-Value |
|---|---|---|
| Two_Years_After | −1.7802 | 0.019058 * |
| Two_Years_Before | −1.9555 | 0.009916 ** |
| Adidas | 4.4944 | 0.003151 ** |
| Airbus | 4.5459 | 0.002371 ** |
| BASF | 4.1245 | 0.006196 ** |
| BMW | 4.1570 | 0.005572 ** |
| Brenntag | 4.8089 | 0.001487 ** |
| Continental | 2.5342 | 0.089585 |
| Covestro | 7.0589 | 2.24 × 10⁻⁵ *** |
| DeutschePost | 7.2650 | 1.32 × 10⁻⁶ *** |
| DeutscheTelekom | 4.5039 | 0.002527 ** |
| Fresenius | 4.9539 | 0.001067 ** |
| InfineonTechnology | 7.4700 | 6.18 × 10⁻⁷ *** |
| MercedesBenz | 4.7342 | 0.001553 ** |
| Merck | 7.3652 | 9.46 × 10⁻⁷ *** |
| MTUAeroEngine | 2.8595 | 0.059907 |
| Qiagen | 4.7419 | 0.001730 ** |
| SAP | 9.7668 | 1.00 × 10⁻¹⁰ *** |
| Sartorius | 11.6339 | 1.53 × 10⁻¹⁴ *** |
| SiemensAG | 5.4927 | 0.000288 *** |
| F-statistic | 6.347 | 3.582 × 10⁻¹⁶ |
| R-squared | 0.1107 |
| Parameter | Estimate | p-Value |
|---|---|---|
| Two_Years_After | −1.76667 | 0.0257721 * |
| Two_Years_Before | −1.94709 | 0.0145446 * |
| Adidas | 3.32439 | 0.0029745 ** |
| BASF | 2.94565 | 0.0155786 * |
| BMW | 2.98462 | 0.0002220 *** |
| Brenntag | 3.62945 | 1.537 × 10⁻⁵ *** |
| Covestro | 5.88590 | 0.0026348 ** |
| DeutschePost | 6.08787 | 3.931 × 10⁻¹³ *** |
| DeutscheTelekom | 3.32917 | 0.0004897 *** |
| Fresenius | 3.77440 | 4.244 × 10⁻⁵ *** |
| InfineonTechnology | 6.29530 | 2.872 × 10⁻¹¹ *** |
| MercedesBenz | 3.55715 | 0.0008803 *** |
| Merck | 6.18814 | 1.200 × 10⁻¹² *** |
| Qiagen | 3.56242 | 0.0086139 ** |
| SAP | 8.58976 | <2.2 × 10⁻¹⁶ *** |
| Sartorius | 10.45917 | <2.2 × 10⁻¹⁶ *** |
| SiemensAG | 4.31323 | 8.000 × 10⁻⁷ *** |
| F-statistic | 6.649 | 4.428 × 10⁻¹⁵ |
| R-squared | 0.1184 |
| Parameter | Estimate | p-Value |
|---|---|---|
| Two_Years_After | −0.07300 | 0.001821 *** |
| Two_Years_Before | 0.05789 | 0.013502 ** |
| Adidas | −0.37681 | 8.65 × 10⁻¹³ * |
| Airbus | −0.64614 | <2 × 10⁻¹⁶ *** |
| BASF | −0.25474 | 1.83 × 10⁻⁶ *** |
| Bayer | −0.35308 | 2.91 × 10⁻¹¹ *** |
| BMW | −0.49977 | <2 × 10⁻¹⁶ *** |
| Brenntag | −0.18550 | 0.000523 *** |
| Continental | −0.51425 | <2 × 10⁻¹⁶ *** |
| DeutschePost | −0.52974 | <2 × 10⁻¹⁶ *** |
| DeutscheTelekom | −0.58210 | <2 × 10⁻¹⁶ *** |
| E.ON | −0.53435 | <2 × 10⁻¹⁶ *** |
| Fresenius | −0.49090 | <2 × 10⁻¹⁶ *** |
| InfineonTechnology | 0.59970 | <2 × 10⁻¹⁶ *** |
| MercedesBenz | −0.41416 | 8.16 × 10⁻¹⁵ *** |
| Merck | −0.44119 | <2 × 10⁻¹⁶ *** |
| MTUAeroEngine | −0.63609 | <2 × 10⁻¹⁶ *** |
| Qiagen | 0.85369 | <2 × 10⁻¹⁶ *** |
| Rheinmetall | −0.43824 | <2 × 10⁻¹⁶ *** |
| RWE | −0.48740 | <2 × 10⁻¹⁶ *** |
| SAP | −0.30038 | 1.36 × 10⁻⁸ *** |
| Sartorius | −0.35453 | 1.54 × 10⁻¹¹ *** |
| SiemensAG | −0.35045 | 8.25 × 10⁻¹¹ *** |
| Volkswagen | −0.48450 | <2 × 10⁻¹⁶ *** |
| F-statistic | 72.79 | 2.2 × 10⁻¹⁶ |
| R-squared | 0.6704 |
| Parameter | Estimate | p-Value |
|---|---|---|
| Two_Years_After | 0.444147 | 0.030806 * |
| Two_Years_Before | 0.111108 | 0.589322 |
| Adidas | 0.216141 | 0.678692 |
| Airbus | 1.012821 | 0.054419 |
| BASF | −0.048649 | 0.927000 |
| Bayer | 0.247948 | 0.637380 |
| BMW | 0.841407 | 0.106122 |
| Brenntag | 0.059153 | 0.911630 |
| Continental | −0.071848 | 0.891350 |
| Covestro | 0.117374 | 0.826626 |
| DeutschePost | 0.203519 | 0.698821 |
| DeutscheTelekom | 0.739502 | 0.156615 |
| E.ON | 0.855136 | 0.101479 |
| Fresenius | 0.178886 | 0.737159 |
| InfineonTechnology | −0.034944 | 0.946601 |
| MercedesBenz | 0.855976 | 0.103924 |
| Merck | 0.101471 | 0.847027 |
| MTUAeroEngine | 0.229786 | 0.659650 |
| Qiagen | −0.002901 | 0.995656 |
| Rheinmetall | 0.059416 | 0.909086 |
| RWE | 2.006923 | 0.000145 *** |
| SAP | −0.066835 | 0.898889 |
| Sartorius | 0.466678 | 0.371185 |
| SiemensAG | 0.167051 | 0.753965 |
| Volkswagen | 0.505686 | 0.340246 |
| F-statistic | 1.842 | 0.007442 |
| R-squared | 0.05093 |
| Parameter | Estimate | p-Value |
|---|---|---|
| Two_Years_After | 0.39047 | 0.0210 * |
| Airbus | 0.86002 | 0.0220 * |
| BMW | 0.65298 | 0.0826 |
| E.ON | 0.68452 | 0.0681 |
| MercedesBenz | 0.70317 | 0.0610 |
| RWE | 1.85412 | 9.03 × 10⁻⁷ *** |
| F-statistic | 6.714 | 5.769 × 10⁻⁷ |
| R-squared | 0.04392 |
| Parameter | Estimate | p-Value |
|---|---|---|
| Two_Years_After | 0.409698 | 0.1365297 |
| Airbus | 0.765875 | 0.0133645 * |
| BMW | 0.562990 | <2.2 × 10⁻¹⁶ *** |
| E.ON | 0.592455 | 0.0002001 *** |
| MercedesBenz | 0.609031 | 7.151 × 10⁻⁸ *** |
Disclaimer/Publisher’s Note: The statements, opinions and data contained in all publications are solely those of the individual author(s) and contributor(s) and not of MDPI and/or the editor(s). MDPI and/or the editor(s) disclaim responsibility for any injury to people or property resulting from any ideas, methods, instructions or products referred to in the content. |
© 2025 by the authors. Licensee MDPI, Basel, Switzerland. This article is an open access article distributed under the terms and conditions of the Creative Commons Attribution (CC BY) license (https://creativecommons.org/licenses/by/4.0/).
Share and Cite
Rufolo, A.; Paientko, T.; Dziergwa, K. M&As and Corporate Financial Performance: An Empirical Study of DAX 40 Firms. FinTech 2025, 4, 43. https://doi.org/10.3390/fintech4030043
Rufolo A, Paientko T, Dziergwa K. M&As and Corporate Financial Performance: An Empirical Study of DAX 40 Firms. FinTech. 2025; 4(3):43. https://doi.org/10.3390/fintech4030043
Chicago/Turabian StyleRufolo, Alessia, Tetiana Paientko, and Katrin Dziergwa. 2025. "M&As and Corporate Financial Performance: An Empirical Study of DAX 40 Firms" FinTech 4, no. 3: 43. https://doi.org/10.3390/fintech4030043
APA StyleRufolo, A., Paientko, T., & Dziergwa, K. (2025). M&As and Corporate Financial Performance: An Empirical Study of DAX 40 Firms. FinTech, 4(3), 43. https://doi.org/10.3390/fintech4030043


