1. Introduction
Various indicators can be used to understand innovation at the organizational or regional level. Although metrics vary, they capture distinct aspects of innovation. Innovative efforts represent inputs and reflect innovation under conditions of uncertainty, as they do not necessarily indicate a concrete innovation [
1]. Expenditures on research and development (R&D) and technological cooperation agreements fall into this category.
On the other hand, outputs are actual technological results, that is, the realization of innovative efforts. The development of new products or services are examples, as well as intellectual protection. The number of products generated through new technologies and the volume of trademark and patent registrations are key indicators in this category. Among them, patent registrations are considered some of the most robust indicators for measuring technological innovation, both at the economic level and at the firm level [
2].
In particular, patent data undergo a rigorous evaluation process by official institutions. The verification is based on international guidelines, since a patent application requires a detailed description of the invention or utility model, the justification for claiming patent protection, and technical drawings when necessary. The examination phase involves a formal review based on legal requirements and usually takes a long period before the final decision. As a result, a patent record conveys characteristics related to the geography, history, and technological details of inventions [
3].
Patent data are a valuable source for both scientific and practical purposes. Applications include the analysis of technological trends, inventor and researcher collaboration networks, knowledge diffusion, and the measurement of innovation by sector or country [
4,
5]. In addition, public policies can be designed or assessed using these indicators. Strategies for investment in technology and innovation, research funding, mapping regional technological capabilities, and decision-making regarding technology transfer and intellectual protection are some examples [
6,
7]. Furthermore, there is empirical evidence that examines the effects of patents on firms’ financial performance, both in the short and long term [
8].
PATSTAT (Patent Statistical Database) is an international database maintained by the European Patent Office (EPO), the agency responsible for the analysis and registration of patents in Europe. PATSTAT includes standardized bibliographic data on patent applications, publications, and citations across numerous countries, including those in Europe.
Despite the growing volume of patent filings and publications in a reliable source such as the EPO, the impact of PATSTAT’s use in the scientific community remains underexplored, particularly in areas related to e-commerce, digital technologies, and the digital transformation of businesses. In this context, scientific publications can serve as a guide for developing management strategies and decision-making in firms, universities, and public policy initiatives.
Therefore, this research aims to conduct a detailed bibliometric evaluation of the PATSTAT database. To achieve this goal, the proposed method includes several analyses, such as authorship network visualizations, temporal thematic evolution, the identification of the most relevant journals and authors, and the mapping of production by country, author, affiliation, and keywords, among others. The analyses are conducted using VosViewer and the Biblioshiny/Bibliometrix packages in RStudio, which are specifically designed for bibliometric studies.
A comprehensive understanding of the scientific use of patent data enables the identification of knowledge domains that most frequently engage with PATSTAT, the visualization of emerging technological trends, and the mapping of future innovation opportunities. It also allows the identification of key researchers, journals, and collaborative networks, particularly in Europe. PATSTAT is a strategic resource for studies on innovation systems, intellectual property, and digital transformation. From a practical standpoint, a bibliometric analysis helps reveal the structure of scientific collaboration and the direction of research efforts in technology-intensive fields, supporting a broader understanding of innovation dynamics in the digital economy.
The article is structured into four sections, in addition to the introduction and conclusion. The first presents the methodological approach, the second outlines the results, followed by the discussion, and finally the limitations.
2. Methodological Approach
2.1. Selection Procedures
A bibliometric analysis requires the collection of relevant academic articles from databases that offer wide coverage, disciplinary breadth, and high scientific quality. The selected databases were Web of Science (WoS), Scopus, Wiley, Emerald, and Springer Nature. The use of multiple databases aimed to broaden the research scope and identify complementary contributions across them [
9,
10,
11].
Searches within these journal databases were conducted using only the term “PATSTAT” in order to capture any application of this patent database. However, the searchable fields varied across the five selected platforms. In WoS, the “topic” field was selected, which includes title, abstract, keyword plus, and author keywords, specifically within the Web of Science Core Collection. In Scopus, the field that combines article title, abstract, and keywords was used. In Wiley, three separate queries were conducted—one for the abstract field, one for the title, and another for keywords—whose results were aggregated. In Emerald, two queries were run for the title and abstract fields, later combined into a single list.
Lastly, Springer Nature differs from the other four journal databases. The search option allows querying either by title or full content (keywords field). Given this structure, the query was executed using the term in any part of the article, and to ensure equivalence with the other databases, each article was manually checked to verify whether the term appeared in at least one of the three standard fields (title, abstract, or keywords). Therefore, the strategy for this database was divided into two phases. In the identification stage, the total number of articles containing the term anywhere in the text was considered. During the screening stage, the articles were assessed based on exclusion criteria and content review of specific sections to ensure alignment with the final sample, consistent with the other databases. Despite the different initial filter used for Springer, this procedure ensured reproducibility, allowing future researchers to replicate the search without needing prior identification of where the term appears in each document retrieved by the search tool.
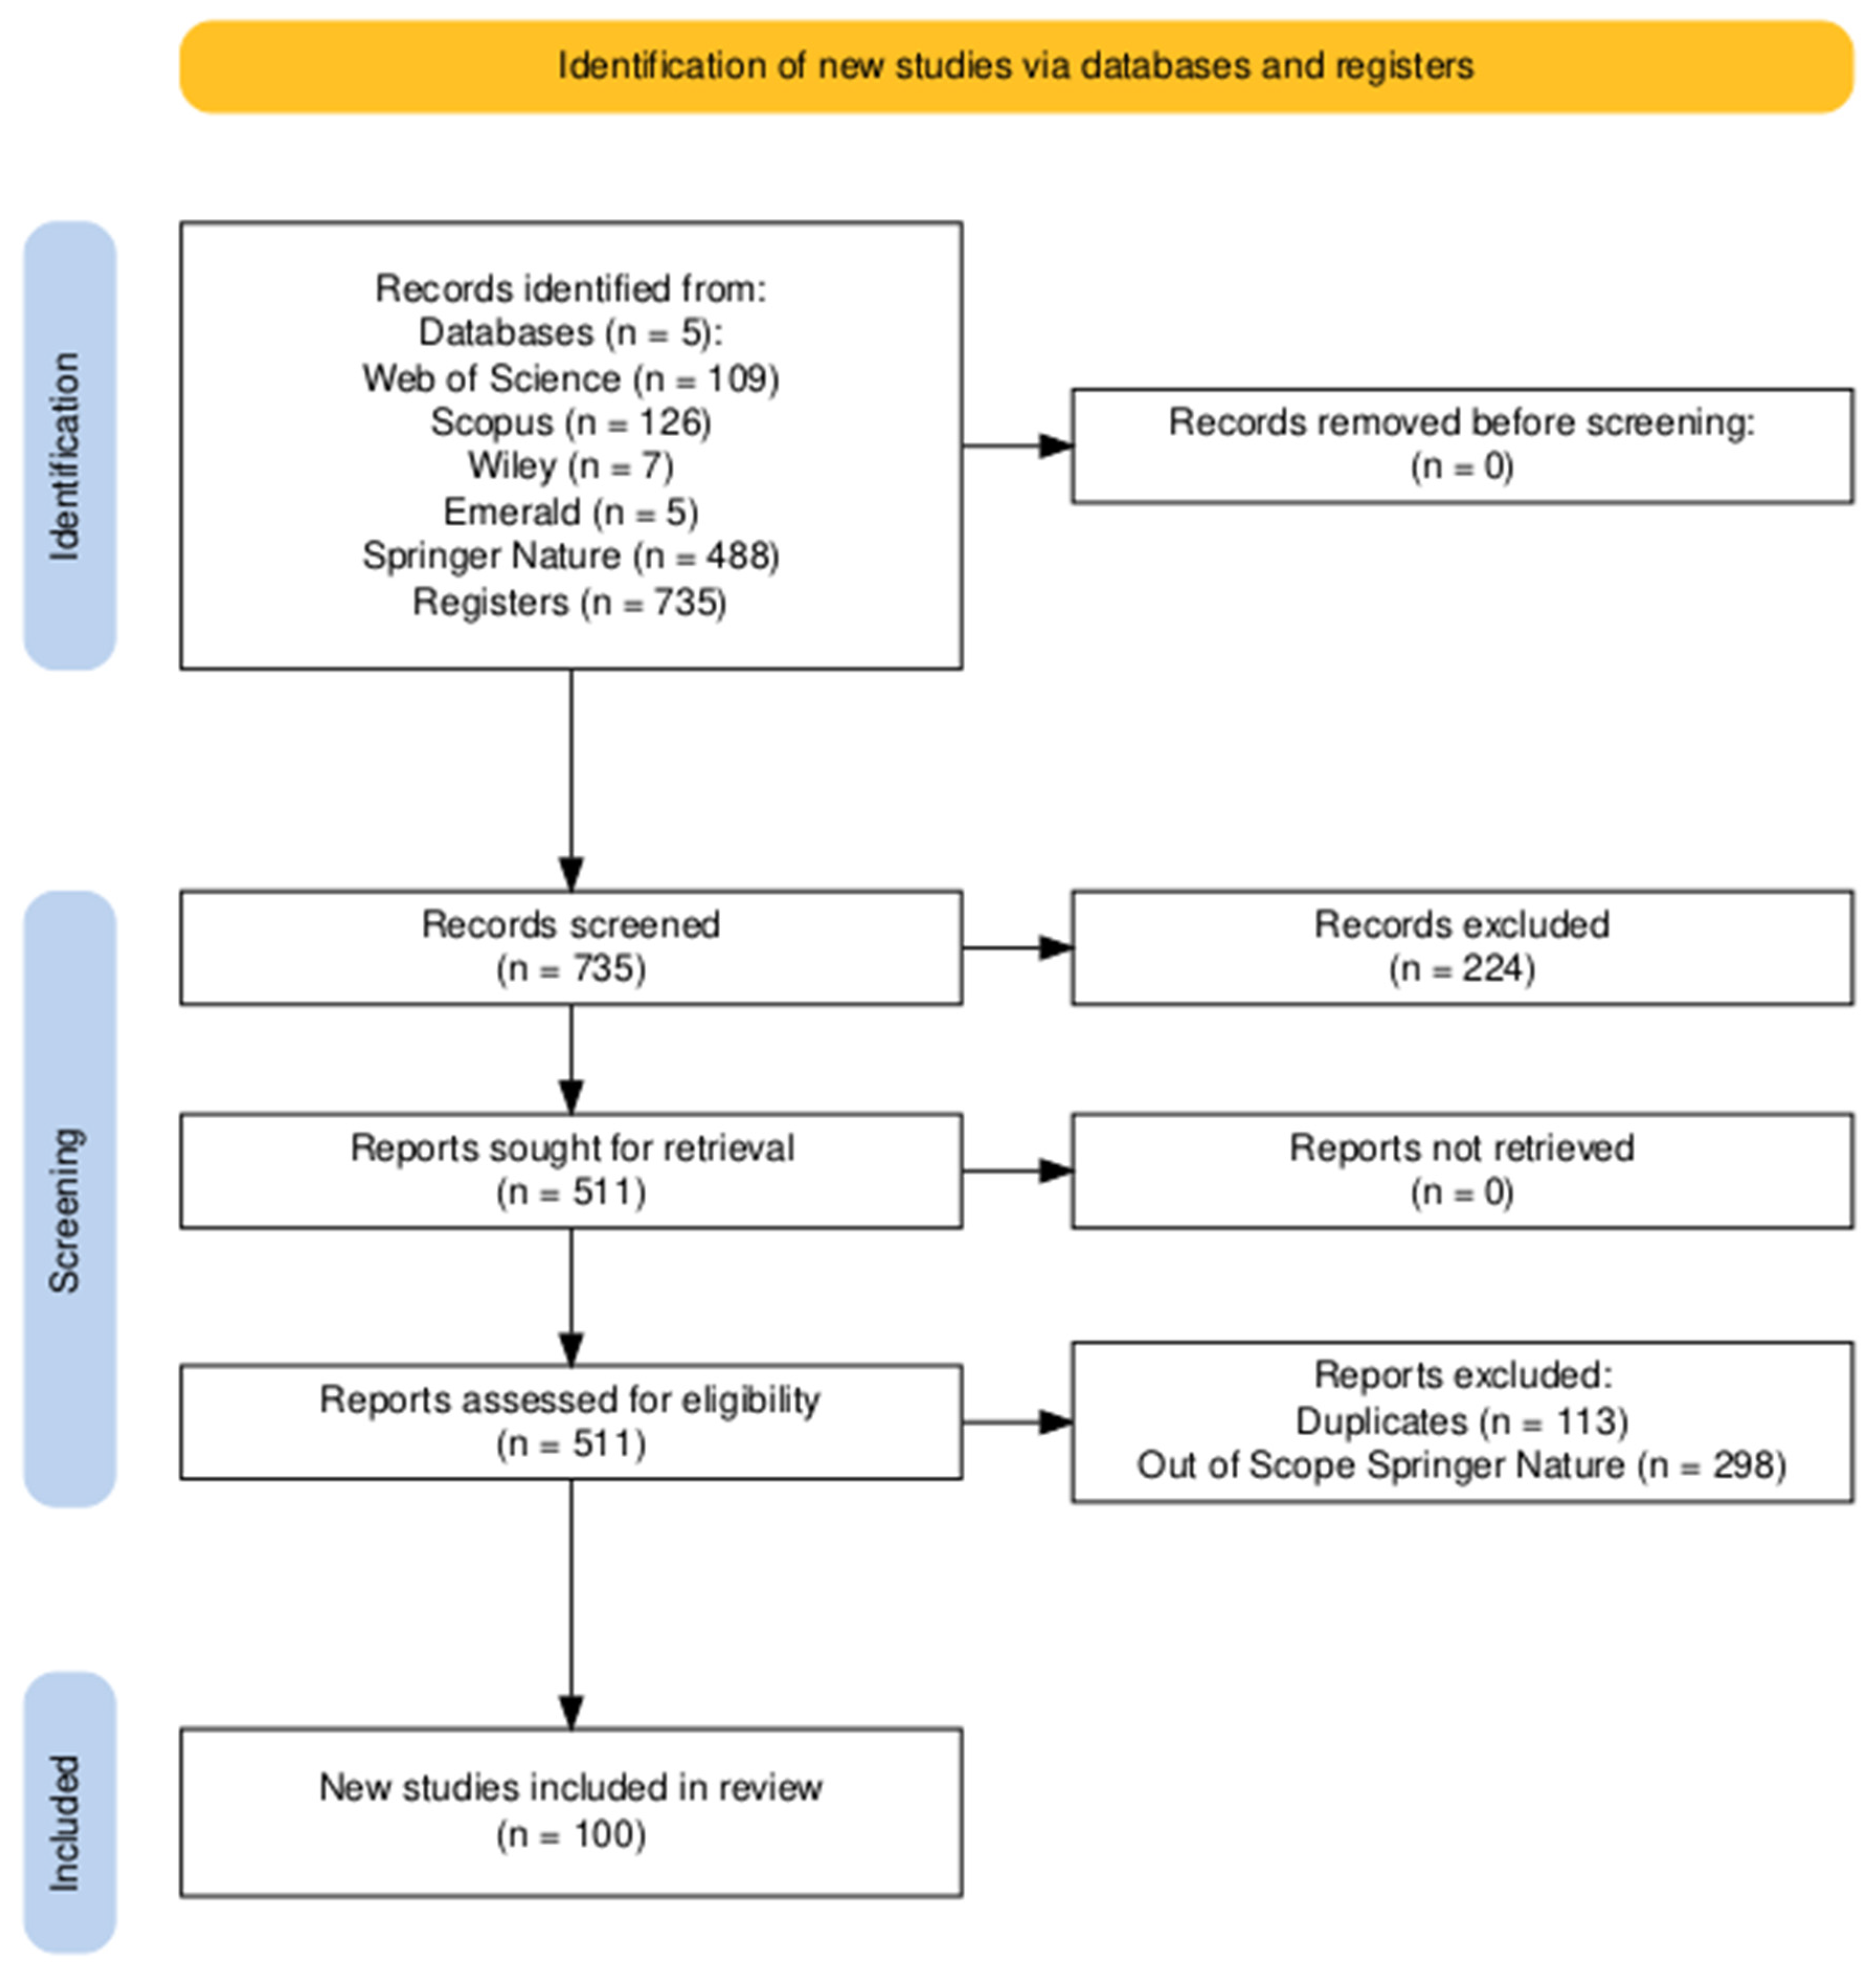
The PRISMA 2020 protocol (Preferred Reporting Items for Systematic Reviews and Meta-Analyses) was adopted as a framework to ensure research rigor, transparency, and reproducibility. PRISMA is suitable across various scientific domains, especially recommended for bibliometric analyses and systematic literature reviews, and widely employed in the academic literature. After defining the search term, the identification stage of the protocol includes a series of inclusion criteria without restrictions:
Using these parameters, the initial search retrieved a total of 735 results: 109 from WoS, 126 from Scopus, 7 from Wiley, 5 from Emerald, and 488 from Springer. The following stage involved applying two exclusion criteria:
- 9.
Only documents classified as journal articles, reviews, data papers, early access, and earlycite were included;
- 10.
Only English-language studies were retained.
Therefore, scientific works such as books, book chapters, and conference proceedings were excluded from the sample. This approach aims to include scientific contributions that have undergone a rigorous peer-review process as a prerequisite for publication. While gray literature is often recommended to broaden research scope and explore emerging topics, peer-reviewed articles emphasize more sophisticated approaches, originality, and research relevance in the academic field.
Additionally, non-English articles were excluded to standardize the sample, as English is considered the universal language of science. No time period restrictions were applied, and all fields of science were considered in the data collection. The collection and exclusion phases, based on the defined filters, are summarized in
Figure 1.
After applying the exclusion filters, 511 articles were identified. Of these, 88 originated from WoS, 90 from Scopus, 6 from Wiley, 5 from Emerald, and 322 from Springer Nature. However, at this stage, the term “PATSTAT” was manually verified in the Springer Nature records, and only those that included the term in the “title,” “abstract,” or “keywords” sections were retained. Consequently, the Springer sample was reduced to 24 articles, which lowered the total number of articles across the five databases to 213.
Once the study selection in each database was finalized, the next step involved extracting metadata in individual files from each source. The file formats were as follows: bibplain text file (Wiley), BibTeX (WoS and Scopus), CSV (Springer Nature), and RIS (Emerald). Data collection took place on 24 and 25 May 2025.
With this final composition, it became possible to identify duplicate articles across the databases. Using the reference management software Zotero, the number of unique articles was determined to be 100, meaning that 113 duplicate entries were excluded at this stage.
The duplicate verification process revealed that the Scopus database contained 94 unique articles—the highest number among the five databases. Therefore, Scopus was designated as the master database, while WoS contributed four additional articles, Springer and Emerald one each, and Wiley none. This indicates that all articles listed in Wiley were already included in Scopus under the defined search terms and criteria, while only a small portion of articles from WoS, Springer, and Emerald were not available in Scopus.
2.2. Method of Analysis
Bibliometric analyses consolidate descriptive and statistical information based on metadata from journal databases. This method allows researchers to map the development of academic fields, understand the structure and dynamics of scientific domains, identify trends and thematic evolution, and evaluate the influence of authors and publications, as well as how they collaborate [
13,
14,
15,
16,
17].
To fulfill the research objective, two bibliometric tools were used in combination. VOSviewer enables the visualization of bibliometric networks, while Biblioshiny and Bibliometrix support visual and statistical analyses. Bibliometrix is an R package that provides functions for bibliometric analysis, and Biblioshiny is a graphical interface built on this package that allows researchers to bypass coding in R. In this study, the term “Bibliometrix” is used to refer to both tools.
The joint use of VOSviewer and Bibliometrix provides more robust and complementary analyses. VOSviewer stands out for its intuitive visualization of co-authorship networks, keyword co-occurrence, and bibliographic coupling using interactive graphs. Meanwhile, Bibliometrix offers deeper analytical capabilities by generating classic bibliometric indicators, temporal analyses, and diverse reports, including visual maps to synthesize relationships. By integrating these approaches, the study enhanced the understanding of the structure, evolution, and collaboration patterns, overcoming the limitations of using each tool in isolation.
Each of the five journal databases has a relatively distinct metadata structure, which affects how the tools process and import data. Refs. [
11,
18,
19] discuss the challenges involved in combining multiple bibliographic sources. Merging and cleaning bibliometric datasets for use in tools such as VOSviewer and Bibliometrix can be demanding for researchers [
19].
The authors of the above references propose an exercise to merge metadata from Scopus and WoS, which was replicated in this research. They define five stages for merging: (1) searching bibliometric data, (2) exporting bibliometric data, (3) combining bibliometric data, (4) cleaning bibliometric data, and (5) finalizing the bibliometric dataset. Stages (1) and (2) were already addressed in the selection procedures section, which detailed the strategies for identifying articles and generating the dataset.
For stage (3), [
19] discusses two alternative approaches. The Bibliometrix package requires RStudio (or base R) coding to read and merge the individual files into a single, standardized file that removes duplicates. Alternatively, Biblioshiny allows datasets to be combined through its graphical interface, where column structures can be manually aligned and a new dataset generated. However, in this second option, duplicate articles must be manually removed. The authors emphasize that regardless of the approach, cross-checking for duplicates is a necessary part of due diligence to ensure maximum accuracy. Both approaches should yield the same result.
Stages (4) and (5) involve checking for inconsistencies in terminology, spelling errors, column labels, and structural mismatches. After completing these steps, the unified file can be imported into the tools for bibliometric analysis. This merged file is more restrictive, as columns without a counterpart in the other database are excluded [
19].
When following the steps proposed by the authors, the file generated in this study exhibited partial inconsistencies when read by both tools. Several factors may explain this: (a) duplicated records in fields with different labels, (b) different export structures across databases, (c) special characters causing field corruption, (d) inconsistent formatting of shared fields, and (e) potential issues during file conversion in RStudio. Although these issues do not prevent the performance of core analyses in either Bibliometrix or VOSviewer, they limit access to a range of advanced functions, especially in VOSviewer.
To expand the scope and depth of the bibliometric analyses, this study employed two sample groups. The analyses conducted in Bibliometrix included articles from both Scopus and WoS, totaling 99 of the 100 unique articles identified across the five databases. In contrast, for VOSviewer, due to the extensive limitations imposed by the merged dataset, only the Scopus file was used. That dataset comprised 94 articles, representing 94% of the complete sample. This decision ensured a broader analytical reach while preserving a high level of representativeness.
2.3. Criteria for Selecting Bibliometric Techniques
In general, bibliometric analyses are used to diagnose the direction of developments in the literature, quantify temporal evolution, aggregate scientific outputs by journal, and map the spatial distribution within a given theme. These analyses are appropriate for the context of various studies in the literature, as they provide a broad overview of the scientific landscape. However, they often fail to incorporate structural factors, such as the interpretation of key actors in the field and the methods or tools employed in research agendas.
In contrast, this study considered a patent database as its central element, which required an understanding of specific technical characteristics, unlike studies focused on thematic subjects. This perspective changed the profile of the bibliometric analysis by incorporating the role of authors and research centers as important analytical components, complementing traditional bibliometric metrics. As a result, the level of depth in the use of the PATSTAT database was enhanced. The proposed structure was based on ten distinct levels of analysis, as shown in
Table 1.
In line with the study’s objective, the selected bibliometric techniques aimed to address specific analytical questions, such as: Which scientific areas most frequently employ PATSTAT? Do different research domains adopt distinct approaches when using this patent database? These questions were operationalized through the techniques summarized in
Table 1, which included mapping subject areas, co-occurrence of keywords, and the identification of software and methodological terms. Rather than being formulated as hypotheses or open-ended research questions, these dimensions were integrated into the bibliometric framework adopted in this study.
To accomplish these steps, both software tools were employed; however, when analyses overlapped, the one offering greater analytical and interpretative depth was prioritized to ensure a more detailed examination.
3. Results
3.1. Annual Scientific Production
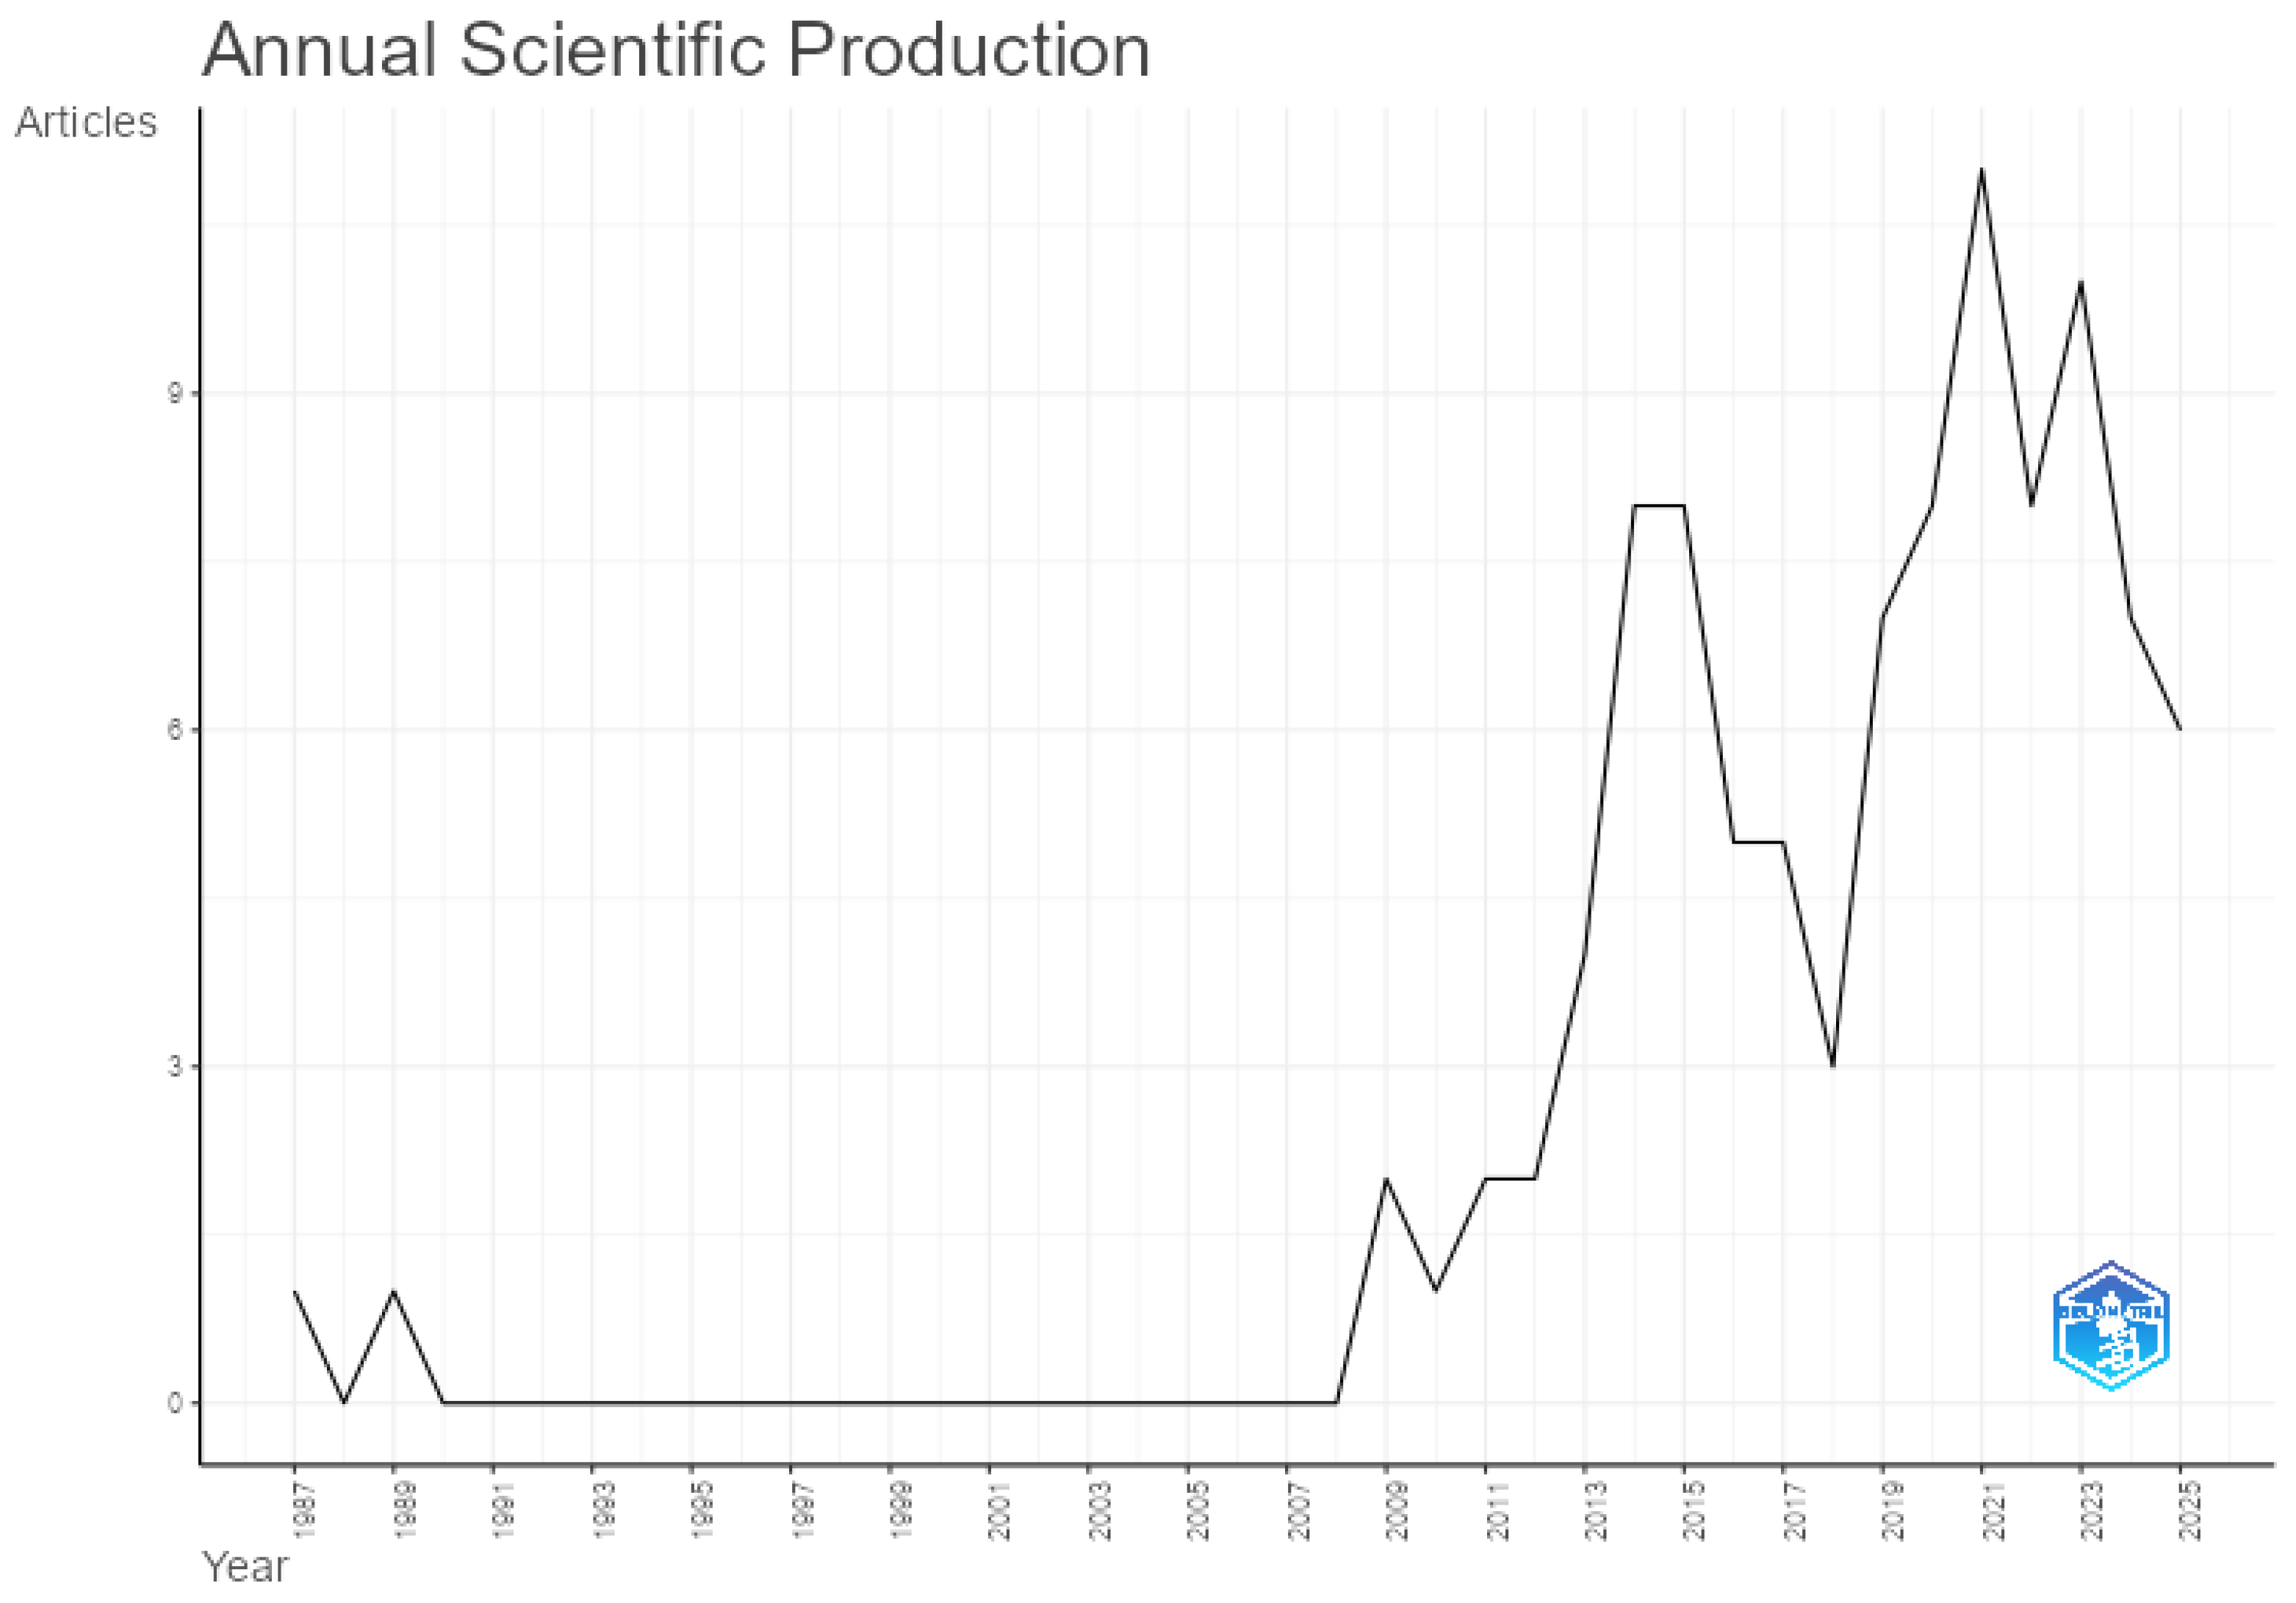
The dataset comprised 94 articles published over a span of 38 years (1987–2025). The distribution of scientific production over time could be segmented into three distinct phases, as shown in
Figure 2. Between 1987 and 2008, publication levels were minimal, with only two articles identified. This indicates that research using PATSTAT data was still in its early stages or had limited accessibility for users.
Subsequently, between 2009 and 2015, there was a growth phase with a relatively consistent level of publications, particularly in 2014 and 2015, which each recorded eight articles. The final phase spanned from 2016 to 2025, representing a period of maturity, with a minimum of three articles published annually. The year 2021 showed a peak with 11 articles, but interest in the topic has remained strong, even in 2025 (the dataset included records up to May 2025), and since 2019, at least six articles have been published each year.
This sustained level of publication suggests a consolidation of PATSTAT as a relevant source for empirical research in innovation studies. The increase in output from 2016 onward may reflect a growing academic and institutional interest in patent data for evaluating technological trends, research and development outcomes, and innovation impacts, dimensions that are also reflected in the thematic structure of the field, as discussed later in the thematic map.
Overall, the temporal pattern suggests that the field began to attract academic attention in the 2010s, consolidating its relevance in more recent years. The continued production in 2024 and 2025 indicates that the use of PATSTAT data remains current and may continue to expand.
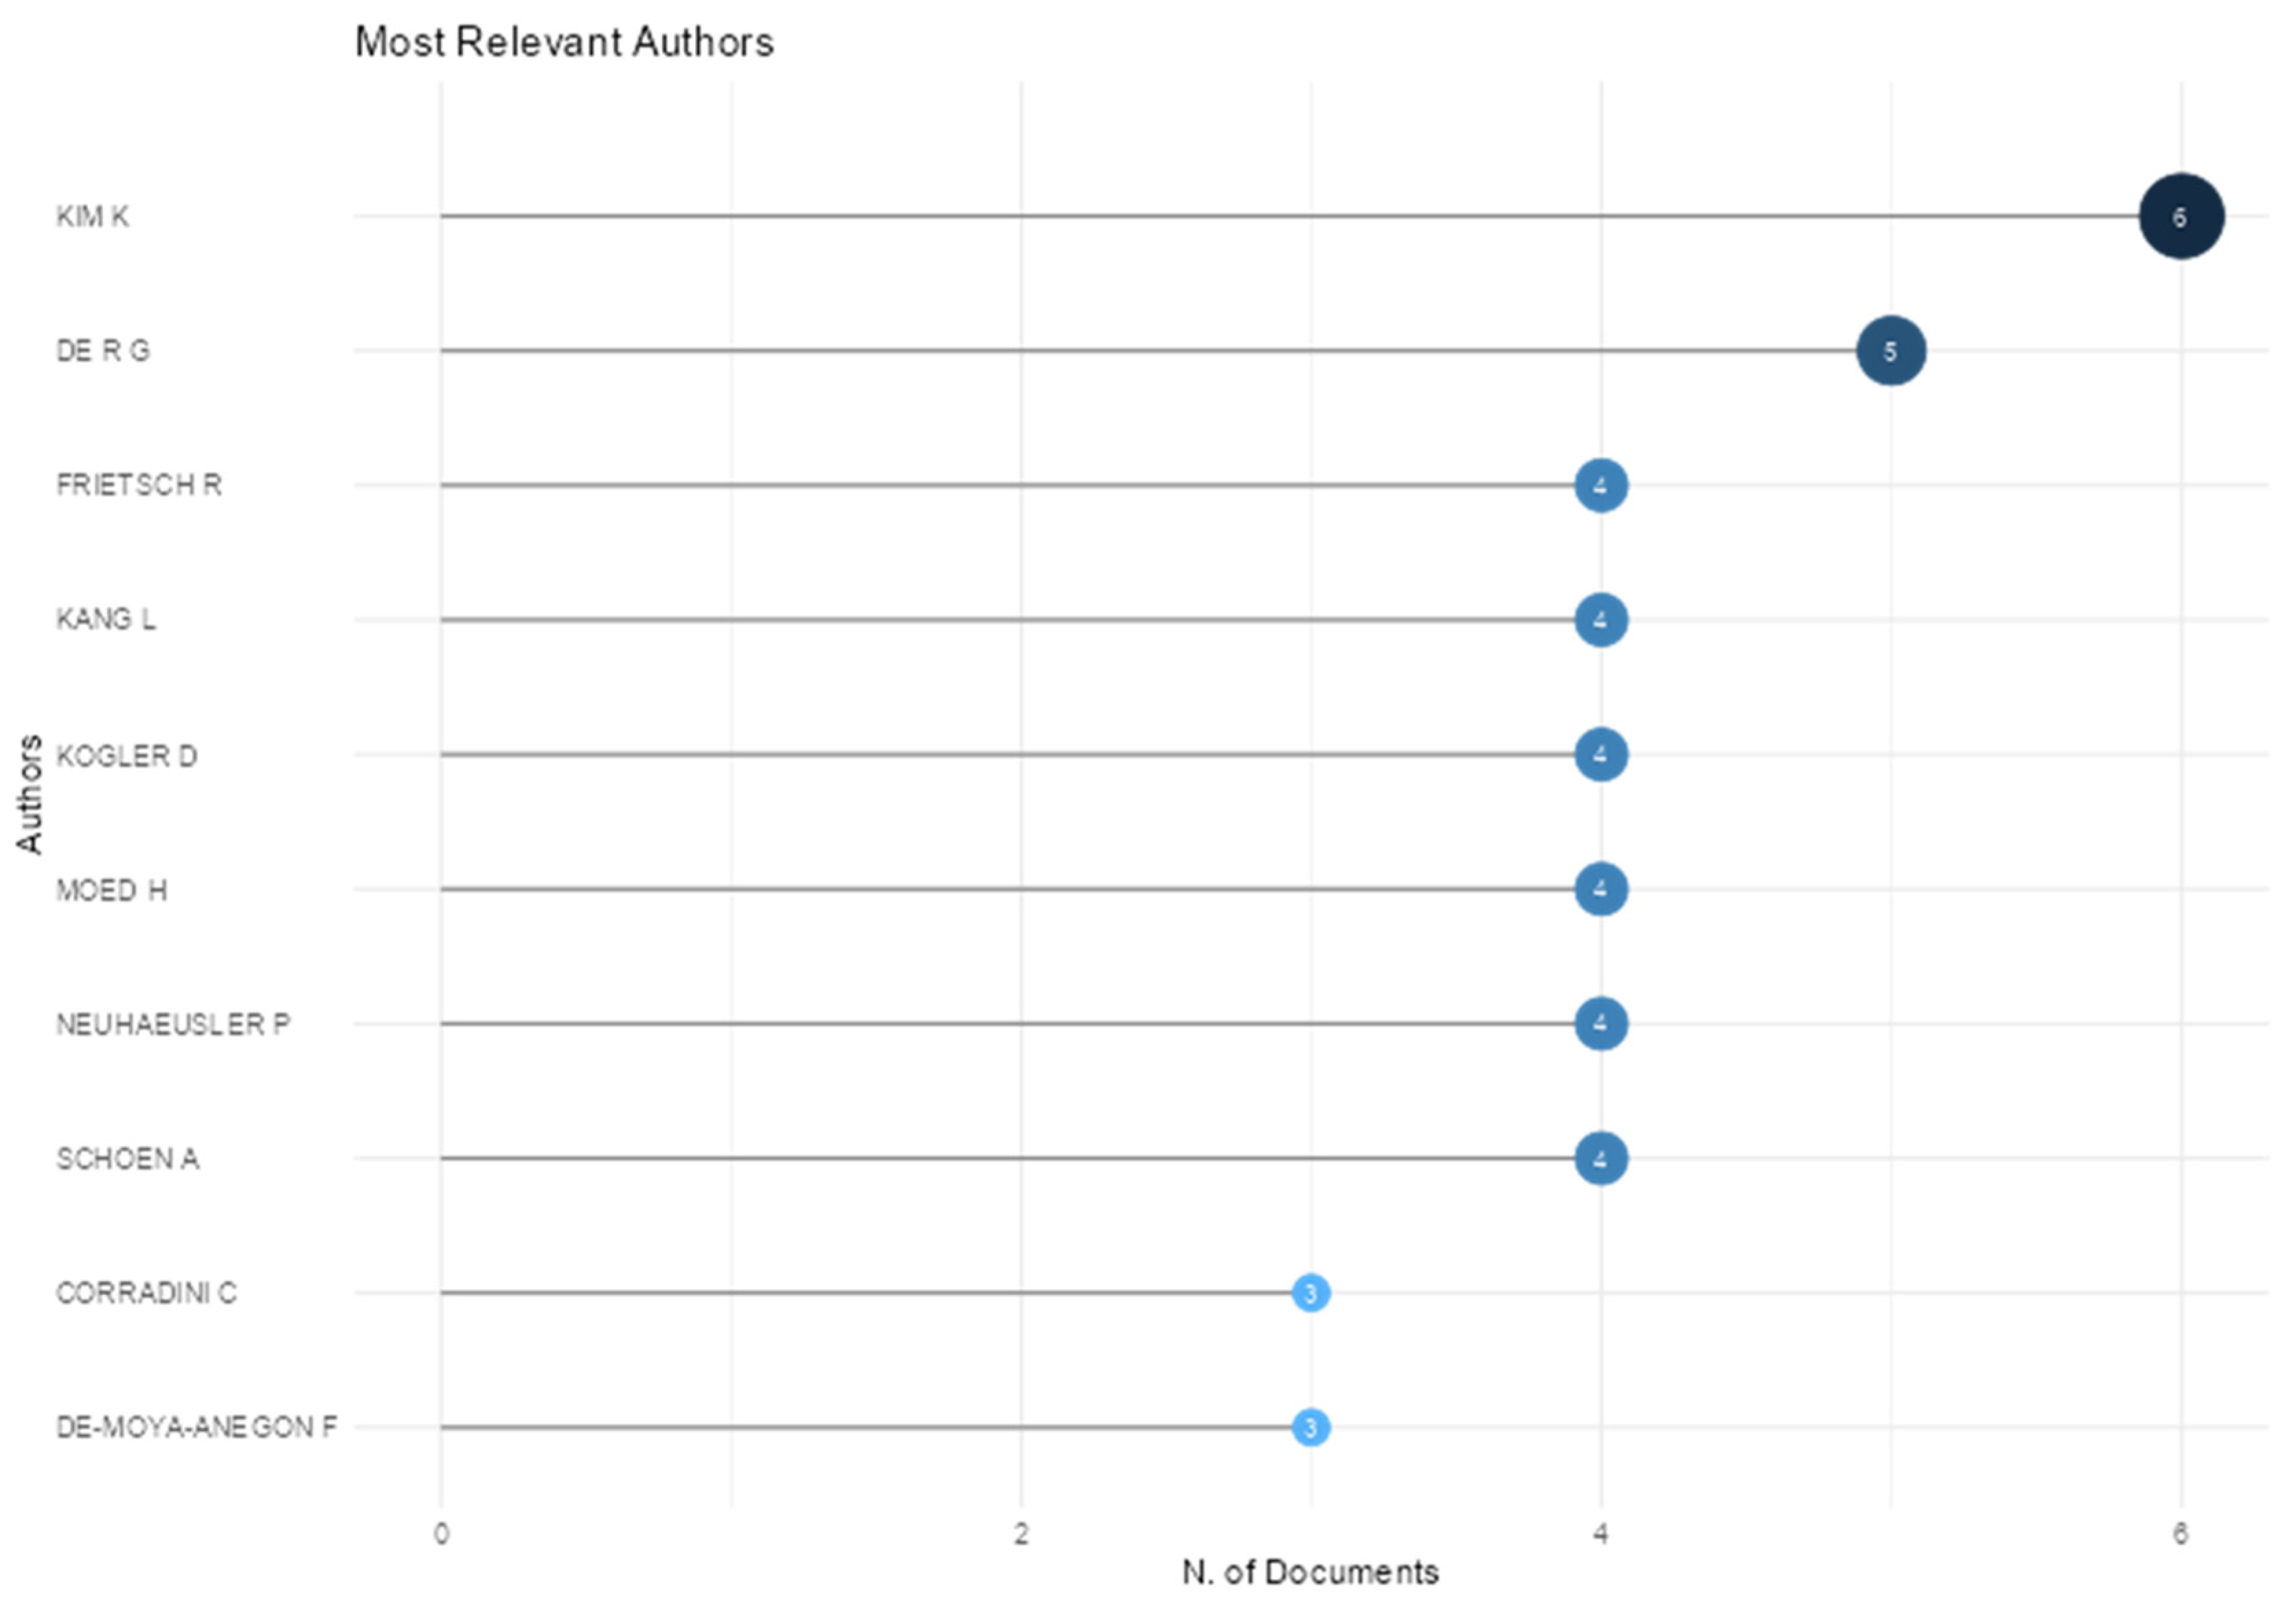
3.2. Most Relevant Authors
The most relevant authors are shown in
Figure 3, based on the number of publications in the combined dataset (WoS and Scopus). The highest number of publications was observed for Kim K (six articles) and De R G (five articles), followed by a group of six authors with four publications each.
Bibliometrix also calculates the number of Fractionalized Articles (FA) metric. This indicator assigns each article a value of one (representing one unit of production), which is equally divided among all co-authors. For example, a single-authored article receives a score of 1, whereas an article with four authors assigns a score of 0.25 to each contributor. Therefore, the lower the FA value, the higher the degree of co-authorship for that researcher. Based on this metric, the standout authors were Corradini C (FA = 2.0 with three articles), De R G (FA = 1.866 with five articles), Kim K (FA = 1.533 with six articles), and authors Csefalvay Z and Martinez C, both scoring 1.5 with two articles each.
Thus, scientific output was concentrated among a few highly productive authors, such as Kim K and De R G, though with a strong component of co-authorship. On the other hand, the long tail distribution included 12 authors with FA = 1.0, while 223 authors recorded FA < 1.0, reinforcing a pattern of wide authorship dispersion.
The long tail distribution aligned with Lotka’s law of author productivity, illustrated in
Figure 4, which describes the distribution of authors by number of published articles. The results suggest that only a few authors are highly productive, while most publish only once. According to the ranking, 174 authors (80.55%) published a single article, 30 authors (13.88%) published two, 4 authors (1.85%) published three, 6 authors (2.77%) published four, 1 author (0.46%) published five, and finally, 1 author (0.46%) published six articles.
When comparing the observed empirical distribution with the expected theoretical proportions according to Lotka’s law, the observed pattern aligned with theoretical predictions, reinforcing that the field follows the typical authorship concentration pattern found in the scientific literature. In other words, most researchers contribute only a single study, while a small group of highly productive authors dominates the field—typical of emerging or interdisciplinary research domains.
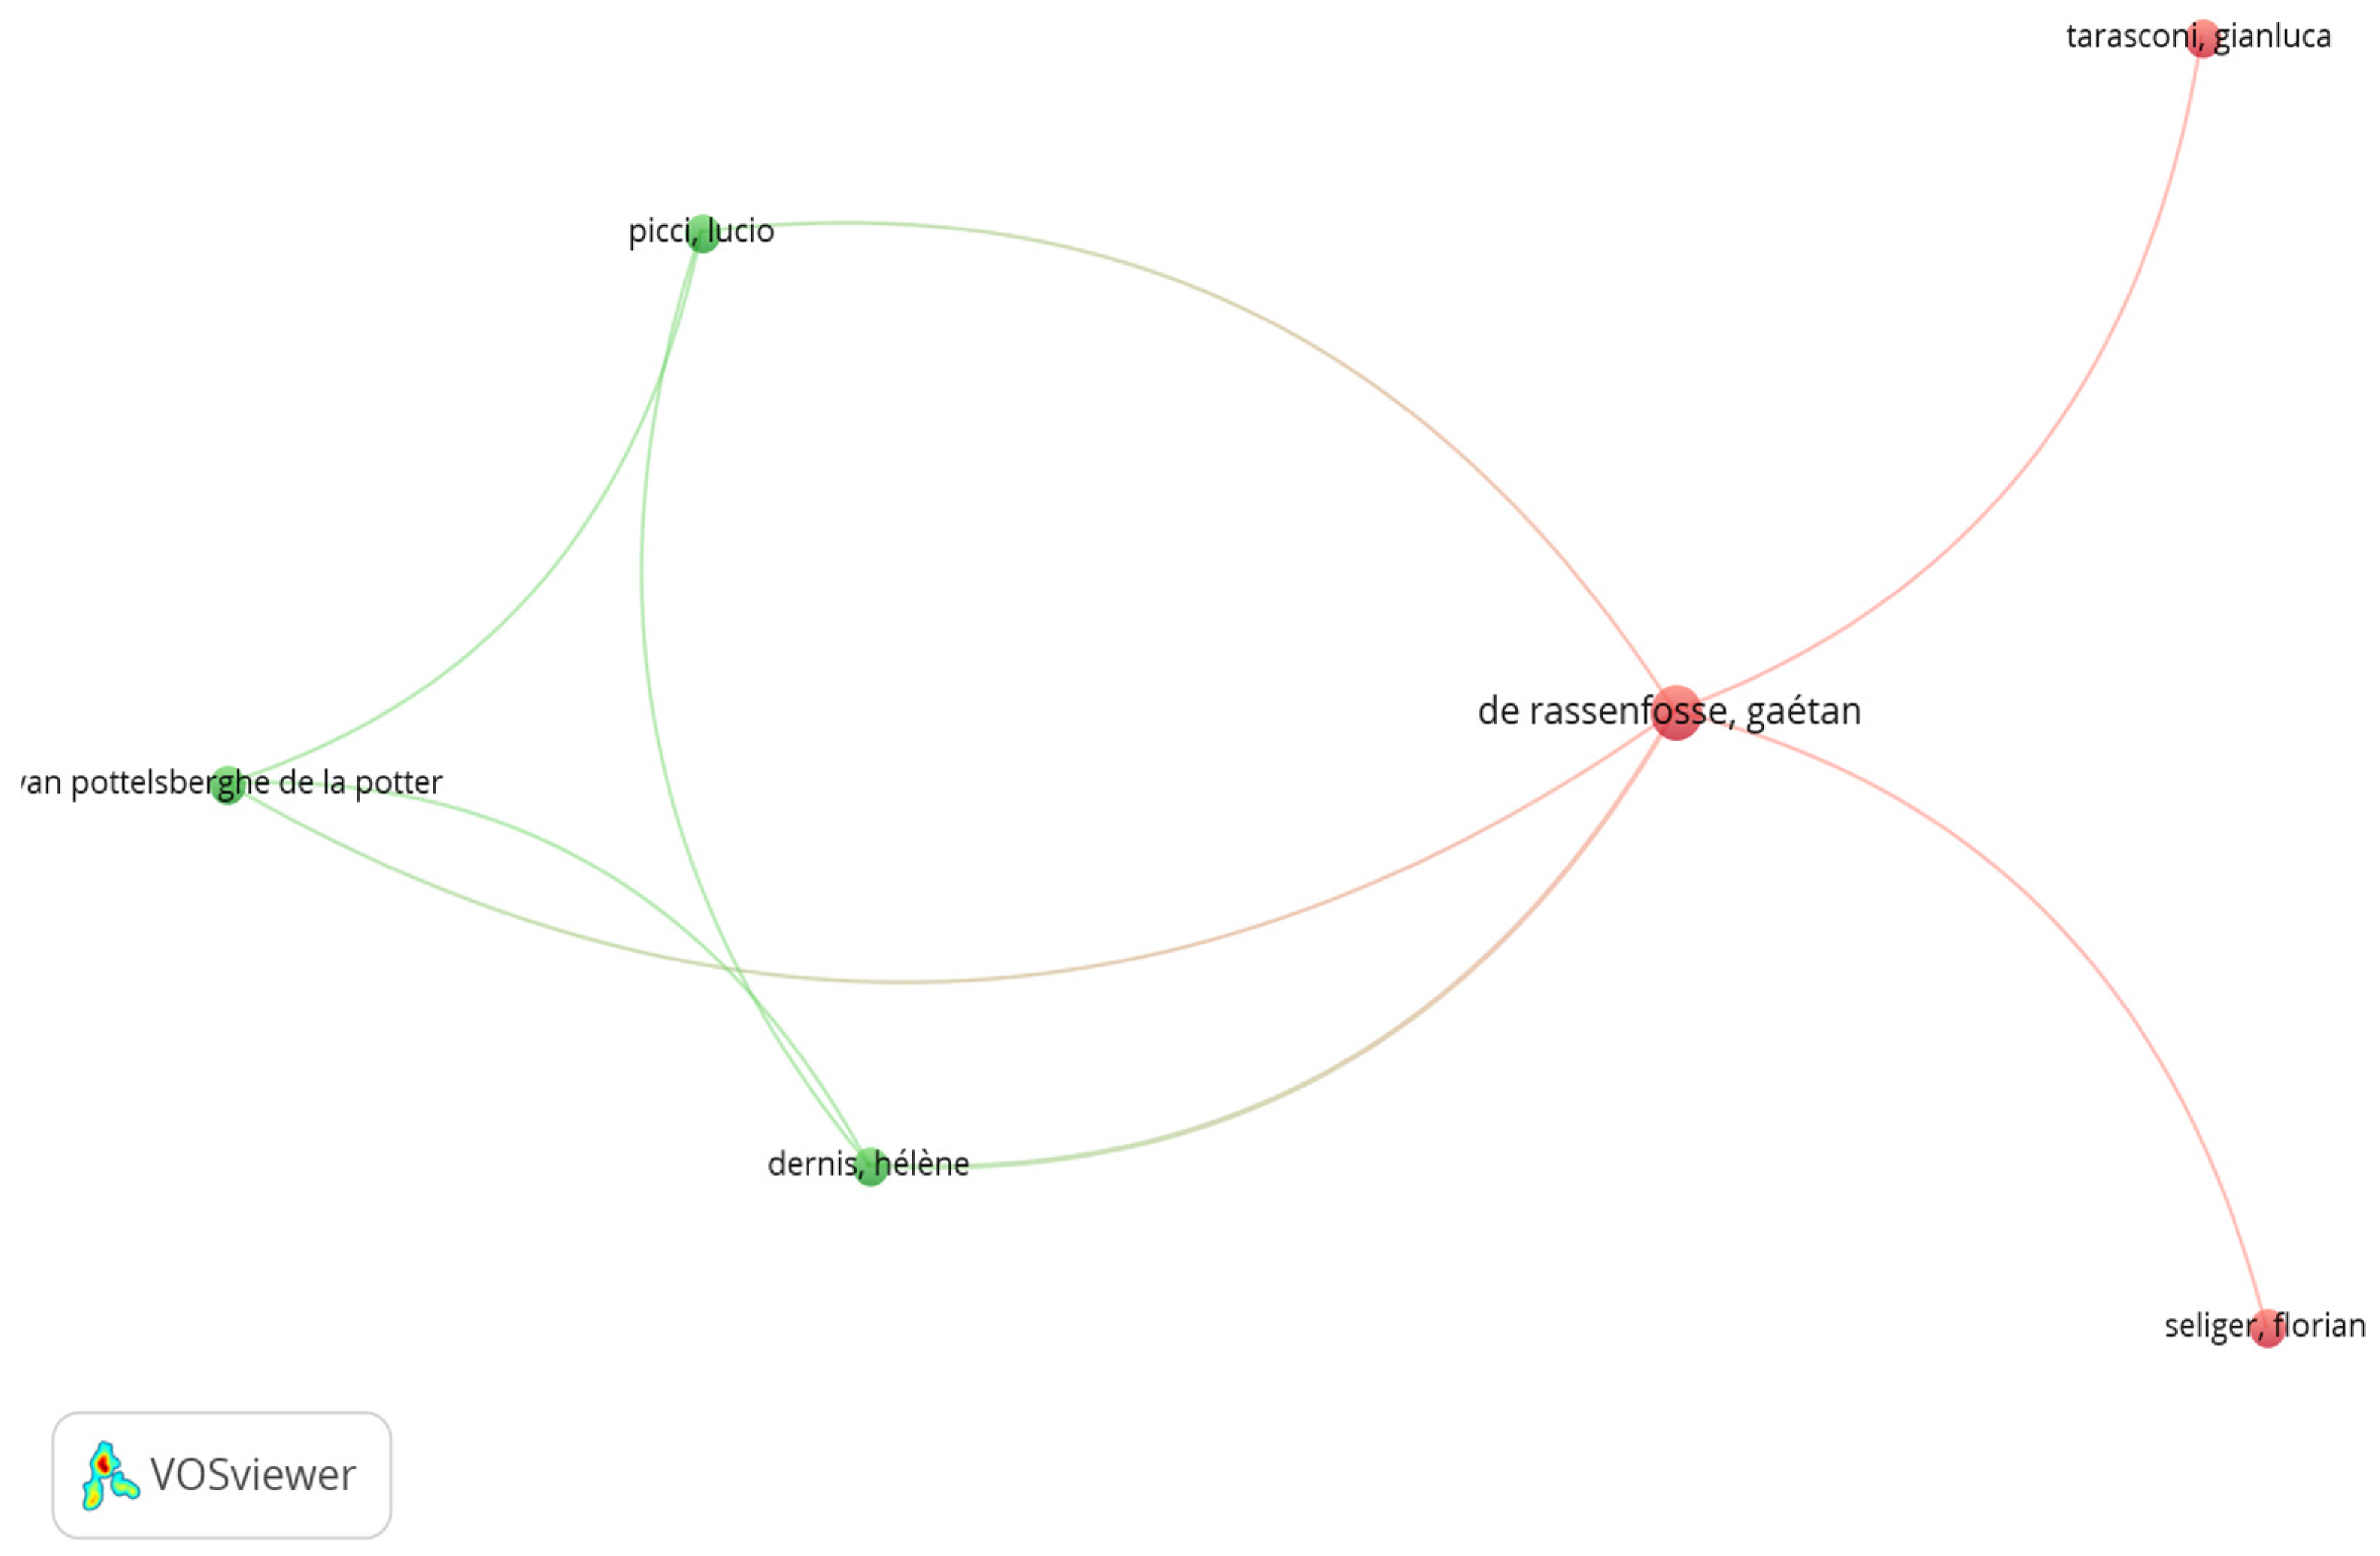
3.3. Co-Authorship
The co-authorship analysis allows for the mapping of collaborative relationships in scientific publications and highlights the joint presence of authors in the same article. Each node represents an author, and each link between nodes indicates that the connected authors have co-authored at least one article together.
The map, illustrated in
Figure 5, highlights two distinct collaboration clusters connected by a central researcher: Gaétan de Rassenfosse. The author serves as the linking node between two groups—one more consolidated, involving Lucio Picci, Hélène Dernis, and Bruno van Pottelsberghe de la Potter, with strong internal ties. The other group is more dispersed, comprising associations with Gianluca Tarasconi and Florian Seliger, which occur only through De Rassenfosse. This network structure positions Rassenfosse as a broker between different research networks, acting as the sole point of connection among the collaborations.
3.4. Institutions and Countries
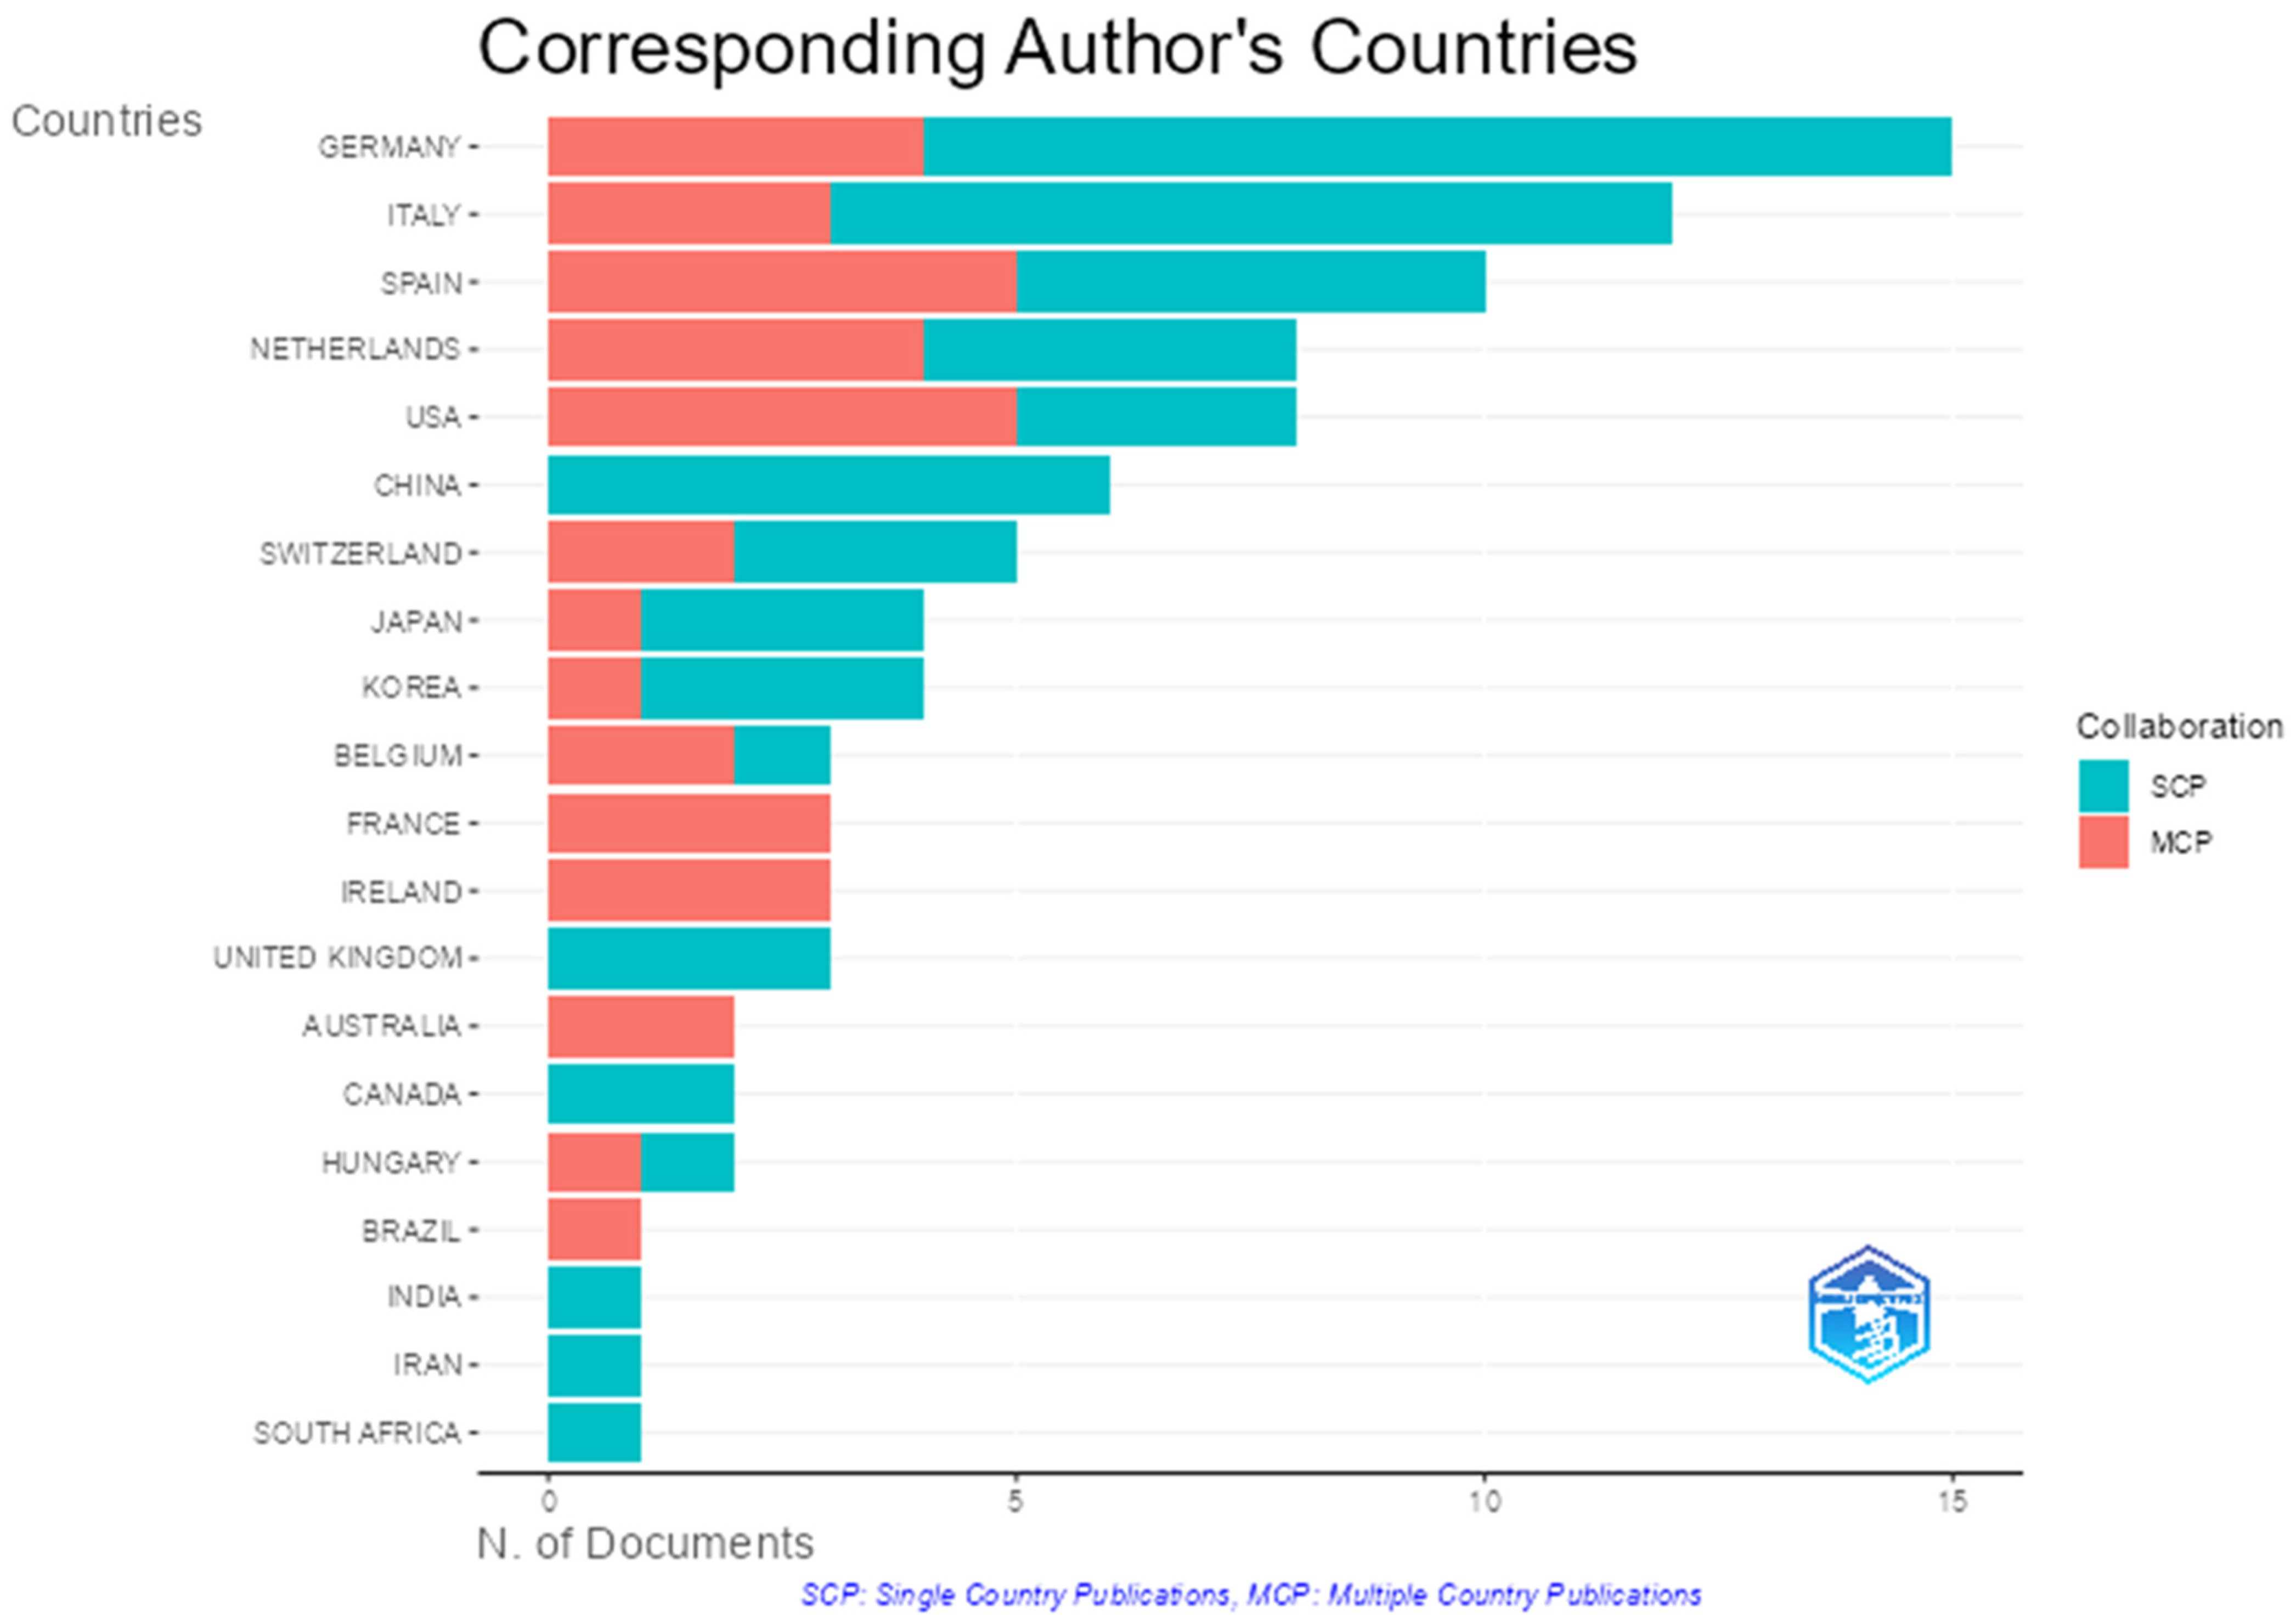
The geographic distribution of authorship is based on the corresponding authors of the articles. It is segmented into single country publications (SCPs) and international collaborations (MCPs—multiple country publications), as shown in
Figure 6. The leading countries in terms of publication volume were Germany, with 15 articles, of which 4 were international collaborations (26.7% MCP); Italy, with 12 articles and 3 MCPs (25%); Spain and the Netherlands, both with 50% international collaborations—Spain with 10 articles and the Netherlands with 8; and the United States, with 8 articles, 62.5% of which involved international co-authorship, indicating a high level of global integration.
The highest level of international collaboration (100% MCPs) was observed for France, Ireland, Australia, and Brazil. This scenario may indicate a dependence on international partnerships or active involvement in specialized global networks for publication. In contrast, the lowest level was recorded for China, which had six articles—all authored domestically (0% MCPs)—demonstrating a fully autonomous and internal production process. Brazil, Iran, India, and South Africa each contributed only one article, suggesting isolated or emerging participation in the field. On the other hand, there was a concentration of output in European countries such as Germany, Italy, Spain, and the Netherlands, with the United States acting as a strong collaborative partner.
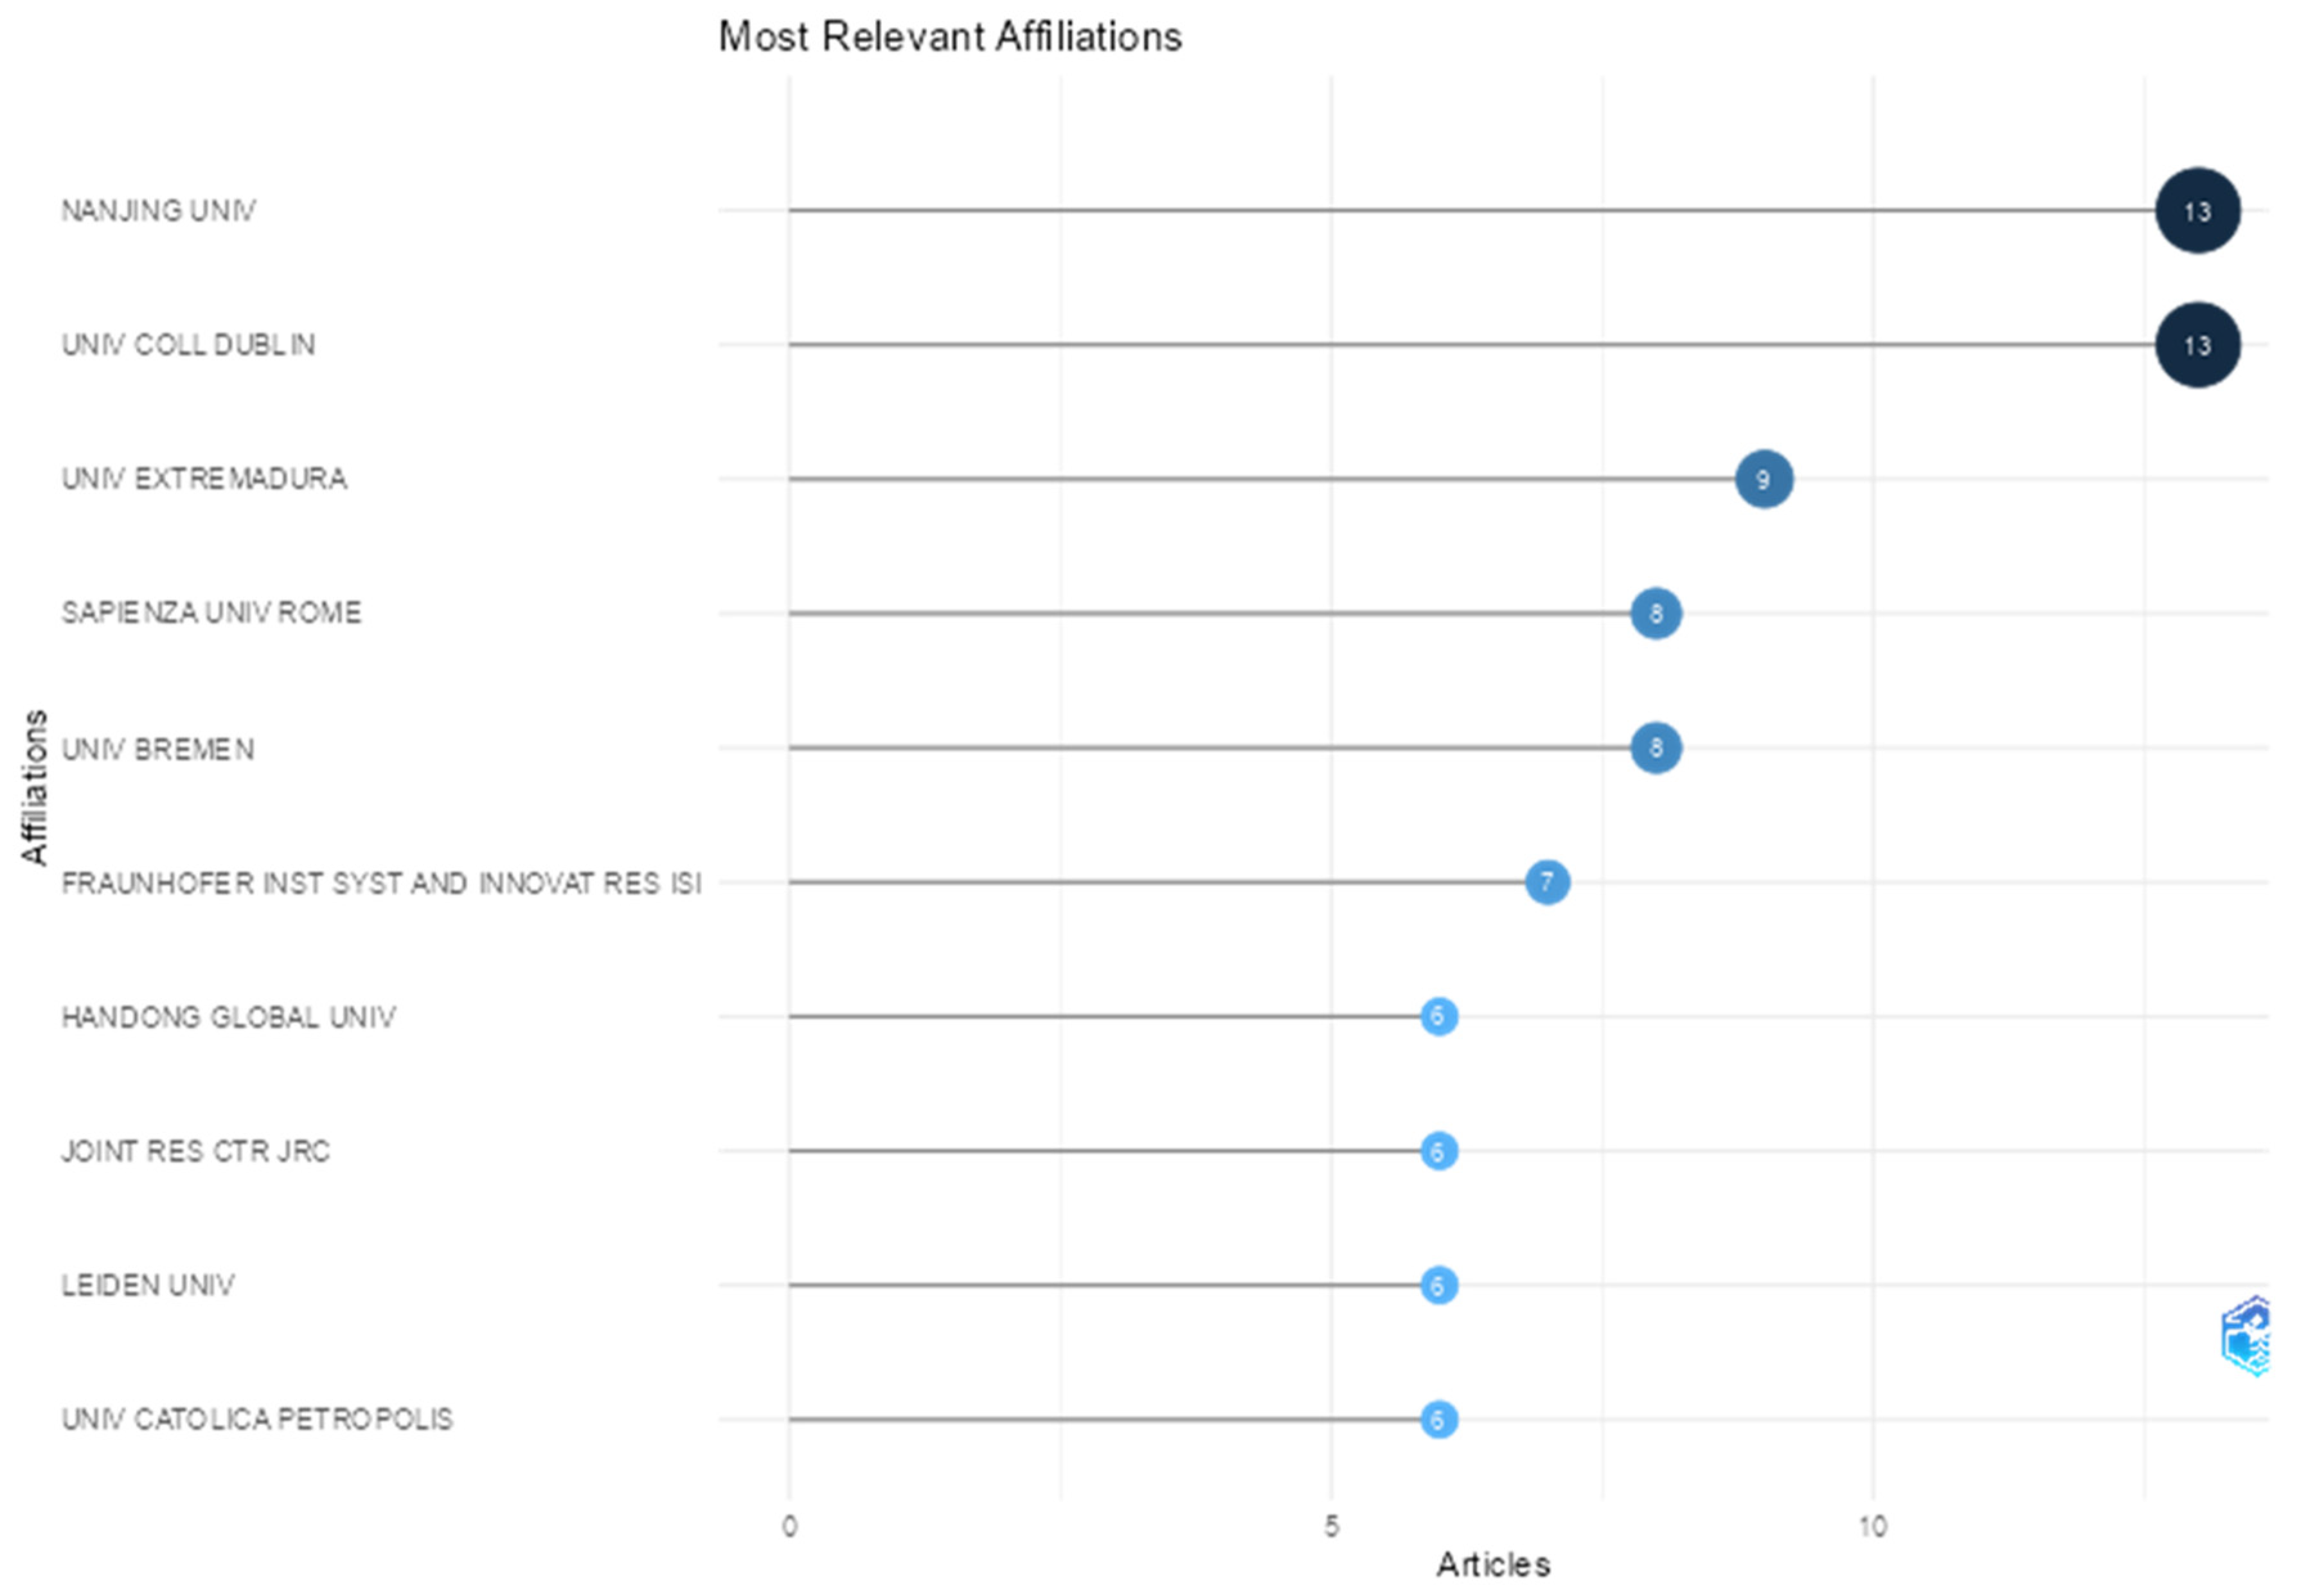
The next stage of the analysis focused on the number of articles published by institutional affiliation, which helped identify the most productive research centers in the analyzed dataset (
Figure 7). The most productive institutions were Nanjing University (China) and University College Dublin (Ireland), each with 13 articles. The University of Extremadura (Spain) accounted for nine articles, while Sapienza University of Rome (Italy) and the University of Bremen (Germany) each had eight publications, indicating a high level of institutional relevance.
In total, 142 different affiliations were identified in the dataset. Most institutions appeared with two or fewer published articles (101 affiliations), indicating a highly dispersed contribution structure—common in international and interdisciplinary scientific networks. Although production was relatively concentrated in a few universities, there was also widespread participation from institutions with isolated contributions. This reinforces both the geographic and institutional diversity in the use of the PATSTAT database.
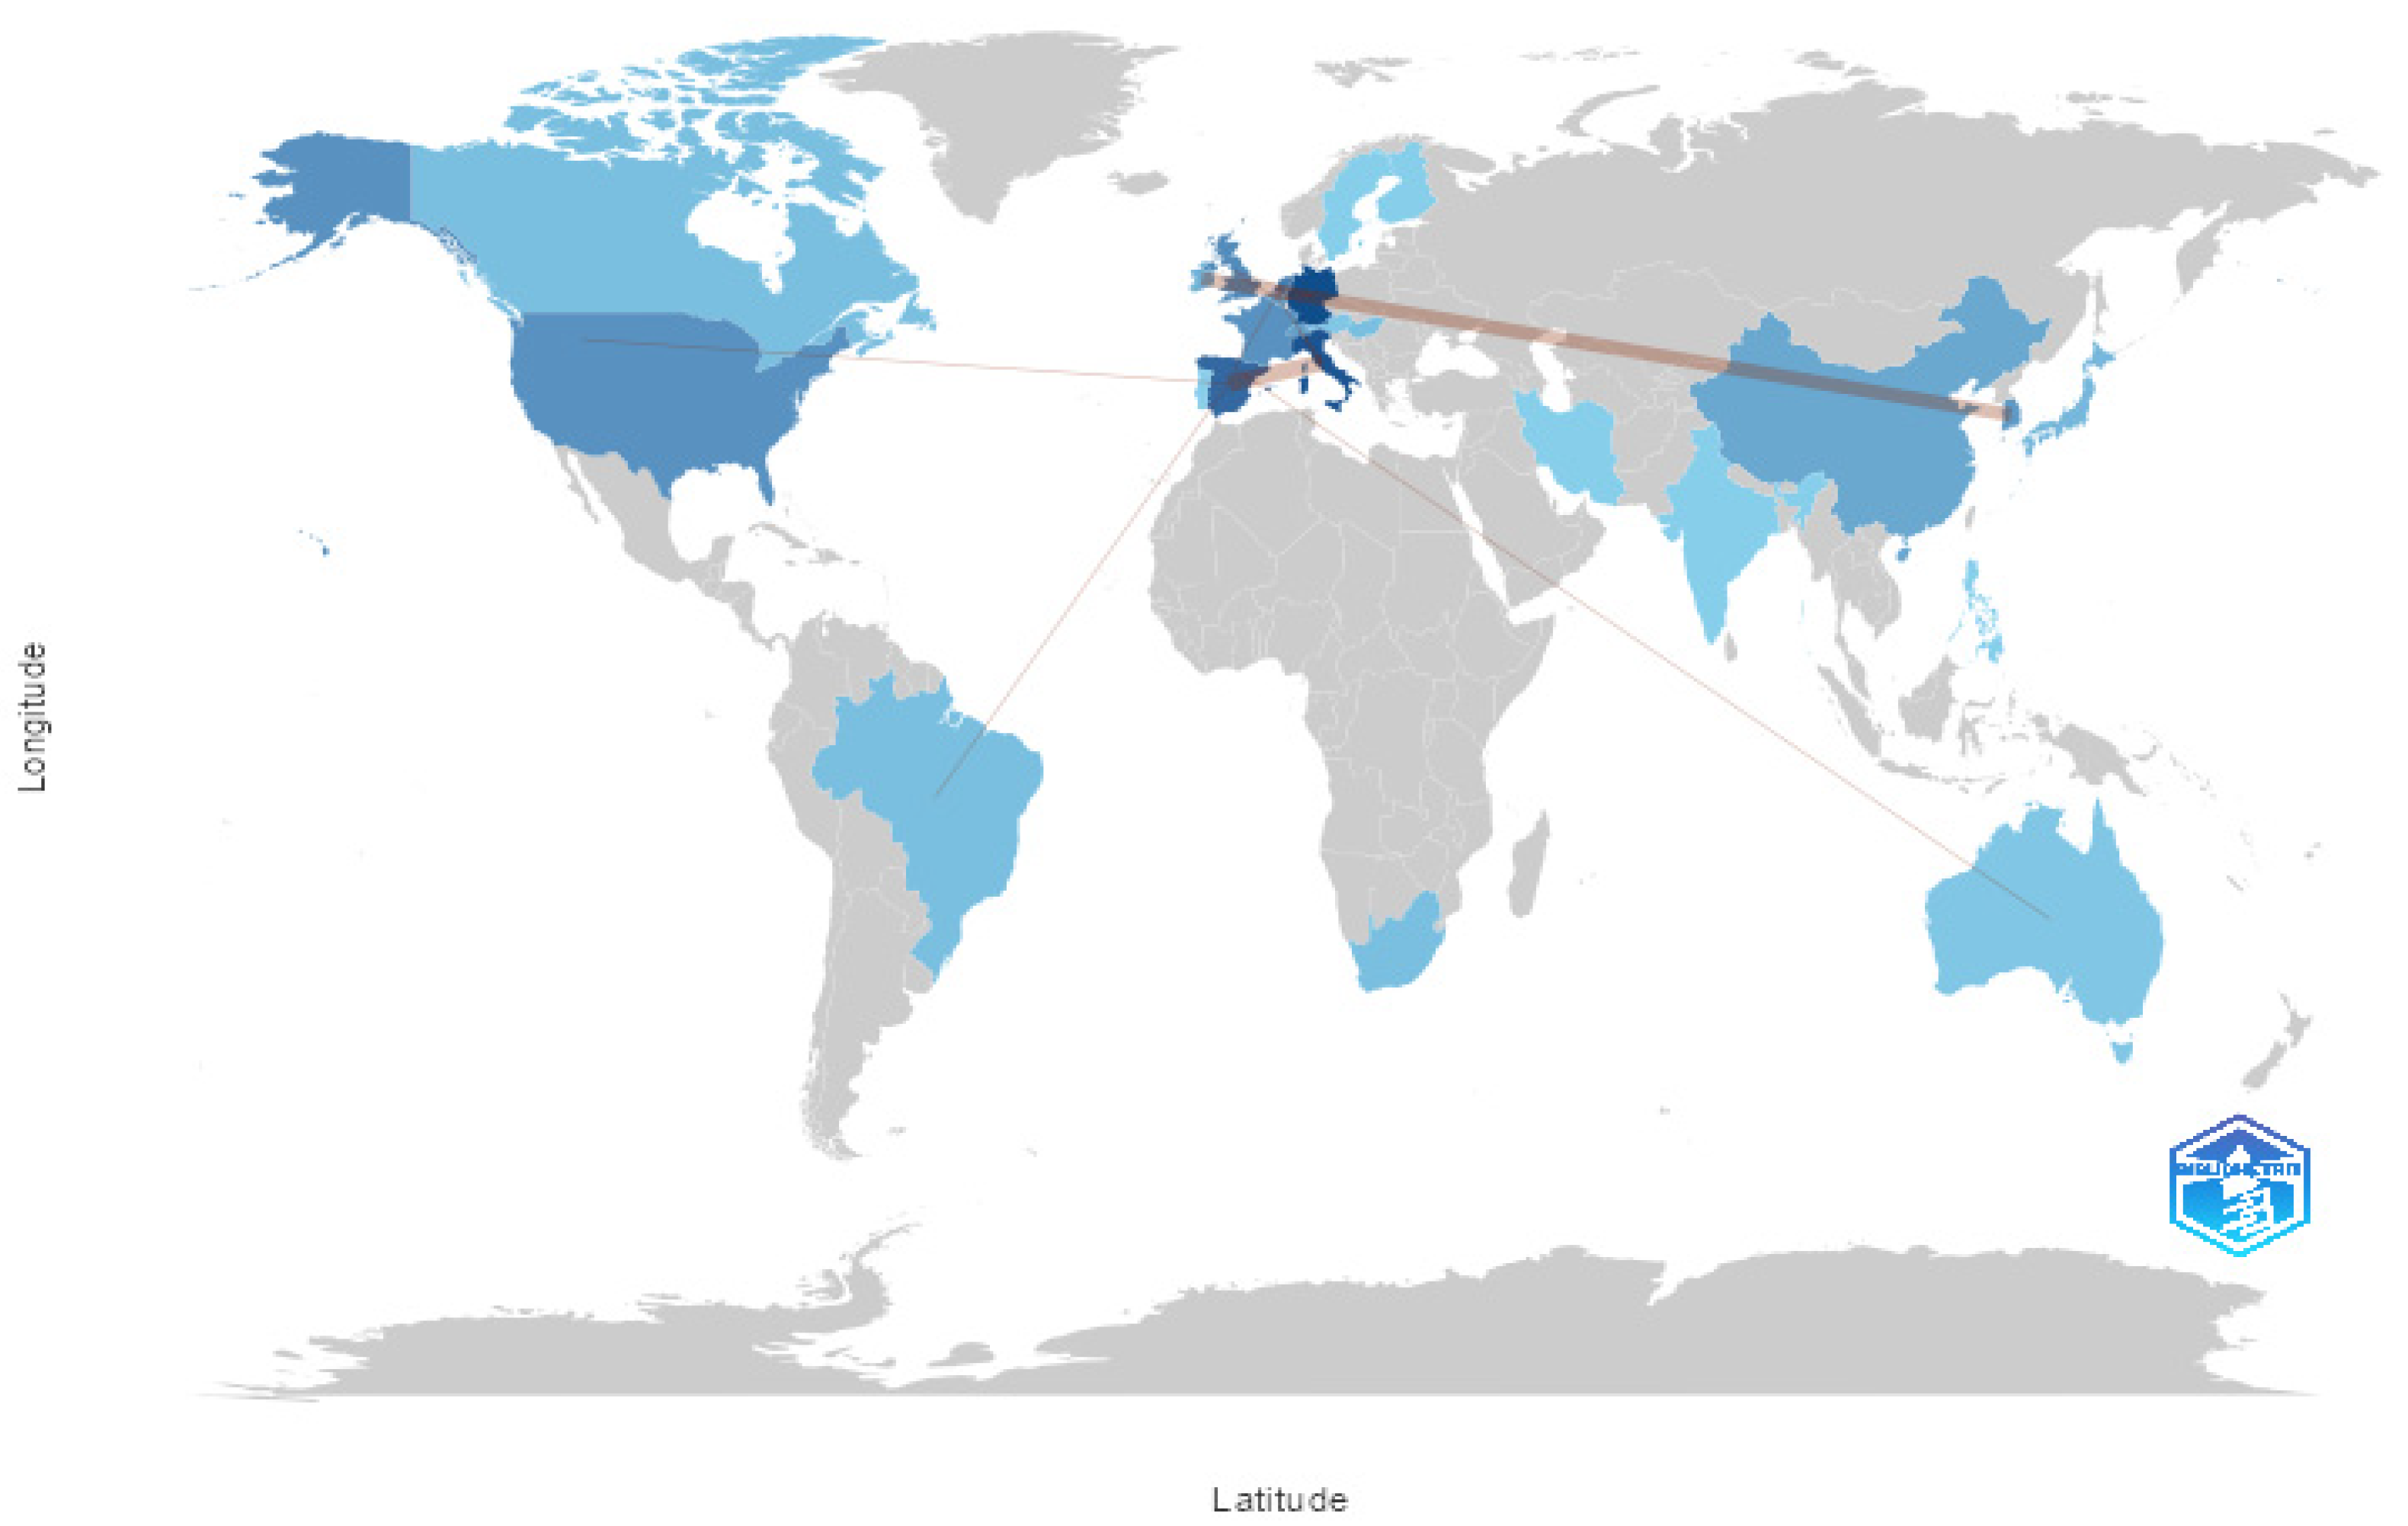
The next analysis evaluated country pairs involved in co-authorships, along with the respective frequency of collaboration (
Figure 8). This metric makes it possible to identify the main international connections in scientific output, given that the MCPs already signal the countries with the highest degree of research collaboration.
The countries’ collaboration world map highlighted strong connections between Italy and Spain (five collaborations), Korea and Ireland (four collaborations), and two-record partnerships such as France–Australia, Germany–Belgium, Netherlands–Belgium, Netherlands–United Kingdom, and USA–Spain. These pairs represented the most active international cooperation hubs in the sample.
This metric also reflects the degree of capillarity and assigns two roles: “from” and “to.” The “from” designation refers to the country of origin of the lead author or the institution that led the publication, thus indicating the main center of collaboration or the country most frequently coordinating efforts. The “to” designation refers to the collaborating country, meaning the one listed as a co-author in publications alongside the “from” country. It therefore identifies the international partners of each origin country.
In terms of capillarity, France was connected to twelve countries (six “from” and six “to”); the Netherlands had ten connections (eight “from” and two “to”); Germany was linked through nine partnerships (all “from”); Italy had nine connections (eight “from” and one “to”); Spain is connected to eleven countries (eight “from” and three “to”); Switzerland was associated with eight countries (two “from” and six “to”); the United States was linked to seven countries (all “from”); and finally, the United Kingdom maintained six connections (one “from” and five “to”). These countries constituted the main geographic hubs of collaboration, operating in multiple research networks simultaneously.
The international collaboration map was centered around European countries, with the United States, France, Germany, Italy, the Netherlands, and Spain playing leading roles. The most frequent country pairs revealed both regional and thematic alliances, while the participation of emerging countries remained limited but present.
3.5. Most Relevant Journals
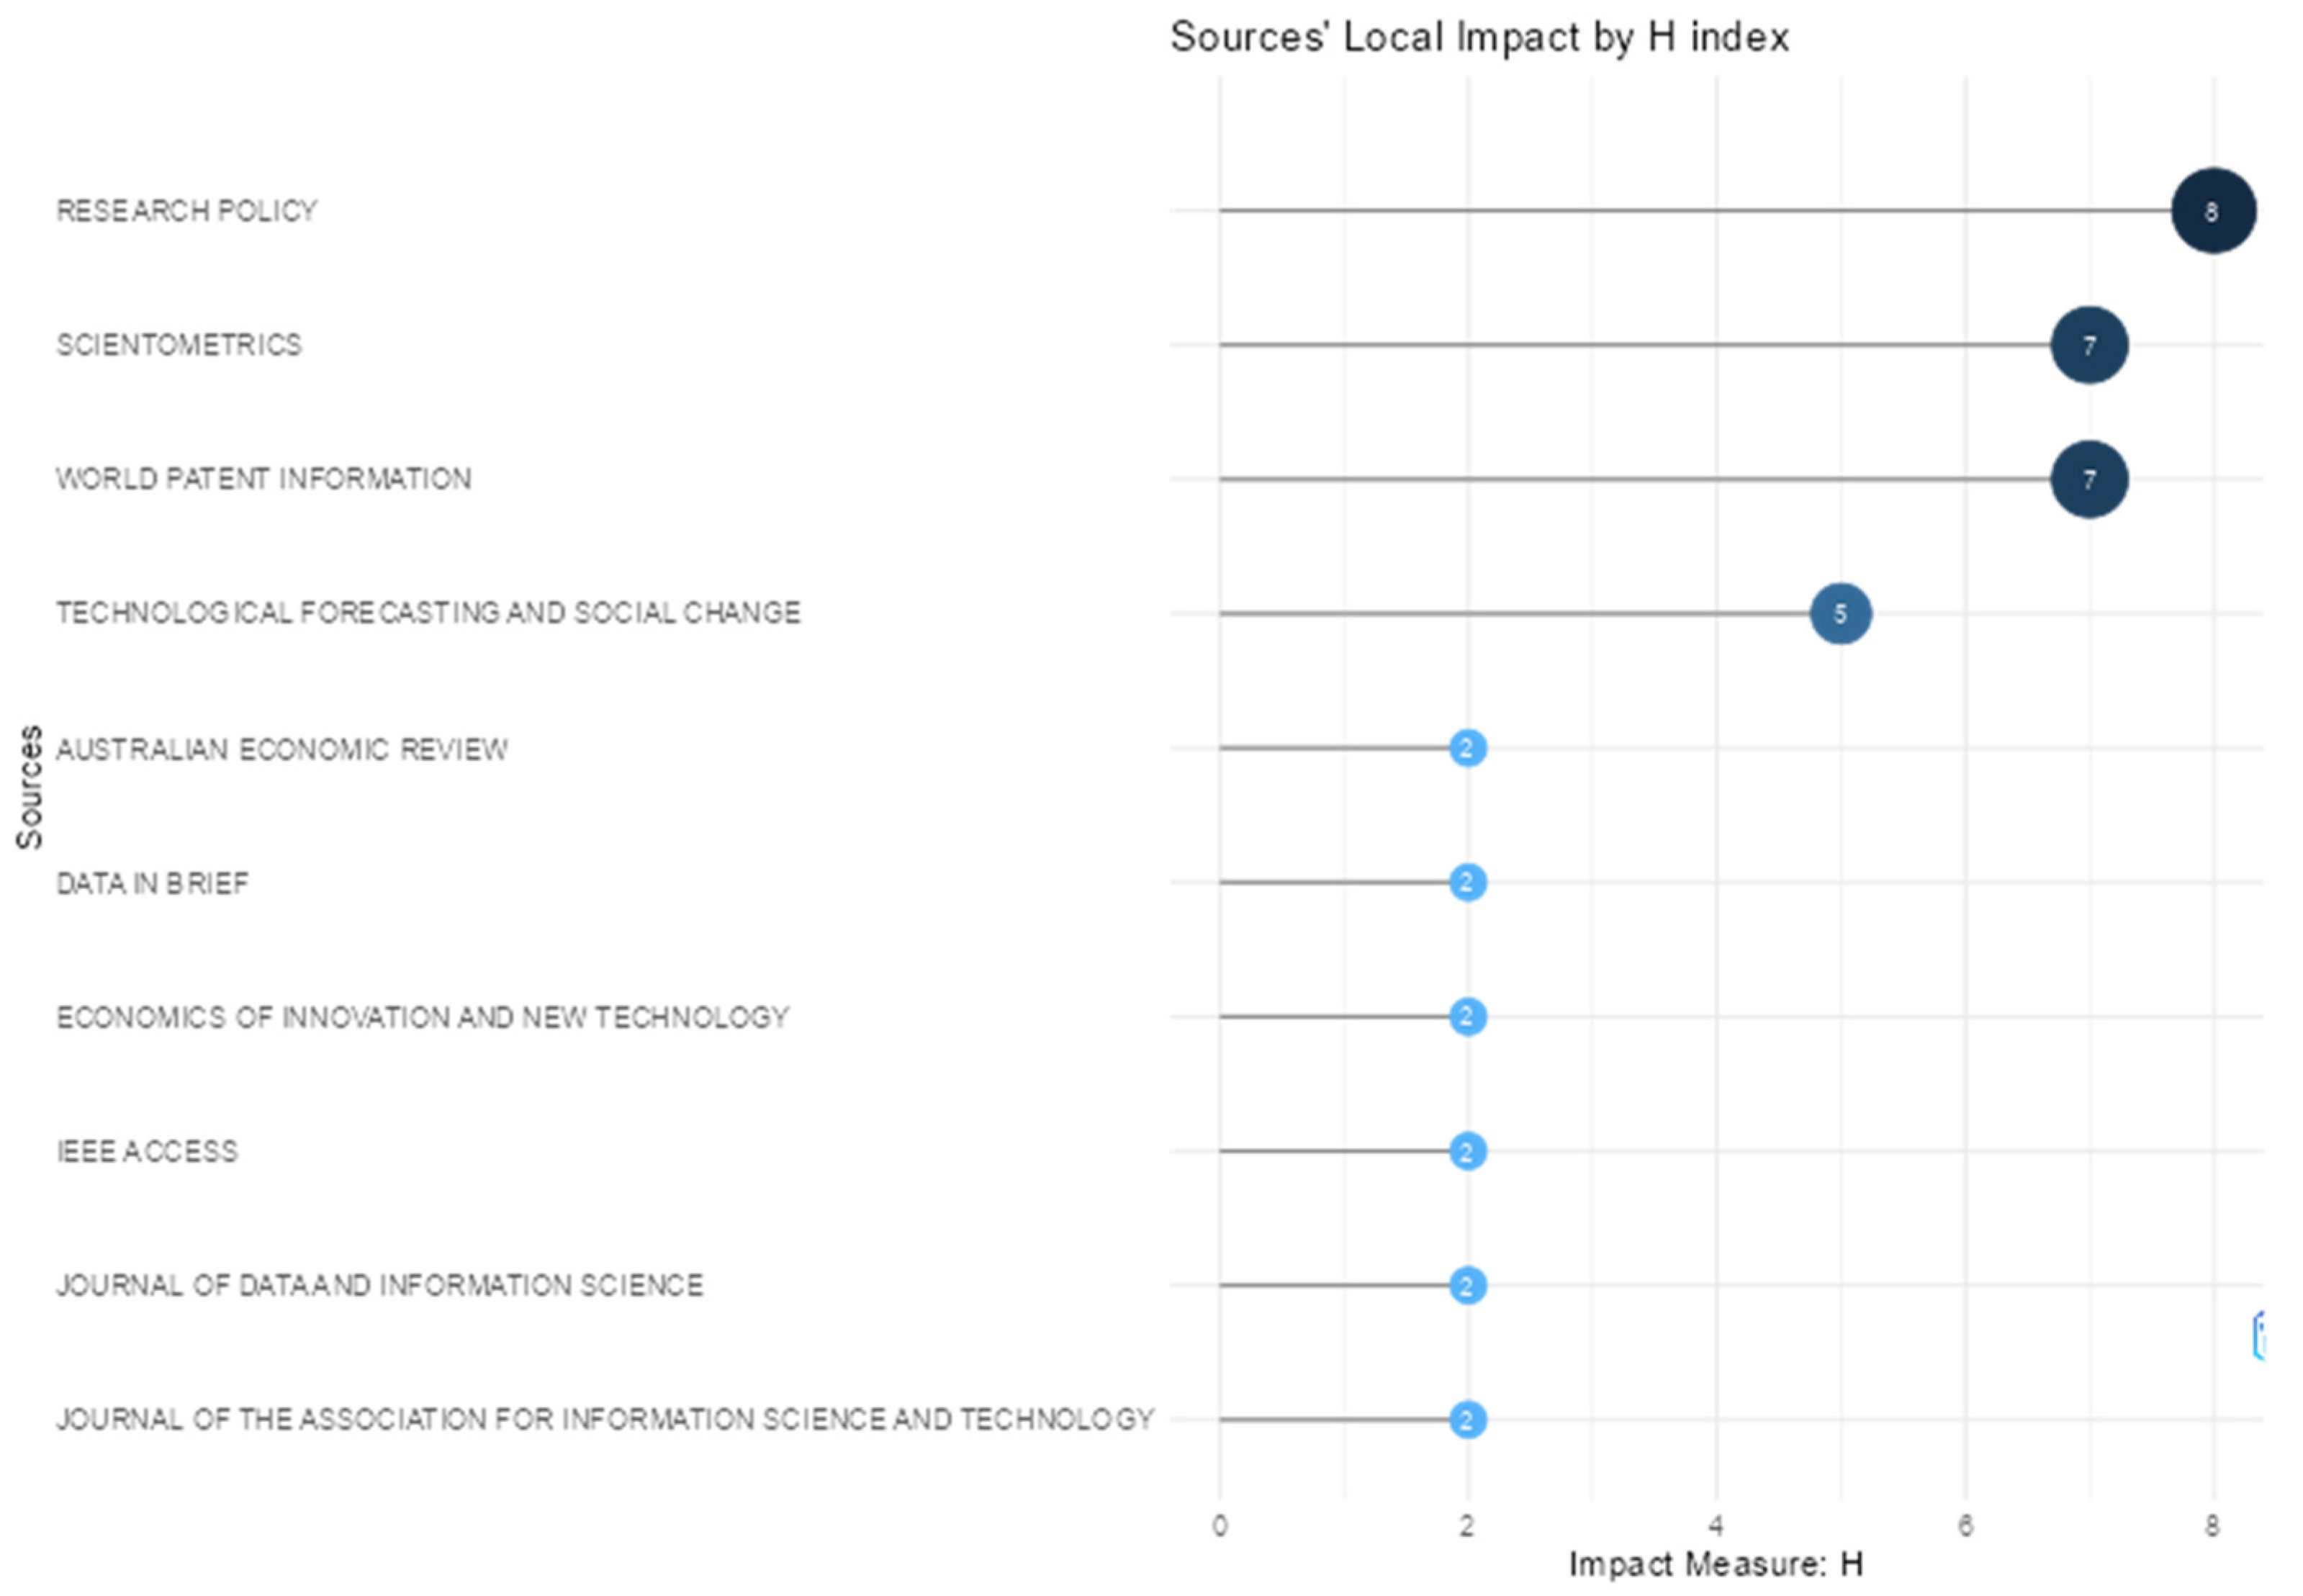
Multiple bibliometric metrics are used to evaluate the most relevant journals. The h-index measures the number of articles with at least h citations, aiming to assess both productivity and cumulative impact. The g-index measures the cumulative impact of publications by weighting the number of citations, making it sensitive to highly cited articles. The m-index is the h-index divided by the number of years since the first publication, thus adjusting for the time dimension. The TC indicator represents total citations, NP is the number of publications, and PY_start refers to the year of the journal’s first publication in the dataset.
Among the highest-impact journals, as shown in
Figure 9,
Research Policy stands out as the most influential source in the PATSTAT-related literature. The journal accumulated 799 citations and an h-index of eight, meaning there were eight articles with at least eight citations each in the dataset. A g-index of eight indicated that the eight most cited articles together received at least 64 citations (since g
2 = 64), and no additional article had at least nine citations to increase the index further. An m-index of 0.47 and NP = 8 reflected that the journal has had a consistent impact over the years (PY_start = 2009), even with only eight articles identified in the combined databases.
The journal Scientometrics had the highest number of publications in the dataset (n = 12) and a total citation count (TC) of 277. Although its total citations were lower than those of Research Policy, it had an h-index of 7, a g-index of 12, and an m-index of 0.466, highlighting both its relevance and impact since its first appearance in the dataset in 2011. The high g-index indicates that its most cited articles have accumulated a substantial number of citations, outperforming any other journal in this regard.
Next, World Patent Information presented metrics that reflected both its impact and publication volume. With eight publications since 2012, an h-index of 7, a g-index of 8, and the highest m-index (0.50) among the journals analyzed, its performance reflected a consistent yearly citation rate. It has also accumulated 176 citations, ranking sixth in this metric. Technological Forecasting and Social Change had fewer publications (n = 5) compared to the top-ranked journals. Since its first contribution in 2015, it has received 129 citations, with an h-index and g-index of 5 and an m-index of 0.45. The journal includes articles with high citation impact, although it publishes less frequently on PATSTAT. Lastly, Australian Economic Review had two publications, starting in 2014, with 63 citations. Its h-index and g-index were both 2, and it had an m-index of 0.166. These results suggest that the journal’s contribution to the PATSTAT-related literature is punctual, with a relatively lower weight in the overall set of publications.
3.6. Keywords (Frequency)
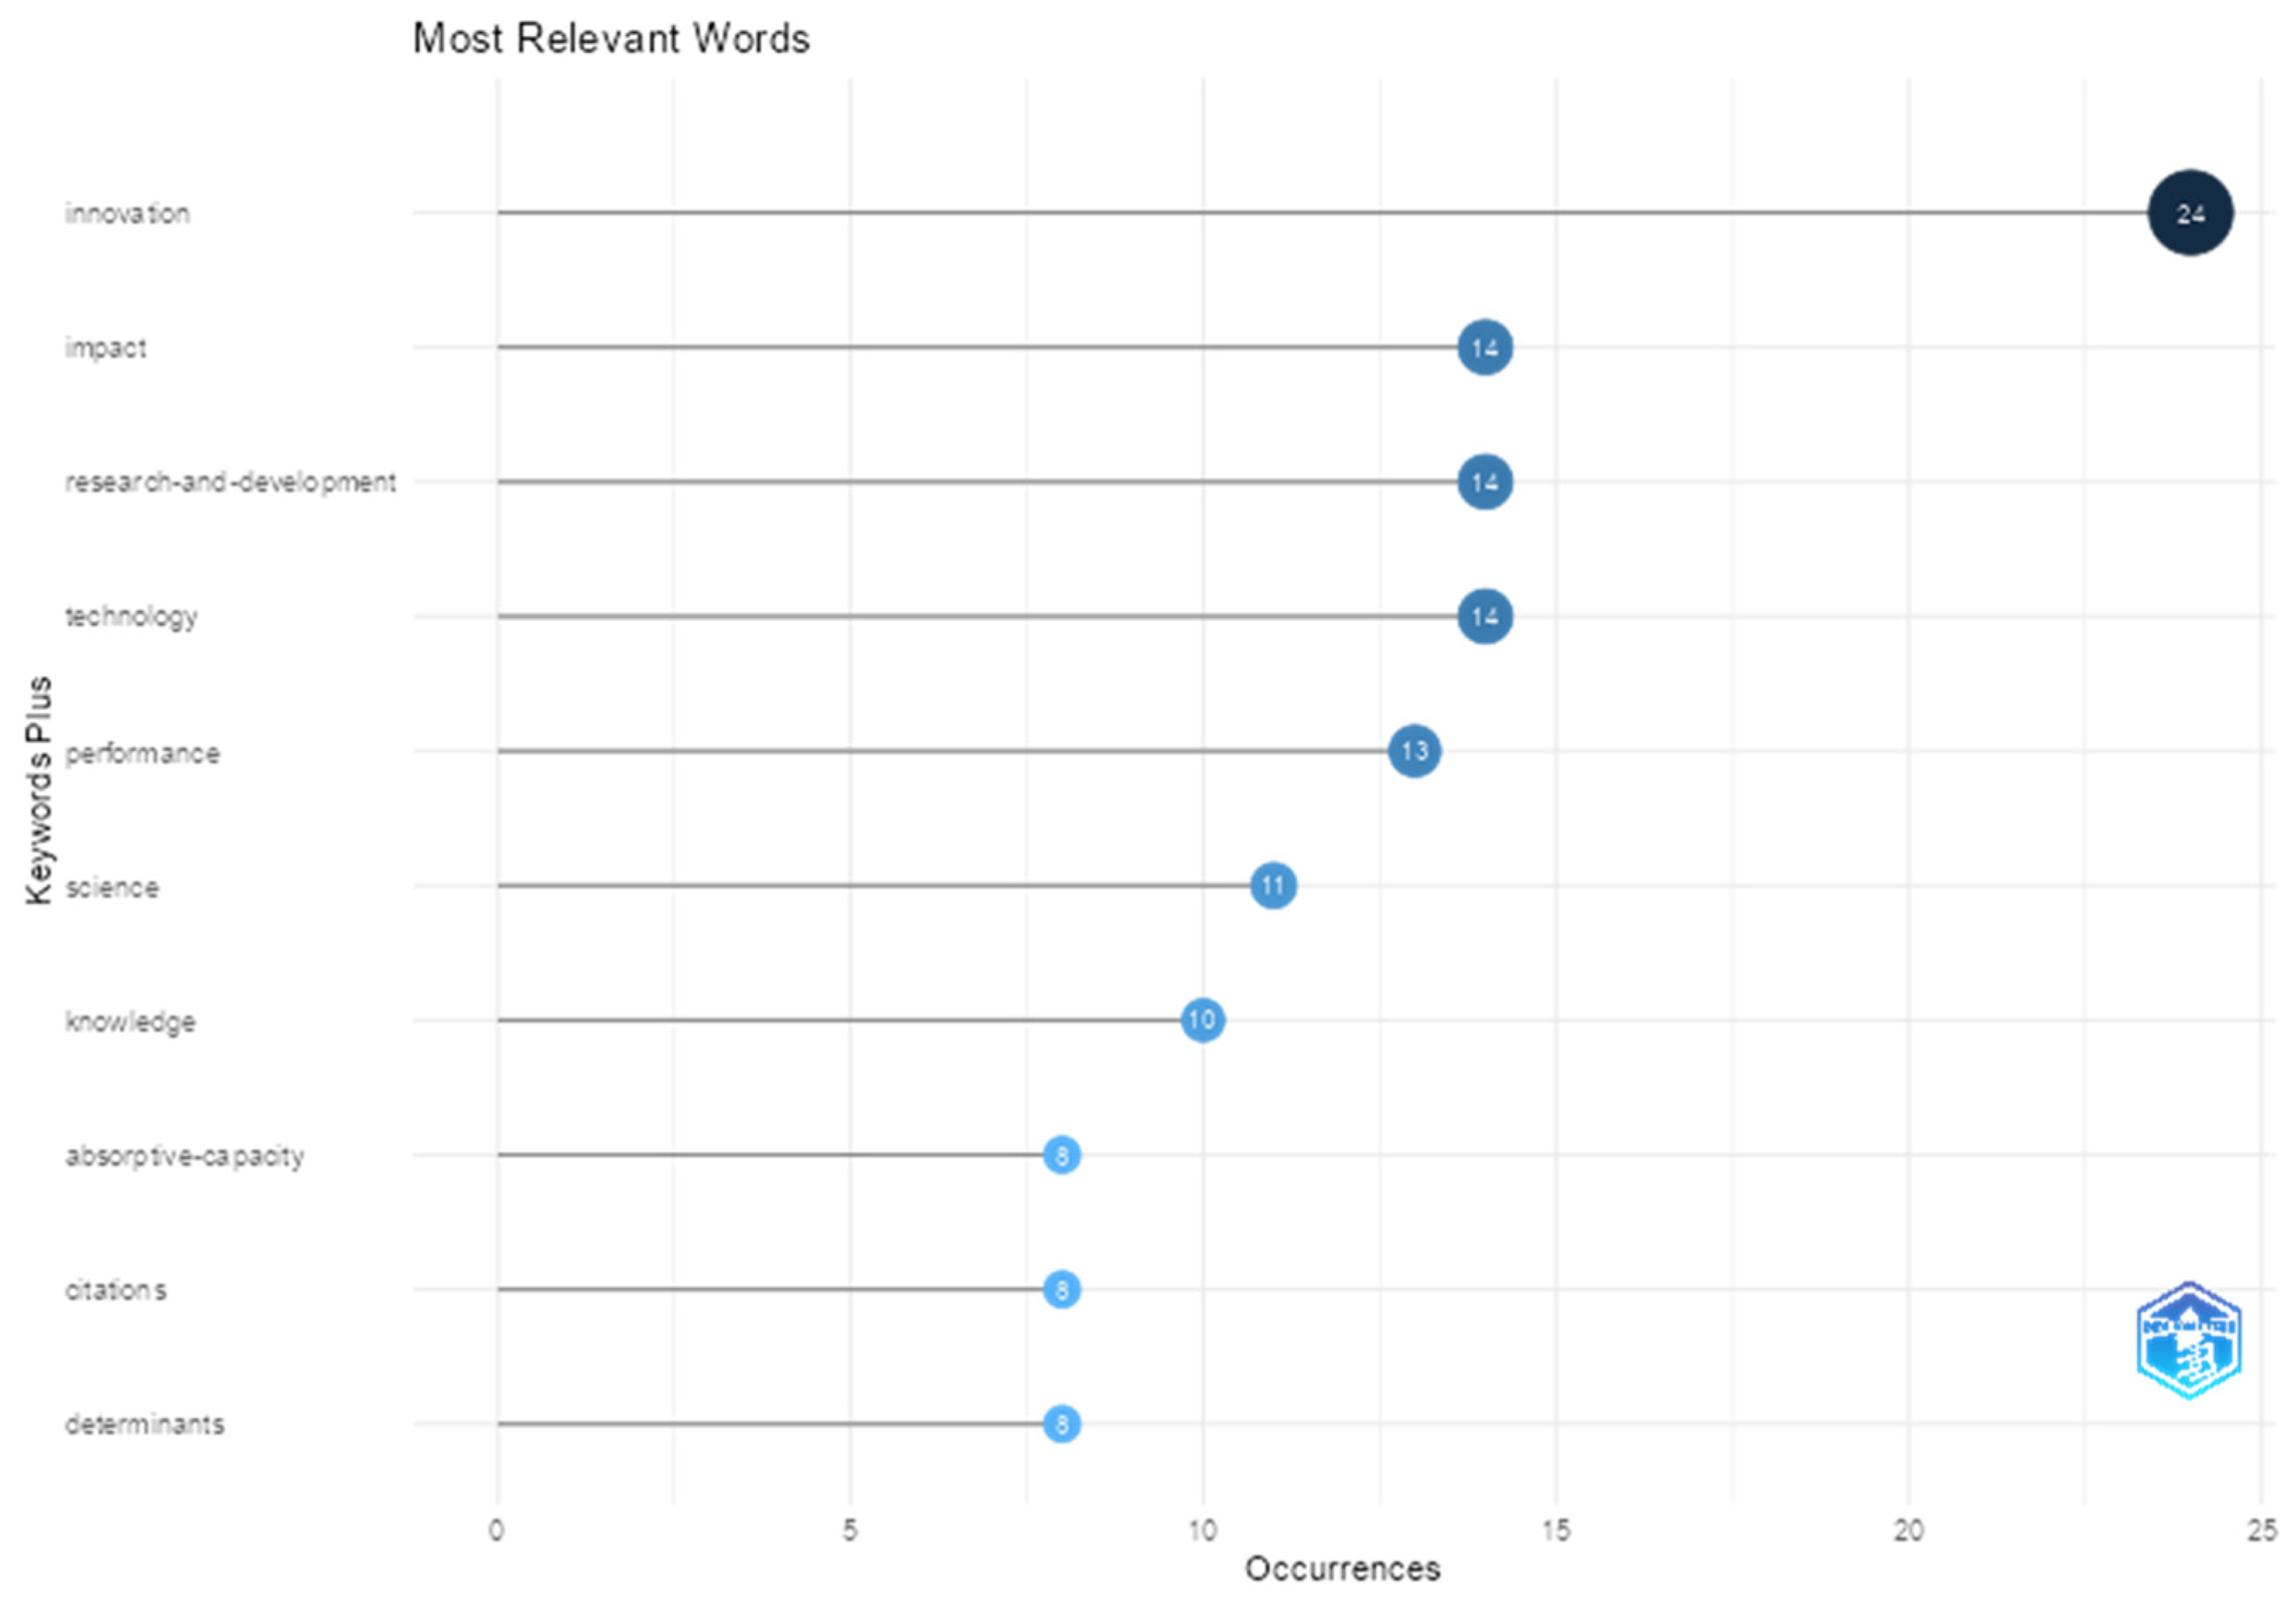
The keyword analysis (
Figure 10) revealed the most recurrent terms found in the titles, abstracts, or keywords of the analyzed documents, providing a detailed understanding of the core themes in the literature related to PATSTAT. The frequency of occurrence reflects the conceptual relevance of each term. Among the most frequent terms was innovation (24), standing out as a central and cross-cutting theme across most articles. The terms impact, research and development, and technology each appeared 14 times, suggesting studies measuring the effects of technologies and R&D investments. Performance appeared 13 times, reflecting research centered on outcomes, efficiency, and productivity.
Other relevant terms included green innovation (eco-innovation, environmental innovation, and sustainability), patents, policy, and indicators. This group of terms represents key subtopics within the literature, especially those related to sustainability studies, public policy, and intellectual property. As expected, studies using the PATSTAT database were directly connected to research on innovation, technology, impact, and performance but also aligned with R&D and sustainability-oriented approaches.
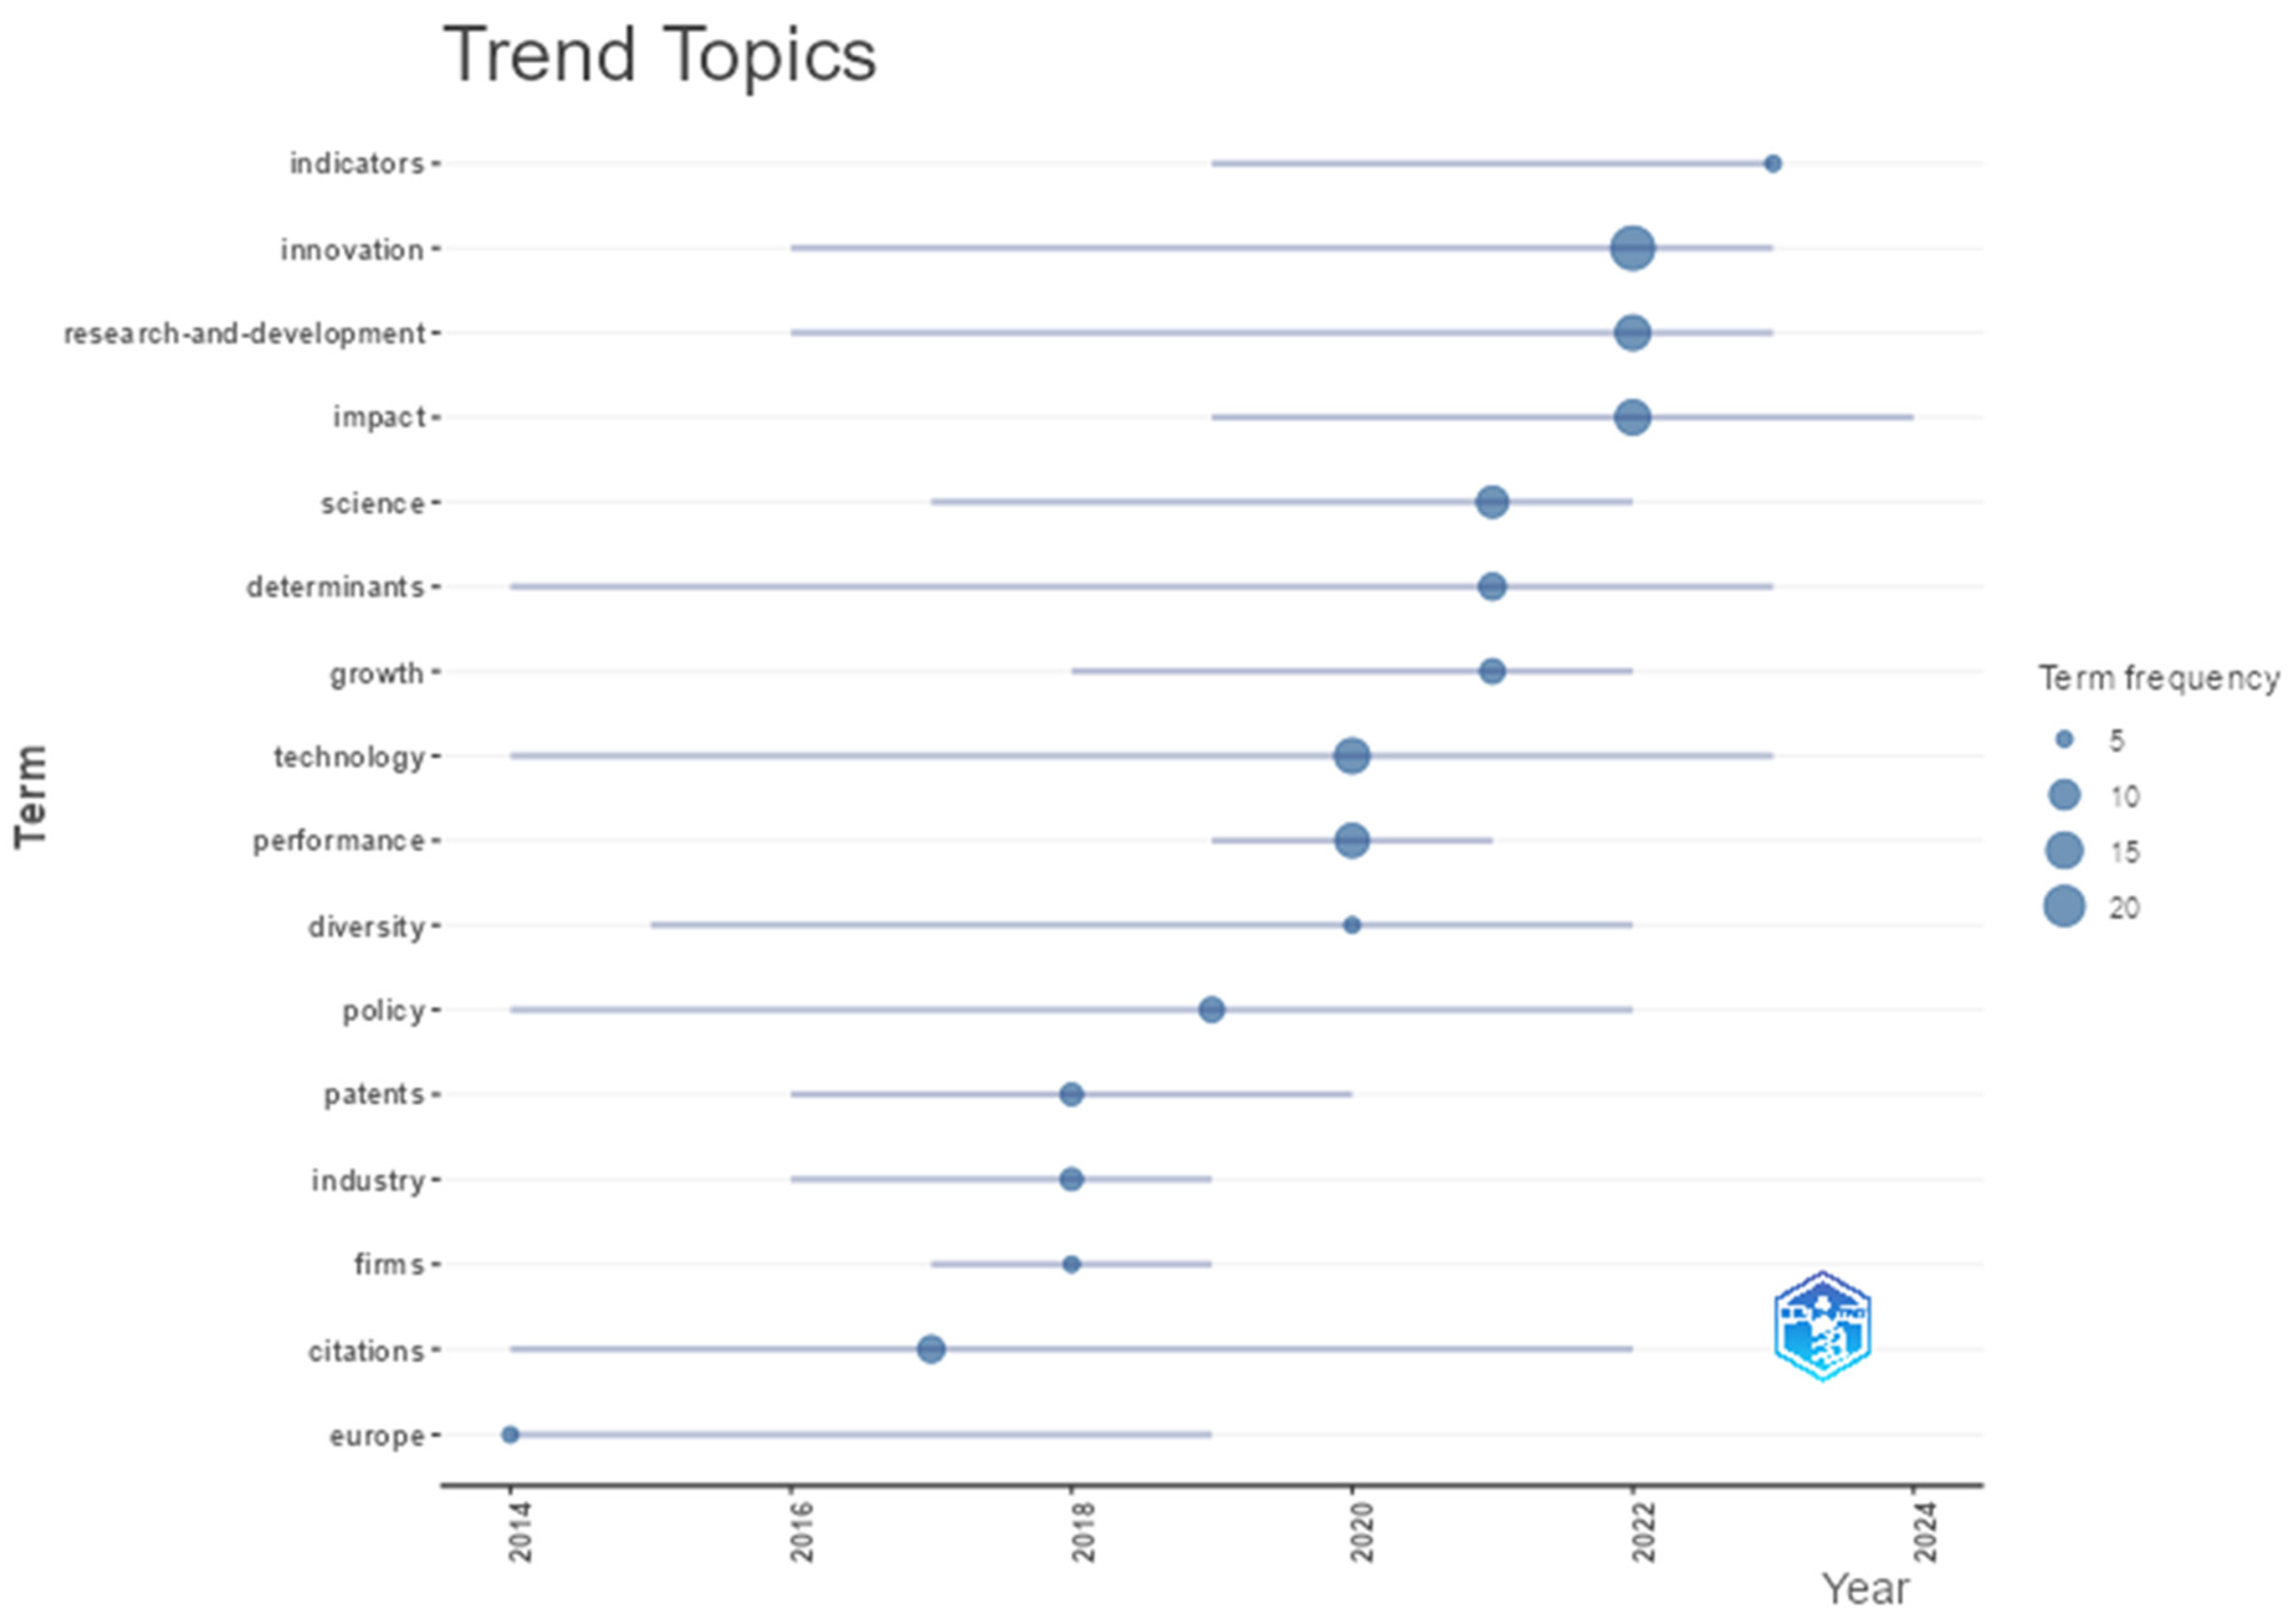
The most conceptually relevant terms and their periods of highest temporal concentration (first quartile, median, and third quartile) are shown in
Figure 11. These indicators reveal when each concept gained prominence over time.
Among the earliest topics (prior to 2016), the main terms were Europe, citations, policy, determinants, and technology, all of which had been present since 2014. The median for Europe was 2014, though its frequency declined after 2019. For citations, the median was 2017, but it maintained relevance through 2022. These terms indicate the foundational theoretical focus on evaluation topics, the European regional context, and public policy.
The consolidation phase occurred between 2016 and 2020, with the emphasis on the terms industry, patents, firms, science, and growth. The focus shifted toward research topics in industrial innovation, particularly patents, scientific development, and economic growth analysis. Among the emerging topics were innovation, impact, research and development, and indicators, which showed a notable increase in frequency between 2021 and 2025. Applied approaches gained prominence, especially those involving evaluation studies and strategic decision-making. This final stage consolidates research related to the dynamics and impacts of innovation.
3.7. Co-Occurrence
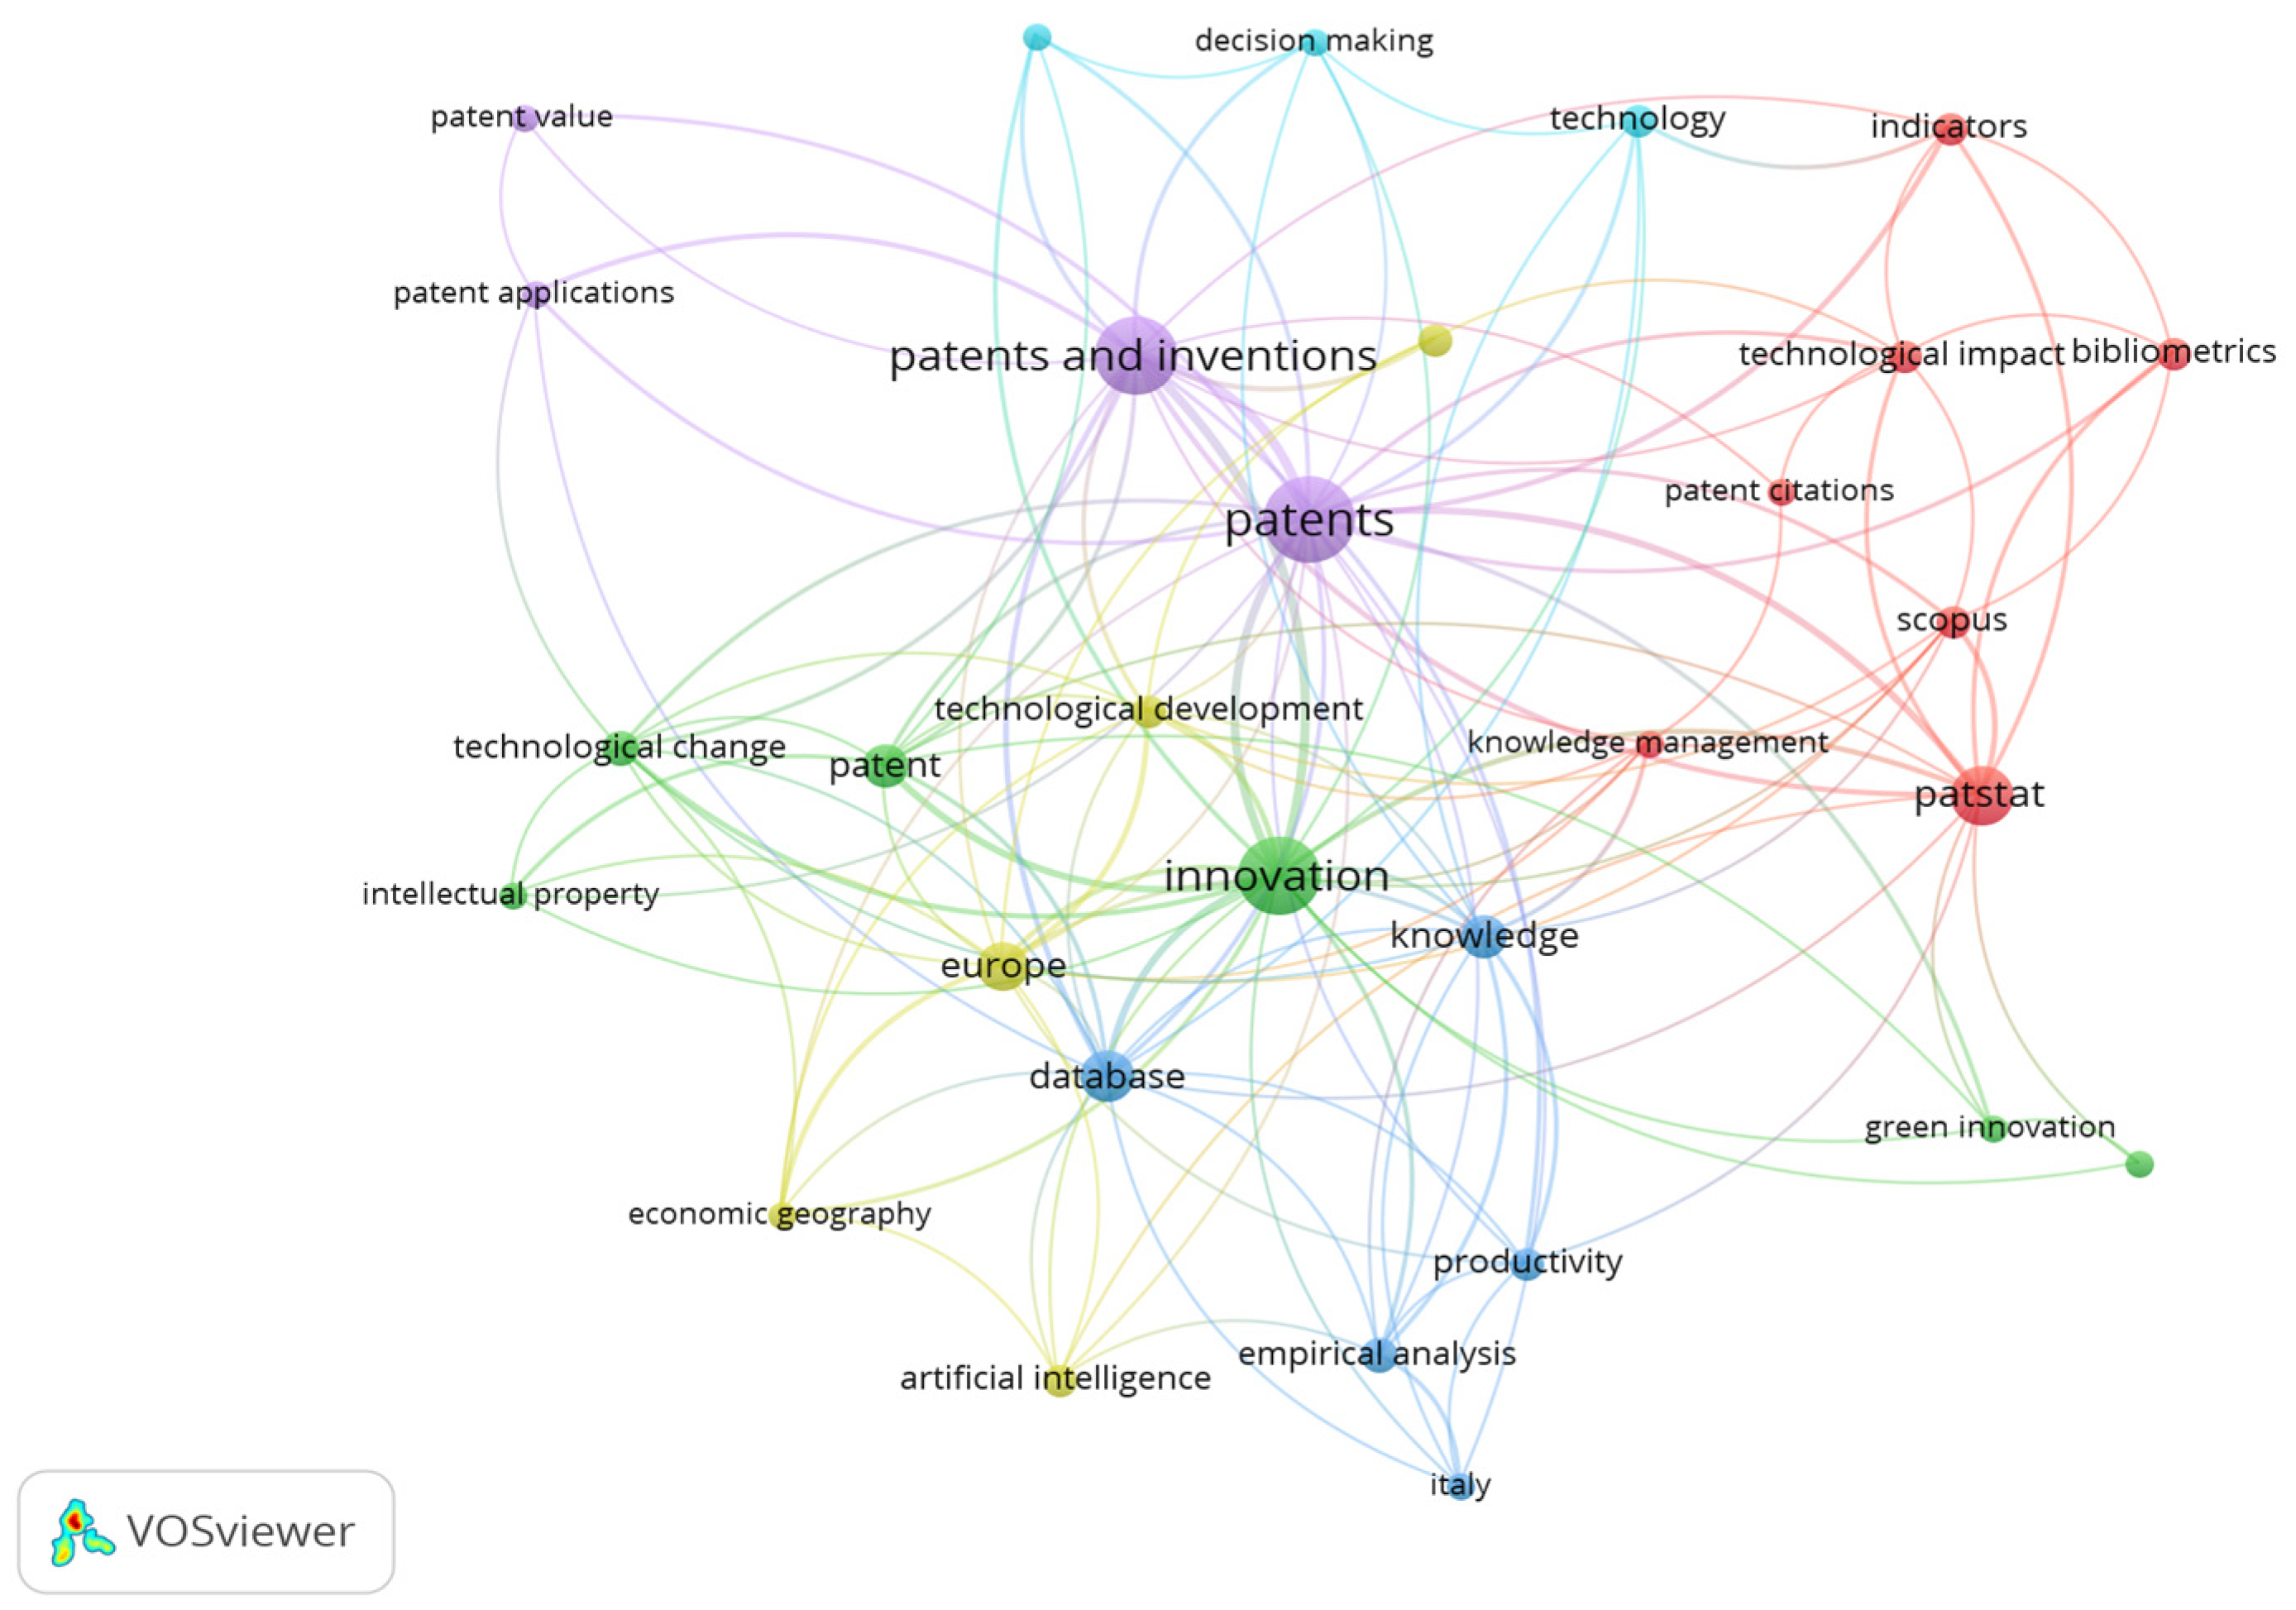
The co-occurrence analysis of keywords reveals a conceptual structure map based on the frequency with which terms appear together in the titles, abstracts, or keywords of the documents. Each node represents a relevant term, while the links between them reflect the frequency of co-occurrence. Thus, the most central terms form the key thematic axes, while the clusters (represented by colors) reveal distinct subtopics or research approaches.
The map shown in
Figure 12 highlights a dense network organized around three main conceptual cores: innovation, patents (combined with patents and inventions), and patstat. The term innovation is central, belongs to the green cluster, and connects to several other concepts such as productivity, green innovation, technological change, and knowledge, thus integrating various themes. The green cluster is associated with technological innovation and intellectual property. The purple cluster centers on the term’s patents and patents and inventions, which are linked to themes like patent value and patent applications. The red cluster is composed of the terms patstat and bibliometrics, describing an analytical and methodological connection to terms such as Scopus, technological impact, and indicators, positioning the PATSTAT database as the subject of empirical research. The interconnections between these three clusters reveal a technical axis related to patents, particularly focused on innovation metrics studies in the European context, aiming to understand technological structures.
Although this study primarily mapped the scientific use of PATSTAT in research on patents and innovation, the co-occurrence analysis revealed broader thematic intersections that reinforced its relevance to the digital economy. Keywords such as artificial intelligence, technological change, knowledge management, and technology indicate that patent data are increasingly used to examine emerging digital technologies and organizational innovation dynamics. Additionally, terms like empirical analysis, productivity, and decision-making suggest that PATSTAT supports research grounded in data-driven approaches to innovation performance and strategic foresight.
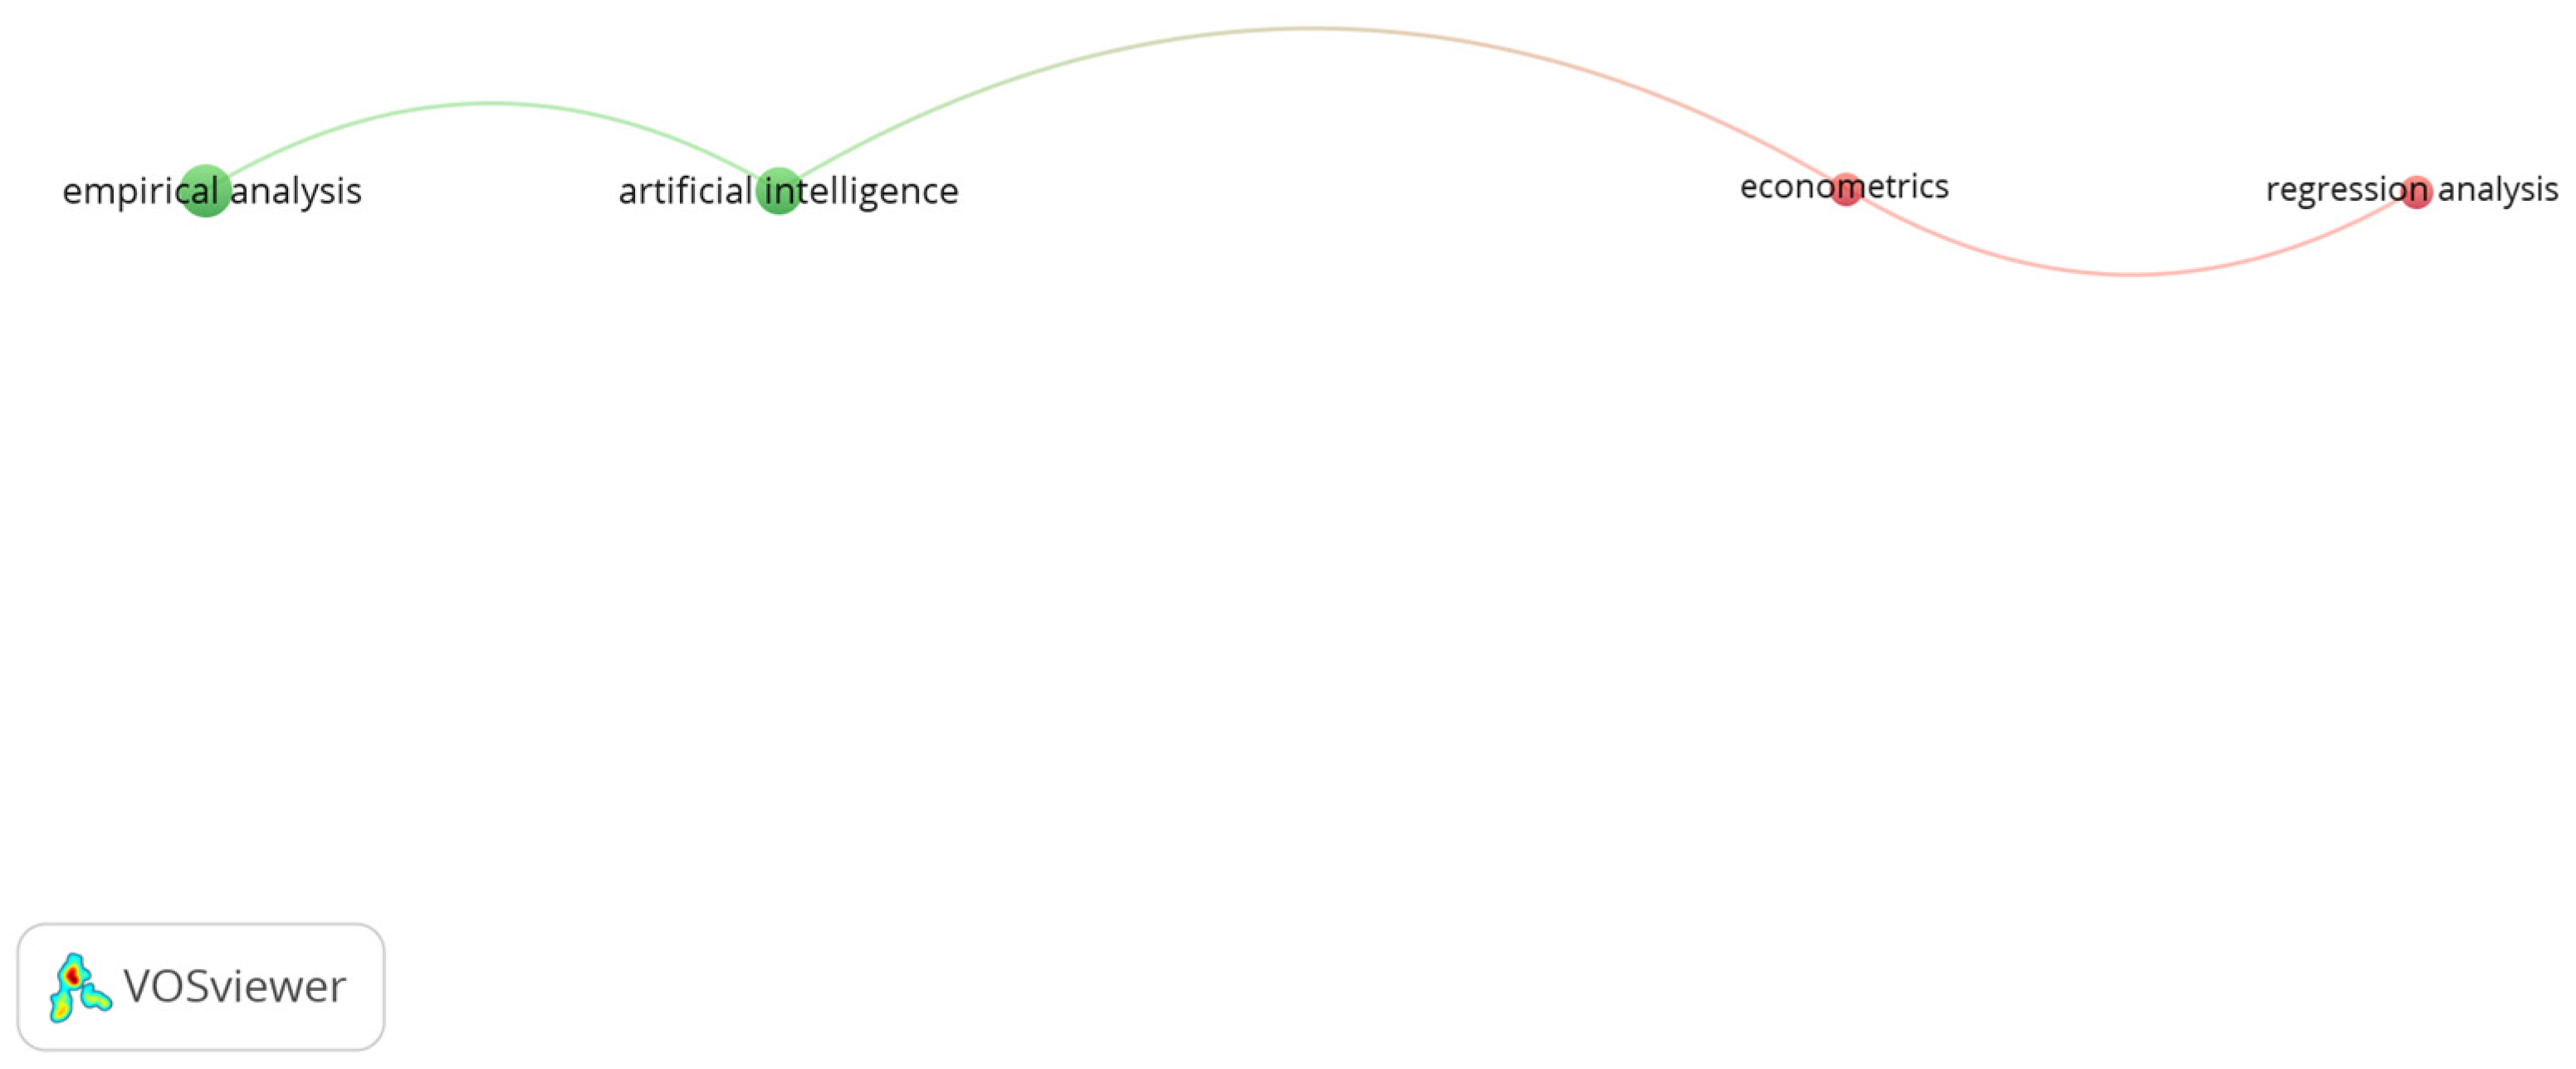
The next stage was a subsample of the previous analysis. It focused on keywords related to statistical empirical methods and software, which were manually identified in the list generated by VOSviewer. The goal was to map the empirical analytical procedures with a statistical approach and the tools used in studies involving PATSTAT. This restricted selection of methodological terms helped to understand not only which methods were most commonly used, but also how they were conceptually articulated, indicating potential combinations between traditional techniques and emerging tools.
The map shown in
Figure 13 includes five linearly associated terms: empirical analysis, artificial intelligence, econometrics, regression analysis, and quantile regression. The presence of empirical analysis at the far left emphasizes the applied nature of PATSTAT-related research, while the terms are arranged in a sequential structure, suggesting a methodological interrelationship.
The approaches included both classical methods—such as econometrics and regression analysis—and newer approaches based on artificial intelligence and machine learning. The structure of the map illustrates a growing methodological transition in which consolidated statistical techniques are increasingly complemented by expanding computational approaches. The central position of artificial intelligence in the network indicates its mediating role between traditional and emerging computational methods.
Few articles explicitly mentioned the software used in the selected search fields across the journal databases. Among the tools identified for handling PATSTAT data were KNIME, MySQL, and PostgreSQL. These tools are well suited for managing big data with relational database characteristics, which aligns with the large-scale data manipulation required for this patent database.
3.8. Thematic (Structural) Analysis
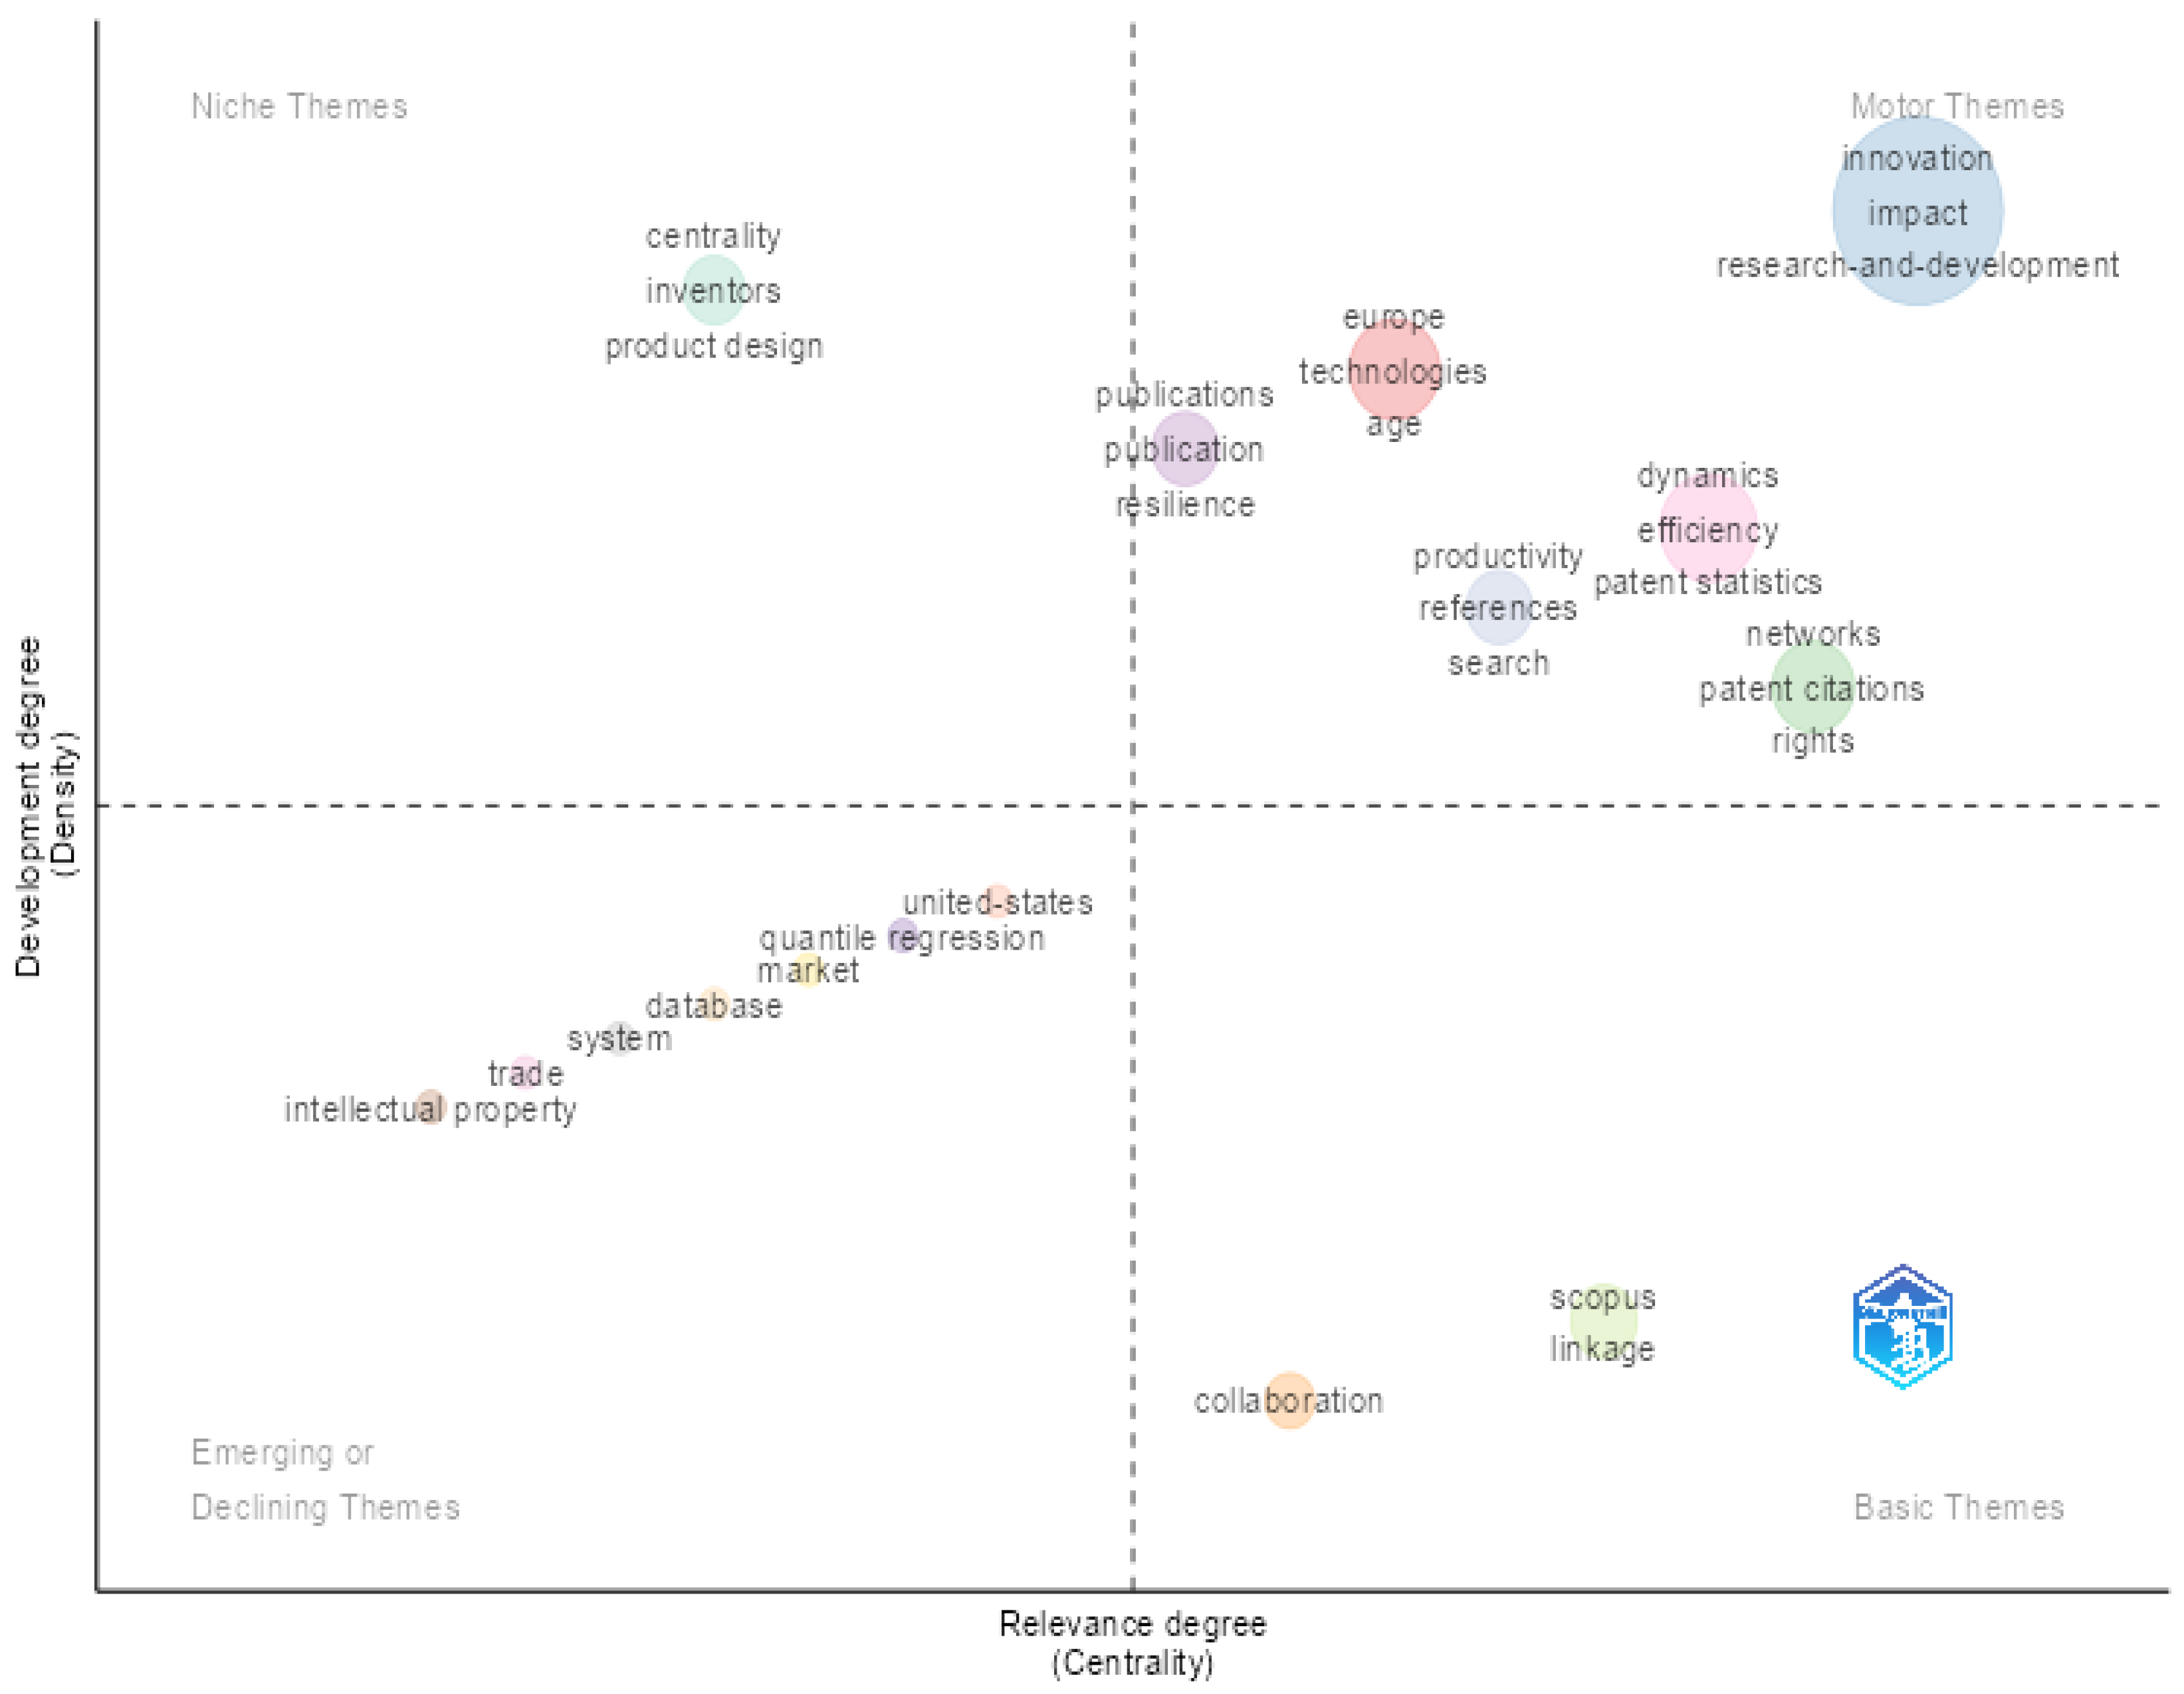
The thematic map illustrated the grouping of keywords into conceptual clusters, dividing themes across four quadrants. The applied criteria were centrality (the importance of a theme to the structure of the field) and density (the level of internal development, which corresponds to the depth of conceptual elaboration). The quadrants of the thematic map were categorized as follows: motor themes (high centrality and high density), niche themes (low centrality and high density), emerging or declining themes (low centrality and low density), and basic themes (high centrality and low density), as shown in
Figure 14.
In the motor themes’ quadrant, we find conceptually developed and structurally important topics associated with PATSTAT. The cluster comprises six labels, each featuring one term with the highest centrality (specified in parentheses): Europe (technologies), innovation (innovation), networks (patent citations), publications (resilience), productivity (references), dynamics (dynamics). The highest centrality values indicate strong links with multiple topics in the network. Thus, this quadrant highlights studies on technological capabilities and innovation patterns.
The niche themes’ quadrant includes topics that are highly developed but relatively isolated from the broader thematic structure. The quadrant does not show any prominent clusters but highlights the label centrality with key terms (centrality and inventors). This context suggests that although these topics are conceptually well established, they are not significantly connected to the broader PATSTAT thematic structure. Likely, they represent specialized or fragmented niches that have yet to become central themes in the field.
Conversely, the emerging or declining themes’ quadrant does not display any identifiable clusters, which suggests a concentration in well-established and central topics. All labels exhibit low centrality, with terms such as United States, quantile regression, database, system, trade, and intellectual property appearing in the quadrant. The lack of centrality may reflect thematic coherence and the maturity of the field.
Finally, the basic themes’ quadrant contains topics with low conceptual cohesion, e.g., terms that act as bridges or intersections among core themes in this literature. The only identified labels are Scopus and collaboration, and no additional cluster formation is observed. This reinforces the dominant role of the “innovation,” “dynamics,” and “Europe” clusters (from the motor themes’ quadrant) as the main conceptual hubs.
The thematic map suggests that the scientific production on PATSTAT is built around a core structure focused on technologies, capacities, and innovation patterns, especially within the European context. The predominance of a single highly relevant cluster (motor themes) points to thematic concentration and conceptual consolidation. The absence of active clusters in the other quadrants indicates a well-defined base but limited diversification into emerging subtopics or specialized niches.
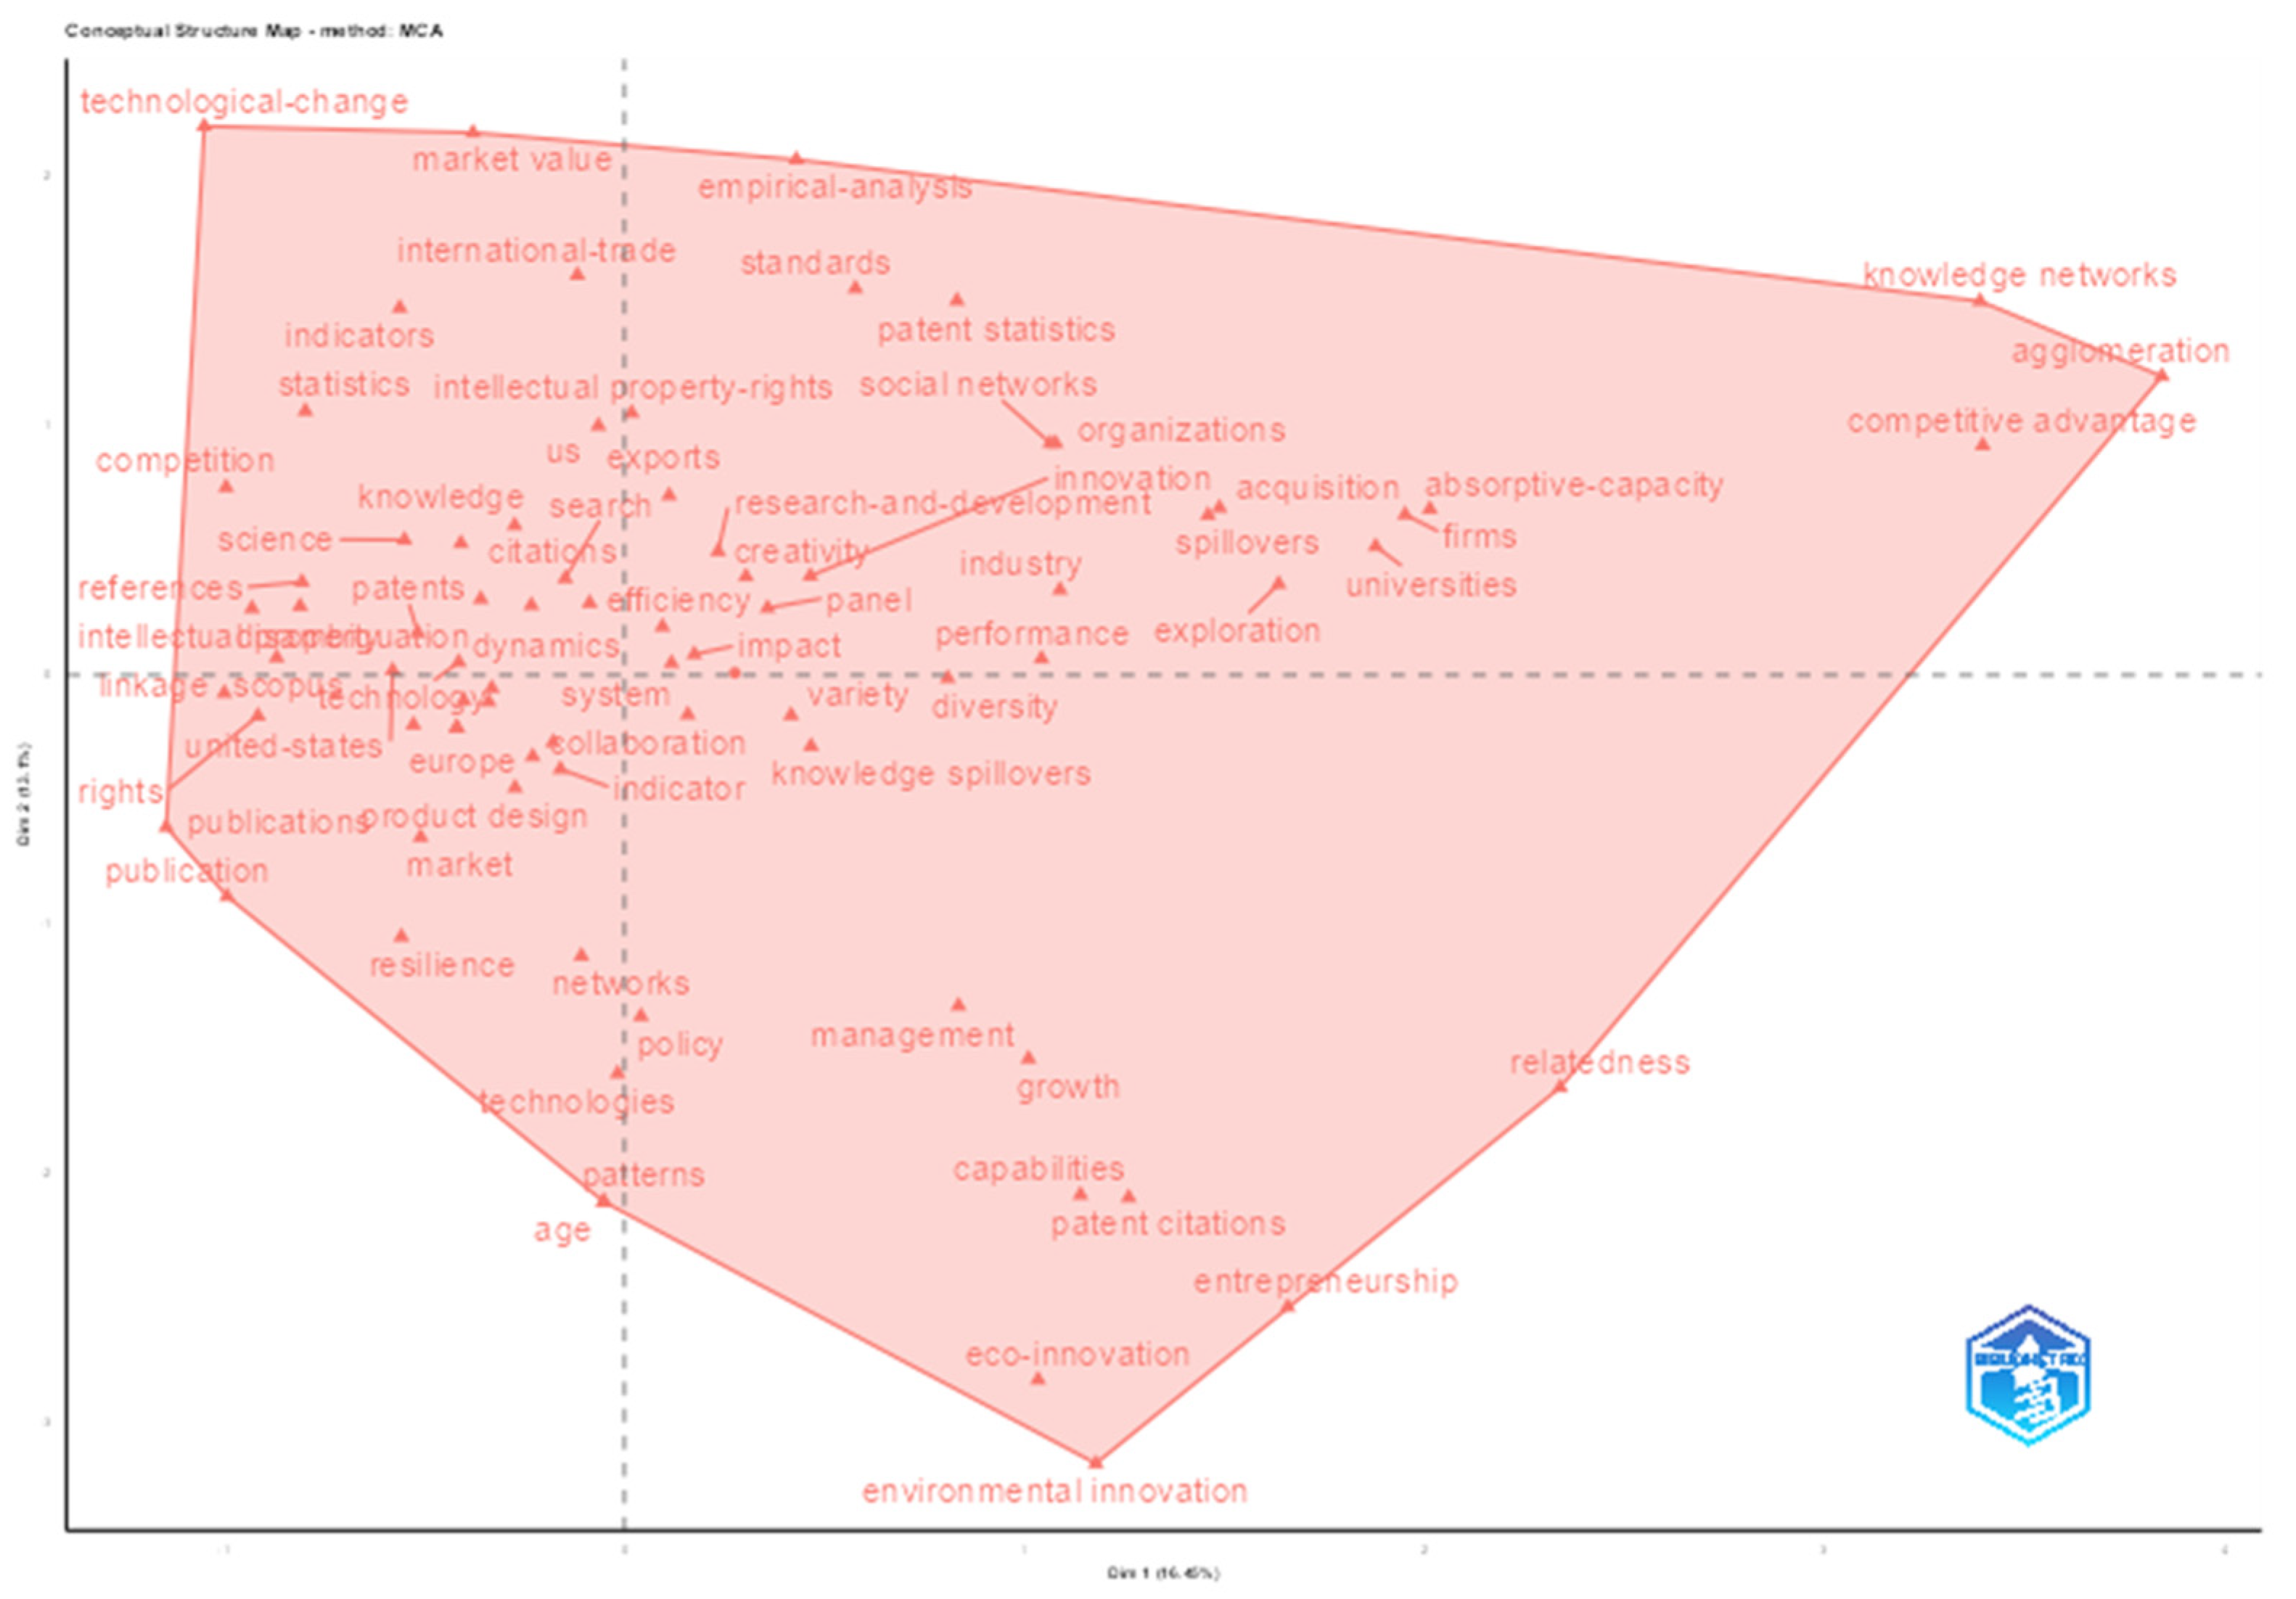
The next bibliometric analysis consisted of a factorial analysis, as illustrated in
Figure 15. This technique was based on a multiple correspondence analysis (MCA) applied to keywords associated with individual documents. Its purpose was to identify thematic and structural clusters within the field of study. The axes Dim1 and Dim2 were used as principal components explaining the highest variance in the associations between keywords and authors.
Specifically, Dim1 measured how the associations between terms reflected structural or conceptual contrasts—such as applied versus theoretical themes. Dim2, in turn, captured the residual variance, representing how groupings were internally formed within conceptual or structural blocks (e.g., methodological, geographic, or analytical level differences, such as municipal vs. national focus). The greater the absolute value of the indicator (positive or negative), the stronger the term’s association with that dimension.
The factorial analysis revealed the formation of a single cluster composed of various core terms. Dim1 contrasted topics such as territorial concentration, knowledge networks, and absorptive capacity, organizing the literature around organizational and spatial innovation dynamics. Meanwhile, Dim2 highlighted contrasts between technological change, market performance, and empirical validation, thereby positioning studies on the economic and commercial impacts of innovation. Notably, the terms technological change, market value, and international trade reinforced the trend toward market-oriented studies and the measurement of technological effects.
Thus, Dim1 emphasized an organizational and structural orientation of innovation, specifically focused on territorial dynamics, interorganizational competencies, and collective learning. Meanwhile, Dim2 reflected market outcomes and economic transformation, particularly by concentrating the associations on the effects of innovation, such as economic valuation and empirical analyses. The presence of only one cluster limited segmentation but still allowed for the visualization of conceptual associations and proximities among documents.
3.9. Scientific Subject Areas of Journals
The thematic distribution by scientific subject areas was directly extracted from Scopus using the subject-area item. This item registered a total of 197 associations, as shown in
Table 2, a figure that exceeded the number of 94 documents captured in this database. As a single article may be indexed in multiple thematic areas according to the categorization of the journal in which it is published, there was an overlap of articles across more than one classification.
There was a predominance of research in the field of applied social sciences, with 54 records (a combination of the subject areas business, management, and accounting with economics, econometrics, and finance). However, at the individual level, as shown in
Table 2, the leading subject area was social sciences (n = 38), followed by business, management, and accounting (n = 36), and computer science (n = 29). Together, these three groups represented 52.28% of the total. In addition to applied social sciences and social sciences, the fields of engineering and technology gained relevance among the most prominent areas. Studies in psychology, multidisciplinary subjects, and health-related topics were less represented.
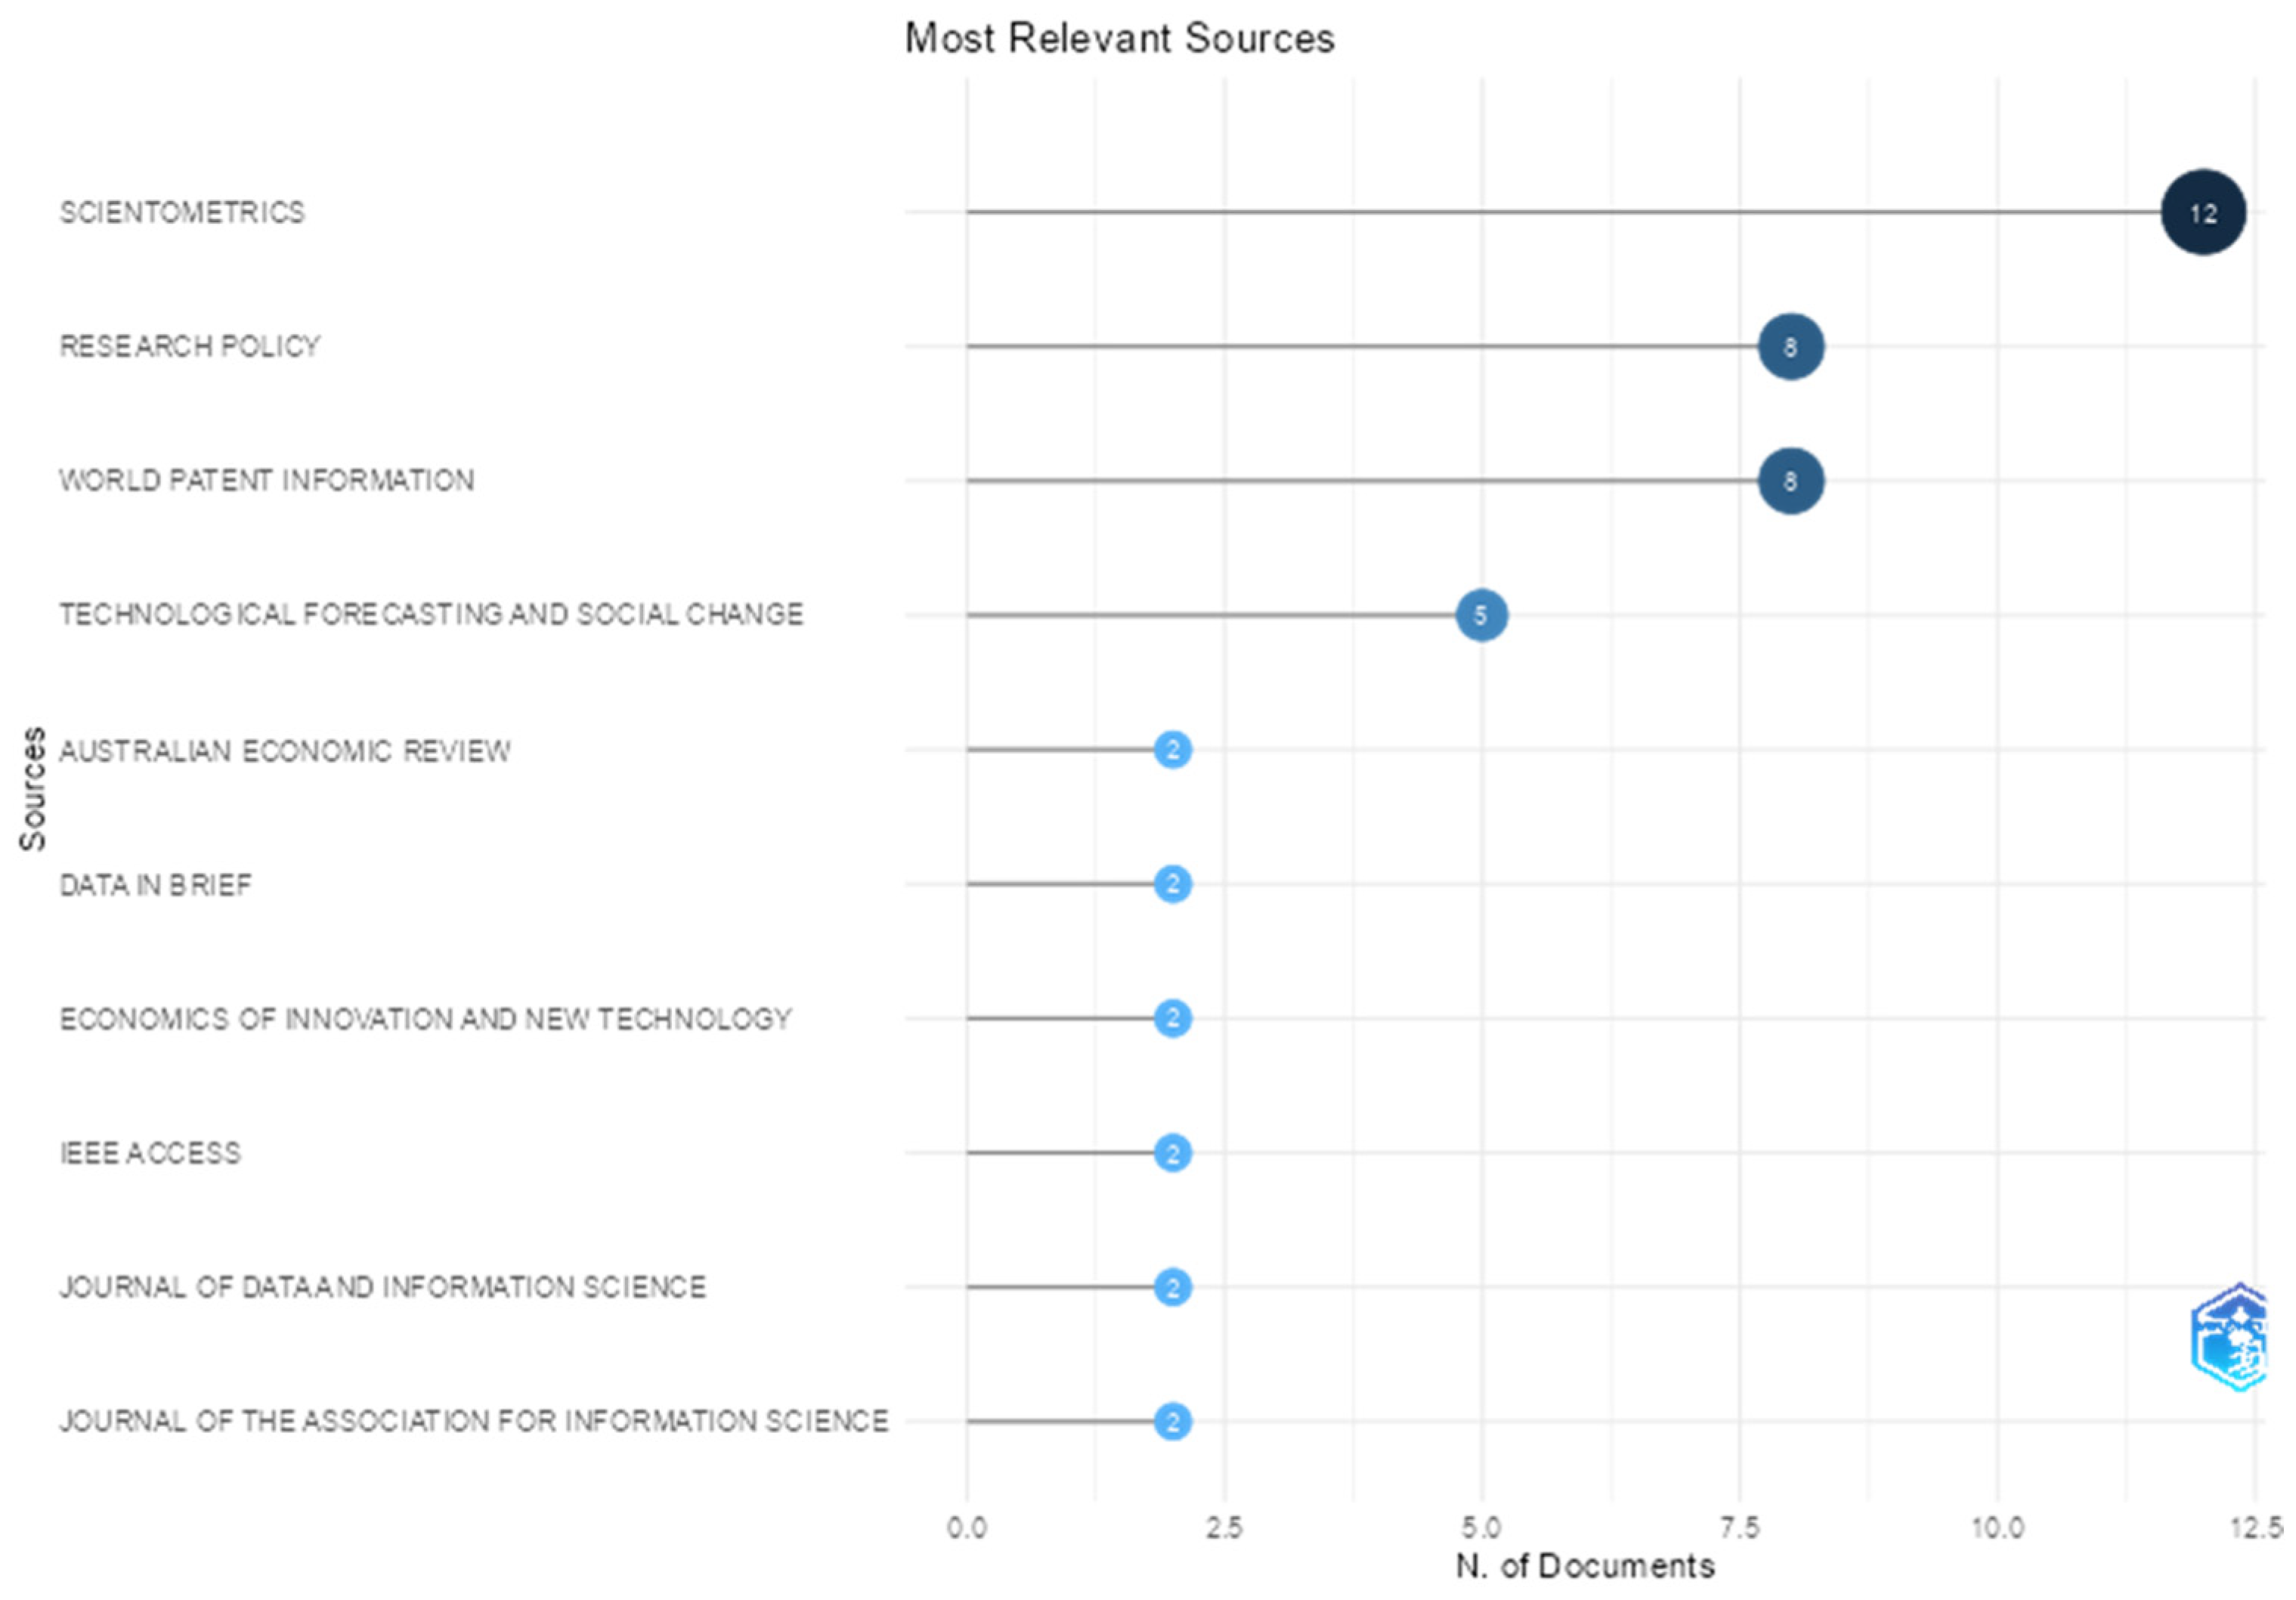
The next stage determined the journals with the highest number of published articles, as shown in
Figure 16. There was a significant concentration of scientific production in a few specialized journals.
Scientometrics was the leading journal in the databases associated with the term PATSTAT, with a total of 12 articles. The journal focuses on quantitative analysis of science and had a Journal Impact Factor of 3.5 in 2023. Several publications were related to bibliometrics and innovation studies.
Research Policy and World Patent Information each published eight articles. Both journals are highly regarded in their respective research areas. The former is a reference in science and innovation policy topics, while the latter focuses on patent data, with interests in technology and intellectual property. Research Policy achieved a Journal Impact Factor of 7.5 in 2023 and a CiteScore of 15.0 for the period 2021–2024, while World Patent Information received a Journal Impact Factor of 2.2 (2023) and a CiteScore of 4.5 (2020–2023).
Technological Forecasting and Social Change ranked fourth, with a total of five articles. The journal aligns with topics related to technology foresight and public policy, encompassing both analytical and predictive scopes in its publications. It holds the highest journal impact factor among the top four most relevant journals (12.9 for 2023), as well as the highest CiteScore (21.3 for the period 2020–2023).
Most of the remaining journals—50 out of a total of 62—had only one article published on the PATSTAT topic. Therefore, there was a concentration in core journals such as Scientometrics and Research Policy but also a significant dispersion of publications across peripheral sources, reflecting the interdisciplinary nature of PATSTAT.
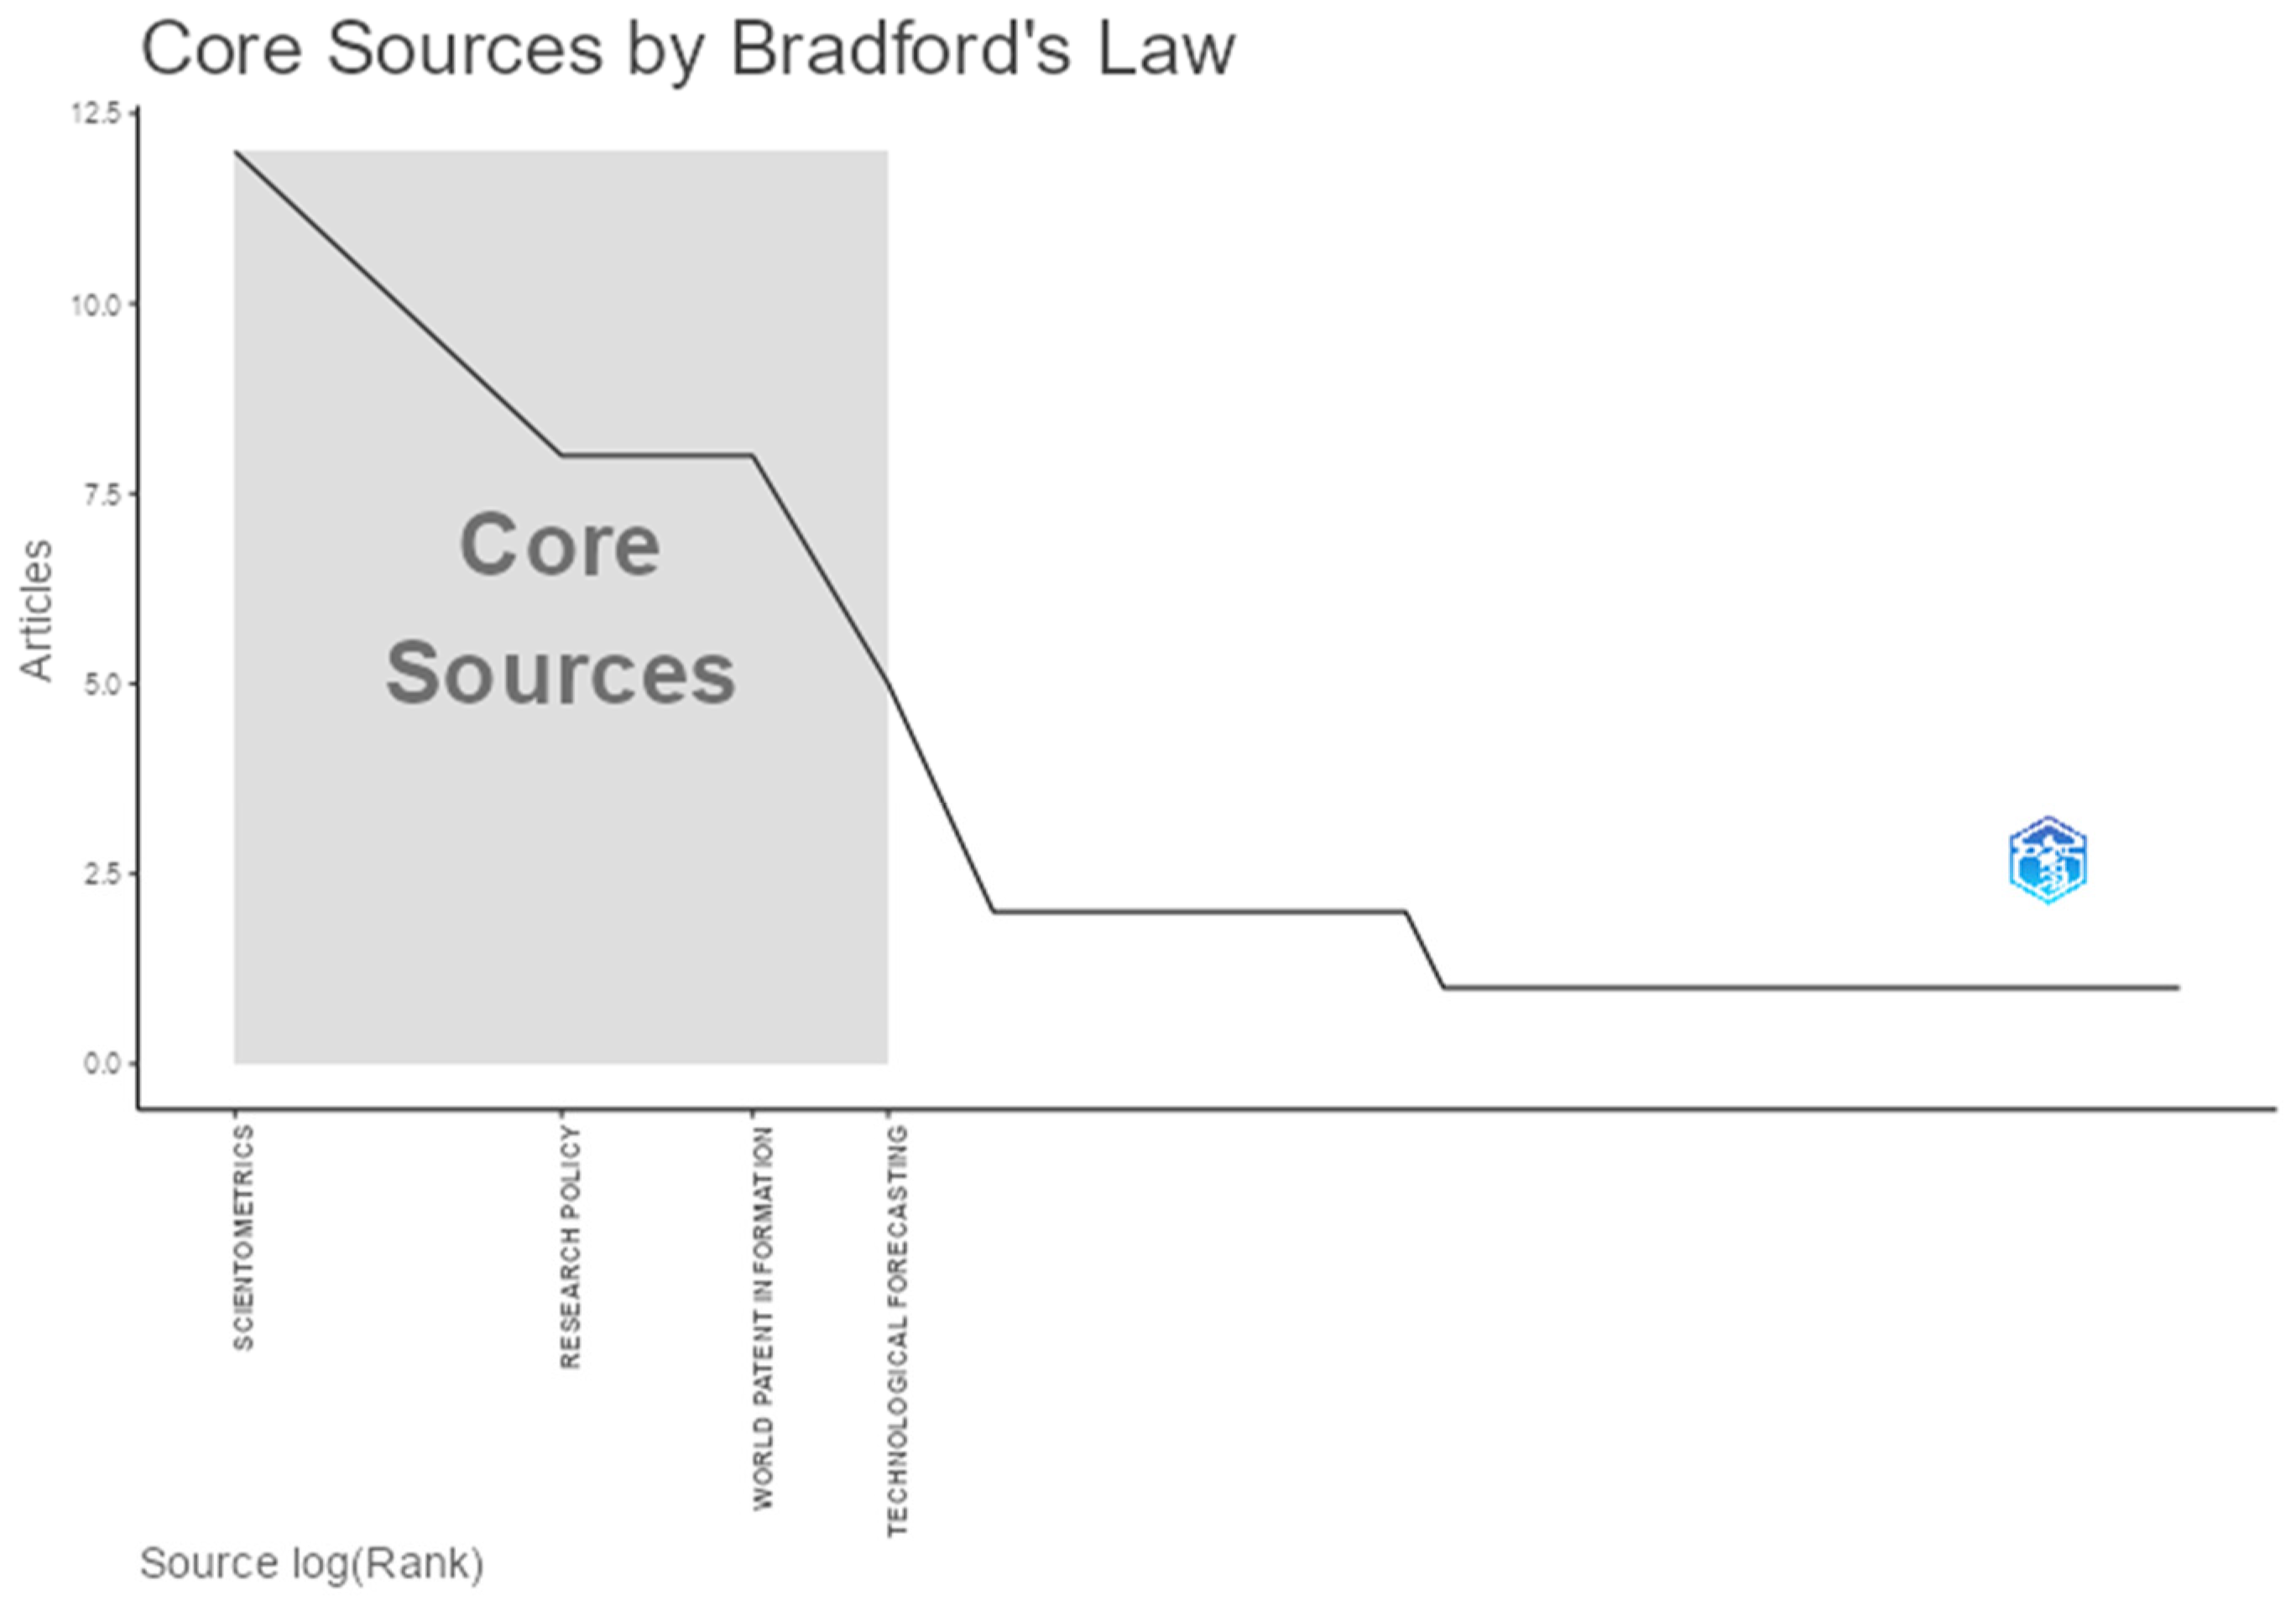
The Bradford’s Law analysis, presented in
Figure 17, divides journals into productivity zones, highlighting the concentration of scientific knowledge in a few relevant journals. The calculation considers a proportional division of the total scientific production into three zones, following the classical Bradford’s Law formulation, with one-third of the publications in each zone.
Zone 1 corresponded to the core of the production, i.e., the most influential journals on the topic. This zone included the four most productive journals: Scientometrics (twelve articles), Research Policy (eight articles), World Patent Information (eight articles), and Technological Forecasting and Social Change (five articles). These four journals accounted for 33.3% of the total article output on the topic (33 out of 99 articles), highlighting their role as the main channels for disseminating knowledge about PATSTAT.
Zone 2 included intermediate sources by aggregating journals with two articles and some of those with a single article, totaling 27 sources. It comprised journals ranked from the 5th to the 31st position, collectively contributing approximately another 33% of the total output. This group included journals with moderate relevance to the field, many of which have broader disciplinary or multidisciplinary scopes.
Zone 3 covered peripheral sources, consisting of 31 journals, each with only one article. Representing the long tail of the distribution, this zone included journals ranked from the 32nd to the 62nd position, which were less central but still contributed to the plurality of the research field.
3.10. Citation Distribution and Structure
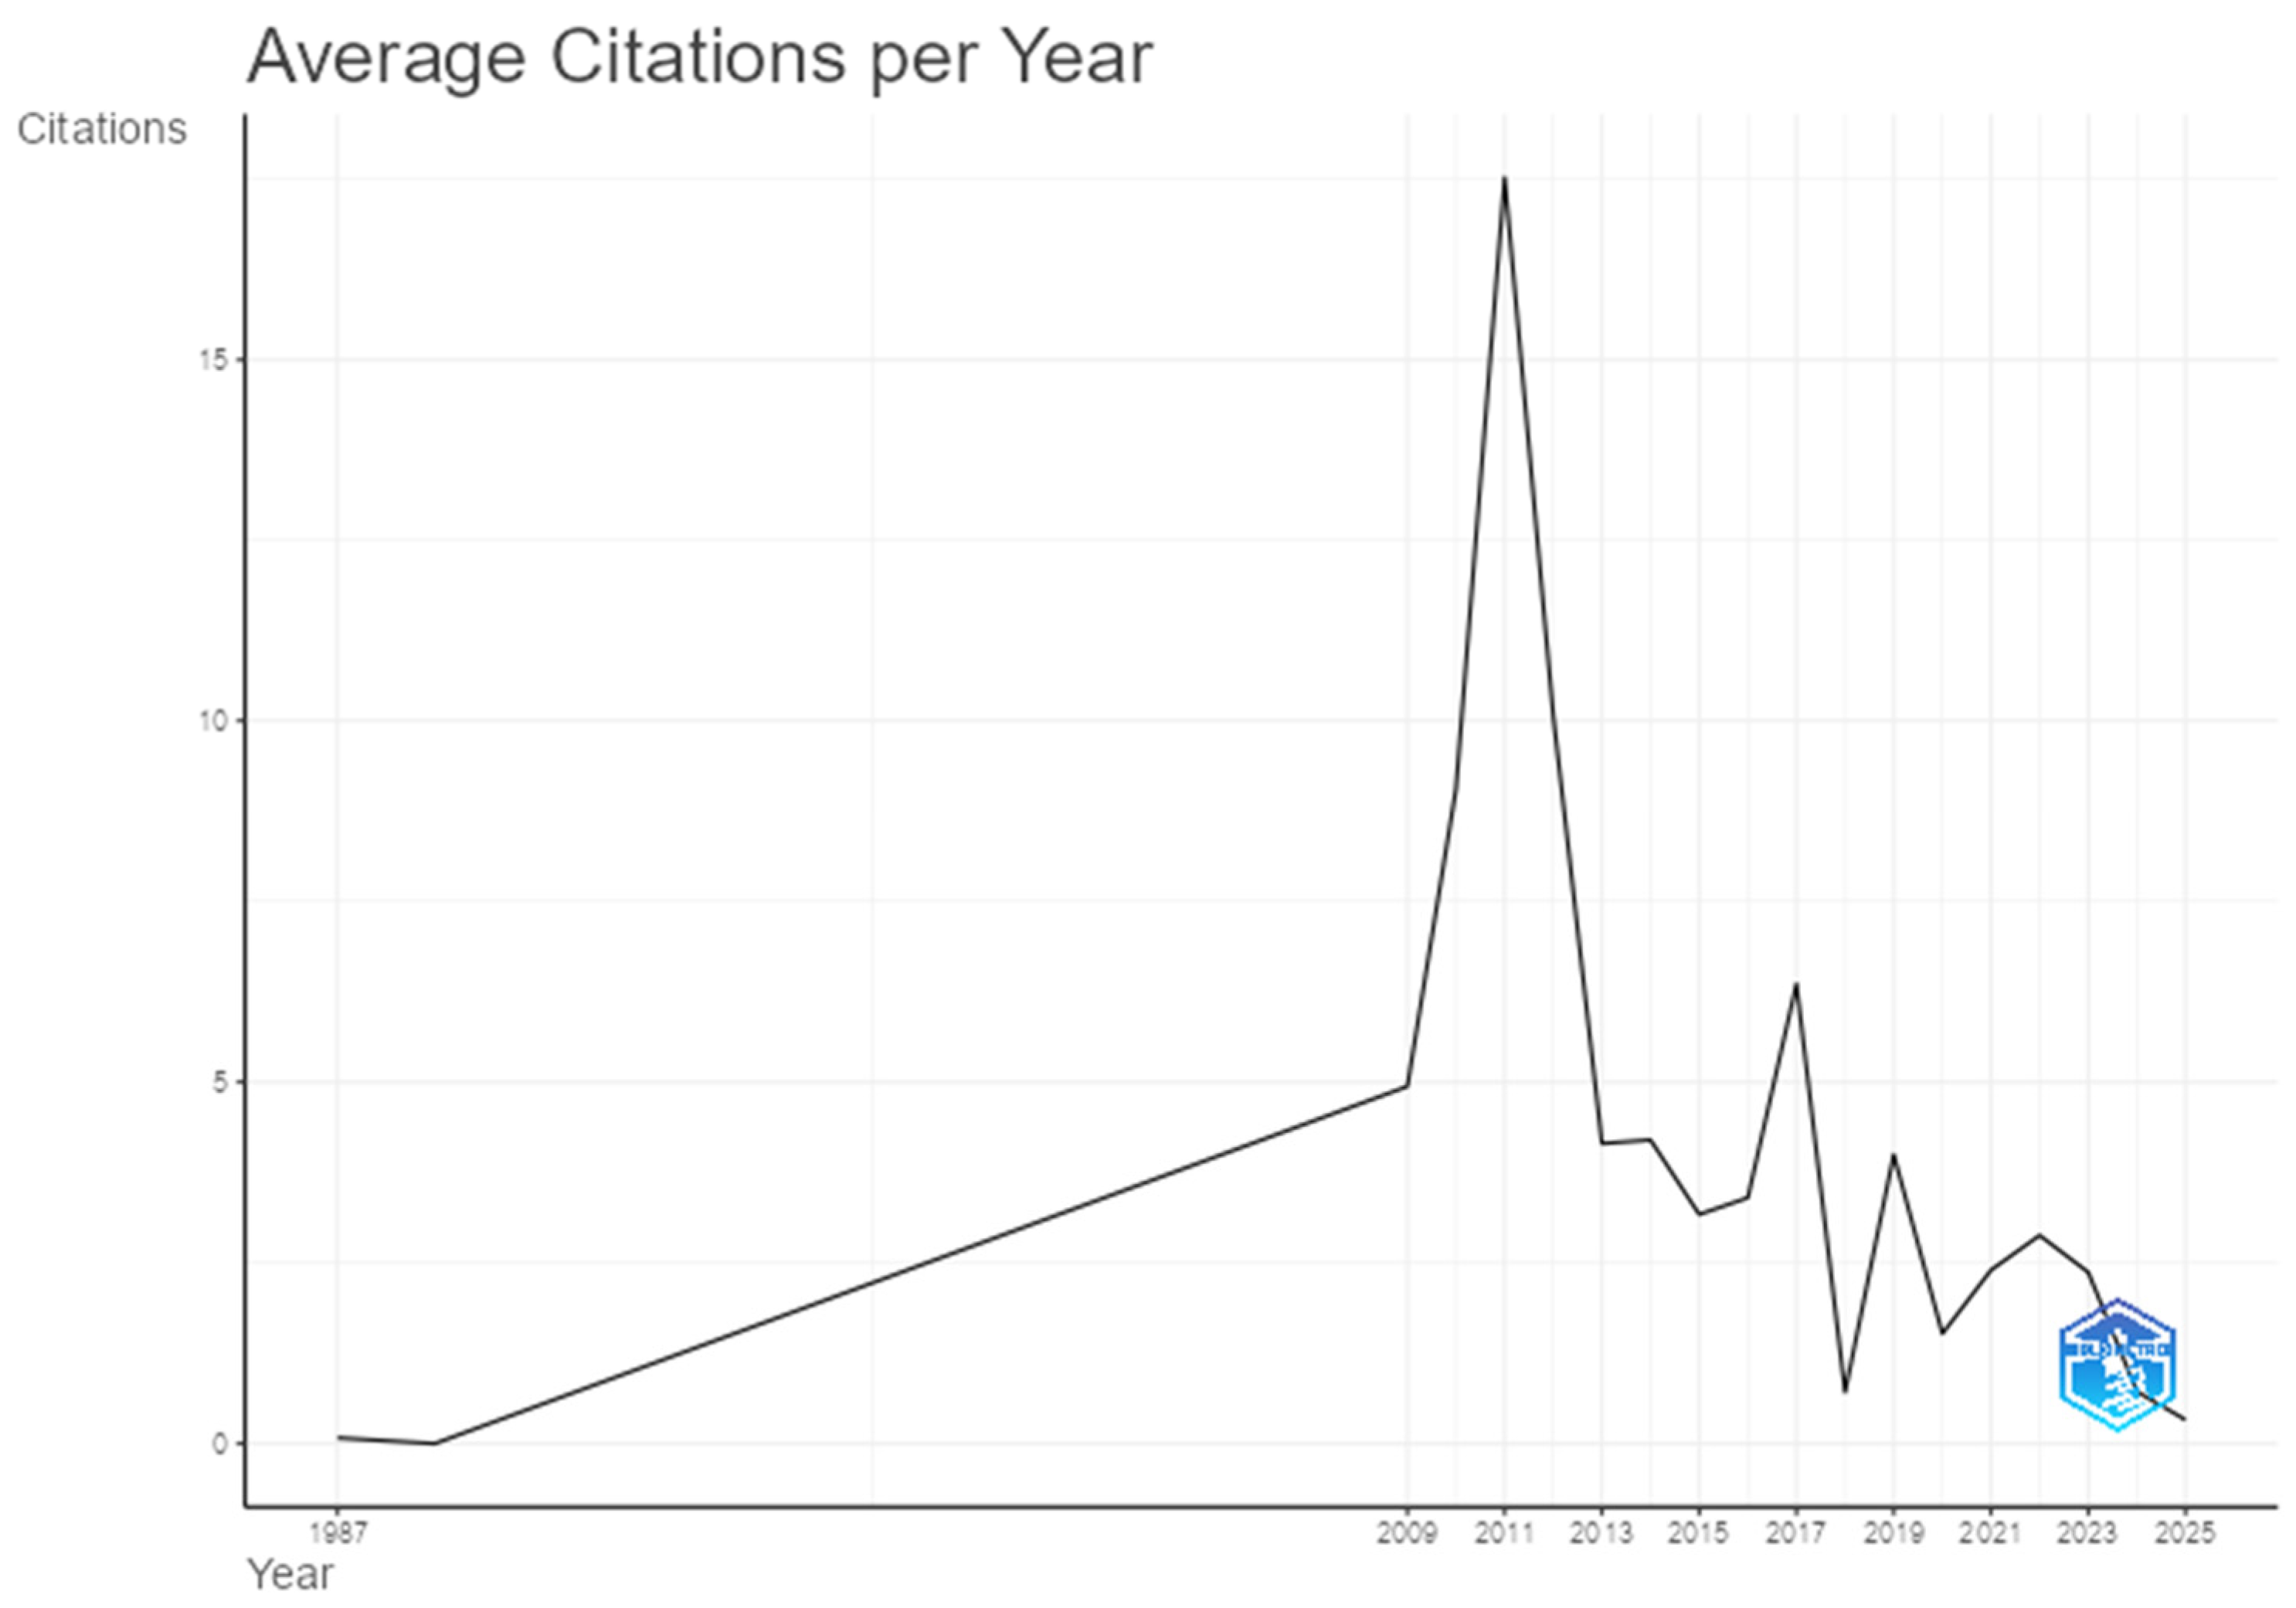
The temporal evolution of publication impact, measured by the number of citations received annually, is presented in
Figure 18. This analytical scope reveals when articles from both databases began to be cited and in which years the most influential works were concentrated.
Citations began in 1987, but the temporal trajectory revealed a strong asymmetry regarding PATSTAT. The average number of citations per article remained marginal until 2008, followed by a shift marked by an increased impact between 2009 and 2011, especially in 2011, which recorded a peak average of 263 citations per article and an annual average of 17.53 citations over 15 citable years, as depicted in the chart.
The year 2010 was also significant, with 145 accumulated citations, reflecting an impact of 9.06 citations per year. This scenario highlights the presence of seminal studies on PATSTAT that elevated the database’s average citation index, even though the number of documents published per year remained limited. This pattern reinforces the long-term relevance of these studies, while more recent publications show lower average citation levels—likely due to their shorter exposure time, despite a higher publication volume.
The next bibliometric analysis presents the set of articles with the highest global impact in terms of total citations, as shown in
Figure 19. This chart identifies the most influential articles, which serve as the foundational pillars for studies on the topic.
The main contribution in the literature was the article by Popp (2011), published in Energy Economics. This article has accumulated 374 citations and an average of 24.93 citations per year, indicating sustained influence over time. Next, the study by Ghisetti (2017), published in Ecological Economics, achieved a similar annual citation average (24.66) but with a higher normalized citation score (3.88 compared to 1.42 for Popp’s article). This performance demonstrates a high impact, particularly considering the article’s more recent publication date, as normalization accounts for the article’s citation count relative to the average number of citations in the database.
The next three most cited articles were authored by Johnstone (2012), De Rassenfosse (2013), and Marin (2014), all of which hold significant scientific relevance. Their annual citation averages exceed 12, and normalized values are above 1.3, indicating well-established literature.
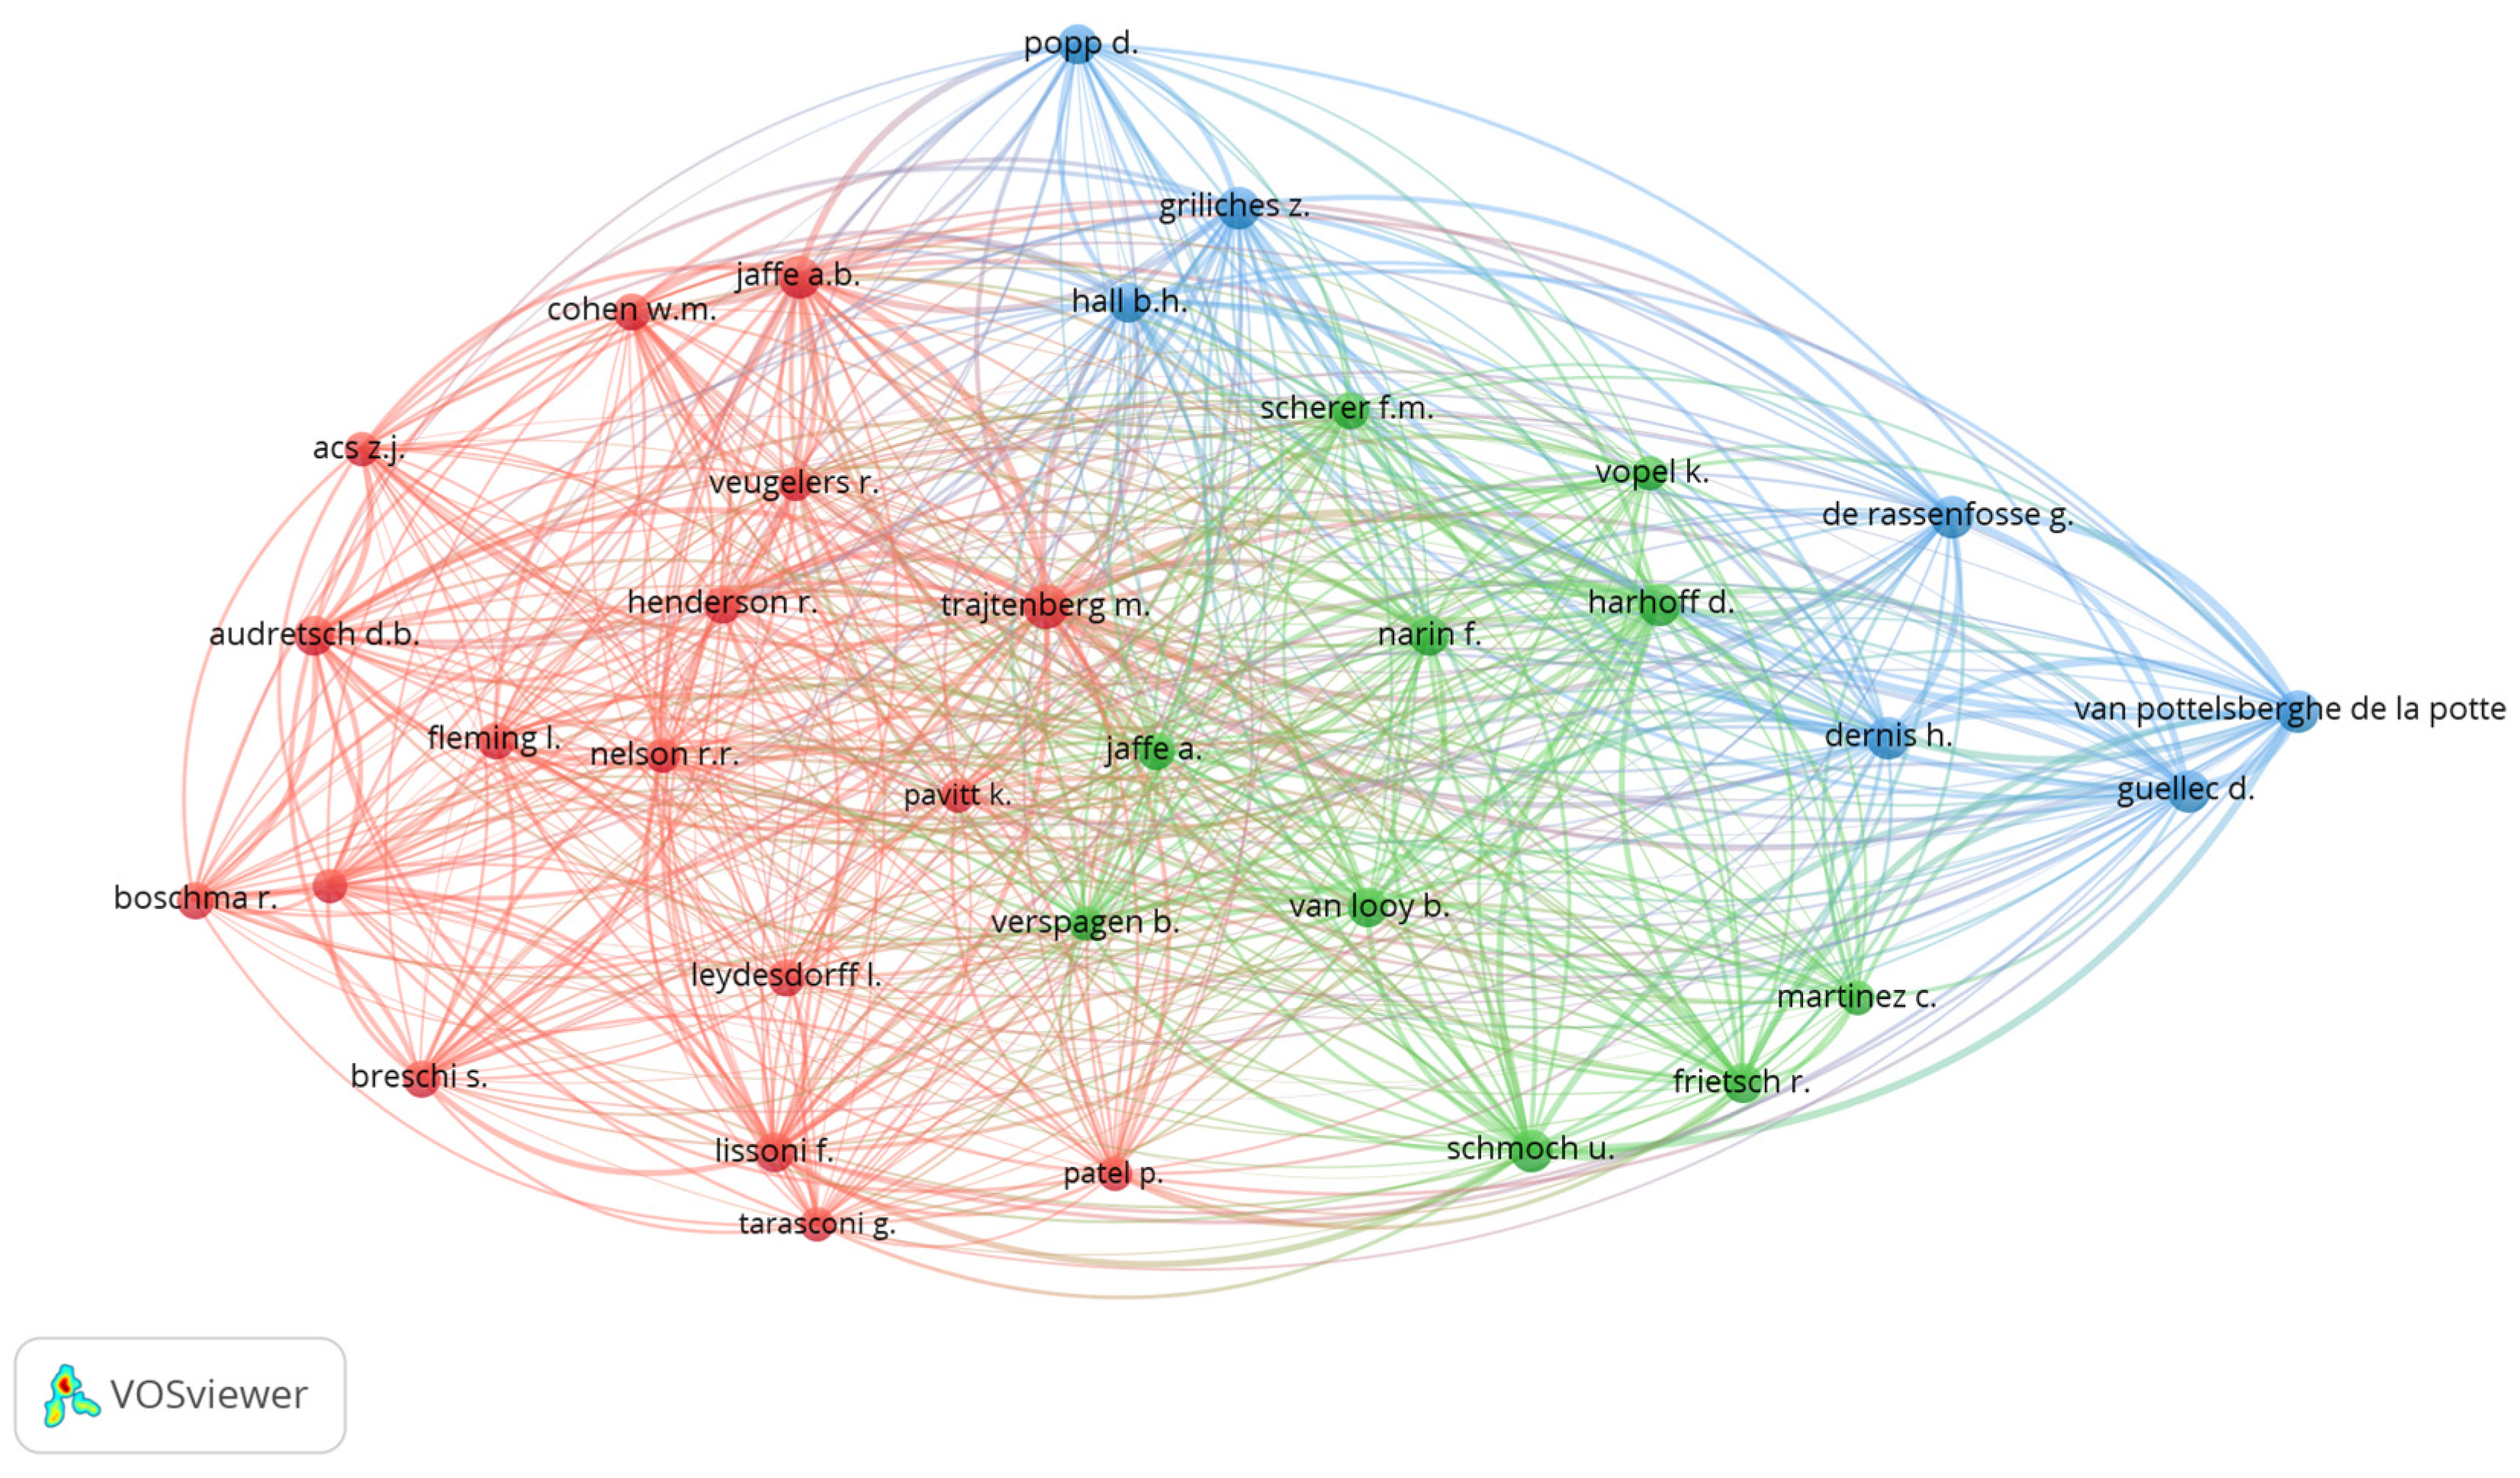
The next bibliometric analysis concerned author co-citation and allowed the mapping of the intellectual structure based on how frequently pairs of authors were cited together in the same documents. Unlike co-authorship, which highlights direct collaboration, co-citation describes conceptual or methodological proximity in research. Authors who frequently appear in the same reference lists tend to share similar approaches, complementary topics, or contributions to a common research theme.
The map in
Figure 20 highlights the position of three large interconnected clusters. The red cluster includes authors such as Trajtenberg, Audretsch, Cohen, Nelson, Boschma, and Leydesdorff, who focus on evolutionary economics, entrepreneurship, regional innovation, and knowledge systems studies.
The green cluster consists of Harhoff, Van Looy, Schmoch, Narin, and Scherer, with research centered on empirical analyses of innovation, patents, and science and technology policy. Lastly, the blue cluster includes Popp, De Rassenfosse, Guellec, Hall, and Van Pottelsberghe de la Potter, who are prominent in a more recent and empirical strand aimed at measuring innovation through patent data and assessing technological impact. Trajtenberg plays a central role by bridging the three groups, linking theoretical and applied approaches. The levels of density and connectivity among the clusters suggest the consolidation of the research field, combining classical topics with contemporary empirical approaches.
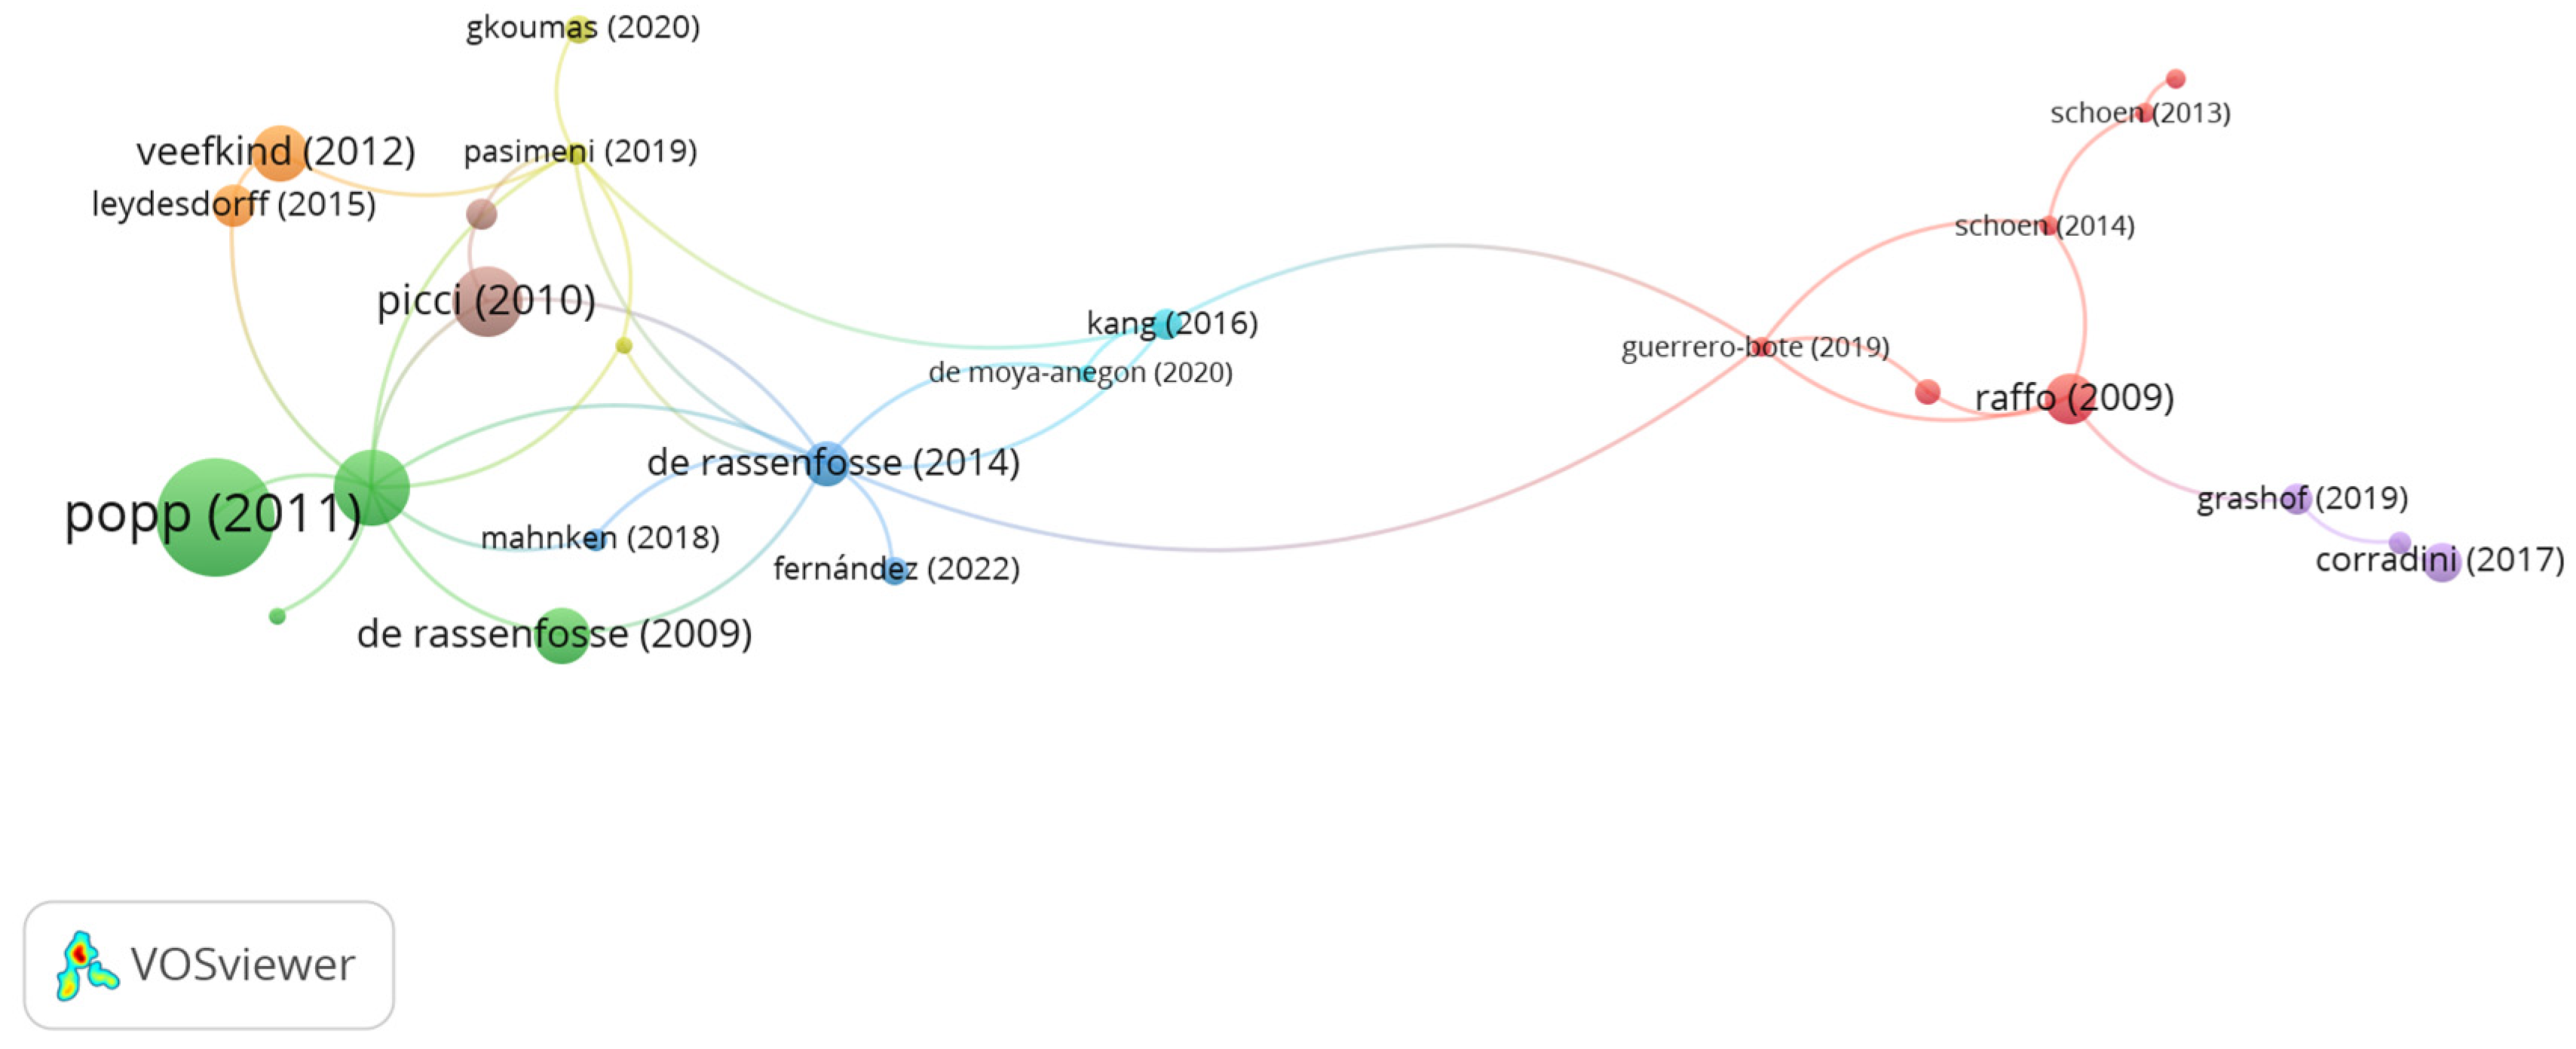
It is also possible to highlight citation levels of individual documents, identifying those that play a central role in shaping the research field. Unlike co-citation, which reveals links among jointly referenced sources, a direct citation analysis shows which documents cite other documents, thus mapping the degree of direct intellectual influence.
Figure 21 divides the map into two groupings. The first, on the left, is led by the contribution of Popp (2011), whose node is the most prominent in the entire network, indicating its influence as the most cited article. The green cluster includes other important studies, such as those by De Rassenfosse (2009, 2014), Veefkind (2012), and Picci (2010), which are closely aligned around the theme of innovation measurement, patent databases, and science and technology policy.
On the right side is the red cluster, formed by Raffo (2009), connected to the contributions of Schoen (2013, 2014) and Guerrero-Rome (2019), whose topics focus on comparative approaches to national innovation systems and regional indicators. Positioned between these two clusters are the studies by De Rassenfosse (2014) and Guerrero-Rome (2019), which serve as conceptual connection points. Therefore, a link between consolidated methodological strands is observed, with direct citations concentrated in a few seminal studies.
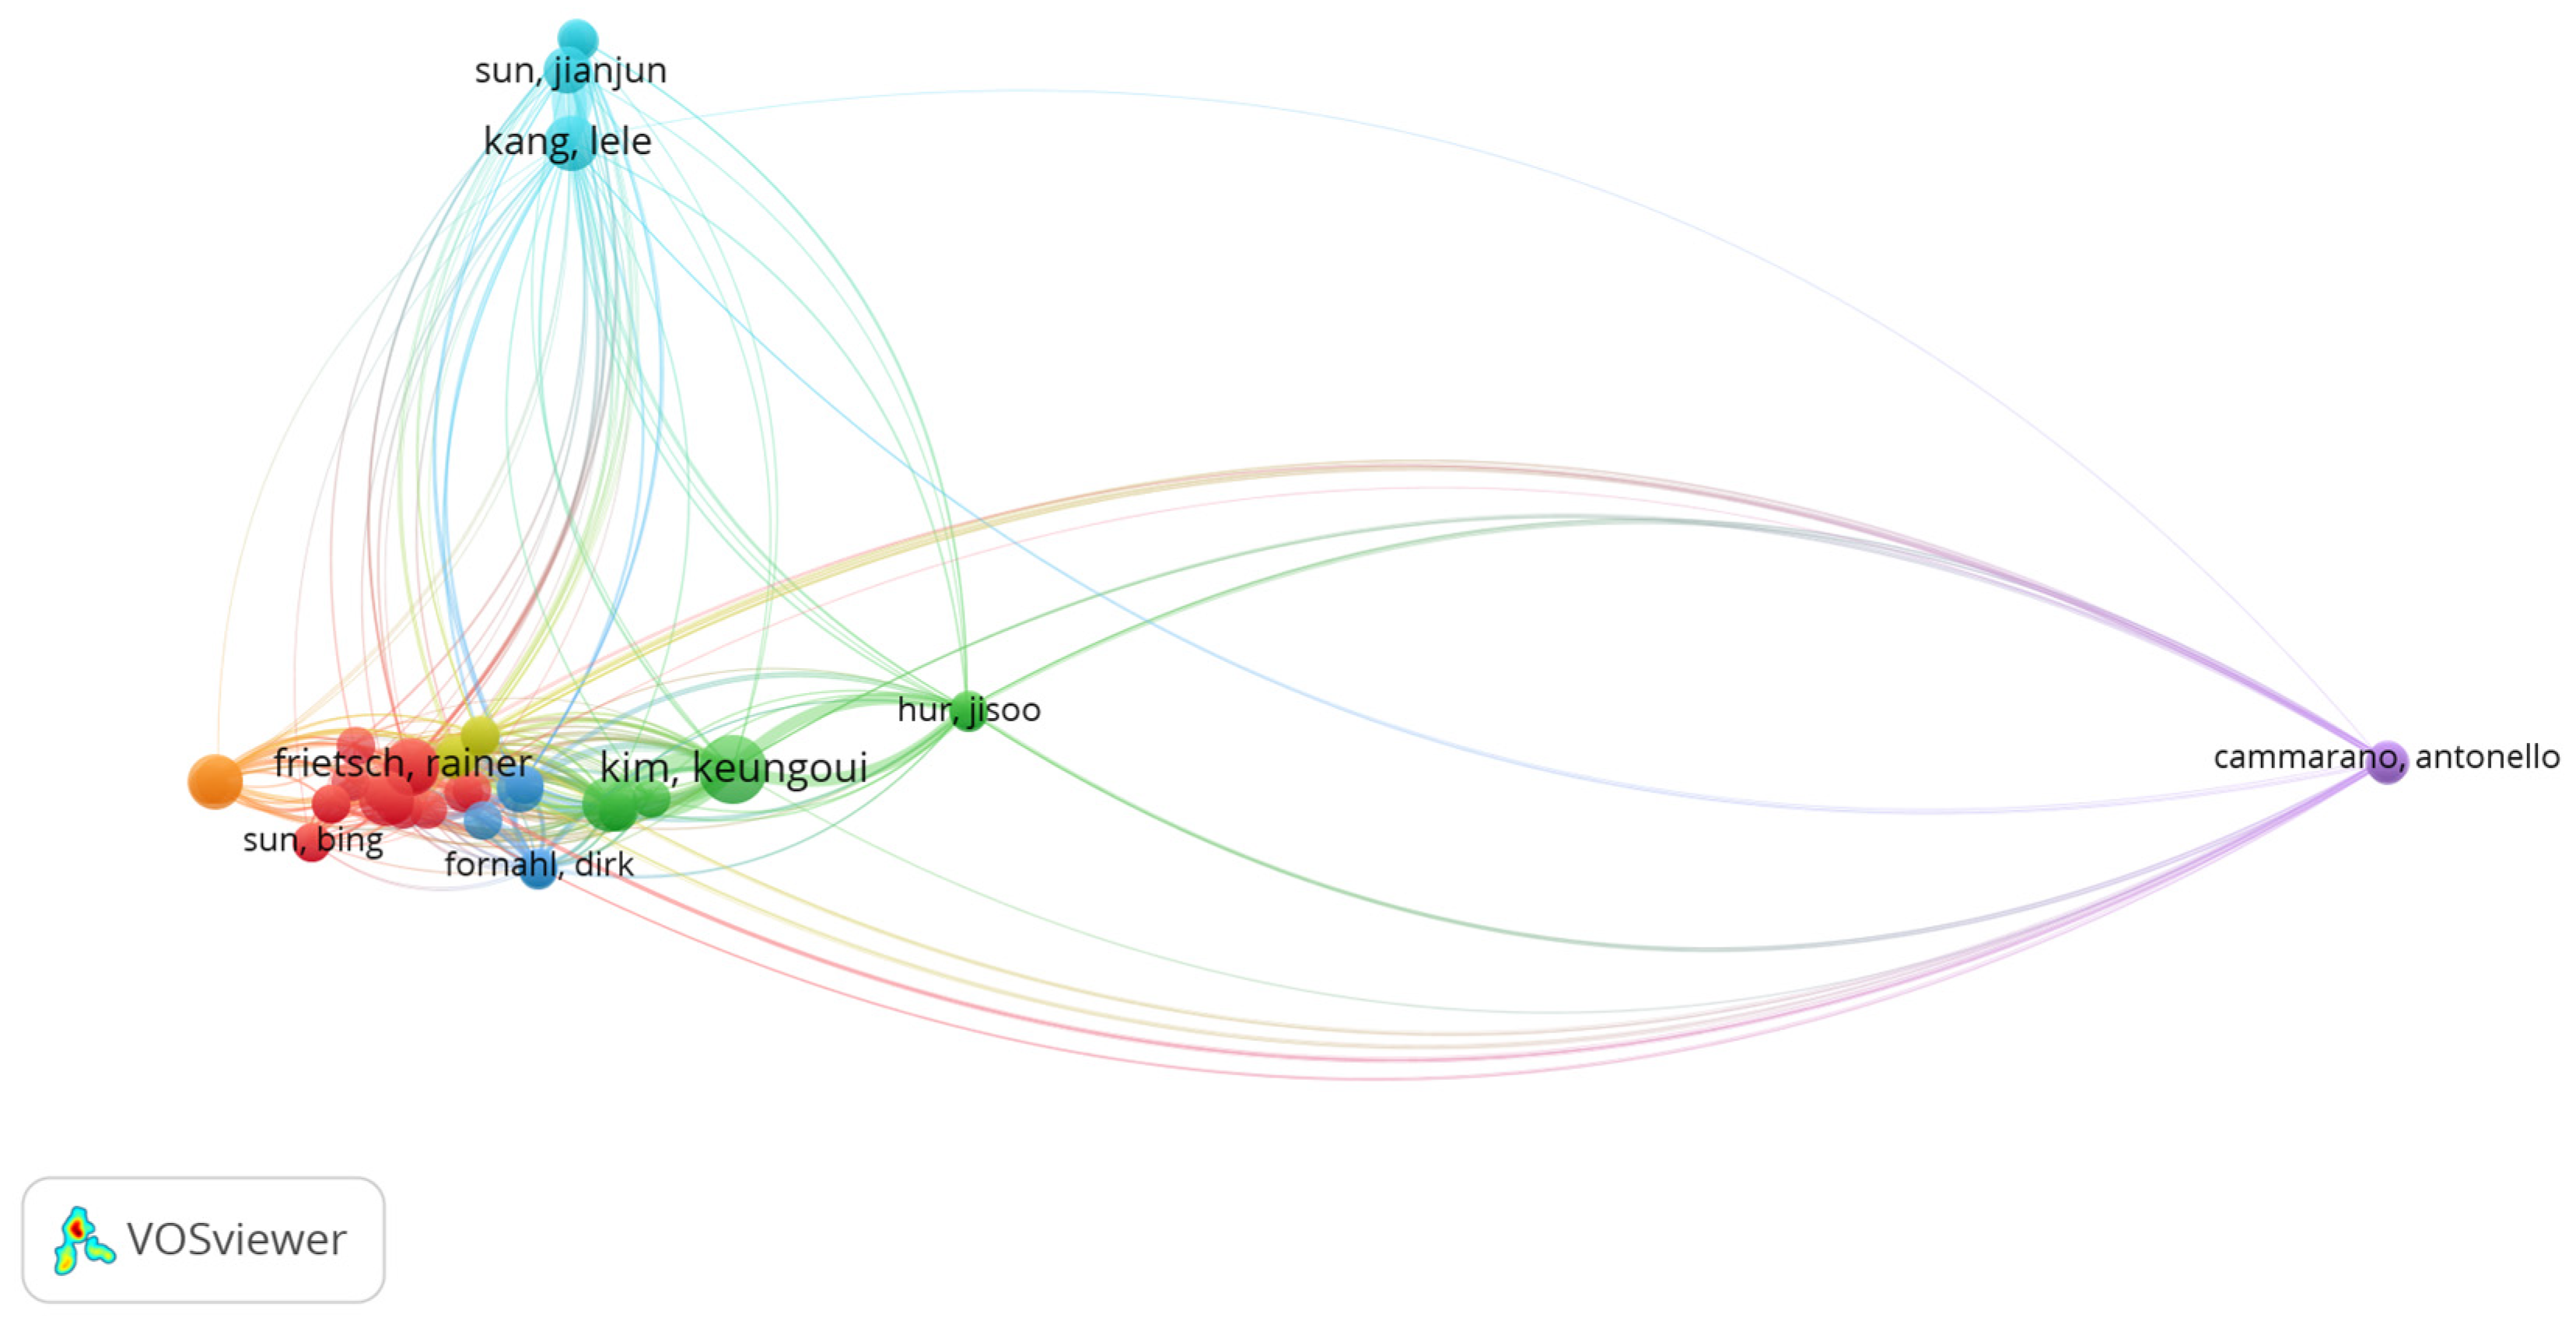
Finally, the last level of bibliometric analysis concerned the bibliographic coupling between authors. The objective was to assess the thematic proximity among researchers based on shared references cited in their articles. Two authors are bibliographically coupled when they cite the same sources, regardless of whether they have collaborated or been cited together.
Figure 22 reveals a structure composed of multiple interconnected clusters, mainly organized around three author-based axes. The highest density is located on the left side, comprising authors such as Rainer Frietsch, Keungoui Kim, Dirk Fornahl, and Sun Bing, who form a group with a high degree of overlap in the references used. This association arises from similar research themes, including regional innovation, public policy, and performance indicators.
The second group, arranged vertically in blue, is led by Jianjun Sun, Jing Shi, and Lele Kang, indicating a distinct research front that remains conceptually connected to other studies through shared references. On the right side, Antonello Cammarano forms an isolated cluster, with connections to several groups but without strong inclusion in a single core, reflecting a broad and distributed bibliographic base.
Overall, the map configuration illustrates a fragmented structure formed by closely related research lines with differing citation patterns, portraying diversity in both thematic focus and methodological approaches among the authors.
4. Discussions
The bibliometric analysis of the PATSTAT patent database provided insights into the structure, dynamics, and trends of studies, as well as the temporal evolution of the literature. The evidence was generated using the Bibliometrix and VOSviewer tools, which, when combined, enabled both quantitative and qualitative analyses to highlight the connections and maturity stage of research in this field. The metadata revealed a progressive growth in publications in recent years, reflecting not only increased academic interest but also practical relevance for applications in innovation policy evaluation and technological impact assessment.
Author productivity indicated a concentrated distribution, where a small group of authors accounted for a high level of output and may be considered leading figures and influencers in the field. Geographical distribution highlighted the leadership of European and Asian countries, particularly Germany and France, which also demonstrated strong collaborative activity. Conversely, China showed limited collaboration with other countries. According to [
20], international collaboration concentrated around a small group of highly interconnected countries may create a core structure that leads global science in both volume and impact.
The study of the most relevant journals identified
Research Policy,
Scientometrics, and
World Patent Information as leaders in both productivity and citation metrics. The concentration of scientific production in a few journals is discussed in the bibliometric literature, as it may have implications for the visibility and circulation of knowledge [
15]. This centralization can lead researchers to prioritize a limited set of journals, potentially creating a hegemonic effect to the detriment of emerging or regional journals. Additionally, [
21] argues that such a structure may restrict knowledge expansion and the debate surrounding certain paradigms and topics.
The most frequent keywords revealed emerging trends centered on “green innovation,” “artificial intelligence,” and “empirical analysis,” reflecting a shift toward empirical approaches with a focus on emerging technologies and sustainability. Ref. [
22] points to the increasing use of patent data to evaluate the effects of environmental policies on innovation and the potential of big data. Indeed, the knowledge required to handle big data on patents, particularly PATSTAT, demands appropriate tools to enable efficient data manipulation [
23].
The main conceptual axes were structured around the term’s innovation, patents, and PATSTAT. Core themes were well defined, and there were few emerging and dispersed topics, with a single conceptual cluster emphasizing the terms agglomeration, competitive advantage, and technological change, illustrating a connection between geographic location and the economic aspects of innovation. Ref. [
24] argues that geographic location and collaboration directly influence the innovative capacity of industries. Ref. [
25] reinforces the importance of patent indicators for studying emerging technologies and measuring innovation performance in developing economies.
Citation metrics highlighted the seminal contributions of authors such as Popp (2011) and De Rassenfosse (2009, 2014), whose works have had a significant impact. These articles served as references, frequently cited in subsequent studies that utilized PATSTAT. From another perspective, the co-authorship network identified the role of De Rassenfosse as a key connector across distinct groups, including collaborations with authors from various countries. From a methodological standpoint, there was an expansion of empirical research combining classical methods (regression analysis, econometrics) with contemporary approaches, such as artificial intelligence. The co-citation network placed Trajtenberg, Audretsch, Harhoff, and Van Looy as consolidated nuclei, while recent studies produced in Europe and Asia reflected the internationalization of PATSTAT through citation-based indicators.
Taken together, the various bibliometric metrics suggest that the literature on the use of patent data, particularly PATSTAT, is in a phase of maturation. This is evidenced by clearly defined theoretical axes, diverse methodologies, and an increasing articulation between applied research, impact assessment, and innovation indicators. The collaborative structure has international reach, and the citation patterns indicate a cohesive field, though one with room for expansion, especially through the integration of qualitative, quantitative, geographical, and computational approaches.
5. Limitations
Despite the contributions presented, this study faces several limitations in different contexts: database selection, file export formats, the merging of journal databases, bibliometric tools, research scope, and the bibliometric analysis method itself. Additionally, the results cannot be generalized from the perspective of patents, as other databases may reveal different characteristics, cover distinct time periods, or allow data availability based on criteria other than those applied to PATSTAT.
The selected journal databases have their own particularities, even though convergence in several metadata metrics was observed. The search fields differ between platforms, which makes it difficult to establish an exact comparison using the same criteria. The overlap may be minimal—such as between Scopus and Web of Science—or significantly diverge, especially when comparing one of them with Springer Nature. It is also important to highlight the relevance of collecting metadata from multiple databases, as relevant studies in specific topics or fields may be unevenly distributed. However, depending on the selected databases, the fraction of unique articles may be marginal, as suggested by [
26] in their comparison of WoS and Scopus. This situation was confirmed in the current study, although it should not be generalized.
The export formats available across databases represents another constraint. Some platforms provide multiple file formats (e.g., BibTeX, CSV, RIS, bibplain text), while others support only one. This variability complicates the integration process across databases and affects the column structure available for analysis.
As described in [
19], merging databases may pose a challenge to researchers. Despite valuable contributions from tools such as Biblioshiny and Bibliometrix, manual procedures may still be required for data cleaning and standardization. Moreover, the merging process may result in the loss of metadata by standardizing columns in a single file, which can restrict the analysis capabilities of bibliometric software.
In the case of this study, certain analytical layers returned errors in Bibliometrix, either due to eliminated columns, issues in the original metadata, or errors in RStudio processing. For VosViewer, the combined database version (merged file) limited the number of available analyses to two out of the nineteen supported by the software. Therefore, a separate Scopus file was used to expand the analytical scope, since it resulted in only minor sample loss (6%). Other researchers may face more complex challenges depending on the research topic, and this strategy may not be adequate in all contexts.
An additional limitation arises from the research scope combined with the selection process used in Springer Nature. The initial sample of 322 articles containing the term PATSTAT in any section of the article and filtered by language and document type (scientific articles) revealed a significant issue. From this sample, 298 articles did not mention PATSTAT in the title, abstract, or keywords, although 229 of them reported the use of PATSTAT data in the data, methodology, or results sections.
This finding points to a scientific limitation, as a considerable number of authors do not include key information, such as the data source, within the metadata fields (abstract or keywords). This omission may reduce the discoverability and citation potential of these articles. As researchers often rely on database searches to identify relevant studies, the absence of such information may restrict article visibility. This was precisely the case in the present review, which only considered the term PATSTAT in the title, abstract, or keywords. If authors had mentioned the dataset in the abstract or keywords, the review would have been broader and revealed different patterns in the bibliometric metrics. Although this finding was particularly evident in the Springer Nature database, similar issues may exist in Web of Science, Scopus, Wiley, and Emerald, potentially amplifying this limitation and underestimating the reach of PATSTAT.
Finally, from a structural perspective, bibliometric approaches are subject to coverage bias in databases, as most platforms prioritize journals and research in specific languages, regions, or fields. As a result, important studies might be excluded for not meeting those criteria. Dependence on metadata introduces another limitation, as errors may arise in the capture filters or in the metadata records themselves (e.g., inconsistent spacing, punctuation, or diacritics across databases), increasing the likelihood of errors during manual data cleaning.
To address some of these issues, certain procedures can be adopted by researchers. First, all relevant databases should be reviewed in advance using predefined search terms. Based on the volume of articles found and a manual inspection, researchers can determine whether one or two databases cover most of the relevant studies. This strategy prevents the critique of using a single database without prior assessment and may help avoid the merging issues described above.
Alternatively, researchers may choose to work with both databases separately. This approach might result in overlaps in analyses such as article productivity, citation counts, or journal rankings. However, by identifying exclusive records from the second database, researchers can perform complementary analyses. This method may be appropriate when one database is significantly more comprehensive (e.g., covering two-thirds of the sample), while the other includes a meaningful portion of unique articles (e.g., one-third). This strategy allows for descriptive statistics using Bibliometrix or combined graph generation in VosViewer to compare findings. Although this may result in more figures, it provides a more precise assessment than excluding analyses due to data loss during database merging.


