Article

FinTech, Fractional Trading, and Order Book Dynamics: A Study of US Equities Markets †

by
Janhavi Shankar Tripathi
1,* and
Erick W. Rengifo
2
1
School of Business, St. Bonaventure University, St. Bonaventure, NY 14778, USA
2
Department of Economics, and the Center for International Policy Studies, Fordham University, New York, NY 10458, USA
*
Author to whom correspondence should be addressed.
A preliminary version of the paper titled “The Impact of Fractional Trading on Order Book Dynamics” earlier circulated and published in the NYSEA 2023 Conference Proceedings.
FinTech 2025, 4(2), 16; https://doi.org/10.3390/fintech4020016
Submission received: 24 March 2025 / Revised: 18 April 2025 / Accepted: 23 April 2025 / Published: 25 April 2025

Abstract

:
This study investigates how the rise of commission-free FinTech platforms and the introduction of fractional trading (FT) have altered trading behavior and order book dynamics in the NASDAQ equity market. Leveraging high-frequency ITCH data from highly capitalized stocks—AAPL, AMZN, GOOG, and TSLA—we analyze market microstructure changes surrounding the implementation of FT. Our empirical findings show a statistically significant increase in price levels, average tick sizes, and price volatility in the post-FinTech-FT period, alongside elevated price impact factors (PIFs), indicating steeper and less liquid limit order books. These shifts reflect greater participation by non-professional investors with limited order placement precision, contributing to noisier price discovery and heightened intraday risk. The altered liquidity landscape and increased volatility raise important questions about the resilience and informational efficiency of modern equity markets under democratized access. Our findings contribute to the growing literature on retail trading and provide actionable insights for market regulators and exchanges evaluating the design and oversight of evolving trading mechanisms.
JEL Classification:
C0; G0; G1; G4; G5

1. Introduction

Financial technology (FinTech) has significantly transformed trading by improving market efficiency, reducing transaction costs, and enabling advancements such as algorithmic trading, blockchain-based systems, robo-advisors, and AI-driven analytics. Algorithmic and high-frequency trading (HFT) have enhanced liquidity and price discovery processes [1], though there have been concerns about market stability [2]. Artificial intelligence (AI) and machine learning applications, including deep learning and sentiment analysis, have significantly improved the predictive abilities in markets [3], but there are challenges around interpretability and bias mitigation [4].
Blockchain technology has introduced decentralized exchanges that enhance transparency and reduce counterparty risk [5], though there have been issues like liquidity fragmentation on decentralized exchanges [6]. Robo-advisors and FinTech-based trading applications, along with features like fractional trading, have democratized access to trading to increase retail investor participation, but there have been concerns around excessive gamification-driven risk-taking [7,8,9]. Fractional trading has recently emerged as a significant innovation, allowing investors to buy a fraction of a share of stock or exchange-traded fund (ETF), increasing accessibility and market participation. Studies suggest that fractional trading enhances financial inclusion by lowering entry barriers for retail investors while also contributing to increased market liquidity [9,10].
In December 2019, Robinhood started to offer fractional trading (FT) to its clients. Nowadays, other trading apps like Charles Schwab, Fidelity Investments, Interactive Brokers, M1 Finance, TD Ameritrade, and E-Trade also provide this FT feature.
Non-professional investors are frequent evaluators of their trades and, in general, are reluctant to make losses, making them behave myopically, i.e., pursuance of short-term results without considering future consequences [11]. It is also important to note that non-professional investors in general do not have the needed education and/or experience normally required from a professional one. As such, non-professional investors behave as “non-professional” noise traders, which are not the same as the “professional” noise traders described in [12]. Recall that at the time Ref [12] wrote their paper, stock exchanges were managed by trained professionals (with a required level of education, several certifications, and significant experience). These traders could behave as rational (fundamental) or noise traders, depending on their trades being based on information or speculation. Also, during this time, FinTech apps were not available as it was not fractional trading. These individuals tend to prefer outcomes that are certain and underweight outcomes that are only probable [13,14]. However, this behavior might have changed with the introduction of FT and direct and easier market access through commission-less FinTech trading apps. Without FT, non-professional investors will likely look for ways to reduce their risky allocations based on their frequency of portfolio checks and volatility and, in the extreme case, to completely move their investments to risk-free assets [11]. Recently, non-professional investors rely less on the advice of traditional professional investors (like professional advisors, and portfolio managers, among others) and rely more on the so-called social media influencers. Social media influencers and users of the subreddit wallstreetbets on the social news website Reddit appeared to have influenced Game Stop’s short squeeze. Thus, FT becomes a significant market development for risk diversification and portfolio creation for non-professional investors (and potentially with low disposable income), especially those looking for ways of getting access to stock markets (perceived as much more profitable than banks). In this vein, it is important to understand how non-professional investors’ behavioral changes in risk aversion, given their access to FinTech and fractional trading, affect the price discovery mechanism. To get a better understanding of this, using prospect theory framework developed in [11], the authors are also working on understanding the impact of fractional trading on risk aversion and wealth allocation behavior of non-professional investors and how this influences the trading behavior of professional ones.
FinTech-based trading applications provide commission-free trading opportunities to non-professional investors. They claim their mission is to democratize access to different financial instruments in the financial system. When an individual buys or sells stocks, ETFs, or options with a FinTech-trading app, they send the orders to market makers that typically would offer better prices than the public exchanges (Market makers are entities that provide liquidity by quoting both bid and ask prices. In return, they receive a small fee for executing orders from platforms like Robinhood). These market makers, in turn, pay a small fee to these FinTech-based applications for sending these trades to process through their platform. The market makers are competing with the exchanges, so they also offer rebates to the brokerages like FinTech-trading apps. This is one of the ways for platforms like Robinhood to remain competitive and provide different financial products and services at low costs. The objective of these FinTech-trading apps is to fulfill these orders in stocks and ETFs at the fastest rate possible. To ensure this fast and seamless order execution in case a few market makers are unable to execute orders, some of these orders in stocks and ETFs posted by retail investors using these apps are routed to exchanges, depending on the quality of the exchanges’ past executions. The FinTech trading platform will pay for the exchange when they take liquidity and are paid when they provide liquidity (Based on the description provided by Robinhood (https://robinhood.com/us/en/support/articles/stock-order-routing/) (Accessed on 1 April 2024)).
The rise of non-professional investors, driven by FinTech innovations such as commission-free trading platforms and fractional trading, has significantly altered the interaction between traders, brokers, and exchanges. Non-professional traders, empowered by easier access to markets and lower capital requirements, are participating more actively in trading, which has increased market demand and liquidity. Electronic Brokerage platforms like Robinhood, in turn, have adapted by offering user-friendly applications and tools to cater to this new wave of non-professional retail traders. This has led to greater competition among brokers and changes in order routing strategies to ensure better execution prices. Exchanges have responded by adjusting their systems to accommodate smaller trade sizes, such as fractional shares, and modifying order book structures to handle increased volumes and maintain market stability. Overall, the interaction among these parties has become more complex, with greater emphasis on providing accessibility, liquidity, and efficient price discovery while also managing the impact of increased retail participation on market dynamics (On March 20 2025, JP Morgan Research mentioned that US households are more invested in stocks than ever and it is distorting market valuation (https://www.cnbc.com/2025/03/20/us-households-are-more-invested-in-stocks-than-ever-and-its-distorting-market-valuation-says-jpmorgan.html) (Accessed on 1 April 2025)).
The primary research questions that we address in this paper are as follows: How has FinTech and fractional trading (FinTech-FT) influenced the structure of the limit order book (LOB)? Does FinTech-FT impact market liquidity, price discovery, and volatility in the stock markets? And how does the participation of non-professional investors with FinTech applications alter the price–volume structure and the price impact factor? (The price impact factor (PIF) refers to how a given trade influences the price of an asset, which depends on the depth of the limit order book (LOB). A steeper LOB means that trades will move prices more dramatically). This study builds on traditional market microstructure models [12,15] but departs from them by incorporating the influence of non-professional investors that behave like non-professional noise traders that use FinTech applications. We argue that the democratization of trading, especially with fractional trading, is altering the dynamics of the order book formation and liquidity. Previous studies (e.g., D’Acunto et al. 2019) [9] highlighted the impact of fractional trading on financial inclusion and liquidity. However, there is limited understanding of its role in modifying the structure of the limit order books and influencing retail investor behavior. Our research seeks to fill this gap by providing empirical evidence on how FinTech innovations, particularly fractional trading and access to FinTech trading apps, are reshaping order book dynamics, volatility, and liquidity.
To the best of our knowledge, this research is one of the earliest papers to study the impact of FinTech and fractional trading on order book dynamics. Moreover, our paper contributes to the growing literature on FinTech and market microstructure by enhancing our understanding of the impact of FinTech-based trading applications and features like fractional trading on financial price formation, stability, and regulation.
The rest of this paper is organized as follows. Section 2 presents a brief literature review about limit order books and their information content, followed by Section 3 with the data description. Next, in Section 4, we present the analysis by the top 5 and top 10 best quotes on the buy- and sell-sides, followed by Section 5, which presents an analysis by fixed cumulative volume and discusses the implications for the stock markets. Finally, Section 6 concludes this study.

2. Limit Order Books and Their Information Content

To explore the influence of FinTech and fractional trading on market dynamics, we begin by discussing the fundamental structure of limit order books and the information they contain.
In traditional market microstructure models such as [12] and [15], the limit order book (LOB) is shaped by professional investors, with market makers adjusting prices based on order flow and information asymmetry. These models largely focus on informed traders and market makers in the context of professional markets. However, the rise of FinTech platforms like Robinhood and the increasing participation of retail investors through fractional trading has significantly altered this landscape. Retail traders, often driven by behavioral factors, are more likely to engage in noise trading, which can introduce volatility and disrupt traditional market dynamics.
Ref [16] sets four assumptions that he uses to limit the behavior of limit order book participants: “(1) investors who trade against the book are rational and risk averse in that they choose their trade to maximize a quasi-concave function of their cash and share position; (2) there is the possibility of informed trade in that an investor’s marginal valuation is affiliated with the future payoff of the security; (3) there are a large number of risk-neutral limit order submitters; (4) in the presence of more than one exchange, investors can costlessly and simultaneously split their orders among the exchanges.” Our paper shows that professional investors (who are rational and risk-averse and who set their orders based on their marginal valuation linked with the future payoff of the security) are part of regular trading. For example, they face an increasing number of non-professional investors or traders that cannot be clearly distinguished. By trading with these non-professional investors, they are simply pushed to become more risk-averse. This natural response motivates them to set their quotes with a smaller number of shares offered (demanded) at higher (lower) prices in the ask (bid) sides of the LOB. This is a completely rational reaction from professional traders that also goes hand in hand with their marginal valuation, this time based on highly volatile and more uncertain future payoffs of the securities.
Our empirical study shifts focus from professional to non-professional investor behavior, examining how retail participation through FinTech impacts the LOB structure. We find that the price–volume curve steepens with the rise of fractional trading and that retail investor activity contributes to increased price volatility. Unlike traditional microstructure models, which assume market makers respond to order flow by providing liquidity, we observe that non-professional, retail-driven noise trading can cause higher volatility, wider bid–ask spreads, and market dynamics that deviate from established theories.
By drawing on the existing literature, including studies on payment for order flow (e.g., [17]) and electronic trading (e.g., [18]), our work empirically demonstrates the novel market structure influenced by FinTech platforms. The findings underscore the need to consider retail-driven market behavior in modern market models, challenging traditional assumptions about liquidity provision and price discovery in professional markets. Our paper contributes to the literature by providing empirical evidence of how FinTech platforms and non-professional investors are reshaping market microstructure and affecting price dynamics.
In Figure 1, we show a typical structure of a limit order book (LOB). It presents the volume (horizontal axes) offered at every available price (vertical axes). LOBs display the liquidity available at a given point in time as well as the price impact of an order of a given size. The flatter the LOB the more liquid and less volatile the market.
The "lob_normal" line presents the structure under a normal scenario without FinTech-FT. With FinTech-FT, as the market demand increases and the supply remains the same, it has the potential to modify the "LOB" structure, making it steeper by keeping the same volume ("lob_ft_samevol") or even much steeper if the volume offered is reduced ("lob_ft_reducedvol"). In this sense, our main testable hypothesis of this paper is that FinTech-FT does not have any impact on market liquidity, i.e., FinTech-FT has no impact on the price levels and the order book dynamics, controlling for time of the day, day of the month, and month of the year to try to have clear comparison observations.
Commission-less trading platforms like Robinhood also allow investors to place limit orders on their platforms (source: https://robinhood.com/us/en/support/articles/limit-order/ (Accessed on 1 April 2024.)). They also maintain inventory to execute regular market orders in regular exchanges. Increases in demand for stock trading with fractional trading on these platforms can potentially increase the demand for limit orders in regular markets. With FT and commission-less trading apps, the demand for investing in the stock market has increased [9,19,20], increasing the volatility of the mid-quote prices. As such, the volatility of mid-quote prices is positively related to the average size at a given price.
Further, when price impact factors are highly volatile, the stock markets do not provide fundamental value signals, making it hard to do informed trading. This goes against liquidity and the fundamental value signal as well. Investors are now faced with limited order books that are steeper (high price impact) and riskier (more volatile). Both contribute to market uncertainty that could affect professional and non-professional investors alike. Further, Ref [21,22] discuss that fractional trading has been a recent introduction and currently does not fit into the current national market system of trade reporting. The recent “rounding up” rule of trade reporting by FINRA can potentially distort market efficiency (The rounding up rule says that "When reporting a trade for a fractional number of shares, firms should delete the fraction and report the whole number, except if the whole number would be zero. If the whole number would be zero, firms should round up to 1. Where a trade is executed for less than one share, firms should round up and report a share quantity of 1." (source: FINRA Filing and Reporting – Trade Reporting FAQs)).

3. Data and Methodology

We use Historical Total View-ITCH data from Nasdaq. These data track individual orders for equity instruments from placement to execution or cancellation (The data processing pipeline for NASDAQ ITCH data is presented in Appendix A.2.). We analyze data during the trading hours (09:30–16:00) for February 2019, July 2019, November 2019, February 2020, July 2020, November 2020, February 2021, July 2021, and November 2021. The stocks used for this study are Apple (AAPL), Amazon (AMZN), Google (GOOG), and Tesla (TSLA). These are the most heavily traded stocks that cover, on average, 15–20% of the daily traded value (see Figure 2) (We select months before and after fractional trading to gauge the effect of fractional trading on order book dynamics. Further, to cancel any calendar effect, we analyze and compare numbers for the same months in different years for the representative stocks). We perform this analysis for both the buy- and sell-sides. To test the hypothesis, the analysis is conducted for November 2019 (pre-FinTech-FT) vs. February 2020 (post-FinTech-FT). Further, we also performed the analysis for February 2019 vs. February 2020, November 2019 vs. November 2020, February 2019 vs. February 2021, and November 2019 vs. November 2021 to compare at the month level in order to deal with any calendar effect that could be present in this study. As there was a stock split for Apple and Tesla in August 2020, we performed the month-wise comparison analysis using July 2019 vs. July 2020 (instead of November 2019 vs. November 2020) for these stocks. Also, we leave out the 2021 comparison to avoid any ambiguity in the results due to the stock split for these stocks.
This figure presents a stacked bar chart with the average percentage of traded value for Apple, Amazon, Google, and Tesla during the trading day for the months under study. We see that post-FinTech-FT, these four stocks account for 15–25% of the average daily traded value.
The price–volume structure, such as the one illustrated in Figure 1, shows the relationship between asset prices and trading volume. These are analyzed using liquidity measures, order book depth, and price impact factors. We analyze how buy and sell orders are distributed across price levels and how volume concentration at different price points influences price formation and market efficiency. To study the impact of FinTech and fractional trading on limit order book dynamics, we focus on two metrics: the price impact factor and the tick size.
The price impact factor (PIF) measures how a given trade (order flow) affects the assets’ price, i.e., the sensitivity of prices to the volume of trades. A higher price impact factor means that large trades cause more significant price changes. The PIF depends on the liquidity in the limit order book. If the book is shallow (steeper slope), large trades will move the prices more significantly, as the filling of these orders will significantly walk up or down the limit order books in order to absorb the trade. On the other hand, a deeper order book (flatter slope) absorbs trade more effectively, resulting in smaller price changes.
Further, tick size measures the minimum price movement for a given asset while the trade orders are placed on buy- and sell-sides. A smaller tick size allows for a smoother price discovery, i.e., the market participants can place orders close to mid-price (the lowest ask minus the highest bid prices). Smaller tick sizes are known to allow efficient price adjustments as new information becomes available. On the other hand, a larger tick size can reduce the ability of the order book to reflect the price changes efficiently. With larger tick sizes, the prices move in a larger number of steps (either up or down the books), the market may experience less responsiveness to new information, and price adjustments may be slower and less gradual, which goes against fundamental value signals and market efficiency. Smaller tick sizes tend to increase market efficiency, reduce bid–ask spread, and enhance liquidity, while larger tick sizes might reduce granularity, widen spreads, and create a less responsive market.
In this paper, we perform three types of analysis: analysis by the top 5 and top 10 best quotes and analysis by fixed cumulative volume.

4. Analysis by Top 5 and Top 10 Best Quotes

In this first part of the analysis, we fetch the top 5 and top 10 best quotes at each minute for the stocks under study. Then, we calculate the cumulative volume of shares of the stock until the 5 (10) best quote prices are reached. We get the change in price, defined as Δ p 5 = p 5 p 1 ;   Δ p 10 = p 10 p 1 . Similarly, we calculate the change in the cumulative volume of the shares of the stock traded. We get the change in cumulative volume as Δ q 5 = q 5 q 1 ;   Δ q 10 = q 10 q 1 . Further, we calculate the slope of the price–volume structure (i.e., price impact factor), P I F 5 = Δ p 5 Δ q 5 ;   P I F 10 = Δ p 10 Δ q 10 . Using these price impact factors, we test the changes observed in the price–volume structure post-FinTech-FT.

4.1. Empirical Tests and Results—Buy-Side

In this section, we perform the analysis for the buy- and sell-sides. We estimate the price impact factor at each minute for all the trading dates under analysis and perform the test for the equality of means and variances. In Table 1, we present the results of the test based on the analysis of the best five quotes at each minute (The results for tests based on the analysis of the 10 best quotes are presented in Appendix A.1.).
Table 1 shows that the averages of the slopes (buy-side) are statistically different from pre- and post-FinTech-FT. The results suggest that the price impact factors increased in February 2020 (post-FinTech-FT) vs. November 2019 (pre-FinTech-FT) by 56% (from −0.0009 in Nov 2019 to −0.0014 in Feb 2020), 124% (from −0.0025 in Nov 2019 to −0.0056 in Feb 2020), 100% (from −0.0015 in Nov 2019 to −0.0030 in Feb 2020), and 171% (from −0.0017 in Nov 2019 to −0.0046 in Feb 2020) for Apple, Amazon, Google, and Tesla, respectively. This suggests that placing a buy order for these stocks costs significantly higher post-FinTech-FT. Further, Apple’s price impact factors are 75% and 50% higher for February 2020 vs. February 2019 and July 2020 vs. July 2019, respectively. For Amazon, the price impact factors increased by 93%, 124%, 145%, and 472% for February 2020 vs. February 2019, November 2020 vs. November 2019, February 2021 vs. February 2019, and November 2021 vs. November 2019, respectively. For Google, the price impact factors increased by 130%, 40%, 145%, and 273% for February 2020 vs. February 2019, November 2020 vs. November 2019, February 2021 vs. February 2019, and November 2021 vs. November 2019, respectively. Furthermore, we find the price impact factors for Tesla are 156% and 332% higher for February 2020 vs. February 2019 and July 2020 vs. July 2019, respectively.
Furthermore, we also analyze variances in the slope of the limit order book. We find that the variances of price impact factors are significantly different and increased in February 2020 vs. November 2019 by 3, 18, 20, and 10 times for Apple, Amazon, Google, and Tesla, respectively (Except for Amazon (February 2020 vs February 2019 and February 2021 vs. February 2019), the variances of price impact factors are statistically different and significantly higher post-FT).

4.2. Empirical Tests and Results

Table 1 shows that the averages of the slopes (sell-side) are statistically different from pre- and post-FinTech-FT. The results suggest that the price impact factors increased in February 2020 vs. November 2019 by 30% (from 0.0001 in Nov 2019 to 0.0013 in Feb 2020), 71% (from 0.0028 in Nov 2019 to 0.0048 in Feb 2020), 86% (from 0.0014 in Nov 2019 to 0.0026 in Feb 2020), and 158% (from 0.0024 in Nov 2019 to 0.0062 in Feb 2020) for Apple, Amazon, Google, and Tesla, respectively. This suggests that placing a sell order for these stocks post-FinTech-FT costs significantly more. Further, for Apple, the price impact factors are 63% and 171% higher for February 2020 vs. February 2019 and July 2020 vs. July 2019, respectively. For Amazon, the price impact factors increased by 129%, 268%, 429%, and 354% for February 2020 vs. February 2019, November 2020 vs. November 2019, February 2021 vs. February 2019, and November 2021 vs. November 2019, respectively. For Google, the price impact factors increased by 136%, 107%, 320%, and 421% for February 2020 vs. February 2019, November 2020 vs. November 2019, February 2021 vs. February 2019, and November 2021 vs. November 2019, respectively. Furthermore, the price impact factors for Tesla are 265% and 95% higher for February 2020 vs. February 2019 and July 2020 vs. July 2019, respectively.
Furthermore, we also analyze variances in the slope of the limit order book. We find that the variances of price impact factors are significantly different and increased in February 2020 vs. November 2019 by 4, 5, 16, and 5 times for Apple, Amazon, Google, and Tesla, respectively (Except for Tesla (July 2020 vs. July 2019), the variances of price impact factors are statistically different and significantly higher post-FinTech-FT).

4.3. Empirical Tests and Results—Sell-Side

The results of the analysis by the top 5 best quotes are summarized below.
-
The price impact factors (PIFs) increased significantly post-FinTech-FT for all four stocks (AAPL, AMZN, GOOG, and TSLA) on the other buy- and sell-sides, indicating higher execution costs.
-
The variance in PIFs increased sharply post-FinTech-FT, indicating reduced depth and more volatile price–volume structures.
-
The results consistently point to thinner liquidity and steeper order book slopes following the introduction of fractional trading.
-
These findings suggest that FinTech-FT significantly affects market microstructure, making trade execution more costly and uncertain.

5. Analysis by Fixed Cumulative Volume

As a robustness check, in this section, we set the cumulative volume at 50,000 shares and collect its corresponding price for each stock at each minute (see Figure 3). Then, we compute the change in price, Δ p 50,000 , i.e., the change in price to place a buy/sell limit order of 50,000 shares of the stock under study. Further, we calculate the slope of the price–volume structure, i.e., the price impact factor, s l o p e 50,000 = Δ p 50,000 . Using this price impact factor, we test the changes observed in the price–volume structure post-FinTech-FT.
Finally, we also calculate the number of steps required to place a limit order to buy/sell 50,000 shares at each minute level and denoted this variable as s t e p s 50,000 . Further, we calculate the average tick size (defined as the minimum price movement of the stock) at each minute level. We define average tick size as a v e r a g e   t i c k   s i z e = Δ p 50,000 s t e p s 50,000 .
This figure illustrates a hypothetical limit order book structure with a fixed cumulative volume of 50,000 shares.
In what follows, we use these variables to perform equality of means and equality of variances analyses for the buy- and sell-sides.

5.1. Empirical Tests and Results—Buy-Side

Table 2 presents the test results based on the analysis of slopes pre- and post-FT. We can see that the averages of the slopes (buy-side) when we fix the cumulative volume at 50,000 shares are statistically different pre- and post-FT. The results suggest that the price impact factors increased in February 2020 vs. November 2019 by 44% (from −0.0009 in Nov2019 to −0.0013 in Feb2020), 178% (from −0.0023 in Nov2019 to −0.0064 in Feb2020), 22% (from −0.0018 in Nov2019 to −0.0022 in Feb2020), and 210% (from −0.002 in Nov2019 to −0.0062 in Feb2020) for Apple, Amazon, Google, and Tesla, respectively. This suggests that placing a buy order for these stocks post-FT costs significantly higher. Further, for Apple, the price impact factors are 86% and 67% higher for February 2020 vs. February 2019 and July 2020 vs. July 2019, respectively. For Amazon, the price impact factors increased by 52%, 204%, 145%, and 570% for February 2020 vs. February 2019, November 2020 vs. November 2019, February 2021 vs. February 2019, and November 2021 vs. November 2019, respectively. For Google, the price impact factors increased by 38%, 44%, 100%, and 428% for February 2020 vs. February 2019, November 2020 vs. November 2019, February 2021 vs. February 2019, and November 2021 vs. November 2019, respectively. Furthermore, we find the price impact factors for Tesla are 226% and 313% higher for February 2020 vs. February 2019 and July 2020 vs. July 2019, respectively.
Furthermore, we also analyzed variances in the slope of the limit order book. We find that the variances of price impact factors are significantly different and increased in February 2020 vs. November 2019 by 5, 13, 2, and 5 times for Apple, Amazon, Google, and Tesla, respectively.
Next, we analyze the average number of steps required to place an order for 50,000 shares. Table 3 presents the test results for the equality of the average number of steps needed to place an order for 50,000 shares and their variances during the month at each minute level of pre- and post-FT.
Table 3 shows that the average number of steps (buy-side) when we fix the cumulative volume at 50,000 shares is similar for Apple, Amazon, Google, and Tesla pre- and post-FT. This suggests that there has not been a significant increase in the average number of steps to place an order for 50,000 shares (In some cases, there has been an increase in the number of steps to place an order for 50,000 shares post-FinTech-FT but the result is not conclusive. We find similar results for the test of equality of variances).
Next, we use these two variables, i.e., the price impact factor and the average number of steps, to calculate the average tick size (the minimum upward or downward movement in the price of a security). In Table 4, we present the test results for the equality of the average tick size while placing an order for 50,000 shares and their variances during the month at each minute level pre- and post-FT.
Table 4 shows that the average tick size (buy-side) when we fix the cumulative volume at 50,000 shares is statistically different pre- and post-FT. The results suggest that the average tick size increased in February 2020 vs. November 2019 by 44% (from 0.0117 in Nov2019 to 0.0169 in Feb2020), 174% (from 0.0231 in Nov2019 to 0.0632 in Feb2020), 16% (from 0.0183 in Nov2019 to 0.0212 in Feb2020), and 219% (from 0.02 in Nov2019 to 0.0638 in Feb2020) for Apple, Amazon, Google, and Tesla, respectively. Further, for Apple, we find the average tick sizes are 50% and 43% higher for February 2020 vs. February 2019 and July 2020 vs. July 2019, respectively. For Amazon, the average tick size increased by 39%, 153%, 78%, and 470% for February 2020 vs. February 2019, November 2020 vs. November 2019, February 2021 vs. February 2019, and November 2021 vs. November 2019, respectively. For Google, the average tick size increased by 21%, 22%, 63%, and 273% for February 2020 vs. February 2019, November 2020 vs. November 2019, February 2021 vs. February 2019, and November 2021 vs. November 2019, respectively. Furthermore, we find the average tick sizes for Tesla are 221% and 324% higher for February 2020 vs. February 2019 and July 2020 vs. July 2019, respectively.
Furthermore, we also analyzed variances in the slope of the limit order book. We find that the variances of average tick size are significantly different and increased significantly in February 2020 vs. November 2019 by 11, 52, 2, and 7 times for Apple, Amazon, Google, and Tesla, respectively (Except for Amazon (February 2021 vs. February 2019), the variances of price impact factors are statistically different and significantly higher post-FinTech-FT).

5.2. Empirical Test and Results—Sell-Side

Table 2 shows that the averages of the slopes (sell-side) when we fix the cumulative volume at 50,000 shares are statistically different pre- and post-FT. The results suggest that the price impact factors increased in February 2020 vs. November 2019 by 112% (from 0.0017 in Nov2019 to 0.0036 in Feb2020), 98% (from 0.0096 in Nov2019 to 0.019 in Feb2020), 55% (from 0.0033 in Nov2019 to 0.0051 in Feb2020), and 331% (from 0.0042 in Nov2019 to 0.0181 in Feb2020) for Apple, Amazon, Google, and Tesla, respectively. This suggests that placing a buy order for these stocks post-FT costs significantly higher. Further, for Apple, the price impact factors are 177% and 142% higher for February 2020 vs. February 2019 and July 2020 vs. July 2019, respectively. For Amazon, the price impact factors increased by 53%, 110%, 48%, and 191% for February 2020 vs. February 2019, November 2020 vs. November 2019, February 2021 vs. February 2019, and November 2021 vs. November 2019, respectively. For Google, the price impact factors increased by 70%, 55%, 170%, and 345% for February 2020 vs. February 2019, November 2020 vs. November 2019, February 2021 vs. February 2019, and November 2021 vs. November 2019, respectively. Furthermore, we find the price impact factors for Tesla are 229% and 492% higher for February 2020 vs. February 2019 and July 2020 vs. July 2019, respectively.
Furthermore, we also analyzed variances in the slope of the limit order book. We find that the variances of price impact factors are significantly different and increased in February 2020 vs. November 2019 by 17, 4, 2, and 5 times for Apple, Amazon, Google, and Tesla, respectively.
Next, we analyze the average number of steps required to place an order for 50,000 shares. Table 3 presents the test results for the equality of the average number of steps needed to place an order for 50,000 shares and their variances during the month at each minute level of pre- and post-FT. We find that the average number of steps (buy-side) when we fix the cumulative volume at 50,000 shares is similar for Apple, Amazon, Google, and Tesla pre- and post-FT. This suggests that there has not been a significant increase in the average number of steps to place an order for 50,000 shares (In some cases, there has been an increase in the number of steps to place an order for 50,000 shares post-FinTech-FT but the result is not conclusive. We find similar results for the test of the equality of variances).
Further, we find that the average tick size for the sell-side when we fix the cumulative volume at 50,000 shares is statistically different from pre- and post-FT (please see Table 4). The results suggest that the average tick size increased in February 2020 vs. November 2019 by 115% (from −0.0009 in Nov2019 to −0.0013 in Feb2020), 105% (from −0.0009 in Nov2019 to −0.0013 in Feb2020), 67% (from −0.0009 in Nov2019 to −0.0013 in Feb2020), and 365% (from −0.0009 in Nov2019 to −0.0013 in Feb2020) for Apple, Amazon, Google, and Tesla, respectively. This suggests that it costs significantly more to buy these stocks post-FT. Further, for Apple, we find the average tick sizes are 145% and 99% higher for February 2020 vs. February 2019 and July 2020 vs. July 2019, respectively. For Amazon, the average tick size has increased by 40%, 109%, 29%, and 183% for February 2020 vs. February 2019, November 2020 vs. November 2019, February 2021 vs. February 2019, and November 2021 vs. November 2019, respectively. For Google, the average tick size increased by 51%, 51%, 114%, and 271% for February 2020 vs. February 2019, November 2020 vs. November 2019, February 2021 vs. February 2019, and November 2021 vs. November 2019, respectively. Furthermore, we find the average tick size for Tesla is 240% and 504% higher for February 2020 vs. February 2019 and July 2020 vs. July 2019, respectively.
Furthermore, we also analyzed variances in the slope of the limit order book. We find that the variances of average tick size are significantly different and increased in February 2020 vs. November 2019 by 15, 3, 2, and 8 times for Apple, Amazon, Google, and Tesla, respectively (Except for Amazon (February 2021 vs. February 2019), the variances of price impact factors are statistically different and significantly higher post-FinTech-FT).
Summarizing our results we can argue the following: First, the price impact factors (PIFs) significantly increased post-FinTech-FT for all four stocks on both the buy- and sell-sides, indicating higher execution costs. Second, our results suggest thinner liquidity and steeper order book slopes post-FinTech-FT, particularly for larger orders (50,000 shares). Third, it is clear that post-FinTech-FT, the variances in price impact and average tick size increased substantially, further highlighting changes in market dynamics. Fourth we observe a significant increase in the price impact factors and tick sizes that suggest higher costs for placing buy/sell orders post-FinTech-FT, with more significant increases observed on the sell-side for certain stocks; finally, our findings indicate that fractional trading has a profound impact on market microstructure, making trade execution more costly and less predictable.

6. Conclusions and Discussion

This study investigates how fractional trading (FT) and the rise of commission-free trading platforms have reshaped US equity market dynamics, particularly affecting price levels, order book structure, investor behavior, and liquidity. We tested three hypotheses: (1) that the introduction of FinTech-FT has significantly altered price and volatility patterns; (2) that FinTech-FT influences the structure of the limit order book (LOB) and cost of trading; and (3) that FinTech-FT, by enabling smaller trades and broader access to non-professional traders, modifies professional investors’ risk-taking behavior and may contribute to market fragmentation.
Our empirical results support all three hypotheses. First, we find that average price levels and volatility increased significantly post-FinTech-FT. This supports the hypothesis that FinTech-FT introduces greater price noise, consistent with a surge in speculative and retail-driven trades. Second, we observe a steepening of the LOB and an increase in average tick sizes, indicating that the cost of executing trades has risen, especially for larger orders. This directly points to reduced depth and higher price impact—evidence of liquidity fragmentation. Lastly, the influx of small trade flows and more volatile LOB structure implies a change in investor behavior, particularly among non-professional participants who now engage more frequently but also face higher market risk.
These findings have the following important regulatory and policy implications:
-
Volatility Monitoring and Market Surveillance: Given the observed rise in price volatility post-FinTech-FT, regulators should consider developing more granular, real-time monitoring tools specifically targeted at detecting unusual retail-driven volume surges or potential “pump-and-dump” patterns.
-
LOB Structure and Tick Size Rules: Our results show that the average tick size and price impact values increased. Regulators might revisit the tick size regime, especially for heavily traded stocks where too-wide ticks could discourage limit orders and exacerbate volatility. A tiered tick size framework, sensitive to trading volume and volatility, could help maintain LOB efficiency.
-
Retail Investor Protection and Execution Standards: Since FinTech-FT has increased market participation by less experienced investors (non-professional ones), the evidence of increased volatility and steeper LOBs highlights the need for better investor education around execution costs and order types. Enforcing stricter “best execution” standards for brokers handling fractional trades could reduce hidden costs for retail participants.
-
Liquidity Support for Institutional Trades: The observed fragmentation of liquidity suggests that institutional investors now face higher trading costs. To address this, market makers could be incentivized—through rebates or minimum quote requirements—to provide deeper liquidity during periods of increased small-order flow.
In summary, while FinTech-FT has enhanced market access and democratized investing, it has also introduced structural frictions that affect price discovery, trading costs, and market stability. Regulatory frameworks must evolve to address these challenges in a targeted, evidence-based manner.
Future research will expand the scope to small-cap and low-priced stocks, where we expect the effects of FinTech-FT on volatility and price discovery to be even more pronounced. These insights will further aid in developing market structure policies that balance accessibility with resilience.

Author Contributions

All authors have contributed jointly to all the sections of the paper. All authors have read and agreed to the published version of the manuscript.

Funding

This research received no external funding.

Institutional Review Board Statement

Not applicable.

Informed Consent Statement

Not applicable.

Data Availability Statement

Data is available upon request.

Acknowledgments

The authors would like to thank the seminar participants and discussants at the FFEA-WPI Finance Conference 2023, NYSEA 2023 Conference, World Finance Conference 2023, SQA-CQA 2023 Trading Day Conference, Fordham Fall 2022 Finance workshop for their helpful comments and suggestions, and the referees for their careful reading and constructive comments.

Conflicts of Interest

The authors declare no conflict of interest.

Appendix A

Appendix A.1. Price Impact Factors Using the 10 Best Quotes

Table A1. Price impact factors (buy- and sell-sides) using the 10 best quotes at each minute level.
PIF10
AAPLAMZNGOOGTSLA
Buy-SideSell-SideBuy-SideSell-SideBuy-SideSell-SideBuy-SideSell-Side
DatesNov2019Feb2020Nov2019Feb2020Nov2019Feb2020Nov2019Feb2020Nov2019Feb2020Nov2019Feb2020Nov2019Feb2020Nov2019Feb2020
Mean−0.0009−0.0014 *0.00090.0015 *−0.0022−0.0055 *0.0030.0064 *−0.0015−0.0024 *0.00140.0022 *−0.0017−0.0045 *0.00210.0059 *
Ratio of means11.4811.5412.5212.1111.6211.5112.5712.76
Variance2E-089E-08 *1E-087E-08 *1E-073E-06 *3E-074E-06 *7E-097E-08 *3E-083E-07 *6E-084E-07 *1E-077E-07 *
Ratio of variances13.9715.97124.39112.519.4219.5415.9315.39
DatesFeb2019Feb2020Feb2019Feb2020Feb2019Feb2020Feb2019Feb2020Feb2019Feb2020Feb2019Feb2020Feb2019Feb2020Feb2019Feb2020
Mean−0.0008−0.0014 *0.00080.0015 *−0.0029−0.0055 *0.00240.0064 *−0.0013−0.0024 *0.00110.0022 *−0.0017−0.0045 *0.00180.0059 *
Ratio of means11.7511.7711.9212.6511.8112.0312.5413.25
Variance2E-089E-08 *2E-087E-08 *2E-063E-06 *1E-074E-06 *1E-087E-08 *4E-093E-07 *1E-074E-07 *9E-087E-07 *
Ratio of variances13.7314.5311.33130.7915.39162.3113.2117.56
DatesJul2019Jul2020Jul2019Jul2020Nov2019Nov2020Nov2019Nov2020Nov2019Nov2020Nov2019Nov2020Jul2019Jul2020Jul2019Jul2020
Mean−0.001−0.0016 *0.00070.0019 *−0.0022−0.0058 *0.0030.0139 *−0.0015−0.0022 *0.00140.0030 *−0.0019−0.0068 *0.00250.0047 *
Ratio of means11.6312.5312.6414.5811.4512.0613.5611.82
Variance6E-082E-07 *6E-099E-08 *1E-076E-07 *3E-073E-06 *7E-091E-07 *3E-085E-08 *6E-081E-06 *1E-063E-07
Ratio of variances12.69114.4715110.91122.7911.84118.410.26
Dates Feb2019Feb2021Feb2019Feb2021Feb2019Feb2021Feb2019Feb2021
Mean −0.0029−0.0071 *0.00240.0102 *−0.0013−0.0026 *0.00110.0041 *
Ratio of means 12.4814.2111.9513.78
Variance 2E-062E-061E-071E-06 *1E-082E-07 *4E-091E-07 *
Ratio of variances 10.9919.12113.63123.61
Dates Nov2019Nov2021Nov2019Nov2021Nov2019Nov2021Nov2019Nov2021
Mean −0.0022−0.0147 *0.0030.0124 *−0.0015−0.0053 *0.00140.0068 *
Ratio of means 16.6314.0913.5414.64
Variance 1E-072E-06 *3E-074E-06 *7E-091E-06 *3E-082E-06 *
Ratio of variances 113.94113.861143.15167
This table presents the results of the tests for the equality of means and the equality of variances of the averages of the slopes of the order books (i.e., price impact factors) using the 10 best quotes on the buy-side at each minute level. The results suggest that the averages of slopes are statistically different pre- and post-FinTech-FT. The price impact factor significantly increased post-introduction of FT. Note: The number of observations for the analysis is 391 for the monthly comparison tests, and * suggests that the mean/variance is statistically different post-FT compared to pre-FT.

Appendix A.2. Data Processing Pipeline for NASDAQ ITCH Data

The data processing pipeline employed in this study, adapted from [23], Machine Learning for Algorithmic Trading, is designed to assess the impact of FinTech and fractional trading (FT) on order book dynamics. The key steps are as follows:
  • Data Acquisition: The analysis utilizes the NASDAQ TotalView-ITCH 5.0 feed, which provides millisecond-level granularity on order book events, including order submissions, cancellations, modifications, and executions across the full depth of the order book.
  • Binary Parsing and Storage Conversion: A custom Python 3.13.2 parser is developed to decode the raw binary data and extract relevant event-level information. The parsed data are stored in Hierarchical Data Format (HDF5), enabling efficient querying and time-based filtering, which is essential for handling large-scale intraday datasets.
  • Limit Order Book (LOB) Reconstruction: Using the parsed event stream, the limit order book (LOB) is reconstructed at nanosecond granularity. Price and volume information is updated across the first ten levels (L1–L10) according to NASDAQ’s matching engine rules, following a First-In-First-Out (FIFO) logic. This process allows for a precise analysis of order book dynamics, particularly with respect to fractional trading’s impact.
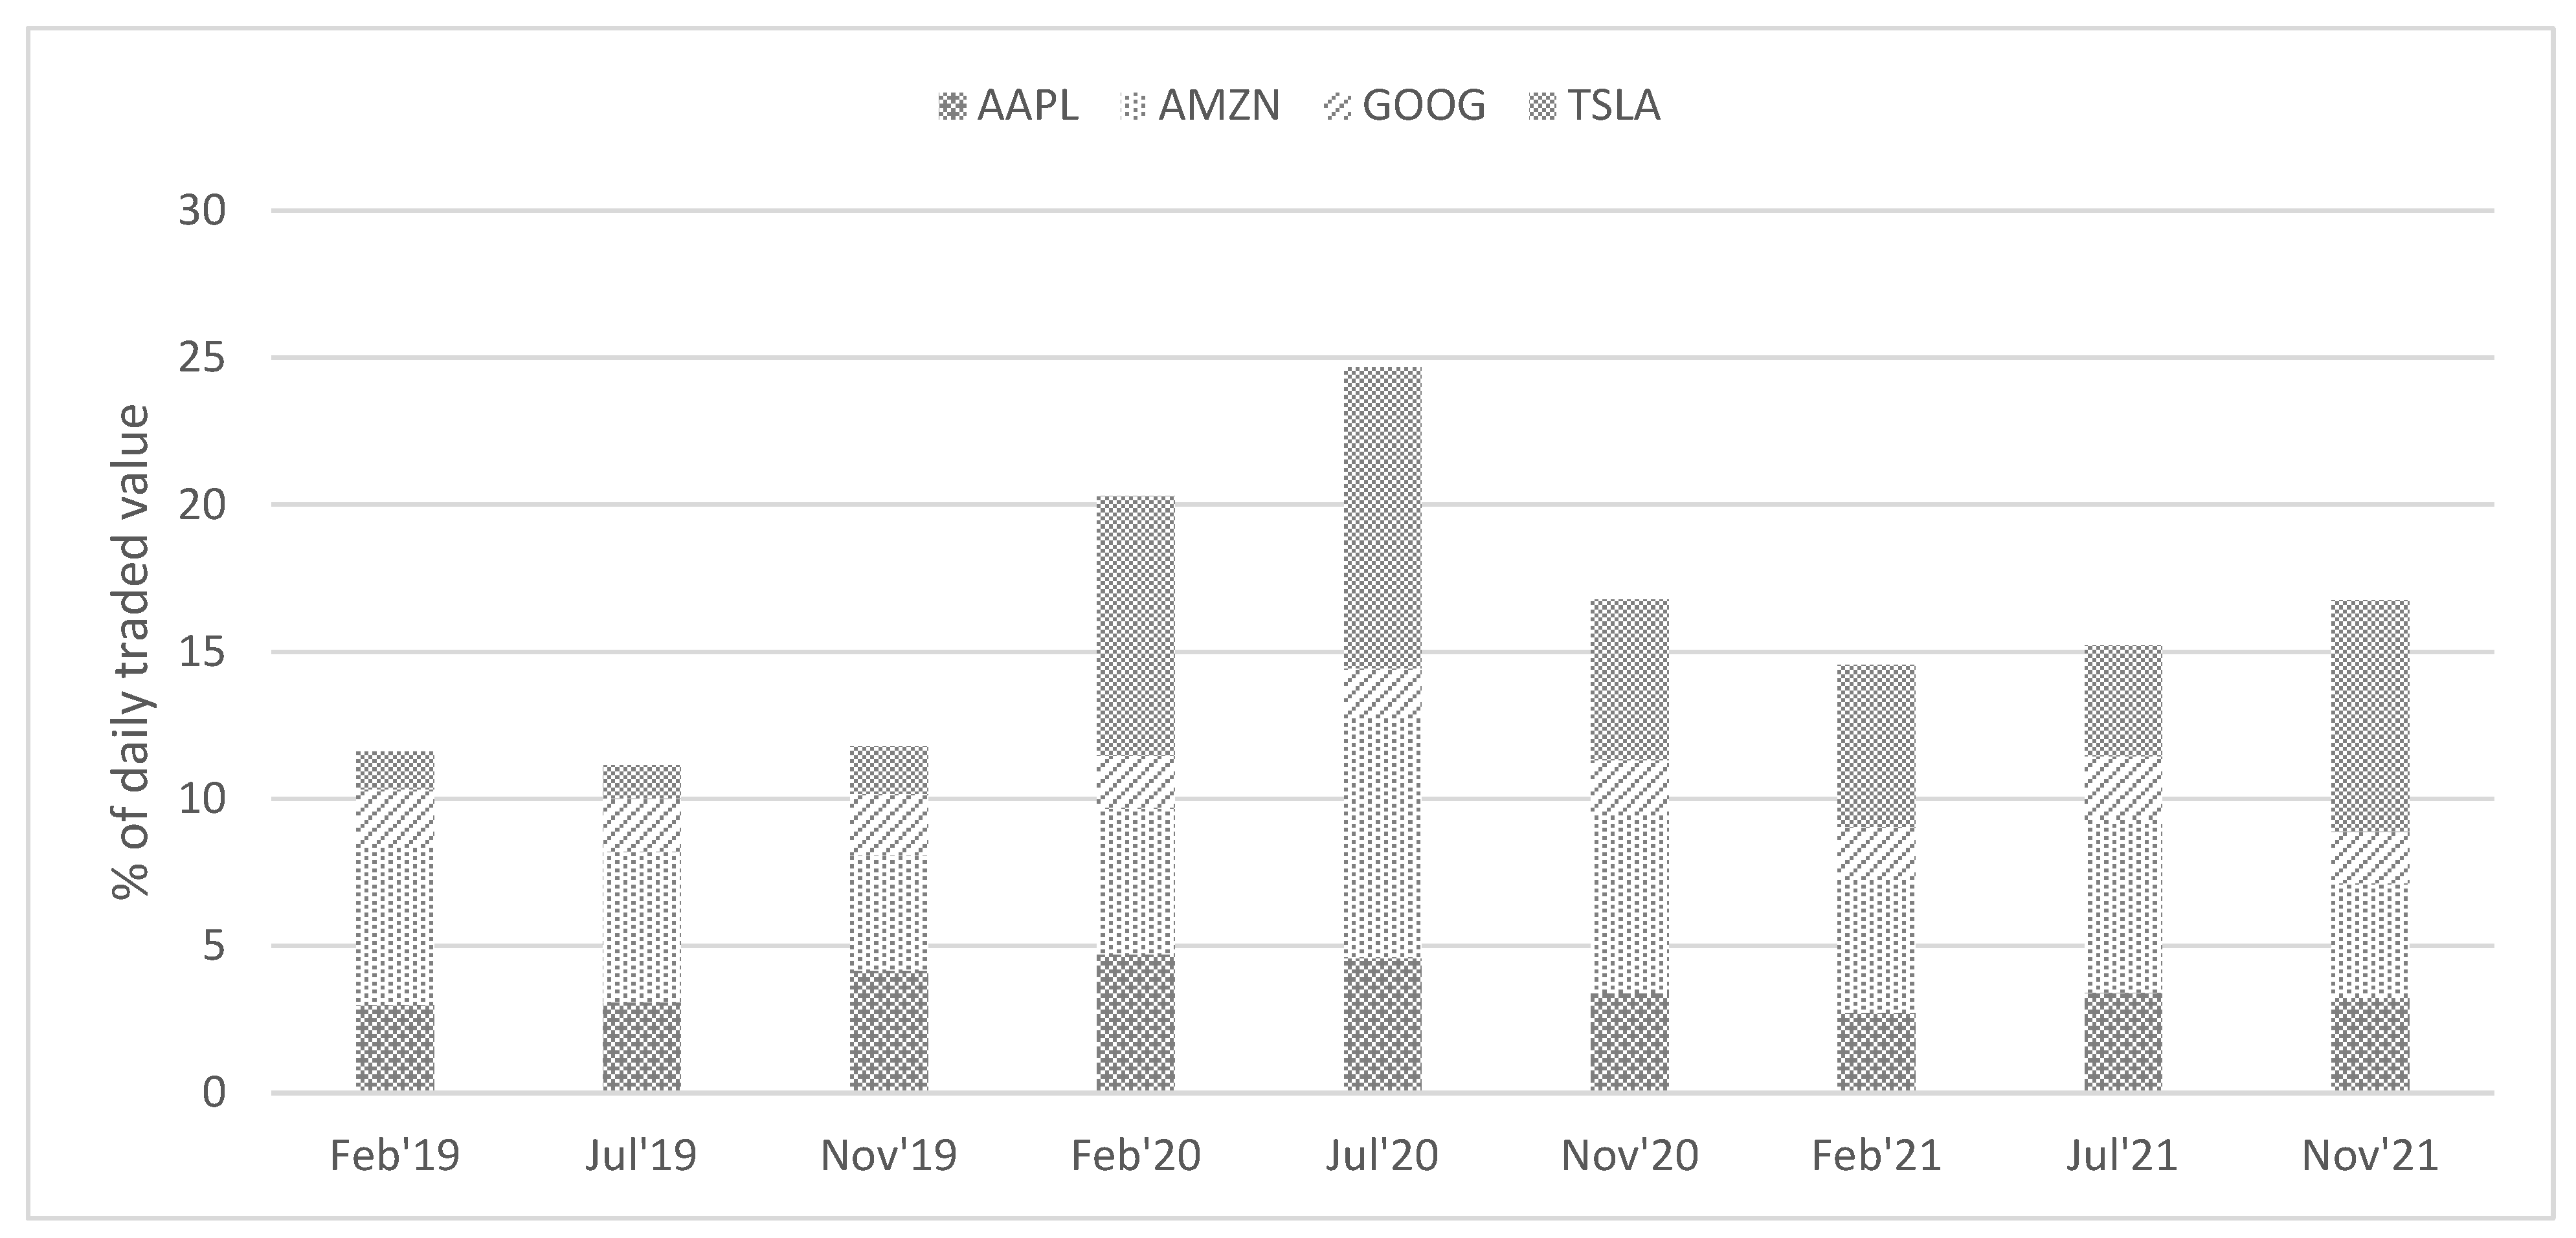
  • Data Filtering and Selection: This study focuses on high-liquidity technology stocks—AAPL, AMZN, GOOG, and TSLA—due to their early adoption of fractional trading and their significant role in the NASDAQ ecosystem. These four stocks account for 15–20% of the daily traded value post the introduction of fractional trading in the study period (see Figure 2). Trading activity for each stock is extracted for both pre- and post-FinTech-FT periods to enable a comparative analysis of market conditions before and after the adoption of fractional trading.
  • Feature Engineering and Metric Construction: Key market microstructure metrics are computed, including tick size, price volatility, price impact factor (PIF), order flow imbalance, and the depth and slope of the LOB. These indicators are calculated at high frequency and aggregated over intraday intervals to facilitate the comparison of market dynamics between the two regimes (pre- and post-FinTech-FT).
  • Statistical Analysis: Statistical hypothesis testing is employed to identify significant changes in the LOB dynamics and investor behavior between the pre- and post-FinTech-FT periods. Robustness checks and visual summaries are incorporated to ensure the consistency and reliability of the results.
  • Interpretation and Policy Relevance: The empirical findings are interpreted within the broader context of market structure, investor behavior, and regulatory implications. Emphasis is placed on understanding how FinTech and fractional trading influence price formation, liquidity, and market efficiency in a post-commission trading environment.

References

  1. Chordia, T.; Roll, R.; Subrahmanyam, A. Recent trends in trading activity and market quality. J. Financ. Econ. 2011, 101, 243–263. [Google Scholar] [CrossRef]
  2. Kirilenko, A.; Kyle, A.S.; Samadi, M.; Tuzun, T. The flash crash: High-frequency trading in an electronic market. J. Financ. 2017, 72, 967–998. [Google Scholar] [CrossRef]
  3. Zhang, Z.; Zohren, S.; Roberts, S. Deep reinforcement learning for trading. arXiv 2019, arXiv:1911.10107. [Google Scholar] [CrossRef]
  4. Lo, A.W. The Gordon Gekko Effect: The Role of Culture in the Financial Industry; No. w21267; National Bureau of Economic Research: Cambridge, MA, USA, 2015. [Google Scholar]
  5. Cong, L.W.; He, Z. Blockchain disruption and smart contracts. Rev. Financ. Stud. 2019, 32, 1754–1797. [Google Scholar] [CrossRef]
  6. Harz, D.; Knottenbelt, W. Towards safer smart contracts: A survey of languages and verification methods. arXiv 2018, arXiv:1809.09805. [Google Scholar]
  7. Barber, B.M.; Morse, A.; Yasuda, A. Impact investing. J. Financ. Econ. 2021, 139, 162–185. [Google Scholar] [CrossRef]
  8. D’Acunto, F.; Prabhala, N.; Rossi, A.G. The promises and pitfalls of robo-advising. Rev. Financ. Stud. 2019, 32, 1983–2020. [Google Scholar] [CrossRef]
  9. Tripathi, J.S.; Rengifo, E.W. The Impact of Fractional Trading on Risk Aversion for Non-professional Investors. Financ. Res. Lett. 2023, 52, 103547. [Google Scholar] [CrossRef]
  10. Berk, J.B.; Van Binsbergen, J.H. The impact of impact investing. J. Financ. Econ. 2025, 164, 103972. [Google Scholar] [CrossRef]
  11. Rengifo, E.W.; Trifan, E. How Investors Face Financial Risk: Loss Aversion and Wealth Allocation. J. Cent. Cathedra 2010, 3, 41–59. [Google Scholar] [CrossRef]
  12. Glosten, L.R.; Milgrom, P.R. Bid, ask and transaction prices in a specialist market with heterogeneously informed traders. J. Financ. Econ. 1985, 14, 71–100. [Google Scholar] [CrossRef]
  13. Kahneman, D.; Tversky, A. Prospect Theory: An Analysis of Decision under Risk. Econometrica 1979, 47, 263–291. [Google Scholar] [CrossRef]
  14. Tversky, A.; Kahneman, D. Advances in prospect theory: Cumulative representation of uncertainty. J. Risk Uncertain. 1992, 5, 297–323. [Google Scholar] [CrossRef]
  15. Kyle, A.S. Continuous auctions and insider trading. Econom. J. Econom. Soc. 1985, 53, 1315–1335. [Google Scholar] [CrossRef]
  16. Glosten, L.R. Is the electronic open limit order book inevitable? J. Financ. 1994, 49, 1127–1161. [Google Scholar] [CrossRef]
  17. Bolton, P.; Freixas, X.; Gambacorta, L.; Mistrulli, P.E. Relationship and transaction lending in a crisis. Rev. Financ. Stud. 2016, 29, 2643–2676. [Google Scholar] [CrossRef]
  18. Madhavan, A. Market microstructure: A survey. J. Financ. Mark. 2000, 3, 205–258. [Google Scholar] [CrossRef]
  19. Da, Z.; Fang, V.W.; Lin, W. Fractional Trading. 2021. Available online: https://papers.ssrn.com/sol3/papers.cfm?abstract_id=3949697 (accessed on 1 April 2024).
  20. Gempesaw, D.; Henry, J.J.; Velthuis, R. Piecing together the extent of retail fractional trading. Glob. Financ. J. 2022, 54, 100757. [Google Scholar] [CrossRef]
  21. Bartlett, R.P.; McCrary, J.; O’Hara, M. A Fractional Solution to a Stock Market Mystery. 2022. Available online: https://papers.ssrn.com/sol3/papers.cfm?abstract_id=4167890 (accessed on 1 April 2024).
  22. Bartlett, R.P.; McCrary, J.; O’Hara, M. Tiny Trades, Big Questions: Fractional Shares. 2022. Available online: https://papers.ssrn.com/sol3/papers.cfm?abstract_id=4248449 (accessed on 1 April 2024).
  23. Jansen, S. Machine Learning for Algorithmic Trading: Predictive Models to Extract Signals from Market and Alternative Data for Systematic Trading Strategies with Python; Packt Publishing Ltd.: Birmingham, UK, 2020. [Google Scholar]
Figure 1. Limit order book structure.
Fintech 04 00016 g001
Figure 2. Percentage of average daily traded value.
Fintech 04 00016 g002
Figure 3. Limit order book structure with fixed cumulative volume at 50,000 shares.
Fintech 04 00016 g003
Table 1. Price impact factors (buy- and sell-sides) using the five best quotes at each minute level.
PIF5
AAPLAMZNGOOGTSLA
Buy-SideSell-SideBuy-SideSell-SideBuy-SideSell-SideBuy-SideSell-Side
DatesNov2019Feb2020Nov2019Feb2020Nov2019Feb2020Nov2019Feb2020Nov2019Feb2020Nov2019Feb2020Nov2019Feb2020Nov2019Feb2020
Mean−0.0009−0.0014 *0.0010.0013 *−0.0025−0.0056 *0.00280.0048 *−0.0015−0.0030 *0.00140.0026*−0.0017−0.0046 *0.00240.0062*
Ratio of means11.4711.3612.2611.7411.9611.8212.6912.59
Variance3E-089E-08 *1E-085E-08 *2E-073E-06 *4E-072E-06 *1E-082E-07 *3E-085E-07 *7E-087E-07 *2E-071E-06 *
Ratio of variances13.3613.63118.1414.88119.81116.1119.8914.84
DatesFeb2019Feb2020Feb2019Feb2020Feb2019Feb2020Feb2019Feb2020Feb2019Feb2020Feb2019Feb2020Feb2019Feb2020Feb2019Feb2020
Mean−0.0008−0.0014 *0.00080.0013 *−0.0029−0.0056 *0.00210.0048 *−0.0013−0.0030 *0.00110.0026 *−0.0018−0.0046 *0.00170.0062 *
Ratio of means11.7411.6311.8912.2812.2712.4312.5613.64
Variance2E-089E-08 *2E-085E-08 *7E-063E-068E-082E-06 *1E-082E-07 *4E-095E-07 *1E-077E-07 *1E-071E-06 *
Ratio of variances13.8312.4110.42126.79120.221110.4615.27110.1
DatesJul2019Jul2020Jul2019Jul2020Nov2019Nov2020Nov2019Nov2020Nov2019Nov2020Nov2019Nov2020Jul2019Jul2020Jul2019Jul2020
Mean−0.001−0.0015 *0.00070.0019 *−0.0025−0.0056 *0.00280.0103 *−0.0015−0.0021 *0.00140.0029*−0.0019−0.0082 *0.00220.0043 *
Ratio of means11.4612.4312.2613.6911.412.0314.2511.91
Variance7E-083E-09 *7E-099E-08 *2E-077E-07 *4E-074E-06 *1E-085E-07 *3E-086E-08 *7E-082E-06 *5E-072E-07
Ratio of variances11.56112.6214.09110145.0811.97135.9310.51
Dates Feb2019Feb2021Feb2019Feb2021Feb2019Feb2021Feb2019Feb2021
Mean −0.0029−0.0071 *0.00210.0111 *−0.0013−0.0025 *0.0010.0042 *
Ratio of means 12.3815.1711.9313.89
Variance 7E-063E-068E-082E-06 *1E-082E-07 *4E-091E-07 *
Ratio of variances 10.36126.72119.4132.29
Dates Nov2019Nov2021Nov2019Nov2021Nov2019Nov2021Nov2019Nov2021
Mean −0.0025−0.0143 *0.00280.0127 *−0.0015−0.0056 *0.00140.0073 *
Ratio of means 15.7414.5413.6215.00
Variance 3E-074E-06 *4E-078E-06 *1E-082E-06 *3E-083E-06 *
Ratio of variances 122.96118.181148.091104.78
This table presents the results of the tests for the equality of means and equality of variances of the averages of the slopes of the order books (i.e., price impact factors) using the 5 best quotes on the buy- and sell-sides at each minute level. The results suggest that the averages of slopes are statistically different pre- and post-FinTech-FT. The price impact factor increased post-introduction of FT significantly. Note: The number of observations for the analysis is 391 for the monthly comparison tests, and * suggests that the mean/variance is statistically different post-FinTech-FT compared to pre-FinTech-FT.
Table 2. Price impact factor of the price–volume structure (buy- and sell-sides) while placing an order for 50,000 shares.
PIF50k
AAPLAMZNGOOGTSLA
Buy-SideSell-SideBuy-SideSell-SideBuy-SideSell-SideBuy-SideSell-Side
DatesNov2019Feb2020Nov2019Feb2020Nov2019Feb2020Nov2019Feb2020Nov2019Feb2020Nov2019Feb2020Nov2019Feb2020Nov2019Feb2020
Mean−0.0009−0.0013 *0.00170.0036 *−0.0023−0.0064 *0.00960.0190 *−0.0018−0.0022 *0.00330.0051 *−0.002−0.0062 *0.00420.0181 *
Ratio of means11.4712.1412.7711.9711.211.5513.0414.29
Variance1E-086E-08 *5E-099E-08 *1E-072E-06 *1E-065E-06 *2E-084E-08 *9E-081E-07 *1E-075E-07 *2E-071E-06 *
Ratio of variances14.87116.79112.6814.3812.0111.5815.0515.16
DatesFeb2019Feb2020Feb2019Feb2020Feb2019Feb2020Feb2019Feb2020Feb2019Feb2020Feb2019Feb2020Feb2019Feb2020Feb2019Feb2020
Mean−0.0007−0.0013 *0.00130.0036 *−0.0042−0.0064 *0.01240.0190 *−0.0016−0.0022 *0.0030.0051 *−0.0019−0.0062 *0.00550.0181 *
Ratio of means11.6912.6511.5311.5311.3411.6713.2313.28
Variance2E-086E-08 *3E-089E-08 *7E-072E-06 *2E-065E-06 *2E-084E-08 *2E-081E-07 *7E-085E-07 *2E-071E-06 *
Ratio of variances13.3713.1212.5612.8512.1515.7717.8214.41
DatesJul2019Jul2020Jul2019Jul2020Nov2019Nov2020Nov2019Nov2020Nov2019Nov2020Nov2019Nov2020Jul2019Jul2020Jul2019Jul2020
Mean−0.0009−0.0015 *0.00120.0029 *−0.0023−0.0070 *0.00960.0202 *−0.0018−0.0026 *0.00330.0051 *−0.0016−0.0066 *0.00380.0225 *
Ratio of means11.6412.8213.0112.0911.4111.5613.9415.89
Variance2E-088E-08 *3E-087E-08 *1E-074E-06 *1E-062E-06 *2E-088E-08 *9E-084E-07 *5E-085E-07 *4E-076E-06 *
Ratio of variances13.6612.01127.411.5214.5915.0419.56114.9
Dates Feb2019Feb2021Feb2019Feb2021Feb2019Feb2021Feb2019Feb2021
Mean −0.0042−0.0103 *0.01240.0183 *−0.0016−0.0032 *0.0030.0081 *
Ratio of means 12.4411.4811.9512.66
Variance 7E-073E-06 *2E-062E-062E-087E-08 *2E-083E-07 *
Ratio of variances 13.8710.9814.12112.1
Dates Nov2019Nov2021Nov2019Nov2021Nov2019Nov2021Nov2019Nov2021
Mean −0.0023−0.0154 *0.00960.0279 *−0.0018−0.0095 *0.00330.0147 *
Ratio of means 16.612.8915.0814.47
Variance 1E-072E-06 *1E-061E-05 *2E-083E-06 *9E-082E-06 *
Ratio of variances 111.3717.951184.88127.34
This table presents the equality of means and variances for the averages of the price impact factor based on the first 50,000 shares on the buy- and sell-sides at each minute level. The results suggest that the averages of price impacts are statistically different pre- and post-FT. The slopes increased post-introduction of FT. Note: The number of observations for the analysis is 391 for the monthly comparison tests, and * suggests that the mean/variance is statistically different post-FT compared to pre-FT.
Table 3. The number of steps needed to place an order of 50,000 shares pre- and post-FT (buy- and sell-sides).
Steps50k
AAPLAMZNGOOGTSLA
Buy-SideSell-SideBuy-SideSell-SideBuy-SideSell-SideBuy-SideSell-Side
DatesNov2019Feb2020Nov2019Feb2020Nov2019Feb2020Nov2019Feb2020Nov2019Feb2020Nov2019Feb2020Nov2019Feb2020Nov2019Feb2020
Mean38.9539.90 *40.9440.9450.9354.70 *53.2354.85 *51.1852.18 *54.953.84 *51.7651.8252.4649.46 *
Ratio of means11.021111.0711.0311.0210.981110.94
Variance2E+001E+009E-011.81 *2E+011E+012E+011E+014E+003E+004E+003E+004E+0016.43 *5E+0014.13 *
Ratio of variances10.6412.1310.6610.5510.8110.6714.112.65
DatesFeb2019Feb2020Feb2019Feb2020Feb2019Feb2020Feb2019Feb2020Feb2019Feb2020Feb2019Feb2020Feb2019Feb2020Feb2019Feb2020
Mean35.1739.90 *37.0535.94 *48.3754.70 *49.5754.85 *47.5852.18 *47.8453.84 *49.0251.82 *50.0949.46 *
Ratio of means11.1310.9711.1311.1111.0911.1311.0610.99
Variance3E+001E+006E-011.81 *4E+011E+013E+011E+012E+003.08 *2E+002.90 *8E+0016.43 *1E+011E+01
Ratio of variances10.4512.9210.2910.3812.0311.7412.0911.01
DatesJul2019Jul2020Jul2019Jul2020Nov2019Nov2020Nov2019Nov2020Nov2019Nov2020Nov2019Nov2020Jul2019Jul2020Jul2019Jul2020
Mean37.5243.14 *36.942.37 *50.9359.83 *53.2356.94 *51.1859.38 *54.957.78 *50.7650.7950.3349.64 *
Ratio of means11.1511.1511.1711.0711.1611.051110.99
Variance1E+001E+007E-011E+002E+0130.19 *2E+0130.94 *4E+004E+004E+004E+002E+0017.08 *4E+0021.00 *
Ratio of variances10.9211.6611.7711.4911.1710.96111.1614.82
Dates Feb2019Feb2021Feb2019Feb2021Feb2019Feb2021Feb2019Feb2021
Mean 48.3762.14 *49.5657.82 *47.5857.46 *47.8458.23 *
Ratio of means 11.2811.1711.2111.22
Variance 4E+0143.59 *3E+0148.91 *2E+004.68 *2E+003.49 *
Ratio of variances 11.1411.6013.0912.09
Dates Nov2019Nov2021Nov2019Nov2021Nov2019Nov2021Nov2019Nov2021
Mean 50.9362.82 *53.2361.56 *51.1865.97 *54.8963.86 *
Ratio of means 11.2311.1611.2911.16
Variance 2E+0161.19 *2E+011E+014E+0014.76 *4E+0012.66 *
Ratio of variances 13.5910.6613.912.94
This table presents the test results for the equality of means and variances for the average number of steps needed to order 50,000 shares on the buy- and sell-sides at each minute level. Note: The number of observations for the analysis is 391 for the monthly comparison tests, and * suggests that the mean/variance is statistically different post-FT compared to pre-FT.
Table 4. Average tick size to place an order of 50,000 shares pre- and post-FT (buy- and sell-sides).
Average Tick Size
AAPLAMZNGOOGTSLA
Buy-SideSell-SideBuy-SideSell-SideBuy-SideSell-SideBuy-SideSell-Side
DatesNov2019Feb2020Nov2019Feb2020Nov2019Feb2020Nov2019Feb2020Nov2019Feb2020Nov2019Feb2020Nov2019Feb2020Nov2019Feb2020
Mean0.01170.0169 *0.02090.045 *0.02310.0632 *0.08990.1843 *0.01830.0212 *0.03010.0503 *0.020.0638 *0.04140.1927 *
Ratio of means11.4412.1512.7312.0511.1611.6713.1814.65
Variance1E-061E-05 *1E-061E-05 *5E-063E-04 *1E-044E-04 *1E-063E-06 *8E-061E-05 *1E-059E-05 *3E-052E-04 *
Ratio of variances110.61114.69152.4313.4512.4211.6616.8917.54
DatesFeb2019Feb2020Feb2019Feb2020Feb2019Feb2020Feb2019Feb2020Feb2019Feb2020Feb2019Feb2020Feb2019Feb2020Feb2019Feb2020
Mean0.01130.0169*0.01840.0450*0.04540.0632*0.13210.1843*0.01750.0212*0.03330.0503*0.01990.0638*0.05660.1927*
Ratio of means11.4912.4411.3911.3911.2111.5113.1913.4
Variance2E-061E-05*5E-061E-05*8E-053E-04*3E-044E-04*1E-063E-06*2E-061E-05*1E-059E-05*5E-052E-04*
Ratio of variances16.7912.8813.0311.411.815.7619.1713.98
DatesJul2019Jul2020Jul2019Jul2020Nov2019Nov2020Nov2019Nov2020Nov2019Nov2020Nov2019Nov2020Jul2019Jul2020Jul2019Jul2020
Mean0.01290.0184*0.01730.0345 *0.02310.0585 *0.08990.1882 *0.01830.0223 *0.03010.0454 *0.01680.0712 *0.03830.2314 *
Ratio of means11.4311.9912.5312.0911.2211.5114.2216.04
Variance3E-061E-05 *6E-067E-06 *5E-061E-04 *1E-042E-04 *1E-066E-06 *8E-064E-05 *5E-068E-05 *4E-058E-04 *
Ratio of variances13.8811.23119.7112.0415.7414.85116.82118.95
Dates Feb2019Feb2021Feb2019Feb2021Feb2019Feb2021Feb2019Feb2021
Mean 0.04540.0808 *0.13210.1709 *0.01750.0286 *0.03330.0712 *
Ratio of means 11.7811.2911.6312.13
Variance 8E-055E-053E-042E-041E-064E-06 *2E-063E-05 *
Ratio of variances 10.6410.7412.78110.89
Dates Nov2019Nov2021Nov2019Nov2021Nov2019Nov2021Nov2019Nov2021
Mean 0.02310.1317 *0.08980.2545 *0.01830.0682 *0.03010.1117 *
Ratio of means 15.6912.8313.7313.71
Variance 5E-061E-04 *1E-047E-04 *1E-061E-04 *8E-061E-04 *
Ratio of variances 120.8616.241135.03115.26
This table presents the test results for the equality of means and the equality of variances of the averages of the average tick size to place an order of 50,000 shares on the buy- and sell-sides at each minute level. The results suggest that the average tick size is statistically different pre- and post-FT. The average tick sizes increased post-introduction of FT. Note: The number of observations for the analysis is 391 for the monthly comparison tests, and * suggests that the mean/variance is statistically different post-FT compared to pre-FT.
Disclaimer/Publisher’s Note: The statements, opinions and data contained in all publications are solely those of the individual author(s) and contributor(s) and not of MDPI and/or the editor(s). MDPI and/or the editor(s) disclaim responsibility for any injury to people or property resulting from any ideas, methods, instructions or products referred to in the content.

