
Using Precious Metals to Reduce the Downside Risk of FinTech Stocks


Abstract
1. Introduction
2. Methods
2.1. Relative Risk Ratios
2.2. Portfolio Construction
2.3. Portfolio Comparison
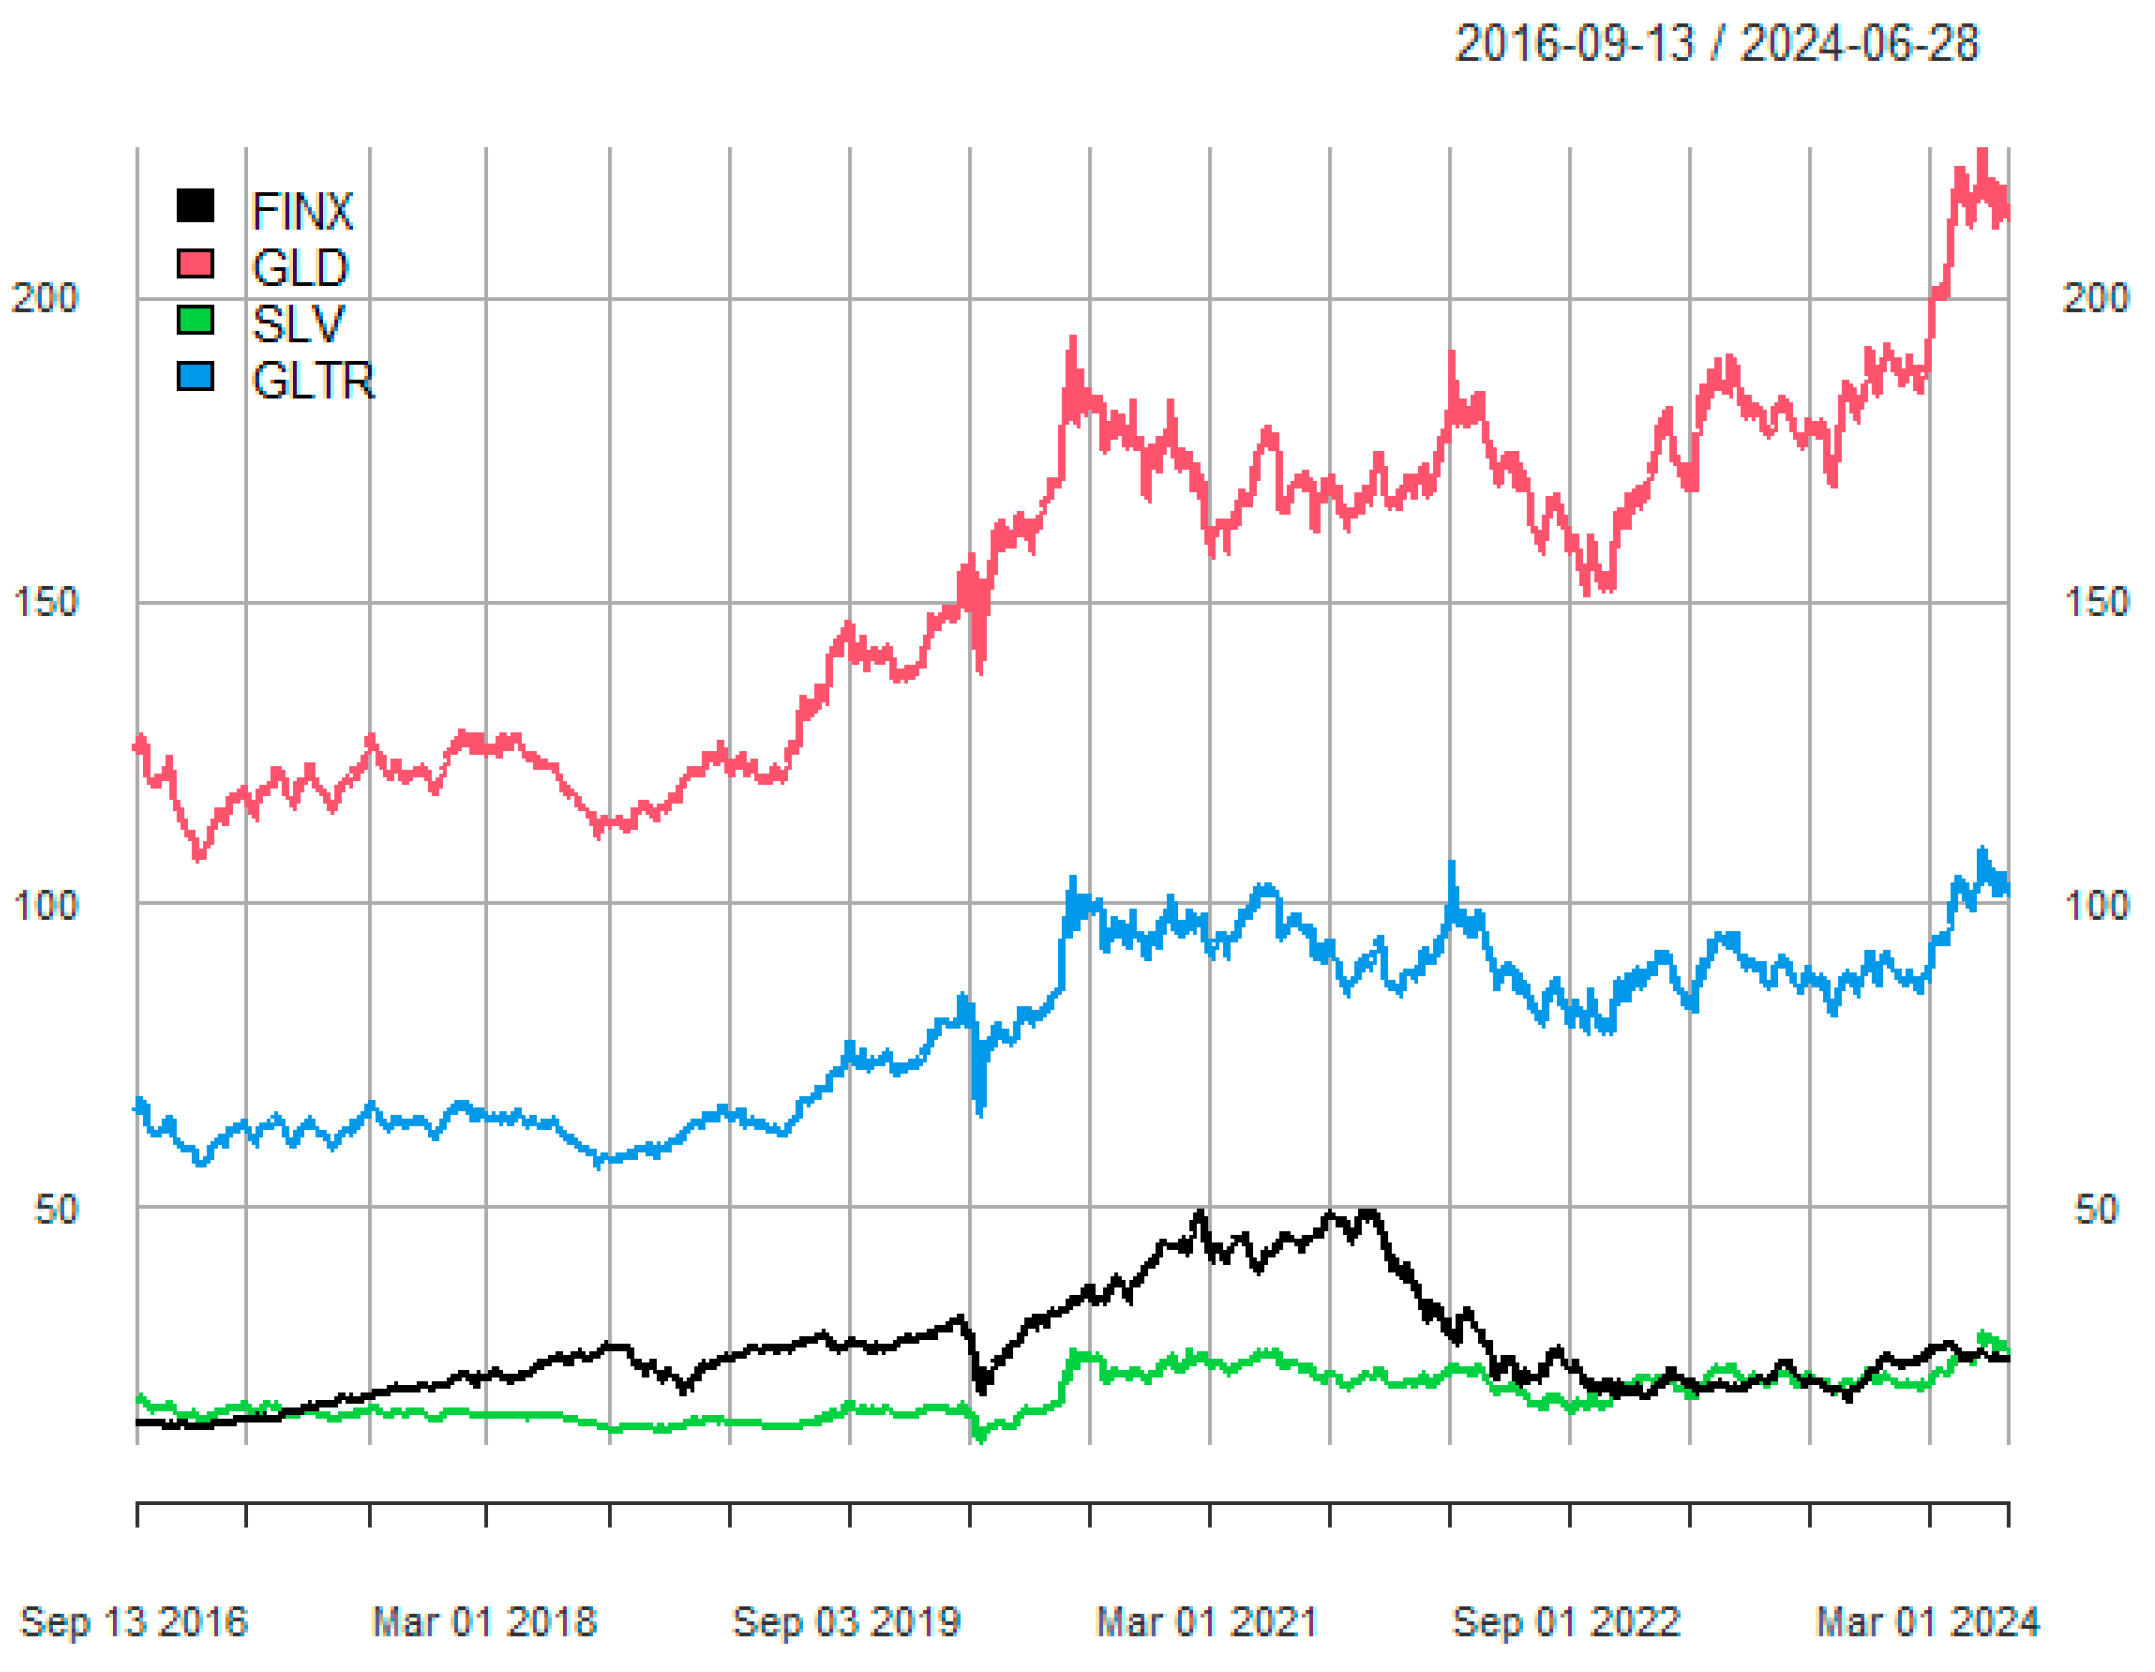
3. Data
4. Results
4.1. Two-Asset Portfolios
4.2. Three-Asset Portfolios
5. Discussion and Conclusions
Funding
Informed Consent Statement
Data Availability Statement
Acknowledgments
Conflicts of Interest
References
- Goldstein, I.; Jiang, W.; Karolyi, G.A. To FinTech and Beyond. Rev. Financ. Stud. 2019, 32, 1647–1661. [Google Scholar] [CrossRef]
- Abbasi, K.; Alam, A.; Du, M.; Huynh, T.L.D. FinTech, SME Efficiency and National Culture: Evidence from OECD Countries. Technol. Forecast. Soc. Chang. 2021, 163, 120454. [Google Scholar] [CrossRef]
- Wang, Y.; Xiuping, S.; Zhang, Q. Can Fintech Improve the Efficiency of Commercial Banks? —An Analysis Based on Big Data. Res. Int. Bus. Financ. 2021, 55, 101338. [Google Scholar] [CrossRef]
- Senyo, P.; Osabutey, E.L.C. Unearthing Antecedents to Financial Inclusion through FinTech Innovations. Technovation 2020, 98, 102155. [Google Scholar] [CrossRef]
- Girma, A.G.; Huseynov, F. The Causal Relationship between FinTech, Financial Inclusion, and Income Inequality in African Economies. J. Risk Financ. Manag. 2024, 17, 2. [Google Scholar] [CrossRef]
- Amnas, M.B.; Selvam, M.; Parayitam, S. FinTech and Financial Inclusion: Exploring the Mediating Role of Digital Financial Literacy and the Moderating Influence of Perceived Regulatory Support. J. Risk Financ. Manag. 2024, 17, 108. [Google Scholar] [CrossRef]
- Ashenafi, B.B.; Dong, Y. Financial Inclusion, Fintech, and Income Inequality in Africa. FinTech 2022, 1, 376–387. [Google Scholar] [CrossRef]
- Mckinsey The Future of Fintech Growth. McKinsey. Available online: https://www.mckinsey.com/industries/financial-services/our-insights/fintechs-a-new-paradigm-of-growth (accessed on 29 June 2024).
- Abakah, E.J.A.; Tiwari, A.K.; Ghosh, S.; Doğan, B. Dynamic Effect of Bitcoin, Fintech and Artificial Intelligence Stocks on Eco-Friendly Assets, Islamic Stocks and Conventional Financial Markets: Another Look Using Quantile-Based Approaches. Technol. Forecast. Soc. Chang. 2023, 192, 122566. [Google Scholar] [CrossRef]
- Adekoya, O.B.; Oliyide, J.A.; Saleem, O.; Adeoye, H.A. Asymmetric Connectedness between Google-Based Investor Attention and the Fourth Industrial Revolution Assets: The Case of FinTech and Robotics & Artificial Intelligence Stocks. Technol. Soc. 2022, 68, 101925. [Google Scholar] [CrossRef]
- Li, J.; Li, J.; Zhu, X.; Yao, Y.; Casu, B. Risk Spillovers between FinTech and Traditional Financial Institutions: Evidence from the U.S. Int. Rev. Financ. Anal. 2020, 71, 101544. [Google Scholar] [CrossRef]
- Chaudhry, S.M.; Ahmed, R.; Huynh, T.L.D.; Benjasak, C. Tail Risk and Systemic Risk of Finance and Technology (FinTech) Firms. Technol. Forecast. Soc. Chang. 2022, 174, 121191. [Google Scholar] [CrossRef]
- Chen, Y.; Chiu, J.; Chung, H. Givers or Receivers? Return and Volatility Spillovers between Fintech and the Traditional Financial Industry. Financ. Res. Lett. 2022, 46, 102458. [Google Scholar] [CrossRef]
- Chen, Y.; Wang, G.-J.; Zhu, Y.; Xie, C.; Uddin, G.S. Quantile Connectedness and the Determinants between FinTech and Traditional Financial Institutions: Evidence from China. Glob. Financ. J. 2023, 58, 100906. [Google Scholar] [CrossRef]
- Wang, Z.; Xia, Y.; Fu, Y.; Liu, Y. Volatility Spillover Dynamics and Determinants between FinTech and Traditional Financial Industry: Evidence from China. Mathematics 2023, 11, 4058. [Google Scholar] [CrossRef]
- Croutzet, A.; Dabbous, A. Do FinTech Trigger Renewable Energy Use? Evidence from OECD Countries. Renew. Energy 2021, 179, 1608–1617. [Google Scholar] [CrossRef]
- Le, T.-L.; Abakah, E.J.A.; Tiwari, A.K. Time and Frequency Domain Connectedness and Spill-over among Fintech, Green Bonds and Cryptocurrencies in the Age of the Fourth Industrial Revolution. Technol. Forecast. Soc. Chang. 2021, 162, 120382. [Google Scholar] [CrossRef]
- Alshater, M.M.; Polat, O.; El Khoury, R.; Yoon, S.-M. Dynamic Connectedness among Regional FinTech Indices in Times of Turbulences. Appl. Econ. Lett. 2022, 31, 670–675. [Google Scholar] [CrossRef]
- Bhatnagar, M.; Özen, E.; Taneja, S.; Grima, S.; Rupeika-Apoga, R. The Dynamic Connectedness between Risk and Return in the Fintech Market of India: Evidence Using the GARCH-M Approach. Risks 2022, 10, 209. [Google Scholar] [CrossRef]
- Rafiuddin, A.; Gaytan, J.C.T.; Mohnot, R.; Sisodia, G.S.; Ahmed, G. Growth Evaluation of Fintech Connectedness with Innovative Thematic Indices—An Evidence through Wavelet Analysis. J. Open Innov. Technol. Mark. Complex. 2023, 9, 100023. [Google Scholar] [CrossRef]
- Bodie, Z.; Kane, A.; Marcus, A.J. Investments, 13th ed.; McGraw-Hill Education: New York, NY, USA, 2023; ISBN 978-1-264-41266-2. [Google Scholar]
- Henriques, I.; Sadorsky, P. Do Clean Energy Stocks Diversify the Risk of FinTech Stocks? Connectedness and Portfolio Implications. Glob. Financ. J. 2024, 62, 101019. [Google Scholar] [CrossRef]
- Kuang, W. Are Clean Energy Assets a Safe Haven for International Equity Markets? J. Clean. Prod. 2021, 302, 127006. [Google Scholar] [CrossRef]
- Bredin, D.; Conlon, T.; Potì, V. The Price of Shelter—Downside Risk Reduction with Precious Metals. Int. Rev. Financ. Anal. 2017, 49, 48–58. [Google Scholar] [CrossRef]
- Jorion, P. Value at Risk: The New Benchmark for Managing Financial Risk, 2nd ed.; McGraw-Hill: New York, NY, USA, 2000; ISBN 978-0-07-135502-5. [Google Scholar]
- Poncet, P.; Portait, R. Value at Risk, Expected Shorfall, and Other Risk Measures. In Capital Market Finance: An Introduction to Primitive Assets, Derivatives, Portfolio Management and Risk; Poncet, P., Portait, R., Eds.; Springer International Publishing: Cham, Switzerland, 2022; pp. 1103–1169. ISBN 978-3-030-84600-8. [Google Scholar]
- Baur, D.G.; Lucey, B.M. Is Gold a Hedge or a Safe Haven? An Analysis of Stocks, Bonds and Gold. Financ. Rev. 2010, 45, 217–229. [Google Scholar] [CrossRef]
- Baur, D.G.; McDermott, T.K. Is Gold a Safe Haven? International Evidence. J. Bank. Financ. 2010, 34, 1886–1898. [Google Scholar] [CrossRef]
- Bekiros, S.; Boubaker, S.; Nguyen, D.K.; Uddin, G.S. Black Swan Events and Safe Havens: The Role of Gold in Globally Integrated Emerging Markets. J. Int. Money Financ. 2017, 73, 317–334. [Google Scholar] [CrossRef]
- Ciner, C.; Gurdgiev, C.; Lucey, B.M. Hedges and Safe Havens: An Examination of Stocks, Bonds, Gold, Oil and Exchange Rates. Int. Rev. Financ. Anal. 2013, 29, 202–211. [Google Scholar] [CrossRef]
- Hood, M.; Malik, F. Is Gold the Best Hedge and a Safe Haven under Changing Stock Market Volatility? Rev. Financ. Econ. 2013, 22, 47–52. [Google Scholar] [CrossRef]
- Junttila, J.; Pesonen, J.; Raatikainen, J. Commodity Market Based Hedging against Stock Market Risk in Times of Financial Crisis: The Case of Crude Oil and Gold. J. Int. Financ. Mark. Inst. Money 2018, 56, 255–280. [Google Scholar] [CrossRef]
- Baur, D.G.; McDermott, T.K.J. Why Is Gold a Safe Haven? J. Behav. Exp. Financ. 2016, 10, 63–71. [Google Scholar] [CrossRef]
- Beckmann, J.; Berger, T.; Czudaj, R. Does Gold Act as a Hedge or a Safe Haven for Stocks? A Smooth Transition Approach. Econ. Model. 2015, 48, 16–24. [Google Scholar] [CrossRef]
- Blose, L.E. Gold Prices, Cost of Carry, and Expected Inflation. J. Econ. Bus. 2010, 62, 35–47. [Google Scholar] [CrossRef]
- Hoang, T.H.V.; Lahiani, A.; Heller, D. Is Gold a Hedge against Inflation? New Evidence from a Nonlinear ARDL Approach. Econ. Model. 2016, 54, 54–66. [Google Scholar] [CrossRef]
- Reboredo, J.C. Is Gold a Safe Haven or a Hedge for the US Dollar? Implications for Risk Management. J. Bank. Financ. 2013, 37, 2665–2676. [Google Scholar] [CrossRef]
- Iqbal, J. Does Gold Hedge Stock Market, Inflation and Exchange Rate Risks? An Econometric Investigation. Int. Rev. Econ. Financ. 2017, 48, 1–17. [Google Scholar] [CrossRef]
- O’Connor, F.A.; Lucey, B.M.; Batten, J.A.; Baur, D.G. The Financial Economics of Gold—A Survey. Int. Rev. Financ. Anal. 2015, 41, 186–205. [Google Scholar] [CrossRef]
- Hillier, D.; Draper, P.; Faff, R. Do Precious Metals Shine? An Investment Perspective. Financ. Anal. J. 2006, 62, 98–106. [Google Scholar] [CrossRef]
- Tronzano, M. Financial Crises, Macroeconomic Variables, and Long-Run Risk: An Econometric Analysis of Stock Returns Correlations (2000 to 2019). J. Risk Financ. Manag. 2021, 14, 127. [Google Scholar] [CrossRef]
- Areal, N.; Oliveira, B.; Sampaio, R. When Times Get Tough, Gold Is Golden. Eur. J. Financ. 2015, 21, 507–526. [Google Scholar] [CrossRef]
- Valadkhani, A.; Nguyen, J.; Chiah, M. When Is Gold an Effective Hedge against Inflation? Resour. Policy 2022, 79, 103009. [Google Scholar] [CrossRef]
- Bredin, D.; Conlon, T.; Potì, V. Does Gold Glitter in the Long-Run? Gold as a Hedge and Safe Haven across Time and Investment Horizon. Int. Rev. Financ. Anal. 2015, 41, 320–328. [Google Scholar] [CrossRef]
- Mensi, W.; Hammoudeh, S.; Kang, S.H. Precious Metals, Cereal, Oil and Stock Market Linkages and Portfolio Risk Management: Evidence from Saudi Arabia. Econ. Model. 2015, 51, 340–358. [Google Scholar] [CrossRef]
- Mensi, W.; Aslan, A.; Vo, X.V.; Kang, S.H. Time-Frequency Spillovers and Connectedness between Precious Metals, Oil Futures and Financial Markets: Hedge and Safe Haven Implications. Int. Rev. Econ. Financ. 2023, 83, 219–232. [Google Scholar] [CrossRef]
- Lahiani, A.; Mefteh-Wali, S.; Vasbieva, D.G. The Safe-Haven Property of Precious Metal Commodities in the COVID-19 Era. Resour. Policy 2021, 74, 102340. [Google Scholar] [CrossRef]
- Kangalli Uyar, S.G.; Uyar, U.; Balkan, E. The Role of Precious Metals in Extreme Market Conditions: Evidence from Stock Markets. Stud. Econ. Financ. 2021, 39, 63–78. [Google Scholar] [CrossRef]
- Low, R.K.Y.; Yao, Y.; Faff, R. Diamonds vs. Precious Metals: What Shines Brightest in Your Investment Portfolio? Int. Rev. Financ. Anal. 2016, 43, 1–14. [Google Scholar] [CrossRef]
- McWaters, R.J.; Galaski, R. Beyond Fintech: A Pragmatic Assessment of Disruptive Potential in Financial Services; World Economic Forum: Geneva, Switzerland, 2017. [Google Scholar]
- Favre, L.; Galeano, J.-A. Mean-Modified Value-at-Risk Optimization with Hedge Funds. J. Altern. Invest. 2002, 5, 21–25. [Google Scholar] [CrossRef]
- Markowitz, H. Portfolio Selection. J. Financ. 1952, 7, 77–91. [Google Scholar]
- Christoffersen, P.; Errunza, V.; Jacobs, K.; Jin, X. Correlation Dynamics and International Diversification Benefits. Int. J. Forecast. 2014, 30, 807–824. [Google Scholar] [CrossRef]
- Broadstock, D.C.; Chatziantoniou, I.; Gabauer, D. Minimum Connectedness Portfolios and the Market for Green Bonds: Advocating Socially Responsible Investment (SRI) Activity. In Applications in Energy Finance: The Energy Sector, Economic Activity, Financial Markets and the Environment; Floros, C., Chatziantoniou, I., Eds.; Springer International Publishing: Cham, Switzerland, 2022; pp. 217–253. ISBN 978-3-030-92957-2. [Google Scholar]
- Antonakakis, N.; Chatziantoniou, I.; Gabauer, D. Refined Measures of Dynamic Connectedness Based on Time-Varying Parameter Vector Autoregressions. J. Risk Financ. Manag. 2020, 13, 84. [Google Scholar] [CrossRef]
- Diebold, F.X.; Yilmaz, K. Better to Give than to Receive: Predictive Directional Measurement of Volatility Spillovers. Int. J. Forecast. 2012, 28, 57–66. [Google Scholar] [CrossRef]
- Diebold, F.X.; Yilmaz, K. Measuring Financial Asset Return and Volatility Spillovers, with Application to Global Equity Markets. Econ. J. 2009, 119, 158–171. [Google Scholar] [CrossRef]
- Abakah, E.J.A.; Abdullah, M.; Dankwah, B.; Lee, C.-C. Asymmetric Dynamics between the Baltic Dry Index and Financial Markets during Major Global Economic Events. North Am. J. Econ. Financ. 2024, 72, 102126. [Google Scholar] [CrossRef]
- Cogneau, P.; Hübner, G. The 101 Ways to Measure Portfolio Performance. SSRN Electron. J. 2009. [Google Scholar] [CrossRef]
- R Core Team. R: A Language and Environment for Statistical Computing; R Core Team: Vienna, Austria, 2022. [Google Scholar]
- Gabauer, D. Connectedness Approach: Connectedness Approach; R Core Team: Vienna, Austria, 2022. [Google Scholar]
- Ryan, J.A.; Ulrich, J.M.; Smith, E.B.; Thielen, W.; Teetor, P.; Bronder, S. Quantmod: Quantitative Financial Modelling Framework 2023.
- Peterson, B.G.; Carl, P.; Boudt, K.; Bennett, R.; Ulrich, J.; Zivot, E.; Cornilly, D.; Hung, E.; Lestel, M.; Balkissoon, K.; et al. PerformanceAnalytics: Econometric Tools for Performance and Risk Analysis 2020.
- Fu, J.; Mishra, M. Fintech in the Time of COVID−19: Technological Adoption during Crises. J. Financ. Intermediation 2022, 50, 100945. [Google Scholar] [CrossRef]
- Committee of European Securities Regulators. CESR’s Guidelines on Risk Measurement and the Calculation of Global Exposure and Counterparty Risk for UCITS CESR/10-788; Committee of European Securities Regulators: Paris, France, 2010. [Google Scholar]
- Basel Committee on Banking Supervision. An Internal Model-Based Approach to Market Risk Capital Requirements; Basel Committee on Banking Supervision: Basel, Switzerland, 1995. [Google Scholar]


| Median | Mean | Std.dev | Coef.var | Skewness | Kurtosis | KPSS | W | W(p) | |
|---|---|---|---|---|---|---|---|---|---|
| FINX | 0.145 | 0.030 | 1.804 | 60.532 | −0.490 | 5.600 | 0.287 | 0.938 | 0.000 |
| GLD | 0.055 | 0.027 | 0.865 | 31.595 | −0.314 | 3.275 | 0.098 | 0.966 | 0.000 |
| SLV | 0.040 | 0.020 | 1.708 | 85.116 | −0.418 | 7.627 | 0.080 | 0.924 | 0.000 |
| GLTR | 0.066 | 0.023 | 1.098 | 48.471 | −0.486 | 5.513 | 0.053 | 0.949 | 0.000 |
| FINX | GLD | SLV | GLTR | |
|---|---|---|---|---|
| FINX | 1.000 | 0.105 | 0.239 | 0.223 |
| GLD | 0.105 | 1.000 | 0.783 | 0.902 |
| SLV | 0.239 | 0.783 | 1.000 | 0.909 |
| GLTR | 0.223 | 0.902 | 0.909 | 1.000 |
| FINX | FINX_GLD | FINX_SLV | FINX_GLTR | |
|---|---|---|---|---|
| Annualized Return | 0.075 | 0.080 | 0.076 | 0.076 |
| Annualized Std Dev | 0.286 | 0.220 | 0.239 | 0.227 |
| Annualized Sharpe | 0.153 | 0.218 | 0.187 | 0.196 |
| Maximum Drawdown | 0.635 | 0.521 | 0.543 | 0.531 |
| Historical VaR (95%) | −0.030 | −0.023 | −0.024 | −0.024 |
| Historical ES (95%) | −0.043 | −0.033 | −0.036 | −0.034 |
| Modified VaR (95%) | −0.029 | −0.022 | −0.024 | −0.023 |
| Modified ES (95%) | −0.051 | −0.039 | −0.047 | −0.043 |
| Omega (L = 0%) | 1.074 | 1.086 | 1.080 | 1.082 |
| MVP | MCP | MPC | |
|---|---|---|---|
| Annualized Return | 0.085 | 0.072 | 0.062 |
| Annualized Std Dev | 0.127 | 0.171 | 0.177 |
| Annualized Sharpe | 0.458 | 0.269 | 0.199 |
| Maximum Drawdown | 0.235 | 0.412 | 0.425 |
| Historical VaR (95%) | −0.013 | −0.017 | −0.018 |
| Historical ES (95%) | −0.018 | −0.025 | −0.026 |
| Modified VaR (95%) | −0.013 | −0.017 | −0.018 |
| Modified ES (95%) | −0.021 | −0.031 | −0.035 |
| Omega (L = 0%) | 1.131 | 1.091 | 1.078 |
Disclaimer/Publisher’s Note: The statements, opinions and data contained in all publications are solely those of the individual author(s) and contributor(s) and not of MDPI and/or the editor(s). MDPI and/or the editor(s) disclaim responsibility for any injury to people or property resulting from any ideas, methods, instructions or products referred to in the content. |
© 2024 by the author. Licensee MDPI, Basel, Switzerland. This article is an open access article distributed under the terms and conditions of the Creative Commons Attribution (CC BY) license (https://creativecommons.org/licenses/by/4.0/).
Share and Cite
Sadorsky, P. Using Precious Metals to Reduce the Downside Risk of FinTech Stocks. FinTech 2024, 3, 537-550. https://doi.org/10.3390/fintech3040028
Sadorsky P. Using Precious Metals to Reduce the Downside Risk of FinTech Stocks. FinTech. 2024; 3(4):537-550. https://doi.org/10.3390/fintech3040028
Chicago/Turabian StyleSadorsky, Perry. 2024. "Using Precious Metals to Reduce the Downside Risk of FinTech Stocks" FinTech 3, no. 4: 537-550. https://doi.org/10.3390/fintech3040028
APA StyleSadorsky, P. (2024). Using Precious Metals to Reduce the Downside Risk of FinTech Stocks. FinTech, 3(4), 537-550. https://doi.org/10.3390/fintech3040028