Abstract
This study examines the relationship between Bitcoin market dynamics and user activity on the r/cryptocurrency subreddit. The purpose of this research is to understand how social media activity correlates with Bitcoin price and trading volume, and to explore the sentiment and topical focus of Reddit discussions. We collected data on Bitcoin’s closing price and trading volume from January 2021 to December 2022, alongside the most popular posts and comments from the subreddit during the same period. Our analysis revealed significant correlations between Bitcoin market metrics and Reddit activity, with user discussions often reacting to market changes. Additionally, user activity on Reddit may indirectly influence the market through broader social and economic factors. Sentiment analysis showed that positive comments were more prevalent during price surges, while negative comments increased during downturns. Topic modeling identified four main discussion themes, which varied over time, particularly during market dips. These findings suggest that social media activity on Reddit can provide valuable insights into market trends and investor sentiment. Overall, our study highlights the influential role of online communities in shaping cryptocurrency market dynamics, offering potential tools for market prediction and regulation.
JEL Classification:
E52; E31; J23
1. Introduction
The rapid growth and adoption of cryptocurrencies have attracted significant attention from investors, researchers, and policymakers. Among these digital assets, Bitcoin (BTC) [1] stands out due to its market dominance and influence on the broader cryptocurrency ecosystem. Understanding the factors that drive Bitcoin’s price and trading volume is crucial for stakeholders across various sectors. One such factor is the sentiment and activity within online communities, where discussions and opinions about cryptocurrencies are actively shared.
Social media platforms and online forums play a vital role in shaping the market dynamics of cryptocurrencies [2]. These platforms provide real-time information, opinions, and sentiment that can influence investor behavior and market trends. Several studies have explored the relationship between social media activity and cryptocurrency markets, highlighting the significance of sentiment analysis and user engagement in predicting price movements and trading volumes.
While previous studies have examined the relationship between social media sentiment and cryptocurrency markets, our research distinguishes itself by focusing on the specific community of r/cryptocurrency on Reddit. We leverage a combination of sentiment analysis and topic modeling on a comprehensive dataset of posts and comments, providing a detailed view of how online discussions evolve and correlate with Bitcoin market movements. By examining both sentiment and thematic content over time, our study offers nuanced insights into the interplay between social media activity and cryptocurrency market dynamics.
Understanding the interplay between social media and cryptocurrency markets is crucial in an era where digital assets are rapidly gaining mainstream adoption. As market participants increasingly turn to platforms like Reddit for real-time information and community insights, it becomes essential to quantify and understand the impact of these discussions on market behavior. This knowledge is valuable not only for traders and analysts seeking predictive tools but also for policymakers aiming to ensure market integrity and investor protection in the highly volatile cryptocurrency space.
This paper investigates the correlation between Bitcoin market data (price and volume) and activity on the r/cryptocurrency subreddit. Through sentiment analysis and topic modeling of posts and comments we aim to uncover how online discussions impact Bitcoin’s market performance. Furthermore, we analyze the temporal dynamics of these discussions and their association with significant market events, providing deeper insights into the role of social media in shaping cryptocurrency market trends.
The BTC market figures serve as a basis for correlating Bitcoin market data with user activity on cryptocurrency-related subreddits. By examining the frequency and content of posts and comments, we aim to identify patterns and potential causal relationships between online discourse and market behavior.
Our study is motivated by the need to comprehend the intricate relationship between social media activity and cryptocurrency markets, providing valuable insights for investors, analysts, and policymakers. The findings contribute to the growing body of literature on the impact of online communities on financial markets, offering a deeper understanding of the factors driving Bitcoin’s market behavior.
The structure of this paper is as follows: A review of the relevant literature is presented in the next section, In Section 3, we present our methodology, including data collection, sentiment analysis, and topic modeling techniques. In Section 4, we present and analyze the results of our study. In Section 5, we discuss the results further, highlighting key trends and correlations between social media activity and Bitcoin market data. Finally, we conclude with implications for future research and practical applications.
2. Literature Review
In this section, we present a comprehensive review of the relevant literature, examining previous studies on the relationship between social media activity and cryptocurrency markets, the predictive power of online sentiment on Bitcoin prices, and the methodologies employed in sentiment analysis and topic modeling.
The cryptocurrency market, particularly Bitcoin, has been subject to significant price fluctuations and trading volume variability, captivating the attention of researchers, investors, and policymakers alike. As the first and most prominent decentralized digital currency, Bitcoin’s market dynamics are influenced by a complex array of factors, including macroeconomic indicators, regulatory environments, and market sentiment. In recent years, the role of online communities and social media platforms in shaping Bitcoin’s price and trading volume has gained increasing recognition.
For instance, Kang et al. [3] investigated the relationship between Bitcoin price movements and user activity in cryptocurrency-related online forums, demonstrating a significant correlation between market trends and the volume of discussions. Similarly, Oikonomopoulos et al. [4] utilized machine learning techniques and sentiment analysis of social media data to predict Bitcoin prices, revealing that social sentiment plays a critical role in market forecasting. Tandon et al. [5] further emphasized the impact of social media activity on Bitcoin prices using big data analysis, showing that public sentiment on platforms like Twitter significantly affects market dynamics.
The influence of social media on cryptocurrency trading behavior has been corroborated by multiple studies. Raheman et al. [6] analyzed social media sentiment and its effect on cryptocurrency markets, finding strong correlations between public sentiment and price movements. Similarly, Steinert and Herff [7] demonstrated that fluctuations in altcoins, that is, cryptocurrencies other than Bitcoin, can be predicted from social media, indicating that the volume and sentiment of online discussions are predictive indicators of market performance.
In addition to sentiment analysis, topic modeling techniques such as latent Dirichlet allocation (LDA) have been employed to understand the thematic structure of discussions within cryptocurrency communities [8]. Loginova et al. [9] applied aspect-based sentiment analysis techniques to analyze online cryptocurrency text data, identifying key themes and their evolution over time. This approach provides insights into the main areas of interest and concern within the community, which can be correlated with market events and trends. Phillips and Gorse [10] examined the relationship between cryptocurrency price changes and topic discussions on social media, using dynamic topic modeling and Hawkes models, and found that certain topics, such as “risk and investment vs. trading” and “fundamental cryptocurrency value”, tend to precede specific types of price movements, like price falls and rises.
Several studies have focused on specific social media platforms to explore their influence on cryptocurrency markets. Wooley et al. [11] found that discussions on Reddit significantly influence cryptocurrency prices, while Gurrib and Kamalov [12] used discriminant analysis and sentiment analysis of news announcement headlines to predict Bitcoin prices, demonstrating the predictive power of social sentiment on future price movements. Kraaijeveld and De Smedt [13] also highlighted the impact of Twitter sentiment for forecasting cryptocurrency prices, showing that public sentiment expressed on social media platforms can drive market trends.
The relationship between social media sentiment and market dynamics is complex and multifaceted. Phillips and Gorse [14] predicted cryptocurrency price bubbles using social media data and epidemic modeling. Naeem et al. [15] analyzed the relationship between online investor sentiment, measured through Twitter happiness and the FEARS index, and the returns of six major cryptocurrencies, finding that sentiment is a significant predictor of cryptocurrency returns, particularly at extreme market states. Lamon et al. [16] developed a model that uses news and social media data to predict price fluctuations of three cryptocurrencies (bitcoin, litecoin, and ethereum) by training the model on labeled data based on actual future price changes, allowing it to directly predict price movements. Pang et al. [17] explored the use of machine learning techniques to predict bitcoin prices by modeling the nonlinear relationship between prices and social sentiment data, and found that sentiment-based models, particularly neural networks, outperform traditional methods in capturing this relationship and predicting prices with higher accuracy.
Narman and Uulu [18] conducted sentiment analysis on social media comments about six cryptocurrencies to understand public opinions and attitudes towards them, and found that overall positivity outweighs negativity, with varying relationships between price changes and attitudes depending on the specific cryptocurrency. Agosto et al. [19] used a novel statistical test to detect speculative bubbles in cryptocurrency prices by incorporating market sentiment data from news and Google search indices, and found that sentiment plays a crucial role in predicting bubble occurrences, particularly when investors’ sentiment is highly polarized. Georgoula et al. [20] analyzed the relationship between Bitcoin prices and various factors, including economic variables, technological factors, and Twitter sentiment, using time-series analysis and machine learning algorithms, and found that Twitter sentiment, Wikipedia search queries, and hash rate are positively correlated with Bitcoin prices, while the USD–EUR exchange rate and S&P 500 index are negatively correlated.
3. Methodology
In this section, we present the methodology and data analysis that were performed to explore the relationship between Bitcoin market data and user activity on the r/cryptocurrency subreddit. This includes detailed descriptions of the data collection process, text preprocessing steps, sentiment analysis techniques, topic modeling using latent Dirichlet allocation (LDA), and various correlation analyses. By employing these methods, we aim to uncover insights into how online discussions and sentiment influence Bitcoin’s price and trading volume over time. The rationale behind our choices is explained in detail as well.
3.1. Data Collection
3.1.1. Bitcoin Market Data
We collected Bitcoin market data, including daily closing prices and trading volumes, for the period from 1 January 2021 to 31 December 2022. The data were sourced from CoinMarketCap [21], ensuring accuracy and completeness for the analysis. This dataset provides the necessary information to examine the correlation between market trends and online discussions.
We used BTC closing prices for our analyses, as these are widely regarded as the most reliable and significant data points in technical analysis due to their role in reflecting the final consensus value of a trading session [22]. As the last price at which a security trades before the market closes, the closing price encapsulates the cumulative information, market sentiment, and investor actions throughout the trading period. This price is crucial for the calculation of various technical indicators, which rely on closing prices to generate signals and identify trends. Moreover, closing prices are less susceptible to intraday volatility and noise, providing a more stable and accurate basis for analysis. Their consistent use in technical analysis frameworks and trading strategies across different markets further underscores their importance and reliability in evaluating market performance and making informed decisions.
We also used BTC daily volume data to perform autocorrelation analyses with online user activity. Volume represents the amount of bitcoins being traded on a given day, and it can be used to confirm price movements and identify potential trends. When the price of bitcoin is increasing and volume is high, it can be a sign of strong buying pressure and a potential uptrend. On the other hand, if the price is increasing but volume is low, it may indicate a lack of conviction among buyers and a potential reversal. Conversely, when the price of bitcoin is decreasing and volume is high, it can be a sign of strong selling pressure and a potential downtrend. If the price is decreasing but volume is low, it may indicate a lack of selling interest and a potential bottom. Additionally, volume data can be used to identify potential reversals and changes in market sentiment. For example, if the price of bitcoin has been increasing for several days but volume starts to decrease, it may be a sign that the uptrend is losing steam and a reversal is imminent.
3.1.2. Online Community Activity
Reddit [23] is a social news and discussion website where users can share and discuss content on a wide range of topics. It is often described as the “front page of the internet” because of its vast collection of content, which is curated and moderated by a community of users.
A subreddit is a smaller community within Reddit that focuses on a specific topic or interest. There are thousands of subreddits, each with its own unique culture and rules.
The r/cryptocurrency subreddit is a community of users who are interested in cryptocurrencies such as Bitcoin, Ethereum, and others. The subreddit is a place where users can share news, ask questions, and discuss various topics related to cryptocurrencies, including market trends, investment strategies, and blockchain technology. It is one of the most popular cryptocurrency communities online, with millions of subscribers.
In our data collection process, we focused on gathering only the most popular posts and their corresponding comments from the r/cryptocurrency subreddit for the period from 1 January 2021 to 31 December 2022. This approach resulted in a dataset of 770 posts and 14,886 comments. The rationale behind this selective collection strategy includes several key considerations:
- Relevance and influence: Popular posts typically garner the most attention and engagement within the community. By focusing on these posts, we capture the discussions that are most likely to influence and reflect the broader sentiment and opinions of the subreddit members. These high-engagement posts often drive significant discussions and can have a more substantial impact on market perceptions and behaviors.
- Quality over quantity: Collecting a vast number of posts indiscriminately can introduce a lot of noise, as many low-engagement posts might not contribute meaningful insights to the analysis. By selecting only the most popular posts, we ensure a higher-quality dataset that is rich in content and context, which is more suitable for robust sentiment and topic analysis.
- Resource efficiency: Analyzing the entire stream of posts and comments from a busy subreddit like r/cryptocurrency can be resource-intensive in terms of computational power and time. Focusing on the most popular posts allows us to perform a more manageable and efficient analysis while still capturing the essential dynamics of the community.
- Reflecting community trends: Popular posts are often indicative of trending topics and hot-button issues within the cryptocurrency community. By analyzing these posts, we can better understand the current trends, concerns, and sentiments that are prevalent among active participants in the subreddit.
- Enhanced sentiment analysis: Sentiment analysis benefits from context-rich data. Popular posts and their comments are likely to contain more detailed and passionate expressions of sentiment, providing a clearer picture of the community’s emotional and attitudinal landscape.
- Focus on key influences: High-engagement posts are more likely to be shared and discussed beyond the subreddit, potentially influencing wider public opinion and media coverage. By analyzing these posts, we can gain insights into the key influences shaping the narrative around Bitcoin and other cryptocurrencies.
We used the PRAW API [24] to extract posts and comments from 1 January 2021 to 31 December 2022 from the r/cryptocurrency subreddit. The posts and comments of the last day were collected on a daily basis. It has been reported that Reddit posts and comments typically receive the majority of their votes within the first 24 h of being posted [25]. This pattern is driven by the way Reddit’s algorithm and user engagement work. By gathering data daily, we aim to capture these fluctuations and provide a more accurate and responsive analysis. Additionally, daily data collection allows us to develop models that can operate in real time or near-real time, which is crucial for traders and analysts who rely on up-to-date information to make informed decisions. This approach not only enhances the granularity of our analysis but also ensures that our findings are relevant and actionable in the fast-paced environment of cryptocurrency trading.
The resulting dataset includes the text content of each post and comment, timestamps, and additional metadata such as scores information for posts.
3.2. Text Preprocessing
Effective text preprocessing is crucial for accurate sentiment analysis and topic modeling. The preprocessing pipeline for collected user comments consists of several steps designed to clean and standardize the text data.
- Tokenization: The text is split into individual words or tokens. This helps in handling each word separately during further processing.
- Lowercasing: All text is converted to lowercase to ensure uniformity. For example, “Bitcoin” and “bitcoin” are treated as the same token.
- Removing punctuation and special characters: Punctuation marks and special characters (e.g., #, @, !) are removed to avoid their interference in the analysis. This step helps in reducing noise in the data.
- Removing URLs and hyperlinks: URLs and hyperlinks are extracted and discarded as they do not contribute meaningful information for sentiment or thematic analysis.
- Removing stopwords: Common words that do not carry significant meaning (e.g., “and”, “the”, “is”) are removed. We use the NLTK [26] stopword list and expand it based on domain-specific knowledge.
- Stemming and lemmatization: Words are reduced to their base or root form. Stemming cuts words to their base form, while lemmatization uses dictionary-based methods to achieve this. For instance, “running” becomes “run”. We employed lemmatization using the WordNet lemmatizer from NLTK as it preserves the context better than stemming.
- Handling emojis and emoticons: Emojis and emoticons are often used to convey sentiment. We replace them with corresponding text descriptions (e.g., “:”) becomes “smiley_ face”) to retain their sentiment information.
- Removing redundant whitespace: Multiple spaces, tabs, and newlines are normalized to a single space to ensure consistent formatting.
- Retaining domain-specific terms: Cryptocurrency discussions often involve specific jargon (e.g., “HODL”, “FOMO”, “moon”). These terms are retained to ensure the relevance and accuracy of sentiment and topic analysis.
The cleaned and preprocessed text is then used for subsequent analyses, including sentiment analysis and topic modeling.
3.3. Sentiment Analysis
To analyze the sentiment of Reddit comments, we employed a pre-trained sentiment analysis model using NLTK and VADER [27]. This model classifies the sentiment of each comment into three categories: positive, neutral, and negative. The sentiment scores were aggregated to provide an overall sentiment distribution for the given period.
- Text preprocessing: The text of each comment was preprocessed using the steps described in Section 3.2.
- Sentiment classification: Using the VADER model, each comment was assigned a sentiment score. Comments were categorized based on their scores: positive (score > 0.5), neutral (score between −0.5 and 0.5), and negative (score < −0.5).
- Aggregation: Sentiment scores were aggregated on a daily basis to track sentiment trends over time. The distribution of comments into positive, neutral, and negative categories was calculated for each day.
3.4. Topic Modeling
To understand the thematic structure of the discussions, we employed latent Dirichlet allocation (LDA) [28] for topic modeling. LDA is a generative probabilistic model that identifies topics in a collection of documents and the distribution of words within those topics. The steps to complete the LDA analysis included:
- Text preprocessing: Similar to sentiment analysis, text preprocessing was performed to clean the data as described in Section 3.2. Additionally, words that appear very infrequently (e.g., only once or twice in the dataset) were removed to enhance model performance. These words often do not contribute significant information and can introduce noise.
- Choosing the number of topics: The optimal number of topics was determined using a perplexity plot and multiple evaluation metrics, as produced by the ldatuning [29] package in GNU R [30], with each metric offering a different perspective on model evaluation.
- -
- Perplexity [28]: Perplexity measures how well a probabilistic model predicts a sample, with lower values indicating better generalization performance.
- -
- CaoJuan2009 [31]: This metric aims to minimize the distance between topics. The optimal number of topics is identified at the minimum point of the curve.
- -
- Arun2010 [32]: Similar to CaoJuan2009, this metric also seeks the minimum value, which reflects the most distinct topics.
- -
- Griffiths2004 [33]: This metric evaluates the likelihood of the model. The optimal number of topics is indicated by the maximum value of the curve.
- -
- Deveaud2014 [34]: This metric measures topic coherence, with higher values indicating better coherence.
In order to decide the optimal number of topics to use, the combined performance of all metrics should be taken into account. - Model training: The LDA model was trained on the preprocessed dataset. The top ten terms for each topic were extracted to interpret the themes.
- Topic distribution: The distribution of topics over time was analyzed to observe changes in the thematic focus of the subreddit.
3.5. Correlation Analysis
To explore the relationship between user online activity and Bitcoin market data and help identify the temporal relationships between them, we performed several autocorrelation analyses [35]:
- Between the number of retrieved posts and BTC closing prices and volumes at various lags.
- Between the number of retrieved comments and BTC closing prices and volumes at various lags.
In analyzing these relationships between Bitcoin market data and online activity, we utilized a wide lag range from −40 to 40 days to capture the full spectrum of potential temporal interactions. Cryptocurrency markets can be highly volatile, and the impact of social media activity on market trends can manifest over different time frames. A wide lag range allows us to identify both immediate and delayed effects. For instance, immediate reactions to news or events might show up within a few days, while broader sentiment shifts might influence market behavior over several weeks. Additionally, the relationship between online discussions and market performance is complex and can involve feedback loops. By examining a wide range of lags, we can better understand how market changes might influence online discussions and vice versa. For example, significant market events might trigger prolonged discussions, which could, in turn, affect future market trends.
We employed a moving average over the last 7 days for the number of retrieved posts and comments, to smooth and analyze correlations between Bitcoin market metrics and user engagement on the r/cryptocurrency subreddit. This approach helps mitigate daily fluctuations and provides a clearer trend over time. The moving average approach is widely used in time-series analysis to highlight trends and filter out short-term noise [36], enabling us to discern more meaningful correlations and insights into the dynamics of cryptocurrency markets influenced by online community discussions.
Scatter plots were created to visualize the relationship between Bitcoin market data and online activity at specific lags. Pearson’s correlation coefficient (r) was calculated to quantify the strength of the correlation. The significance of the correlation was tested using p-values. Statistical significance was declared at .
4. Results
4.1. Bitcoin Market Data
Figure 1 illustrates the closing price of Bitcoin (BTC) over a two-year period, from 1 January 2021 to 31 December 2022. The data reveal significant volatility, characteristic of the cryptocurrency market. Notably, BTC reached an all-time high in November 2021, approaching USD 68,000, before undergoing a substantial correction throughout 2022. This decline reflects broader market trends, including macroeconomic factors and changes in investor sentiment. The closing price provides a critical foundation for understanding market dynamics and investor behavior during this period.
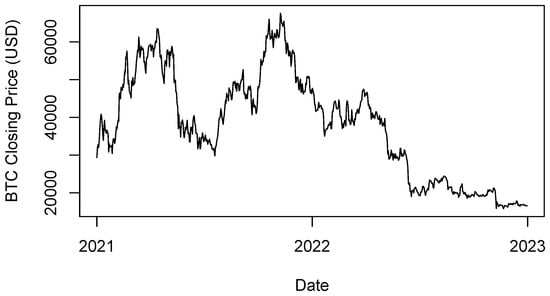
Figure 1.
BTC closing price (USD), January 2021–December 2022.
Figure 2 presents the trading volume of Bitcoin over the same two-year span. Volume, a measure of the total number of BTC traded within a given time frame, is a crucial indicator of market activity and liquidity. Peaks in trading volume often coincide with significant price movements, either upward or downward. For instance, the heightened trading volumes observed in the first half of 2021 align with BTC’s price surge and subsequent decline. Analyzing volume trends helps to contextualize price fluctuations and provides insight into periods of heightened market engagement.
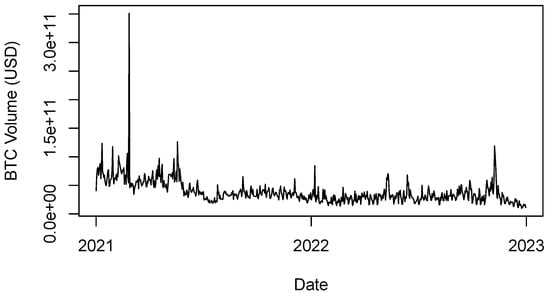
Figure 2.
BTC volume (USD), January 2021–December 2022.
4.2. Online Community Data
Figure 3 displays a histogram of the scores of posts collected from a cryptocurrency-related subreddit over the two-year period from 1 January 2021 to 31 December 2022. The distribution is skewed to the left. Most posts received high scores, with values around 10,000, with a few posts achieving very high scores. The score of a post, typically determined by upvotes minus downvotes, reflects the community’s engagement and approval of the content.
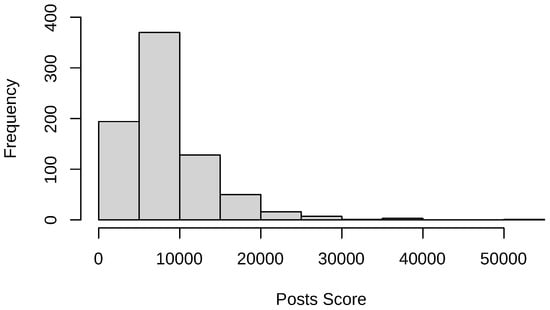
Figure 3.
Histogram of collected posts score.
This left-skewed distribution suggests that while the majority of posts received increased attention and approval, a smaller number of posts garnered exceptional interest and high levels of positive feedback from the community. These high-scoring posts are likely those that provided valuable information, insightful analysis, significant news updates, or engaging discussions relevant to the cryptocurrency market.
Table 1 presents the descriptive statistics for the number of comments on the collected posts from the same subreddit and time period. The distribution of data is extremely skewed to the left. This skewness indicates that most posts received a modest number of comments, while a smaller number of posts generated a substantial amount of discussion. This pattern is typical in online communities, where a few highly engaging or controversial posts attract the majority of comments. The peaks in comment activity likely align with the same key events or periods identified in the post histogram, highlighting moments of intense community interaction and discourse in response to notable market developments or news.

Table 1.
Descriptive statistics for number of comments per collected post.
Correlations with BTC Market Data
Figure 4 displays the autocorrelation graph between the daily closing price of Bitcoin (BTC) and the number of posts collected from the r/cryptocurrency subreddit every day, using lag values from to 40. A negative lag value suggests that the number of posts in a day may influence the price of BTC for the next days, while a positive lag value suggests that the price of BTC may influence the number of posts during the next days. The analysis reveals significant correlations between the two variables, which extend for a long period of time. Specifically, the positive correlation indicates that as the BTC price increases, the number of posts on the subreddit tends to increase as well, and vice versa. Additionally, when one of the two variables decreases, so does the other. The correlation becomes significant at . Correlations increase in significance as the lag value increases. The presence of these correlations suggests that there is an interplay between the two variables. An increased number of posts, which signifies growing user interest, leads to an increase in BTC price in the next days. As the lag value becomes positive, it suggests that increases in BTC price cause an increase in online activity and the effect lasts for more than a month.
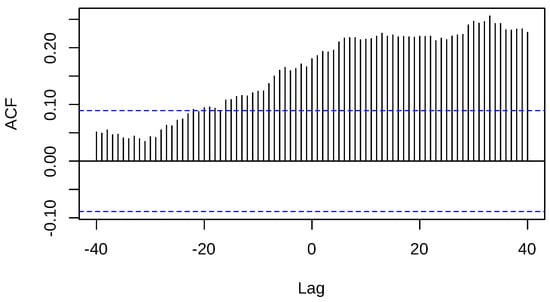
Figure 4.
Autocorrelation between BTC closing price and number of popular posts.
As an example of the relationship between the two variables, Figure 5 and Figure 6 present scatter plots of the daily closing price of Bitcoin (BTC) against the number of posts on the r/cryptocurrency subreddit at different lag values. Both figures are very similar and reveal the positive correlations between the two variables. Figure 5 shows that there exists a trend for BTC closing price to follow the number of posts in the r/cryptocurrency subreddit the next day (Pearson’s ), while Figure 6 shows that BTC closing price also influences the user activity, even 15 days later (Pearson’s ). However, the relationship is not absolute in any case. This suggests that while there is a general tendency for BTC price movements to influence subreddit activity, and vice versa, other factors may also be at play, and the relationship is not necessarily deterministic.
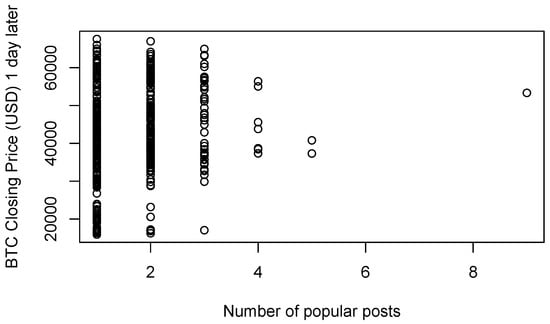
Figure 5.
Number of popular posts vs. BTC closing price 1 day later.
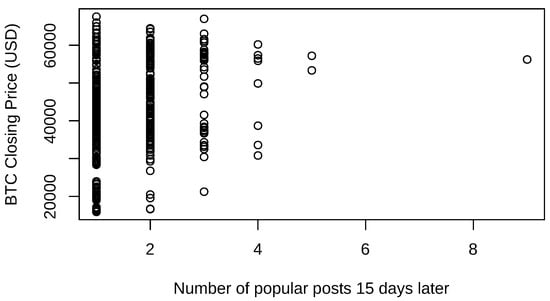
Figure 6.
BTC closing price vs. number of popular posts 15 days later.
Next, we performed an autocorrelation between BTC volume and the number of posts collected from the r/cryptocurrency subreddit. The results are shown in Figure 7. These, similarly to the autocorrelation results between BTC price and the number of posts, show significant positive correlations from around , with an increase in significance until around , when significance starts to fluctuate for the next month. This also shows a relationship between BTC volume and the number of posts created by users; when one of the two variables increases or decreases, the other tends to follow in the same direction.
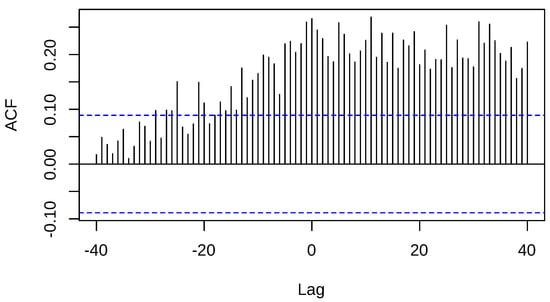
Figure 7.
Autocorrelation between BTC volume and number of popular posts.
As examples of the relationship between the two variables, Figure 8 shows the number of popular posts on the r/cryptocurrency subreddit created in a day against the BTC volume of the next day (Pearson’s ) and Figure 9 shows the BTC volume against the number of popular posts the next day (Pearson’s ). The two figures look very similar in this case too. At the same time, the relationship is also not perfect but shows that a tendency in the data exists.
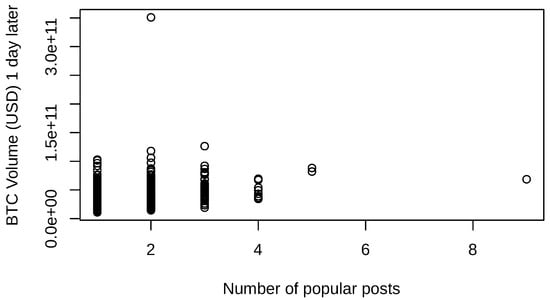
Figure 8.
Number of popular posts vs. BTC volume 1 day later.
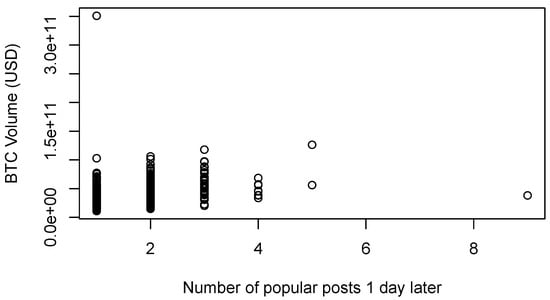
Figure 9.
BTC volume vs. number of popular posts 1 day later.
4.3. R/cryptocurrency Comments
The number of comments made in the r/cryptocurrency subreddit from January 2021 to December 2022, is shown in Figure 10. This shows that there was an increase in activity during 2021, when the BTC price was high, while also showing lower activity during 2022, when BTC’s price steadily declined throughout the year.
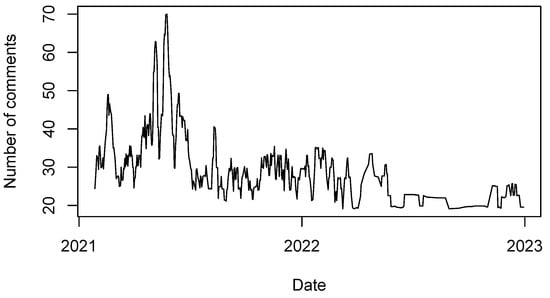
Figure 10.
Number of collected r/cryptocurrency comments by date.
Descriptive statistics for the length of the comments in characters is shown in Table 2. This shows that most comments are short, up to one paragraph, while there are some comments that are very extensive.
Table 2.
Descriptive statistics for comment length in characters.
Correlations with BTC Market Data
Figure 11 presents an autocorrelation plot depicting the relationship between the BTC closing price and the number of comments made on posts in the r/cryptocurrency subreddit. The plot shows the correlation between these two variables across various time lags, both positive and negative. The autocorrelation plot reveals a notable positive correlation that begins to emerge at approximately days. This indicates that an increase in the number of comments made on the subreddit is positively correlated with changes in the BTC closing price that occur approximately 20 days later. In other words, heightened commenting activity tends to precede movements in the BTC price. As the lag value increases, the correlation becomes more significant. This trend suggests that price changes in Bitcoin also act as an early indicator of increased commenting activity in the subreddit.
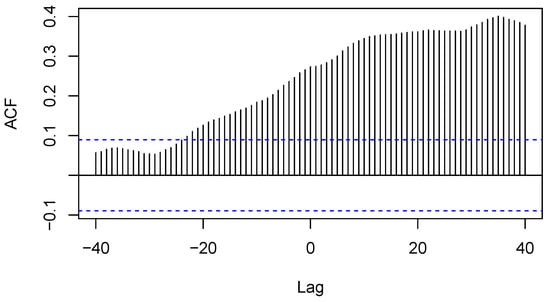
Figure 11.
Autocorrelation between BTC closing price and number of comments.
Figure 12 presents a scatterplot illustrating the relationship between the number of comments made on posts in the r/cryptocurrency subreddit and the BTC closing price 1 day later. The correlation is statistically significant (Pearson’s ). Figure 13 shows the relationship between BTC closing price and the number of comments posted 20 days later. The correlation is statistically significant in this case too (Pearson’s ). While in both cases a positive association between the two variables is shown, this is more pronounced in the case of predicting the number of comments 20 days later, based on the BTC closing price.
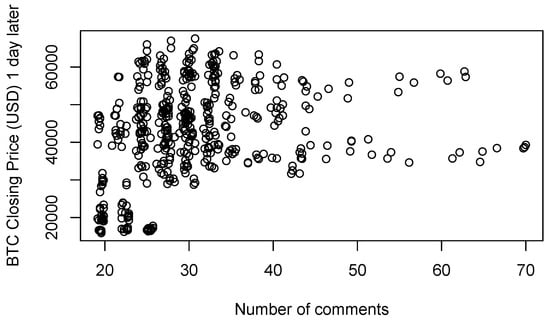
Figure 12.
Number of comments vs. BTC closing price 1 day later.
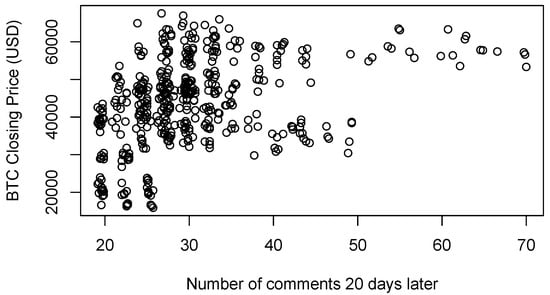
Figure 13.
BTC closing price vs. number of comments 20 days later.
Figure 14 presents an autocorrelation plot depicting the relationship between BTC trading volume and the number of comments made on posts in the r/cryptocurrency subreddit. The plot shows the correlation between these two variables across various time lags, both positive and negative.
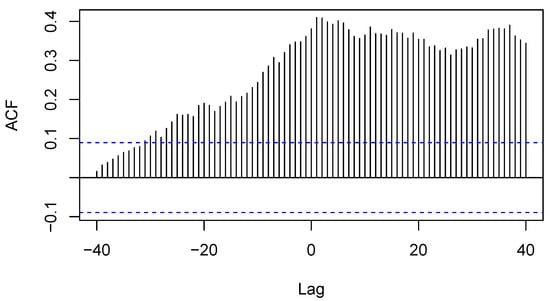
Figure 14.
Autocorrelation between BTC volume and number of comments.
The autocorrelation plot reveals significant positive correlations starting at approximately lag = −25 days. This indicates that increases in the number of comments on the subreddit are positively correlated with changes in the BTC trading volume that occur around 25 days later. Conversely, when the number of comments decreases, the BTC volume tends to decrease during the following days as well. As the lag value increases, the significance of the correlation increases, peaking at around lag = 1 day. This trend suggests that the commenting activity on the subreddit may be a precursor to changes in BTC trading volume. However, the most pronounced effects are observed in the opposite direction, where the number of comments increases a few days after BTC volume increases.
Figure 15 presents a scatter plot illustrating the relationship between the number of comments made on posts in the r/cryptocurrency subreddit and BTC trading volume one day later. The scatter plot reveals a positive correlation between the number of comments and BTC trading volume one day later (Pearson’s ). This relationship suggests that days with higher commenting activity on the subreddit are associated with increased Bitcoin trading volume the next day. Figure 16 shows a similar scatterplot with the relationship between the BTC trading volume and the number of comments made one day later. This correlation is also significant (Pearson’s ). Both scatterplots highlight a notable outlier. This outlier is caused by the exceptionally high BTC trading volume that occurred on 26 February 2021. Bitcoin experienced significant price volatility during this time. After reaching an all-time high of over USD 58,000 earlier in February, the price of Bitcoin dropped to around USD 45,000 by 26 February. This was part of a broader correction affecting the entire cryptocurrency market.
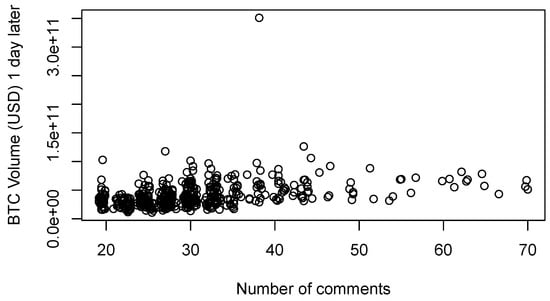
Figure 15.
Number of comments vs. BTC volume 1 day later.
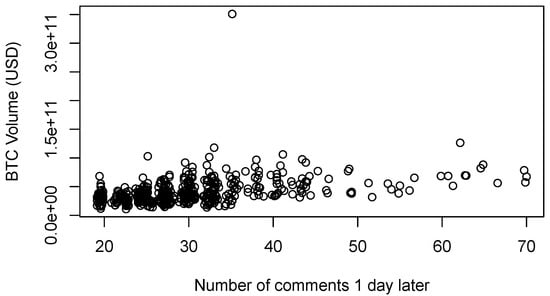
Figure 16.
BTC volume vs. number of comments 1 day later.
4.4. Sentiment Analysis
We then performed a sentiment analysis on all comments. The results of this analysis are shown below.
Figure 17 presents a bar plot illustrating the distribution of sentiment in comments made on posts in the r/cryptocurrency subreddit. The sentiment analysis categorizes comments into three distinct groups: negative, neutral, and positive sentiments.
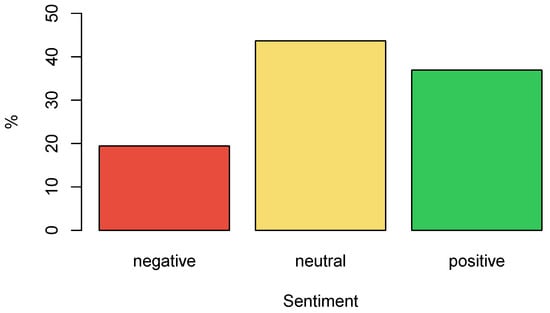
Figure 17.
Sentiment distribution in comments.
The bar plot shows that the largest proportion of comments are neutral, accounting for 43.65% of the total comments. Neutral comments likely include factual information, questions, and statements that do not convey strong emotional content or opinions. This predominance of neutral sentiment suggests that a significant portion of the community engages in discussions that are informational or inquisitive in nature.
Positive comments make up the second largest category, representing 36.9% of the total. These comments likely express optimism, agreement, enthusiasm, or other positive sentiments about the topics being discussed. The high proportion of positive sentiment indicates a generally favorable or hopeful attitude within the community towards the subjects of their discussions, which could include market trends, technological developments, or other relevant news.
Negative comments comprise 19.3% of the total, indicating that a smaller, yet substantial, portion of the community expresses criticism, disagreement, concern, or other negative sentiments. This segment reflects the presence of skepticism or dissatisfaction within the community, which could be in response to unfavorable market conditions, regulatory news, or other challenges facing the cryptocurrency space.
Overall, the sentiment analysis underscores the diverse range of opinions and attitudes within the r/cryptocurrency subreddit. Monitoring sentiment trends over time can provide valuable insights into shifts in community mood and potential impacts on market behavior.
Figure 18 presents a time-series plot showing the distribution of sentiment in comments made on the r/cryptocurrency subreddit from 1 January 2021 to 31 December 2022. The plot illustrates how the proportions of positive, neutral, and negative comments changed over this two-year period. The time-series plot reveals distinct trends in the sentiment of comments corresponding with Bitcoin’s market performance.
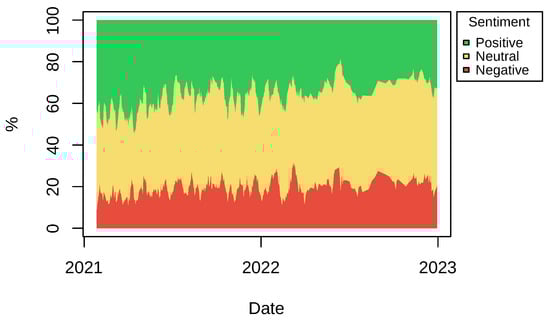
Figure 18.
Sentiment distribution in comments through time.
Throughout 2021, positive comments were more prevalent, reflecting the generally bullish sentiment in the cryptocurrency market during this period. As Bitcoin’s price surged to new highs, optimism and enthusiasm within the community were high, leading to a greater number of positive comments. However, in 2022, the number of positive comments declined notably. This decrease coincides with the downturn in Bitcoin’s price, suggesting that the market’s bearish trend negatively impacted community sentiment.
On the other hand, negative comments increased slightly in 2022 compared to 2021. This uptick in negative sentiment aligns with the declining market conditions and the reduced price of Bitcoin. As challenges in the cryptocurrency market emerged, including regulatory issues and market crashes, the community’s sentiment shifted towards a more critical and concerned tone.
The proportion of neutral comments increased slightly over the time period, indicating a growing level of factual or unemotional discussions within the subreddit. This slight increase suggests that as the market conditions fluctuated, more community members focused on information sharing and analysis, providing a balanced perspective amid the prevailing positive and negative sentiments.
Correlations with BTC Market Data
Figure 19 presents an autocorrelation plot depicting the relationship between the BTC closing price and the percentage of positive comments made on posts in the r/cryptocurrency subreddit. The autocorrelation plot reveals a significant positive correlation that spans a wide range of lags. The correlation is particularly notable at lag = −1 day, where it peaks, indicating the strongest relationship between the two variables. This implies that an increase in the percentage of positive comments tends to be followed by a higher BTC closing price the next day, highlighting a near-immediate impact of community sentiment on market performance. The significance of the correlation over a broad range of lags (from −40 to 40 days) indicates a sustained relationship between market performance and community sentiment. This extended period of significant correlation suggests that the community’s positive sentiment is both influenced by and influential on Bitcoin’s price over a longer timeframe.
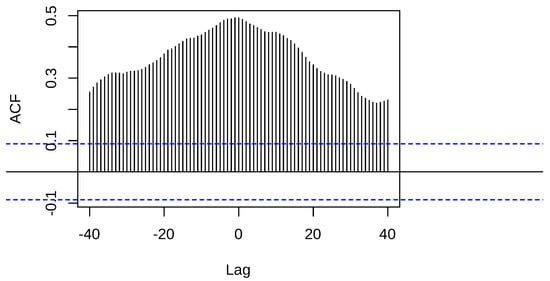
Figure 19.
Autocorrelation between BTC closing price and percentage of positive comments.
Figure 20 and Figure 21 present scatter plots illustrating the relationship between the BTC closing price and the percentage of positive comments made on posts in the r/cryptocurrency subreddit at lag = −1 and lag = 1, respectively.
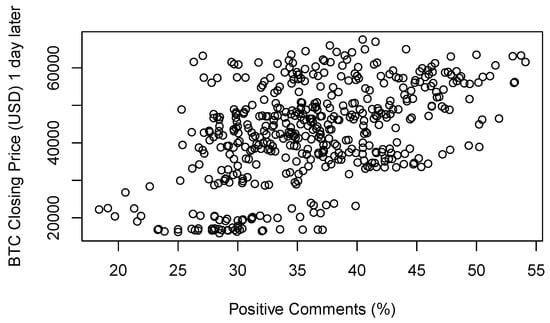
Figure 20.
Percentage of positive comments vs. BTC closing price 1 day later.
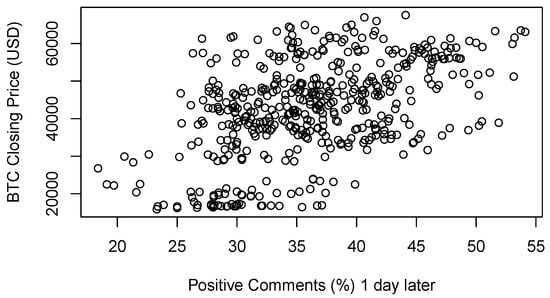
Figure 21.
BTC closing price vs. percentage of positive comments 1 day later.
The scatter plot in Figure 20 shows a positive correlation between the BTC closing price and the percentage of positive comments one day prior (Pearson’s ). This suggests that higher percentages of positive comments are associated with higher BTC closing prices the following day. This pattern highlights the predictive power of positive sentiment within the subreddit, where increased optimism and positive discussions often precede a rise in Bitcoin’s market price.
The scatter plot in Figure 21 shows a positive correlation between the BTC closing price and the percentage of positive comments one day later (Pearson’s ). This suggests that higher BTC closing prices are associated with a greater percentage of positive comments the next day. This relationship indicates that not only does positive sentiment predict higher market prices, but strong market performance also tends to enhance positive community sentiment, creating a feedback loop where market performance and sentiment mutually reinforce each other.
We also performed similar autocorrelations between the BTC closing price and the percentage of neutral (Figure 22) and negative comments (Figure 23). The autocorrelations showed significant correlations in both cases. The correlations in Figure 22 peak at (Pearson’s ), while those in Figure 23 peak at (Pearson’s ). While both neutral and negative sentiments show significant negative correlations with Bitcoin’s price, the correlations are more pronounced when using the percentage of positive comments. This highlights the stronger influence of positive sentiment on Bitcoin’s market performance compared to neutral or negative sentiments. Positive sentiment tends to have a more immediate and robust impact on driving the price up, whereas neutral and negative sentiments are associated with subsequent declines in the price.
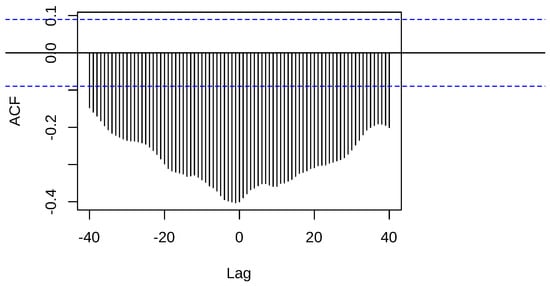
Figure 22.
Autocorrelation between BTC closing price and percentage of neutral comments.
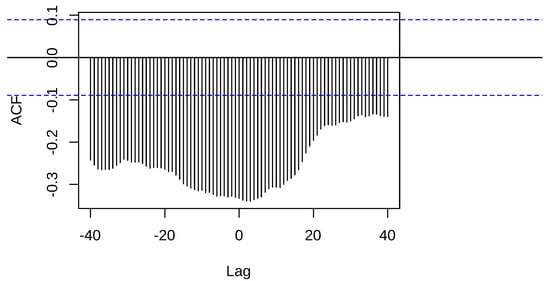
Figure 23.
Autocorrelation between BTC closing price and percentage of negative comments.
To investigate the relationship between BTC volume and the sentiment of user comments in the r/cryptocurrency subreddit, we performed the autocorrelations shown in Figure 24, Figure 25 and Figure 26. These show the autocorrelations between BTC volume and positive comments, neutral comments, and negative comments, respectively.
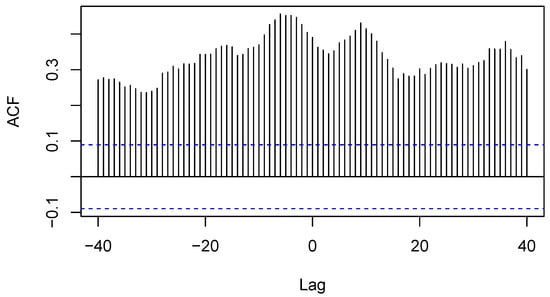
Figure 24.
Autocorrelation between BTC volume and percentage of positive comments.
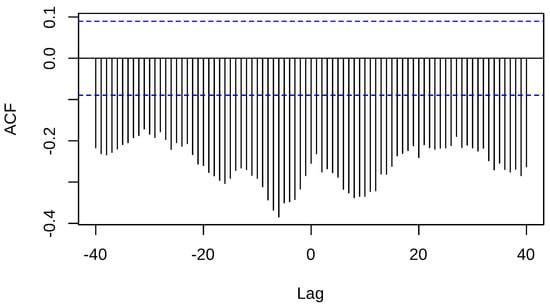
Figure 25.
Autocorrelation between BTC volume and percentage of neutral comments.
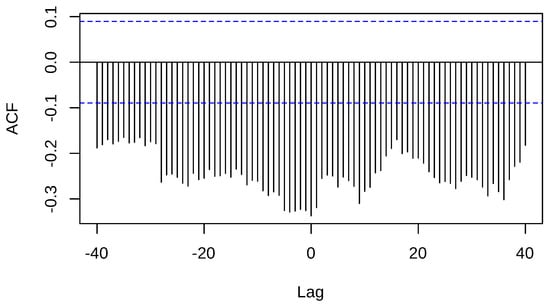
Figure 26.
Autocorrelation between BTC volume and percentage of negative comments.
As with the case of the autocorrelations between BTC price and sentiment, BTC volume exhibits a significant positive correlation with the percentage of positive comments, which peak at (Pearson’s ). It also shows significant negative correlations with the percentage of neutral comments, which peak at (Pearson’s ) as well as with the percentage of negative comments, which peak at (Pearson’s ). The correlations for neutral and negative comments with BTC volume are very similar, although they are slightly more pronounced when using neutral comments. Overall, the correlations are more pronounced when correlating BTC volume with the percentage of positive comments.
Figure 27 and Figure 28 present scatterplots illustrating the correlations between BTC trading volume and the percentage of positive comments made on the r/cryptocurrency subreddit at different time lags. Figure 27 shows the relationship between BTC trading volume and the percentage of positive comments made six days earlier (Pearson’s ). This lagged effect implies that positive sentiment in the community can be a leading indicator of future trading activity. Figure 28 shows the relationship between BTC trading volume and the percentage of positive comments made six days later (Pearson’s ). This indicates that significant trading activity can subsequently influence community sentiment, leading to increased positivity. In both figures, a notable outlier is present. This is caused by the same unusually high BTC trading volume that occurred on 26 February 2021 that is also shown in Figure 15 and Figure 16.
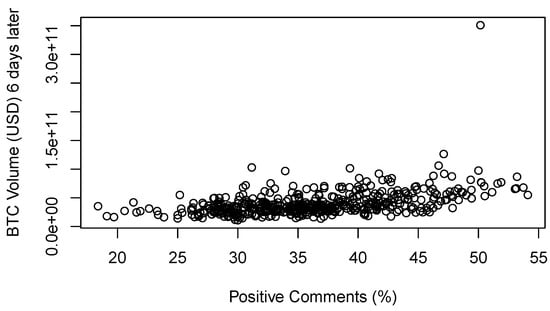
Figure 27.
Percentage of positive comments vs. BTC volume 6 days later.
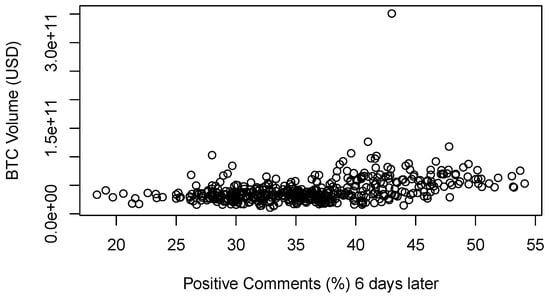
Figure 28.
BTC volume vs. percentage of positive comments 6 days later.
4.5. Topic Modeling
In order to effectively perform latent Dirichlet allocation (LDA) for topic modeling, it is essential to select the appropriate number of topics [28]. The choice of the number of topics significantly impacts the coherence and interpretability of the resulting topics. To determine the optimal number of topics, we employed several evaluation metrics and visualized the results through a perplexity plot and a combined metrics plot.
Figure 29 presents a perplexity plot, which is a common metric used to evaluate the performance of topic models. The plot shows a distinct knee at four topics, suggesting that this number provides a good balance between model complexity and generalization capability. The knee point in the perplexity curve is a strong indicator that increasing the number of topics beyond this point does not substantially improve the model’s performance.
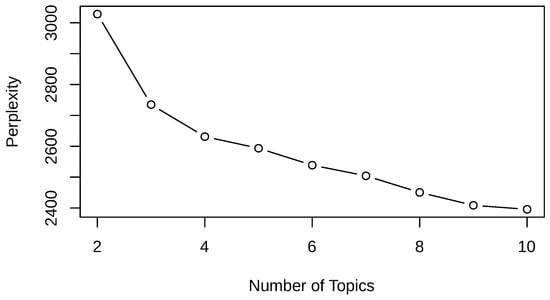
Figure 29.
LDA perplexity scores vs. number of topics.
Figure 30 illustrates the results of the CaoJuan2009, Arun2010, Griffiths2004, and Deveaud2014 metrics. All four metrics indicate that four topics provide a good compromise, balancing the need for distinct, coherent topics with the overall model performance. Therefore, by choosing four topics, we ensure that the model achieves a good balance between complexity and interpretability, facilitating meaningful analysis and interpretation of the subreddit comments.
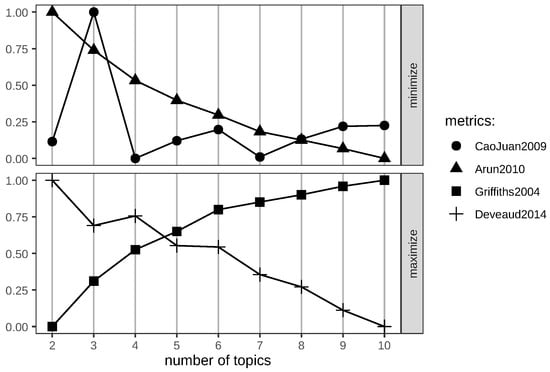
Figure 30.
LDA metrics vs. number of topics.
Figure 31 presents a plot illustrating the beta values for the top ten terms in each of the four topics identified through latent Dirichlet allocation (LDA) modeling. The beta value, also known as the term-topic probability, indicates the probability of a term belonging to a specific topic. Higher beta values suggest a stronger association between the term and the topic.
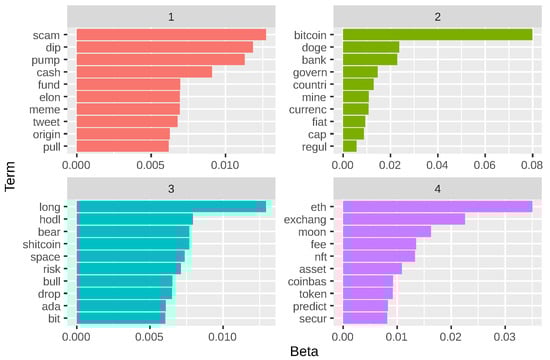
Figure 31.
Top ten terms for each of the four LDA topics.
The first topic is characterized mainly by the “scam”, “dip”, “pump”, and “cash” terms. A detailed interpretation of each key term and their collective significance follows:
- scam: The presence of this term with the highest beta value indicates that discussions often involve concerns about fraudulent activities in the cryptocurrency market. This term suggests that the community is vigilant about identifying and discussing potential scams.
- dip: This term refers to a temporary decline in cryptocurrency prices. Its prominence suggests that community members frequently discuss price fluctuations and strategies for navigating market downturns.
- pump: The term “pump” is associated with rapid increases in asset prices, often as a result of coordinated efforts. Discussions around “pump” suggest a focus on market manipulation tactics and their impacts.
- cash: This term could refer to liquid assets or fiat currency in the context of cryptocurrency trading. Its inclusion indicates discussions about liquidity, cashing out, or converting crypto to cash.
- fund: This term suggests topics related to investment funds, funding sources, or financial backing within the cryptocurrency space. It highlights conversations about financial strategies and investment opportunities.
- elon: The presence of Elon Musk’s first name suggests that his influence on the cryptocurrency market, especially through tweets and public statements, is a significant topic of discussion.
- meme: The term “meme” indicates the role of internet culture and humor in cryptocurrency discussions. Memes often reflect market sentiment and can influence trading behavior.
- tweet: This term reinforces the influence of social media, particularly Twitter, on market movements. Tweets from influential figures can drive significant changes in market dynamics.
- origin: This term may refer to the origin or beginnings of certain cryptocurrencies, projects, or movements within the market. It suggests historical discussions and tracing the roots of market trends.
- pull: This term could refer to “rug pulls”, a type of scam where developers abandon a project and take investors’ funds, or to pulling out investments. Its inclusion highlights concerns about exit strategies and potential scams.
Topic 1 appears to encapsulate the themes of market manipulation, significant market events, and the influence of key figures and social media on the cryptocurrency market. The terms suggest that the community is highly engaged in discussions about the risks, strategies, and impacts of influential personalities and market tactics. This topic highlights the interplay between social media, market sentiment, and the strategies employed by community members to navigate the volatile cryptocurrency landscape.
The most dominant term in the second topic is “bitcoin”, with others having a smaller influence. A detailed interpretation of each key term and their collective significance follows:
- bitcoin: As the dominant term with the highest beta value, “bitcoin” indicates that a significant portion of the discussion focuses on Bitcoin, the most well-known and widely discussed cryptocurrency.
- doge: The inclusion of “doge” (referring to Dogecoin) suggests that another popular cryptocurrency is a frequent topic of conversation. Dogecoin’s meme origins and its community-driven popularity often make it a subject of interest.
- bank: This term points to discussions about the role of traditional banking institutions in the cryptocurrency space. It may involve topics like banks’ interactions with cryptocurrencies, the impact of crypto on banking, or the adoption of blockchain technology by banks.
- govern: The presence of this term indicates discussions about government policies, actions, and involvement in the cryptocurrency market. This could include regulatory frameworks, government-backed cryptocurrencies, or geopolitical influences.
- countri: This term suggests that discussions often focus on how different countries are approaching cryptocurrencies. Topics may include national regulations, adoption rates, and international differences in crypto policies.
- mine: The term “mine” refers to cryptocurrency mining, the process of validating transactions and generating new coins. Discussions may cover mining technologies, environmental impacts, profitability, and geographical distribution of mining operations.
- currenc: This term likely represents “currency”, highlighting the broader discussion about cryptocurrencies as a form of digital money. This includes debates on their viability as currency, comparison with fiat currencies, and their role in the financial system.
- flat: This term is likely a misspelling or abbreviation of “fiat”, referring to traditional government-issued currencies. Discussions might compare fiat currencies to cryptocurrencies, covering topics like stability, value, and adoption.
- cap: The term “cap” likely refers to market capitalization, a common metric used to assess the value of cryptocurrencies. Discussions may involve the market cap rankings of different cryptocurrencies, trends, and their implications.
- regul: Short for “regulation”, this term signifies discussions about the regulatory environment surrounding cryptocurrencies. This includes laws, compliance requirements, regulatory challenges, and their impact on the market.
Topic 2 appears to encapsulate themes related to major cryptocurrencies, institutional and governmental involvement, and regulatory issues. The prominent presence of “bitcoin” and “doge” suggests a focus on popular cryptocurrencies, while terms like “bank”, “govern”, and “regul” highlight the interaction between cryptocurrencies and traditional institutions.
This topic indicates that the community is deeply engaged in understanding the implications of government policies, regulatory frameworks, and the role of traditional financial institutions in the evolving cryptocurrency landscape. Discussions often revolve around the comparison between cryptocurrencies and fiat currencies, the environmental and economic impact of mining, and the influence of market capitalization on investment strategies.
In topic 3, the terms suggest that it revolves around investment strategies, market sentiment, and specific cryptocurrencies. A detailed interpretation of each key term and their collective significance follows:
- long: The term “long” refers to a long-term investment strategy, indicating discussions about holding assets over an extended period to realize gains. This term suggests that a significant portion of the community engages in or discusses long-term investment approaches.
- hodl: “Hodl” is a popular term in the cryptocurrency community, derived from a misspelling of “hold.” It represents the strategy of holding onto cryptocurrency investments regardless of market volatility. Its presence indicates strong discussions around the hodling philosophy.
- bear: This term refers to a bear market, characterized by declining prices. The inclusion of “bear” suggests that the community frequently discusses market downturns and strategies for navigating bearish conditions.
- shitcoin: A derogatory term used to describe cryptocurrencies with little to no value or potential. The presence of this term suggests that community members are critical and discerning about the quality and viability of various cryptocurrencies.
- space: This term likely refers to the broader cryptocurrency ecosystem or market space. Discussions around “space” may include market trends, developments, and the overall state of the cryptocurrency industry.
- risk: The term “risk” highlights discussions about the inherent risks associated with cryptocurrency investments. Topics may include risk management strategies, volatility, and the factors contributing to investment risk.
- bull: In contrast to “bear”, the term “bull” refers to a bull market, characterized by rising prices. Discussions involving “bull” suggest that the community also focuses on bullish conditions and strategies for capitalizing on upward market trends.
- drop: This term indicates price drops or market corrections. Its presence suggests that community members frequently discuss sudden declines in cryptocurrency prices and their implications.
- ada: This term likely refers to Cardano’s cryptocurrency (ADA). The inclusion of “ada” indicates that specific cryptocurrencies, particularly Cardano, are a significant topic of discussion within this theme.
- bit: Likely referring to Bitcoin or bits as a unit of Bitcoin. The term “bit” suggests discussions about Bitcoin in general or its fractional units.
Topic 3 appears to encapsulate themes related to investment strategies, market sentiment, and specific cryptocurrencies. The emphasis on terms like “long” and “hodl” suggests a strong focus on long-term investment philosophies within the community. The presence of “bear” and “bull” indicates discussions about market conditions and strategies for both bearish and bullish trends. The term “shitcoin” highlights a critical view of less valuable cryptocurrencies, while “risk” points to an awareness of the volatility and uncertainty inherent in the cryptocurrency market. The inclusion of specific cryptocurrencies like “ada” indicates that certain digital assets are particularly prominent in discussions.
In topic 4, the most common term is “eth”, followed by “exchang” and “moon”. A detailed interpretation of each key term and their collective significance follows:
- eth: The term “eth” (Ethereum) has the highest beta value, indicating that discussions frequently involve Ethereum. This suggests a significant focus on one of the most prominent and influential cryptocurrencies in the market.
- exchang: This term likely refers to cryptocurrency exchanges, platforms where users can trade cryptocurrencies. The prominence of this term suggests extensive discussions about exchange-related topics, such as trading strategies, exchange reviews, and transaction experiences.
- moon: In the cryptocurrency community, “moon” refers to significant price increases. Discussions involving “moon” suggest that community members are interested in and hopeful for substantial price surges and investment returns.
- fee: The term “fee” indicates discussions about transaction costs associated with trading or transferring cryptocurrencies. This can include exchange fees, gas fees on Ethereum, and other costs that impact traders and investors.
- nft: Non-fungible tokens (NFTs) are unique digital assets representing ownership of specific items or content. The presence of “nft” suggests that the community is actively discussing this burgeoning sector within the cryptocurrency space.
- asset: The term “asset” points to discussions about cryptocurrencies as financial assets. Topics might include asset management, valuation, and the role of different cryptocurrencies in investment portfolios.
- coinbas: Likely referring to Coinbase, one of the largest and most popular cryptocurrency exchanges. This term indicates that discussions frequently involve Coinbase, its services, and user experiences.
- token: This term refers to various types of cryptocurrency tokens, which can represent assets, utility, or value within specific platforms. Discussions about tokens might cover new token offerings, token performance, and their utility within ecosystems.
- predict: The term “predict” suggests discussions about price predictions, market forecasts, and analytical methods used to anticipate future market movements.
- secur: Likely referring to “secure” or “security”, this term indicates discussions about the security of cryptocurrency assets, exchanges, and transactions. Topics might include best practices for securing assets, security breaches, and regulatory measures.
Topic 4 appears to encapsulate themes related to Ethereum, cryptocurrency exchanges, NFTs, and various aspects of trading and security. The emphasis on “eth” indicates that Ethereum is a central focus within this topic, reflecting its significant role in the cryptocurrency market and its extensive ecosystem.
The term “exchang” highlights the importance of trading platforms and user interactions with these exchanges. “Moon” and “predict” suggest a strong interest in market dynamics, price predictions, and the potential for substantial returns. The inclusion of “fee” points to concerns about transaction costs and their impact on trading activities.
The presence of “nft” signifies active discussions about non-fungible tokens, reflecting their growing popularity and influence. Terms like “asset” and “token” indicate broader discussions about the nature of cryptocurrencies as financial assets and their various applications.
Finally, “coinbas” and “secur” highlight the importance of major exchanges like Coinbase and the critical issue of security within the cryptocurrency space. These discussions are vital for understanding user experiences, investment strategies, and the measures needed to protect assets.
Figure 32 illustrates the distribution of comments among the four identified topics. The percentages represent the proportion of total comments assigned to each topic, offering insights into the relative prominence and engagement levels associated with each thematic area.
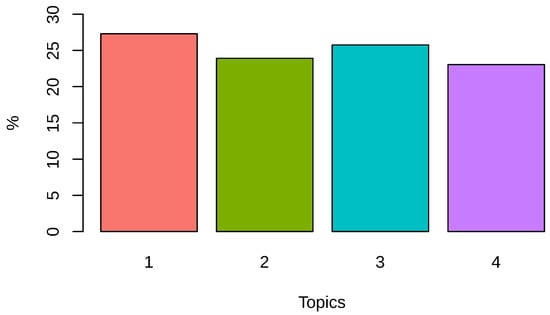
Figure 32.
Distribution of comments in each of the four LDA topics.
The distribution of comments across these four topics provides a comprehensive view of the community’s primary areas of interest and concern. The relatively even distribution, with topic 1 slightly leading, with 27.3% of the comments assigned to it, indicates a balanced engagement across various critical aspects of the cryptocurrency market. This distribution highlights the multifaceted nature of cryptocurrency discussions, covering market dynamics, investment strategies, regulatory issues, and technological innovations.
Figure 33 illustrates how the distribution of comments across the four identified topics changed over time from January 2021 to December 2022. This temporal analysis highlights the dynamic nature of discussions within the cryptocurrency community and their responsiveness to significant market events.
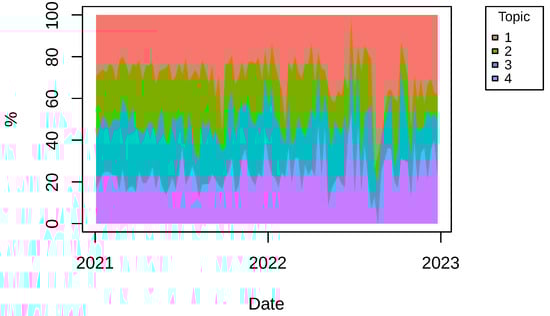
Figure 33.
Distribution of documents in each of the four LDA topics by date.
We can observe that there is a noticeable spike in topic 1 during July 2021. This period coincides with the significant dip in Bitcoin’s price. The increase in discussions related to market manipulation, significant market events, and influential personalities reflects heightened community concern and interest during this volatile period. Concurrently, there is a sharp decline in topic 2, which covers major cryptocurrencies, institutional involvement, and regulatory issues. The drop in comments suggests a temporary shift in focus away from regulatory and institutional topics towards immediate market reactions and individual market events. Topic 3, focusing on investment strategies and market sentiment, also shows a decline. This suggests that during periods of significant market downturns, discussions shift more towards immediate market impacts and less on long-term strategies and sentiments.
During the summer of 2022, particularly around June, topic 1 experiences a dramatic increase, accounting for more than 70% of comments. This period coincides with another significant dip in Bitcoin’s price. The overwhelming focus on topic 1 indicates intense community engagement with discussions about market manipulation, crashes, and key influencers during this period of poor market performance. All other topics see a significant reduction in comments. The decrease in topic 2 (major cryptocurrencies and regulatory issues) and topic 4 (Ethereum, exchanges, NFTs, and security) suggests that during periods of significant market stress, the community’s attention is heavily drawn towards the immediate implications of market crashes and less towards regulatory, institutional, and technical discussions. While topic 3 generally sees fluctuations, it tends to decrease during significant market downturns (July 2021 and June 2022), indicating a shift away from long-term investment discussions during these periods.
5. Discussion and Conclusions
In this section, we discuss the results of our analysis and their implications, relating our findings to previous studies and our working hypotheses. We also highlight potential directions for future research.
Our analysis revealed significant correlations between Bitcoin market dynamics and user activity on the r/cryptocurrency subreddit. More specifically, we found that there is a positive correlation between Bitcoin’s closing price and the number of comments made in the subreddit, with the correlation becoming more significant as the lag increases. This suggests that user discussions on Reddit are likely reacting to changes in Bitcoin prices, which supports our hypothesis that social media activity follows market trends. Similar findings were observed in previous studies, such as those by Mai et al. [37] and Wang and Vergne [38].
The autocorrelation analysis showed significant correlations between Bitcoin trading volume and the number of comments, indicating that increased trading volume might drive subsequent discussions on Reddit, aligning with the observations made by Hutto et al. [39] and Ba et al. [40].
The sentiment analysis of Reddit comments revealed that the majority are neutral or positive, with a noticeable shift towards negative sentiment during periods of market decline, such as the dips in July 2021 and June 2022. This aligns with previous research indicating that market downturns often lead to increased negative sentiment in social media discussions [41].
Our analysis indicates that positive comments on the r/cryptocurrency subreddit increase not only when Bitcoin prices rise but also in the period leading up to price increases. This suggests that user sentiment on social media could be a predictive indicator for future price movements. While the correlation is not absolute, the presence of positive discussions could signal upcoming market trends. This finding aligns with previous research demonstrating that social media activity can influence future Bitcoin prices. For instance, Mai et al. [37] found that social media sentiment has a significant impact on Bitcoin value, supporting the notion that user activity on platforms like Reddit can provide valuable predictive insights. Additionally, Wołk [42] showed that Twitter sentiment could predict Bitcoin returns, further supporting the potential for social media activity to serve as a market predictor.
Our topic modeling using LDA identified four main topics discussed in the subreddit, with distinct temporal patterns. For instance, the increase in discussions related to scams, dips, and pumps (topic 1) during periods of market decline highlights the community’s focus on market anomalies and fraudulent activities during bearish trends. This finding supports our hypothesis that specific market events trigger focused discussions on related topics, aligning with similar findings [43].
The findings of this study have several important implications. The correlation between social media activity and Bitcoin market dynamics suggests that monitoring Reddit discussions could be a valuable tool for predicting market trends. Traders and analysts could leverage sentiment and topic analysis to gain insights into future market movements. The high engagement and quick reaction times on the r/cryptocurrency subreddit underscore the influential role of online communities in shaping investor sentiment and behavior. This influence can amplify market trends, leading to more pronounced price and volume fluctuations. Finally, the prevalence of discussions about scams and market manipulation during market downturns highlights the need for increased regulatory oversight and investor protection measures in the cryptocurrency market.
While this study provides valuable insights, several areas warrant further investigation. Our study employs fundamental analytical techniques and future research could benefit from exploring the causal relationships between social media activity and market dynamics using more sophisticated econometric models. This could provide a deeper understanding of the directionality and underlying mechanisms of these interactions. For instance, Granger causality tests and vector autoregression (VAR) models could provide a more robust analysis of the directional relationships between social media activity and market dynamics. Future research could extend the analysis to a longer time frame to capture more market cycles and validate the observed patterns over different market conditions. Additionally, expanding the analysis to include other social media platforms such as Twitter, Facebook, and specialized cryptocurrency forums could provide a more comprehensive view of how social media influences cryptocurrency markets. Finally, employing more advanced sentiment analysis techniques, such as deep learning-based models, could improve the accuracy of sentiment detection and provide more nuanced insights into community sentiment.
In conclusion, our study highlights the significant interplay between Reddit discussions and Bitcoin market dynamics, providing a foundation for future research and practical applications in market analysis and prediction.
Author Contributions
Conceptualization, G.V.; methodology, G.V.; software, G.V.; validation, G.V.; formal analysis, G.V.; investigation, G.V.; resources, G.V.; data curation, G.V.; writing—original draft preparation, G.V.; writing—review and editing, G.V. and A.V.; visualization, G.V.; supervision, A.V.; project administration, A.V. All authors have read and agreed to the published version of the manuscript.
Funding
This research received no external funding.
Institutional Review Board Statement
Not applicable.
Informed Consent Statement
Not applicable.
Data Availability Statement
The original data presented in the study are openly available in Zenodo at https://zenodo.org/doi/10.5281/zenodo.12593439, accessed on 29 June 2024.
Conflicts of Interest
The authors declare no conflicts of interest.
Abbreviations
The following abbreviations are used in this manuscript:
| BTC | Bitcoin |
| LDA | Latent Dirichlet allocation |
| NFT | Non-fungible token |
| NLP | Natural language processing |
| NLTK | Natural Language Toolkit |
| PRAW | Python Reddit API Wrapper |
| VADER | Valence Aware Dictionary and sEntiment Reasoner |
References
- Nakamoto, S. Bitcoin: A Peer-to-Peer Electronic Cash System. Decentralized Bus. Rev. 2008. Available online: https://bitcoin.org/en/bitcoin-paper (accessed on 15 June 2024).
- Breidbach, C.F.; Tana, S. Betting on Bitcoin: How social collectives shape cryptocurrency markets. J. Bus. Res. 2021, 122, 311–320. [Google Scholar] [CrossRef]
- Kang, K.; Choo, J.; Kim, Y. Whose Opinion Matters? Analyzing Relationships Between Bitcoin Prices and User Groups in Online Community. Soc. Sci. Comput. Rev. 2020, 38, 686–702. [Google Scholar] [CrossRef]
- Oikonomopoulos, S.; Tzafilkou, K.; Karapiperis, D.; Verykios, V. Cryptocurrency Price Prediction using Social Media Sentiment Analysis. In Proceedings of the 2022 13th International Conference on Information, Intelligence, Systems & Applications (IISA), Corfu, Greece, 18–20 July 2022; pp. 1–8. [Google Scholar] [CrossRef]
- Tandon, C.; Revankar, S.; Palivela, H.; Parihar, S.S. How can we predict the impact of the social media messages on the value of cryptocurrency? Insights from big data analytics. Int. J. Inf. Manag. Data Insights 2021, 1, 100035. [Google Scholar] [CrossRef]
- Raheman, A.; Kolonin, A.; Fridkins, I.; Ansari, I.; Vishwas, M. Social Media Sentiment Analysis for Cryptocurrency Market Prediction. arXiv 2022, arXiv:2204.10185. [Google Scholar]
- Steinert, L.; Herff, C. Predicting altcoin returns using social media. PLoS ONE 2018, 13, e0208119. [Google Scholar] [CrossRef]
- Garg, S.; Panwar, D.S.; Gupta, A.; Katarya, R. A Literature Review On Sentiment Analysis Techniques Involving Social Media Platforms. In Proceedings of the 2020 Sixth International Conference on Parallel, Distributed and Grid Computing (PDGC), Waknaghat, India, 6–8 November 2020; pp. 254–259. [Google Scholar] [CrossRef]
- Loginova, E.; Tsang, W.K.; van Heijningen, G.; Kerkhove, L.P.; Benoit, D.F. Forecasting directional bitcoin price returns using aspect-based sentiment analysis on online text data. Mach. Learn. 2020, 113, 4761–4784. [Google Scholar] [CrossRef]
- Phillips, R.C.; Gorse, D. Mutual-Excitation of Cryptocurrency Market Returns and Social Media Topics. In Proceedings of the 4th International Conference on Frontiers of Educational Technologies, Moscow, Russia, 25–27 June 2018; ACM: New York, NY, USA, 2018; pp. 80–86. [Google Scholar] [CrossRef]
- Wooley, S.; Edmonds, A.; Bagavathi, A.; Krishnan, S. Extracting Cryptocurrency Price Movements from the Reddit Network Sentiment. In Proceedings of the 2019 18th IEEE International Conference on Machine Learning and Applications (ICMLA), Boca Raton, FL, USA, 16–19 December 2019; pp. 500–505. [Google Scholar] [CrossRef]
- Gurrib, I.; Kamalov, F. Predicting bitcoin price movements using sentiment analysis: A machine learning approach. Stud. Econ. Financ. 2022, 39, 347–364. [Google Scholar] [CrossRef]
- Kraaijeveld, O.; De Smedt, J. The predictive power of public Twitter sentiment for forecasting cryptocurrency prices. J. Int. Financ. Mark. Institutions Money 2020, 65, 101188. [Google Scholar] [CrossRef]
- Phillips, R.C.; Gorse, D. Predicting cryptocurrency price bubbles using social media data and epidemic modelling. In Proceedings of the 2017 IEEE Symposium Series on Computational Intelligence (SSCI), Honolulu, HI, USA, 27 November–1 December 2017; pp. 1–7. [Google Scholar] [CrossRef]
- Naeem, M.A.; Mbarki, I.; Shahzad, S.J.H. Predictive role of online investor sentiment for cryptocurrency market: Evidence from happiness and fears. Int. Rev. Econ. Financ. 2021, 73, 496–514. [Google Scholar] [CrossRef]
- Lamon, C.; Nielsen, E.; Redondo, E. Cryptocurrency price prediction using news and social media sentiment. SMU Data Sci. Rev. 2017, 1, 1–22. [Google Scholar]
- Pang, Y.; Sundararaj, G.; Ren, J. Cryptocurrency Price Prediction using Time Series and Social Sentiment Data. In Proceedings of the 6th IEEE/ACM International Conference on Big Data Computing, Applications and Technologies, Auckland, New Zealand, 2–5 December 2019; The Association for Computing Machinery: New York, NY, USA, 2019; pp. 35–41. [Google Scholar] [CrossRef]
- Narman, H.S.; Uulu, A.D. Impacts of Positive and Negative Comments of Social Media Users to Cryptocurrency. In Proceedings of the 2020 International Conference on Computing, Networking and Communications (ICNC), Big Island, HI, USA, 17–20 February 2020; pp. 187–192. [Google Scholar] [CrossRef]
- Agosto, A.; Cerchiello, P.; Pagnottoni, P. Sentiment, Google queries and explosivity in the cryptocurrency market. Phys. A Stat. Mech. Its Appl. 2022, 605, 128016. [Google Scholar] [CrossRef]
- Georgoula, I.; Pournarakis, D.; Bilanakos, C.; Sotiropoulos, D.; Giaglis, G.M. Using Time-Series and Sentiment Analysis to Detect the Determinants of Bitcoin Prices. 2015. Available online: https://papers.ssrn.com/sol3/papers.cfm?abstract_id=2607167 (accessed on 1 June 2024).
- CoinMarketCap. Available online: https://coinmarketcap.com/ (accessed on 15 June 2024).
- Murphy, J.J. Technical Analysis of the Financial Markets: A Comprehensive Guide to Trading Methods and Applications; New York Institute of Finance: New York, NY, USA, 1999. [Google Scholar]
- Reddit. Available online: https://reddit.com/ (accessed on 15 June 2024).
- PRAW: The Python Reddit API Wrapper. Available online: https://praw.readthedocs.io (accessed on 15 June 2024).
- Glenski, M.; Pennycuff, C.; Weninger, T. Consumers and Curators: Browsing and Voting Patterns on Reddit. IEEE Trans. Comput. Soc. Syst. 2017, 4, 196–206. [Google Scholar] [CrossRef]
- NLTK: Natural Language Toolkit. Available online: https://www.nltk.org/ (accessed on 15 June 2024).
- VADER: Valence Aware Dictionary and sEntiment Reasoner. Available online: https://vadersentiment.readthedocs.io/ (accessed on 15 June 2024).
- Blei, D.M.; Ng, A.Y.; Jordan, M.I. Latent dirichlet allocation. J. Mach. Learn. Res. 2003, 3, 993–1022. [Google Scholar]
- Nikita, M. ldatuning: Tuning of the Latent Dirichlet Allocation Models Parameters. 2020. R Package Version 1.0.2. Available online: https://CRAN.R-project.org/package=ldatuning (accessed on 12 June 2024).
- R Core Team. R: A Language and Environment for Statistical Computing; R Foundation for Statistical Computing: Vienna, Austria, 2023. [Google Scholar]
- Cao, J.; Xia, T.; Li, J.; Zhang, Y.; Tang, S. A density-based method for adaptive LDA model selection. Neurocomputing 2009, 72, 1775–1781. [Google Scholar] [CrossRef]
- Arun, R.; Suresh, V.; Veni Madhavan, C.E.; Narasimha Murthy, M.N. On Finding the Natural Number of Topics with Latent Dirichlet Allocation: Some Observations. Lect. Notes Comput. Sci. 2010, 6118, 391–402. [Google Scholar]
- Griffiths, T.L.; Steyvers, M. Finding scientific topics. Proc. Natl. Acad. Sci. USA 2004, 101, 5228–5235. [Google Scholar] [CrossRef]
- Deveaud, R.; SanJuan, E.; Bellot, P. Accurate and effective latent concept modeling for ad hoc information retrieval. Doc. Numer. 2014, 17, 61–84. [Google Scholar] [CrossRef]
- Box, G.E.; Jenkins, G.M.; Reinsel, G.C.; Ljung, G.M. Time Series Analysis: Forecasting and Control; John Wiley & Sons: Hoboken, NJ, USA, 2015. [Google Scholar]
- Hyndman, R.J.; Athanasopoulos, G. Forecasting: Principles and Practice, 2nd ed.; OTexts: Melbourne, VIC, Australia, 2018. [Google Scholar]
- Mai, F.; Shan, Z.; Bai, Q.; Wang, X.S.; Chiang, R.H. How Does Social Media Impact Bitcoin Value? A Test of the Silent Majority Hypothesis. J. Manag. Inf. Syst. 2018, 35, 19–52. [Google Scholar] [CrossRef]
- Wang, S.; Vergne, J.P. Buzz Factor or Innovation Potential: What Explains Cryptocurrencies’ Returns? PLoS ONE 2017, 12, e0177659. [Google Scholar] [CrossRef]
- Hutto, C.; Yardi, S.; Gilbert, E. A longitudinal study of follow predictors on twitter. In Proceedings of the SIGCHI Conference on Human Factors in Computing Systems, Paris, France, 27 April–2 May 2013; Association for Computing Machinery: New York, NY, USA, 2013; pp. 821–830. [Google Scholar] [CrossRef]
- Ba, C.T.; Zignani, M.; Gaito, S. The role of cryptocurrency in the dynamics of blockchain-based social networks: The case of Steemit. PLoS ONE 2022, 17, e267612. [Google Scholar] [CrossRef] [PubMed]
- Corbet, S.; Lucey, B.; Yarovaya, L. Datestamping the Bitcoin and Ethereum bubbles. Financ. Res. Lett. 2018, 26, 81–88. [Google Scholar] [CrossRef]
- Wołk, K. Advanced social media sentiment analysis for short-term cryptocurrency price prediction. Expert Syst. 2020, 37, e12493. [Google Scholar] [CrossRef]
- Linton, M.; Teo, E.G.S.; Bommes, E.; Chen, C.Y.; Härdle, W.K. Dynamic Topic Modelling for Cryptocurrency Community Forums. In Applied Quantitative Finance; Härdle, W.K., Chen, C.Y.H., Overbeck, L., Eds.; Springer: Berlin/Heidelberg, Germany, 2017; pp. 355–372. [Google Scholar] [CrossRef]
Disclaimer/Publisher’s Note: The statements, opinions and data contained in all publications are solely those of the individual author(s) and contributor(s) and not of MDPI and/or the editor(s). MDPI and/or the editor(s) disclaim responsibility for any injury to people or property resulting from any ideas, methods, instructions or products referred to in the content. |
© 2024 by the authors. Licensee MDPI, Basel, Switzerland. This article is an open access article distributed under the terms and conditions of the Creative Commons Attribution (CC BY) license (https://creativecommons.org/licenses/by/4.0/).