

Willingness to Use Algorithms Varies with Social Information on Weak vs. Strong Adoption: An Experimental Study on Algorithm Aversion


Abstract
1. Introduction
2. Literature Review and Hypothesis Development
3. Research Methods
3.1. Participants
3.2. Design
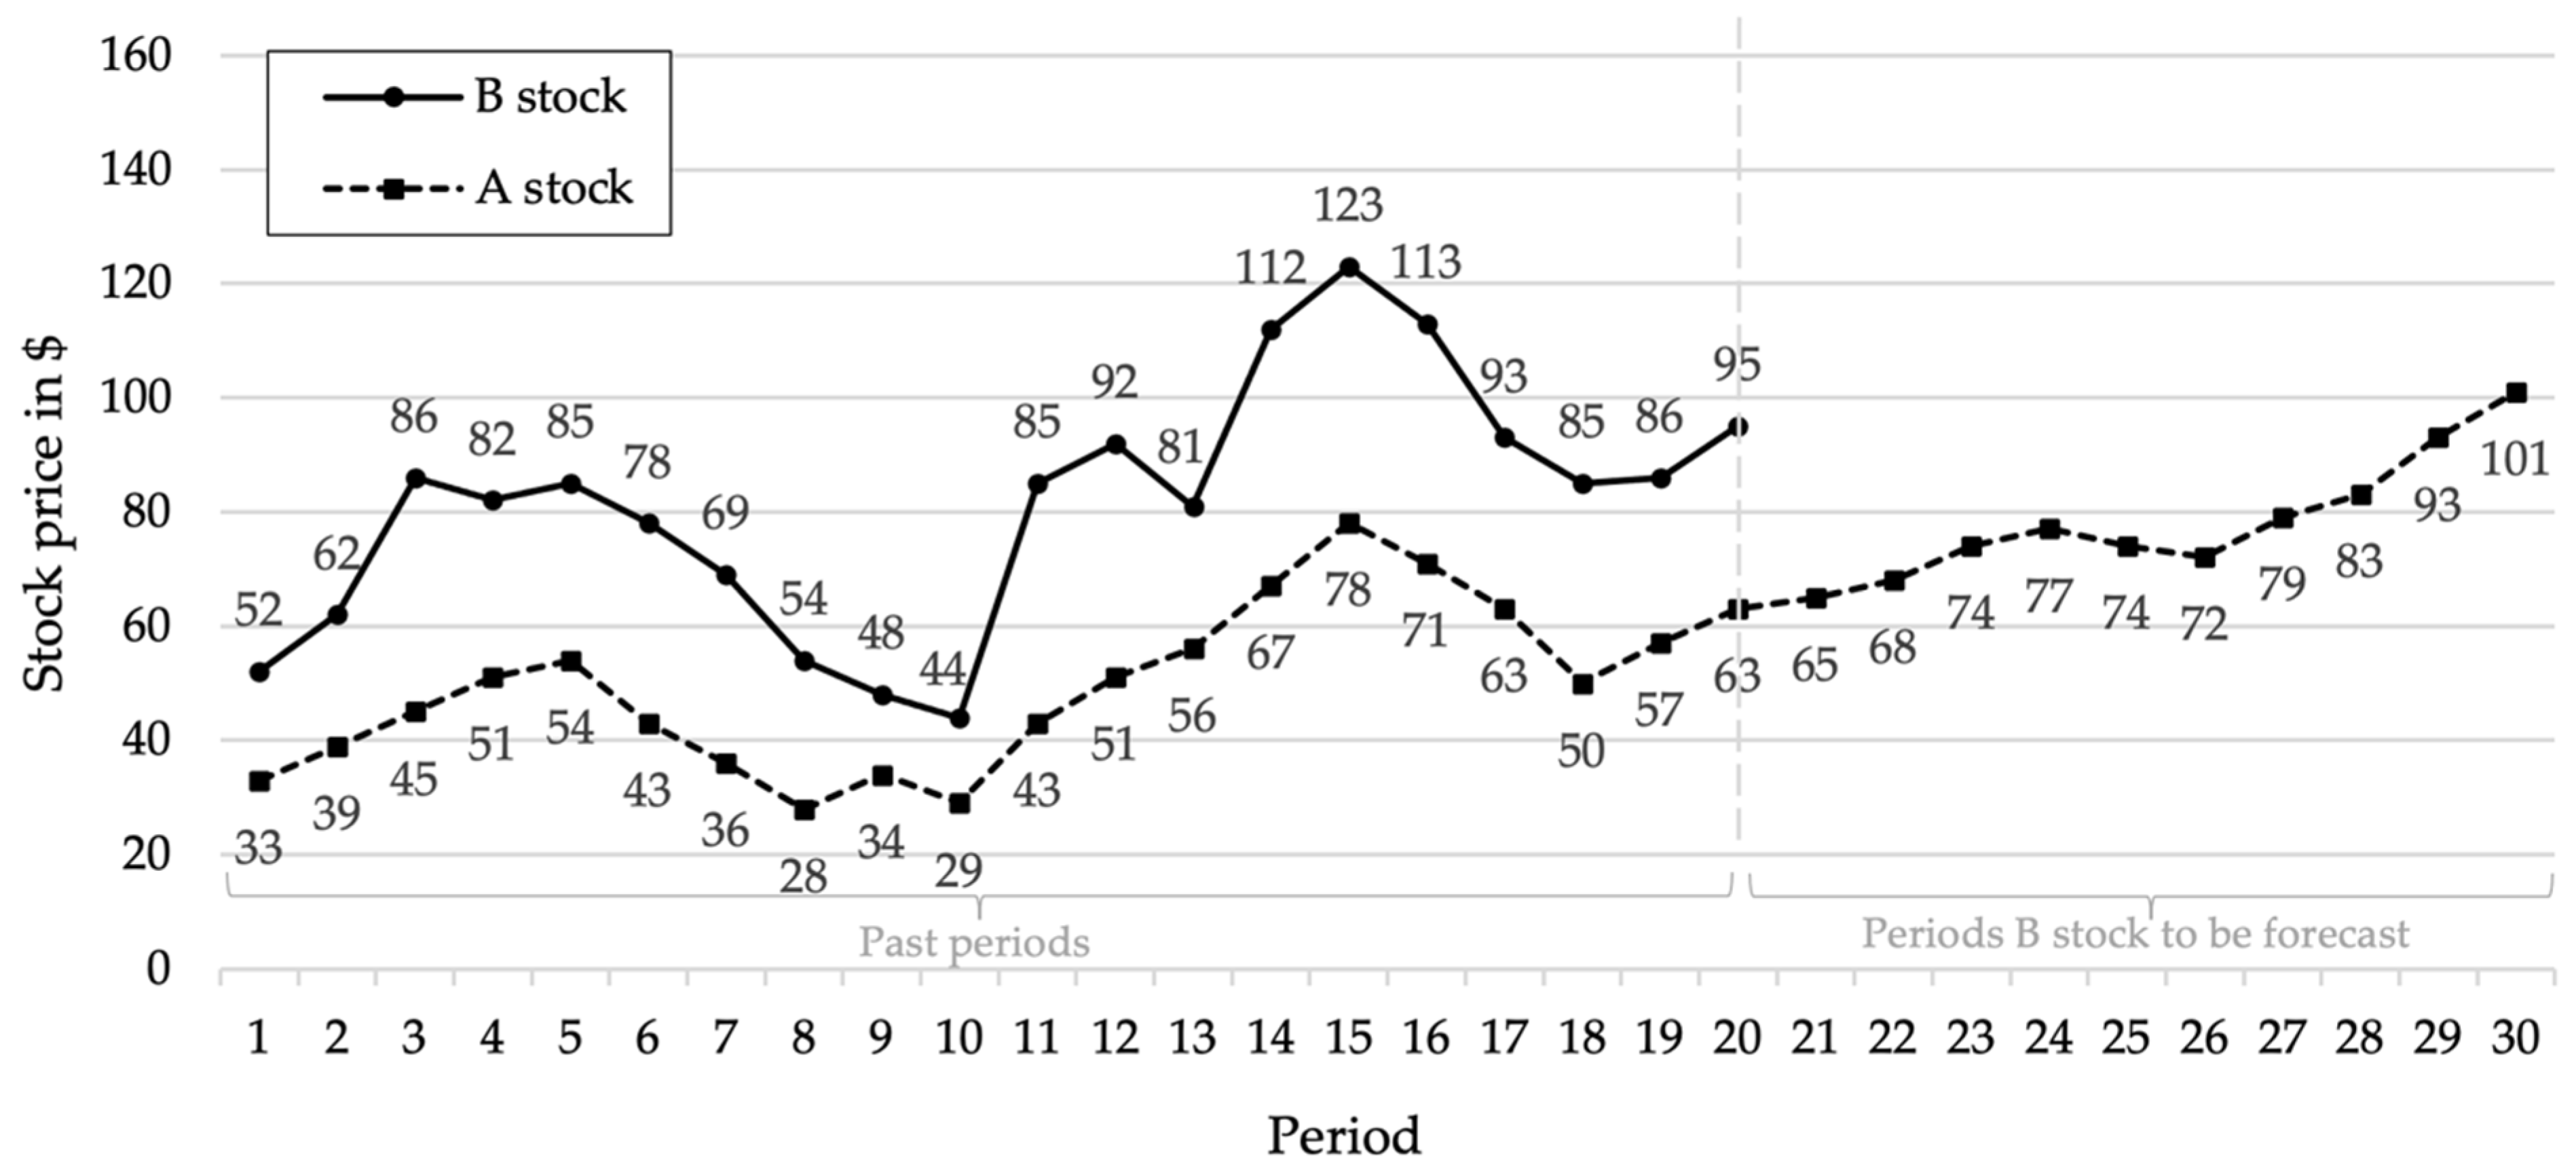
3.3. Procedure
4. Results
4.1. Forecast Accuracy
4.2. Willingness to Use the Algorithm
5. Discussion
6. Conclusions
Funding
Informed Consent Statement
Data Availability Statement
Acknowledgments
Conflicts of Interest
References
- Niszczota, P.; Kaszás, D. Robo-investment aversion. PLoS ONE 2020, 15, 0239277. [Google Scholar] [CrossRef] [PubMed]
- Méndez-Suárez, M.; García-Fernández, F.; Gallardo, F. Artificial Intelligence Modelling Framework for Financial Automated Advising in the Copper Market. J. Open Innov. Technol. Mark. Complex. 2019, 5, 81. [Google Scholar] [CrossRef]
- Ireland, L. Who errs? Algorithm aversion, the source of judicial error, and public support for self-help behaviors. J. Crime Justice 2019, 43, 174–192. [Google Scholar] [CrossRef]
- Simpson, B. Algorithms or advocacy: Does the legal profession have a future in a digital world? Inf. Commun. Technol. Law 2016, 25, 50–61. [Google Scholar] [CrossRef]
- Beck, A.; Sangoi, A.; Leung, S.; Marinelli, R.J.; Nielsen, T.; Vijver, M.J.; West, R.; Rijn, M.V.; Koller, D. Systematic Analysis of Breast Cancer Morphology Uncovers Stromal Features Associated with Survival. Sci. Transl. Med. 2011, 3, 108–113. [Google Scholar] [CrossRef] [PubMed]
- Ægisdóttir, S.; White, M.J.; Spengler, P.M.; Maugherman, A.S.; Anderson, L.A.; Cook, R.S.; Nichols, C.N.; Lampropoulos, G.; Walker, B.S.; Cohen, G.R.; et al. The Meta-Analysis of Clinical Judgment Project: Fifty-Six Years of Accumulated Research on Clinical versus Statistical Prediction. Couns. Psychol. 2006, 34, 341–382. [Google Scholar] [CrossRef]
- Grove, W.M.; Zald, D.H.; Lebow, B.S.; Snitz, B.E.; Nelson, C. Clinical versus mechanical prediction: A meta-analysis. Psychol. Assess. 2000, 12, 19–30. [Google Scholar] [CrossRef]
- Pérez-Toledano, M.; Rodriguez, F.J.; García-Rubio, J.; Ibáñez, S.J. Players’ selection for basketball teams, through Performance Index Rating, using multiobjective evolutionary algorithms. PLoS ONE 2019, 14, 0221258. [Google Scholar] [CrossRef]
- Mohler, G.O.; Short, M.B.; Malinowski, S.; Johnson, M.E.; Tita, G.E.; Bertozzi, A.; Brantingham, P.J. Randomized Controlled Field Trials of Predictive Policing. J. Am. Stat. Assoc. 2015, 110, 1399–1411. [Google Scholar] [CrossRef]
- Castelo, N.; Bos, M.W.; Lehmann, D.R. Task-dependent algorithm aversion. J. Mark. Res. 2019, 56, 809–825. [Google Scholar] [CrossRef]
- Youyou, W.; Kosinski, M.; Stillwell, D. Computer-based personality judgments are more accurate than those made by humans. Proc. Natl. Acad. Sci. USA 2015, 112, 1036–1040. [Google Scholar] [CrossRef] [PubMed]
- Dawes, R.M.; Faust, D.; Meehl, P.E. Clinical versus actuarial judgment. Science 1989, 243, 1668–1674. [Google Scholar] [CrossRef] [PubMed]
- Meehl, P.E. Clinical versus Statistical Prediction: A Theoretical Analysis and a Review of the Evidence; University of Minnesota: Minneapolis, MN, USA, 1954. [Google Scholar]
- Alvarado-Valencia, J.A.; Barrero, L.H. Reliance, trust and heuristics in judgmental forecasting. Comput. Hum. Behav. 2014, 36, 102–113. [Google Scholar] [CrossRef]
- Dietvorst, B.J.; Simmons, J.P.; Massey, C. Algorithm aversion: People erroneously avoid algorithms after seeing them err. J. Exp. Psychol. Gen. 2015, 144, 114–126. [Google Scholar] [CrossRef]
- Önkal, D.; Goodwin, P.; Thomson, M.E.; Gönül, S.; Pollock, A.C. The relative influence of advice from human experts and statistical methods on forecast adjustments. J. Behav. Decis. Mak. 2009, 22, 390–409. [Google Scholar] [CrossRef]
- Highhouse, S. Stubborn Reliance on Intuition and Subjectivity in Employee Selection. Ind. Organ. Psychol. 2008, 1, 333–342. [Google Scholar] [CrossRef]
- Prahl, A.; Van Swol, L. Understanding algorithm aversion: When is advice from automation discounted? J. Forecast. 2017, 36, 691–702. [Google Scholar] [CrossRef]
- Mahmud, H.; Islam, A.N.; Ahmed, S.I.; Smolander, K. What influences algorithmic decision-making? A systematic literature review on algorithm aversion. Technol. Forecast. Soc. Chang. 2022, 175, 121390. [Google Scholar] [CrossRef]
- Burton, J.; Stein, M.; Jensen, T.B. A systematic review of algorithm aversion in augmented decision making. J. Behav. Decis. Mak. 2020, 33, 220–239. [Google Scholar] [CrossRef]
- Jussupow, E.; Benbasat, I.; Heinzl, A. Why are we averse towards Algorithms? A comprehensive literature Review on Algorithm aversion. In Proceedings of the ECIS, Online, 15–17 June 2020. [Google Scholar]
- Efendić, E.; Van de Calseyde, P.P.; Evans, A.M. Slow response times undermine trust in algorithmic (but not human) predictions. Organ. Behav. Hum. Decis. Process. 2020, 157, 103–114. [Google Scholar] [CrossRef]
- Filiz, I.; Judek, J.R.; Lorenz, M.; Spiwoks, M. Reducing algorithm aversion through experience. J. Behav. Exp. Financ. 2021, 31, 100524. [Google Scholar] [CrossRef]
- Reich, T.; Kaju, A.; Maglio, S.J. How to overcome algorithm aversion: Learning from mistakes. J. Consum. Psychol. 2022; 1–18, ahead-of-print. [Google Scholar]
- Hodge, F.D.; Mendoza, K.I.; Sinha, R.K. The effect of humanizing robo-advisors on investor judgments. Contemp. Account. Res. 2021, 38, 770–792. [Google Scholar] [CrossRef]
- Ben David, D.; Resheff, Y.S.; Tron, T. Explainable AI and Adoption of Algorithmic Advisors: An Experimental Study. arXiv 2021, arXiv:2101.02555. [Google Scholar]
- Kim, J.; Giroux, M.; Lee, J.C. When do you trust AI? The effect of number presentation detail on consumer trust and acceptance of AI recommendations. Psychol. Mark. 2021, 38, 1140–1155. [Google Scholar] [CrossRef]
- Dietvorst, B.J.; Simmons, J.P.; Massey, C. Overcoming Algorithm Aversion: People Will Use Imperfect Algorithms If They Can (Even Slightly) Modify Them. Manag. Sci. 2018, 64, 1155–1170. [Google Scholar] [CrossRef]
- Spyrou, S.I. Herding in financial markets: A review of the literature. Rev. Behav. Financ. 2013, 5, 175–194. [Google Scholar] [CrossRef]
- Raafat, R.M.; Chater, N.; Frith, C. Herding in humans. Trends Cogn. Sci. 2009, 13, 420–428. [Google Scholar] [CrossRef]
- Baddeley, M.; Burke, C.J.; Schultz, W.; Tobler, P.N. Herding in Financial Behaviour: A Behavioural and Neuroeconomic Analysis of Individual Differences. 2012. Available online: https://www.repository.cam.ac.uk/handle/1810/257113 (accessed on 11 January 2023).
- Devenow, A.; Welch, I. Rational herding in financial economics. Eur. Econ. Rev. 1996, 40, 603–615. [Google Scholar] [CrossRef]
- Hirshleifer, D.; Hong Teoh, S. Herd behaviour and cascading in capital markets: A review and synthesis. Eur. Financ. Manag. 2003, 9, 25–66. [Google Scholar] [CrossRef]
- Mavruk, T. Analysis of herding behavior in individual investor portfolios using machine learning algorithms. Res. Int. Bus. Financ. 2022, 62, 101740. [Google Scholar] [CrossRef]
- Deng, G. The Herd Behavior of Risk-Averse Investor Based on Information Cost. J. Financ. Risk Manag. 2013, 2, 87–91. [Google Scholar] [CrossRef][Green Version]
- Bikhchandani, S.; Sharma, S.K. Herd Behavior in Financial Markets. IMF Staff Pap. 2000, 47, 279–310. [Google Scholar] [CrossRef]
- Lyócsa, Š.; Baumöhl, E.; Výrost, T. YOLO trading: Riding with the herd during the GameStop episode. Financ. Res. Lett. 2021, 46, 102359. [Google Scholar] [CrossRef]
- Vasileiou, E.; Bartzou, E.; Tzanakis, P. Explaining Gamestop Short Squeeze using Ιntraday Data and Google Searches. J. Predict. Mark. 2021, 3805630, forthcoming. [Google Scholar] [CrossRef]
- Chohan, U.W. YOLO Capitalism. 2022. Available online: https://papers.ssrn.com/sol3/papers.cfm?abstract_id=3775127 (accessed on 16 January 2023).
- Betzer, A.; Harries, J.P. How online discussion board activity affects stock trading: The case of GameStop. Financ. Mark. Portf. Manag. 2022, 36, 443–472. [Google Scholar] [CrossRef] [PubMed]
- Hajli, N.; Lin, X.; Featherman, M.; Wang, Y. Social Word of Mouth: How Trust Develops in the Market. Int. J. Mark. Res. 2014, 56, 673–689. [Google Scholar] [CrossRef]
- Amblee, N.; Bui, T.X. Harnessing the Influence of Social Proof in Online Shopping: The Effect of Electronic Word of Mouth on Sales of Digital Microproducts. Int. J. Electron. Commer. 2011, 16, 91–114. [Google Scholar] [CrossRef]
- Alexander, V.; Blinder, C.; Zak, P.J. Why trust an algorithm? Performance, cognition, and neurophysiology. Comput. Hum. Behav. 2018, 89, 279–288. [Google Scholar] [CrossRef]
- Gubaydullina, Z.; Judek, J.R.; Lorenz, M.; Spiwoks, M. Comparing Different Kinds of Influence on an Algorithm in Its Forecasting Process and Their Impact on Algorithm Aversion. Businesses 2022, 2, 448–470. [Google Scholar] [CrossRef]
- Franke, T.; Attig, C.; Wessel, D. A Personal Resource for Technology Interaction: Development and Validation of the Affinity for Technology Interaction (ATI) Scale. Int. J. Hum. Comput. Interact. 2019, 35, 456–467. [Google Scholar] [CrossRef]
- Sele, D.; Chugunova, M. Putting a Human in the Loop: Increasing Uptake, but Decreasing Accuracy of Automated Decision-Making. In Max Planck Institute for Innovation & Competition Research Paper No. 22-20, SSRN; Elsevier: Amsterdam, The Netherlands, 2022; p. 4285645. [Google Scholar]
- Spiwoks, M.; Bizer, K. On the Measurement of Overconfidence: An Experimental Study. Int. J. Econ. Financ. Res. 2018, 4, 30–37. [Google Scholar]


| Maximum Deviation in % | 1 | 2 | 3 | 4 | 5 | 6 | 7 | 8 | 9 | 10 | 11 | 12 | 13 | 14 | 15 | >15 |
|---|---|---|---|---|---|---|---|---|---|---|---|---|---|---|---|---|
| Bonus in Coins | 50 | 47 | 43 | 40 | 37 | 33 | 30 | 27 | 23 | 20 | 17 | 13 | 10 | 7 | 3 | 0 |
| Basis of Performance-Related Bonus | |||
|---|---|---|---|
| Own Forecasts | Forecasting Calculator (Algorithm) | t-Test | |
| Ø absolute forecast error [in USD] | 20.51 | 10.90 | t(252) = 16.21; p < 0.001; d = 2.06 |
| Ø relative forecast error [in %] | 18.51 | 8.56 | t(252) = 14.19; p < 0.001; d = 1.80 |
| Ø performance-related bonus [in USD] | 0.51 | 0.83 | t(252) = 17.47; p < 0.001; d = 2.22 |
| Total | Forecasting Calculator (Algorithm) | Own Forecasts | |||
|---|---|---|---|---|---|
| n | n | % | n | % | |
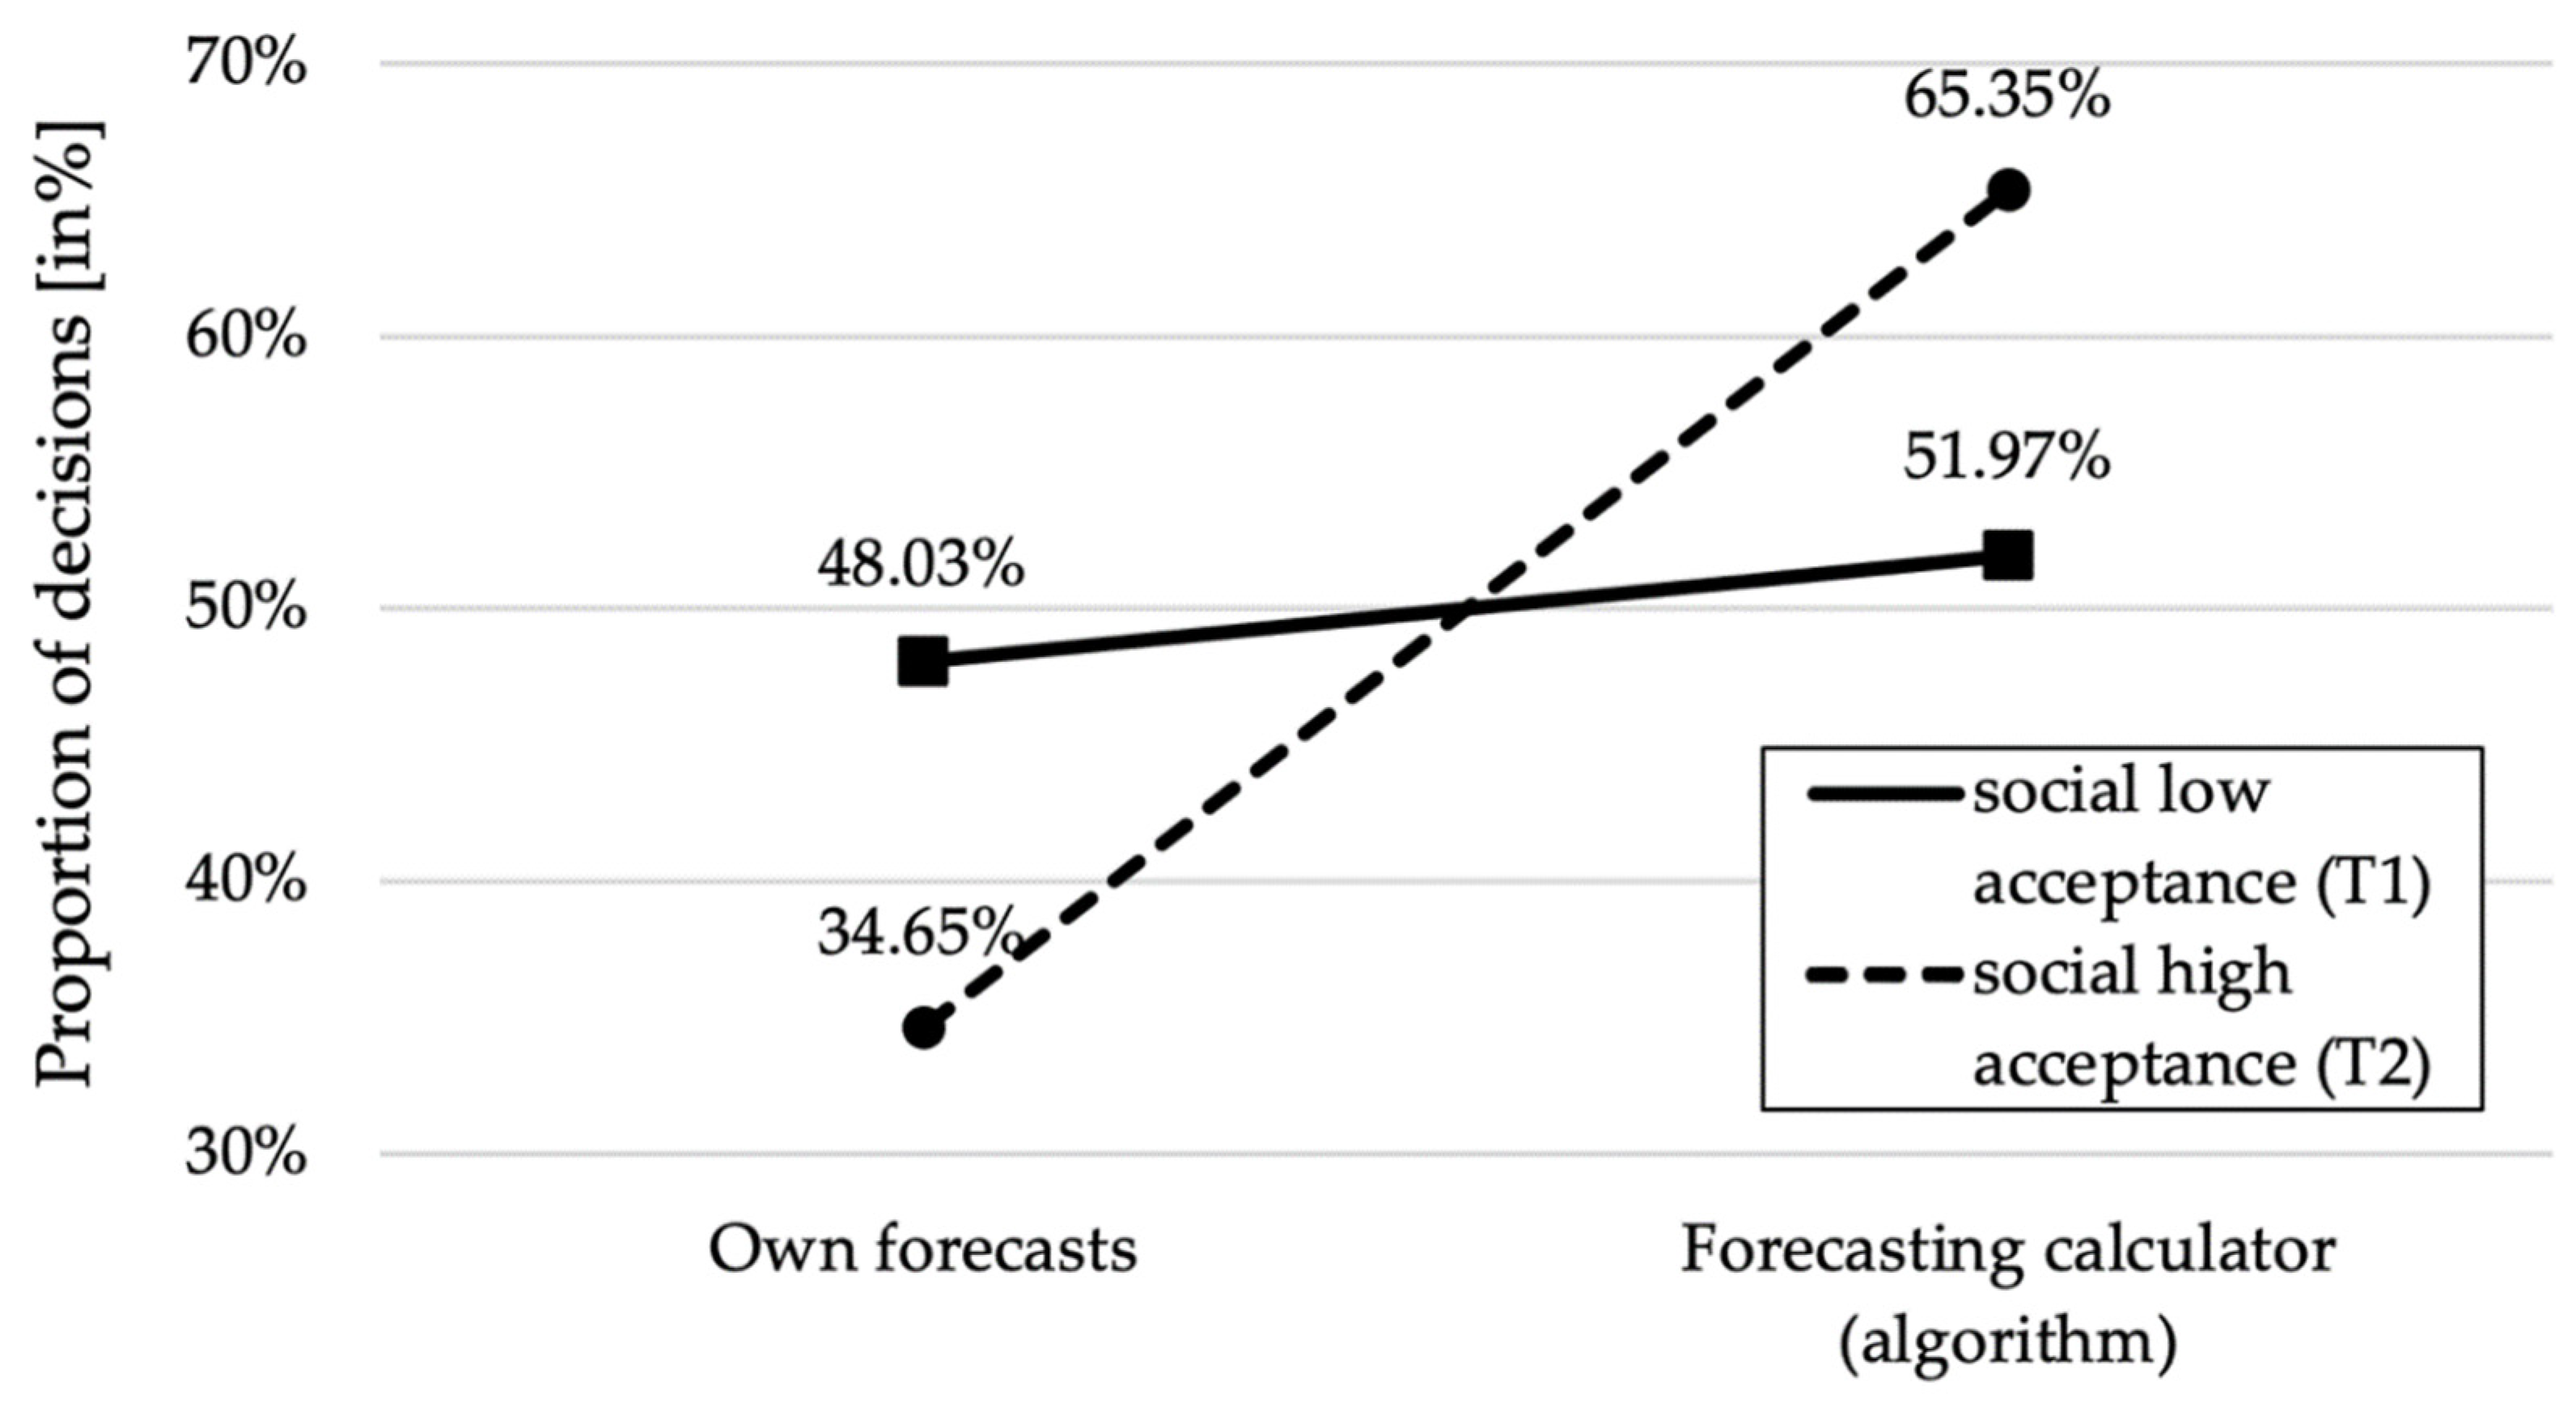
| Social low acceptance (T1) | 127 | 66 | 51.97% | 61 | 48.03% |
| Social high acceptance (T2) | 127 | 83 | 65.35% | 44 | 34.65% |
| Gender | Forecasting Calculator (Algorithm) | Own Forecast | |||
|---|---|---|---|---|---|
| n | % | n | % | ||
| Social low acceptance (T1) | male | 31 | 44.29% | 39 | 55.71% |
| female | 35 | 61.40% | 22 | 38.60% | |
| Social high acceptance (T2) | male | 29 | 51.79% | 27 | 48.21% |
| female | 54 | 76.06% | 17 | 23.94% | |
| ATI Score * | Total | Thereof Use Algorithm | Thereof Use Own Forecasts | ||
|---|---|---|---|---|---|
| n | % | % | % | ||
| Social low acceptance (T1) | ≤3.5 | 37 | 29.13% | 64.86% | 35.14% |
| >3.5 | 90 | 70.87% | 46.67% | 53.33% | |
| Social high acceptance (T2) | ≤3.5 | 38 | 29.92% | 84.21% | 15.79% |
| >3.5 | 89 | 70.08% | 57.30% | 42.70% | |
Disclaimer/Publisher’s Note: The statements, opinions and data contained in all publications are solely those of the individual author(s) and contributor(s) and not of MDPI and/or the editor(s). MDPI and/or the editor(s) disclaim responsibility for any injury to people or property resulting from any ideas, methods, instructions or products referred to in the content. |
© 2024 by the author. Licensee MDPI, Basel, Switzerland. This article is an open access article distributed under the terms and conditions of the Creative Commons Attribution (CC BY) license (https://creativecommons.org/licenses/by/4.0/).
Share and Cite
Judek, J.R. Willingness to Use Algorithms Varies with Social Information on Weak vs. Strong Adoption: An Experimental Study on Algorithm Aversion. FinTech 2024, 3, 55-65. https://doi.org/10.3390/fintech3010004
Judek JR. Willingness to Use Algorithms Varies with Social Information on Weak vs. Strong Adoption: An Experimental Study on Algorithm Aversion. FinTech. 2024; 3(1):55-65. https://doi.org/10.3390/fintech3010004
Chicago/Turabian StyleJudek, Jan René. 2024. "Willingness to Use Algorithms Varies with Social Information on Weak vs. Strong Adoption: An Experimental Study on Algorithm Aversion" FinTech 3, no. 1: 55-65. https://doi.org/10.3390/fintech3010004
APA StyleJudek, J. R. (2024). Willingness to Use Algorithms Varies with Social Information on Weak vs. Strong Adoption: An Experimental Study on Algorithm Aversion. FinTech, 3(1), 55-65. https://doi.org/10.3390/fintech3010004