Article

Comparative Analysis of Linear Models and Artificial Neural Networks for Sugar Price Prediction

by
Tathiana M. Barchi
1,2,†,
João Lucas Ferreira dos Santos
2,†,
Priscilla Bassetto
2,†,
Henrique Nazário Rocha
3,†,
Sergio L. Stevan, Jr.
3,4,†,
Fernanda Cristina Correa
3,4,†,
Yslene Rocha Kachba
5,† and
Hugo Valadares Siqueira
1,2,3,4,*,†
1
Graduate Program Computer Sciences (PPGCC), Federal University of Technology–Paraná (UTFPR), Dr. Washington Subtil Chueire St., 330, Jardim Carvalho, Ponta Grossa 84017-220, Brazil
2
Graduate Program in Industrial Engineering (PPGEP), Federal University of Technology–Parana, Ponta Grossa 84017-220, Brazil
3
Department of Electrical Engineering, Federal University of Technology–Parana, Ponta Grossa 84017-220, Brazil
4
Graduate Program in Electrical Engineering (PPGEE), Federal University of Technology–Parana, Ponta Grossa 84017-220, Brazil
5
Department of Industrial Engineering, Federal University of Technology–Parana, Ponta Grossa 84017-220, Brazil
*
Author to whom correspondence should be addressed.
These authors contributed equally to this work.
FinTech 2024, 3(1), 216-235; https://doi.org/10.3390/fintech3010013
Submission received: 30 November 2023 / Revised: 20 February 2024 / Accepted: 5 March 2024 / Published: 12 March 2024

Abstract

:
Sugar is an important commodity that is used beyond the food industry. It can be produced from sugarcane and sugar beet, depending on the region. Prices worldwide differ due to high volatility, making it difficult to estimate their forecast. Thus, the present work aims to predict the prices of kilograms of sugar from four databases: the European Union, the United States, Brazil, and the world. To achieve this, linear methods from the Box and Jenkins family were employed, together with classic and new approaches of artificial neural networks: the feedforward Multilayer Perceptron and extreme learning machines, and the recurrent proposals Elman Network, Jordan Network, and Echo State Networks considering two reservoir designs. As performance metrics, the MAE and MSE were addressed. The results indicated that the neural models were more accurate than linear ones. In addition, the MLP and the Elman networks stood out as the winners.

1. Introduction

Sugar is an essential commodity in world trade due to its extensive use in the food industry. Sugar derivatives are also used to produce biofuels, which are likely to grow in the next decade [1,2]. When used for food purposes, sugar is mainly produced from sugarcane, predominantly in tropical and subtropical regions. In temperate regions, the most addressed raw material is sugar beet [3,4].
Observing the sugar prices in different regions of the world, it is evident that the global sugar market is extremely fragmented. A high price volatility has been observed in recent years [5]. The volatile nature of the market is further intensified by the effects of various support measures that benefit the subsector [6]. It is one of the commodities most strongly protected by governments, as they seek to protect producers from low prices by implementing various policy instruments, such as border measures, minimum price levels, and subsidies [7]. This product may suffer influence from the intern markets due to strict regulations applied in countries like Russia, India, and China. Note that these countries are in the top ranking of the world’s largest producers. Other factors influence the price, such as import rate and production volume control [8].
As specified by Van der Eng [9], sugar is a crucial commodity for economic development. The average annual production is around 1700 million tons, which covers 24 million hectares of land around the world [10]. In addition, a 15% growth in agricultural production is expected for the next decade, which can be attributed to improvements in production and high production intensity, followed by technological innovation [11].
According to the United States Department of Agriculture (USDA), global consumption increased from 171,582 metric tons in 2019/20 to 177,795 metric tons in 2020/21 [12]. Similarly, the per capita sugar consumption is expected to rise due to urbanization and increased consumption of processed foods [11]. In the USA, the consumption of food commodities is also expected to grow, mainly due to the population increase [13].
In this sense, understanding the dynamics of sugar prices between the domestic and international markets is of paramount importance for the success of companies operating in this sector. It plays a significant role in determining the rate of inflation, wages, salaries and various policies in an economy. In the case of cash crops such as sugarcane, the level of production affects the raw material cost and the competitive advantages in the market [14].
The literature on modeling international sugar markets and projecting their prices tends to use general equilibrium models [6] or partial equilibrium models [15,16,17]. These are usually recursive approaches that provide annual market balances for production, consumption, trade, and world prices over a projection period. Thus, the models aim to assess the effect of specific policies on the international market and their ability to incorporate a wide range of policy variables.
Another approach related to sugar price analysis is based on time series techniques [8,18,19,20,21]. In this case, the policy simulation possibilities are relatively narrow, but allow us to use data at a much higher frequency level (e.g., daily) than partial or general equilibrium models. Time series analysis and forecasting is addressed in different fields of research, such as economics, finance, health, engineering, etc. [22], which is the focus of the current investigation.
Several models have been suggested in the literature to improve the accuracy of sugar price forecasting. Ribeiro and Oliveira [23] proposed a hybrid model composed of artificial neural network Kalman filters to predict the monthly price of sugar in Brazil and India. Melo, Milioni and Júnior [24] used the Mixture of Local Experts Models (MLEM) to predict the daily and monthly price of American domestic sugar. Esam [25] applied the Autoregressive Integrated Moving Average (ARIMA) model to estimate the annual Egyptian sugar consumption and production. Mehmood [26] also applied the ARIMA model to predict the annual production of the sugar crop in Pakistan. Vishawajith et al. investigated the growth or decrease in the sugar crop area in India using annual data and the ARIMA model [27].
The application, study, and development of forecasting models have been a theme very much discussed in the last few decades [28], and such discussion has mainly focused on linear models. The models from the Box and Jenkins family stood out as some of the most used. However, due to the growing use of neural-inspired approaches, there is still room for evaluating the performance of nonlinear approaches in many fields, such as commodities prices. There is an important research gap that deserves to be filled. In this sense, this paper aims to investigate the use of feedforward and recursive Artificial Neural Networks (ANNs) as well as linear models for the price of sugar in several countries. The models addressed are the Multilayer Perceptron (MLP), Extreme Learning Machines (ELM), Elman Network, Jordan Network, Echo State Networks-ESN, Autoregressive Model (AR), and Autoregressive Moving and Average model (ARMA) [3,29,30,31]. The databases addressed are related to four of the most important markets: the European Union, United States, Brazil and the World.
Commodity prices broadly influence general price levels, which are of interest to central databases, policymakers, businesses, and consumers, in such a way that decisions depend on their expectations of future inflation. Thus, understanding the price dynamics between the national and international markets is of great importance for the strategic planning of the sugar and alcohol sector [9]. This study may effectively help society, researchers, and scientists working in this area [32].
This paper is organized as follows: Section 2 presents the details of the forecasting models; Section 3 discusses the database addressed, pre-processing stages and the performance metrics used; Section 4 shows the results found by the models and a critical analysis; finally, this paper is concluded in Section 5.

2. Materials and Methods

Time series forecasting is the process of predicting the future value of time series based on past observations when the univariate approach is addressed. It is widely used in organizational environments and presents deep statistical bases [28,33]. Time series forecasting can be classified into four groups: forecasting based on time series decomposition, smoothing-based techniques, regression-based techniques, and machine approaches [34]. This section describes the main concepts of the linear methods and ANNs addressed.

2.1. Autoregressive Model (AR)

The Autoregressive (AR) model belongs to the Box and Jenkins methodology, which assumes a linear relationship between the current and past values [28]. More specifically, the process involves a linear combination of the variable and their own lagged values, x t 1 + + x t p , multiplied by a coefficient ϕ i and with added noise of a t , according to the Equation (1) [35]:
x ^ t = i = 1 p ϕ i x t i + a t ,
where x t ^ is the value predicted at time t and p represents the order of the model.
The AR model presents a closed-form solution to determine the optimal coefficients in terms of the mean square error, referred to as the Yule–Walker equation. Also, the partial autocorrelation function (PACF) can be used to calculate the order of the model [36].

2.2. Autoregressive Moving and Average Model (ARMA)

Another commonly used linear method from the Box and Jenkins methodology is the Moving Averages (MA) model. Unlike Autoregressive (AR), white noise terms a t are combined [37], weighted by the coefficients θ i . However, those terms can be modeled as the errors of the previous predictions’ ε t .
In this sense, the Autoregressive and Moving Average models (ARMA) are a combination of the aforementioned models, as in Equation (2):
x ^ t = i = 1 p ϕ i x t i + i = 1 q θ i ε t i + a t
in which p and q describe the orders of AR and MA, respectively, i.e., the realization of series prediction by the ARMA model uses p previous signals and q previous noise.
Unlike the AR model, calculating the coefficients requires the solution of non-linear equations due to the reinsertion of the error. Thus, maximum likelihood estimators are addressed, as this is the standard procedure of the literature [28].

2.3. Multilayer Perceptron (MLP)

The Multilayer Perceptron is a feedforward neural network widely used due to its capability to approximate any nonlinear, continuous, limited, and differentiable function, being a universal approximator [38]. It is suitable for prediction, clustering, and channel equalization, among other tasks [39,40,41].
An MLP presents at least three layers of artificial neurons: input, hidden, and output layers. Note that the number of hidden layers can vary. The neurons in a layer are fully connected with the next one, but neurons of the same layer do not communicate [42].
The training of an MLP is the process of adjusting the weights of the connections between neurons. The goal is to find the best set of weights based on some error metric, usually the mean square error. Applying the backpropagation algorithm to determine all the network weights is common. In this case, the gradient vector of the cost function formed by the network output and the desired signal is calculated, followed by an iterative adjustment using the steepest decent gradient [43].

2.4. Extreme Learning Machine (ELM)

The architecture of an Extreme Learning Machine (ELM) is quite similar to the MLP. The main difference between them is in the training process [44]: while in an MLP, the hidden layer and output layer weights are adjusted by non-linear optimization methodologies, in an ELM, the weights of the hidden layer are randomly generated and kept untuned. Therefore, only the output layer weights are calculated [45], reducing the computational effort required during training [46]. The ELM architecture is in Figure 1.
Using a constructive approach, the authors demonstrated that the model approximates any function by inserting new randomly generated neurons [47]. One can observe a direct relationship between ELM and MLP, the first “unorganized” version of the second, in which the middle layer is not subject to any adjustment [48].
In this sense, the ELM can approximate any nonlinear, continuous, limited, and differentiable mapping with arbitrary precision [47]. The necessary precision is achieved by inserting new neurons in the hidden layer, increasing the network’s approximation potential.
The network training consists of a linear regression that addresses the Moore–Penrose pseudo-inverse method to obtain the optimal values for the synaptic weights [44].

2.5. Elman and Jordan Networks

The Elman network presents a different characteristic from the previous ones: the existence of recurrent loops. Therefore, it is classified as a recursive architecture. The model presents a distinct input layer, which presents two parts: the first is the network’s input layer, and the second is responsible for storing the hidden layer outputs. This second part is called the context layer, and it contains adjustable synaptic weights. In short, the context layer stores the outputs produced by the intermediate layers, which are inserted as an input of the network [42].
Following similar premises, Jordan created the first recurrent neural network based on an MLP. This network was initially used to recognize time series, but nowadays, it is possible to find several applications in the literature. Unlike the Elman networks, the context units present synaptic weights and store the outputs produced by the output layer, which are used as input together with the current external inputs. For both architectures, the truncated backpropagation through time is the method most frequently used to train the models [39,42].

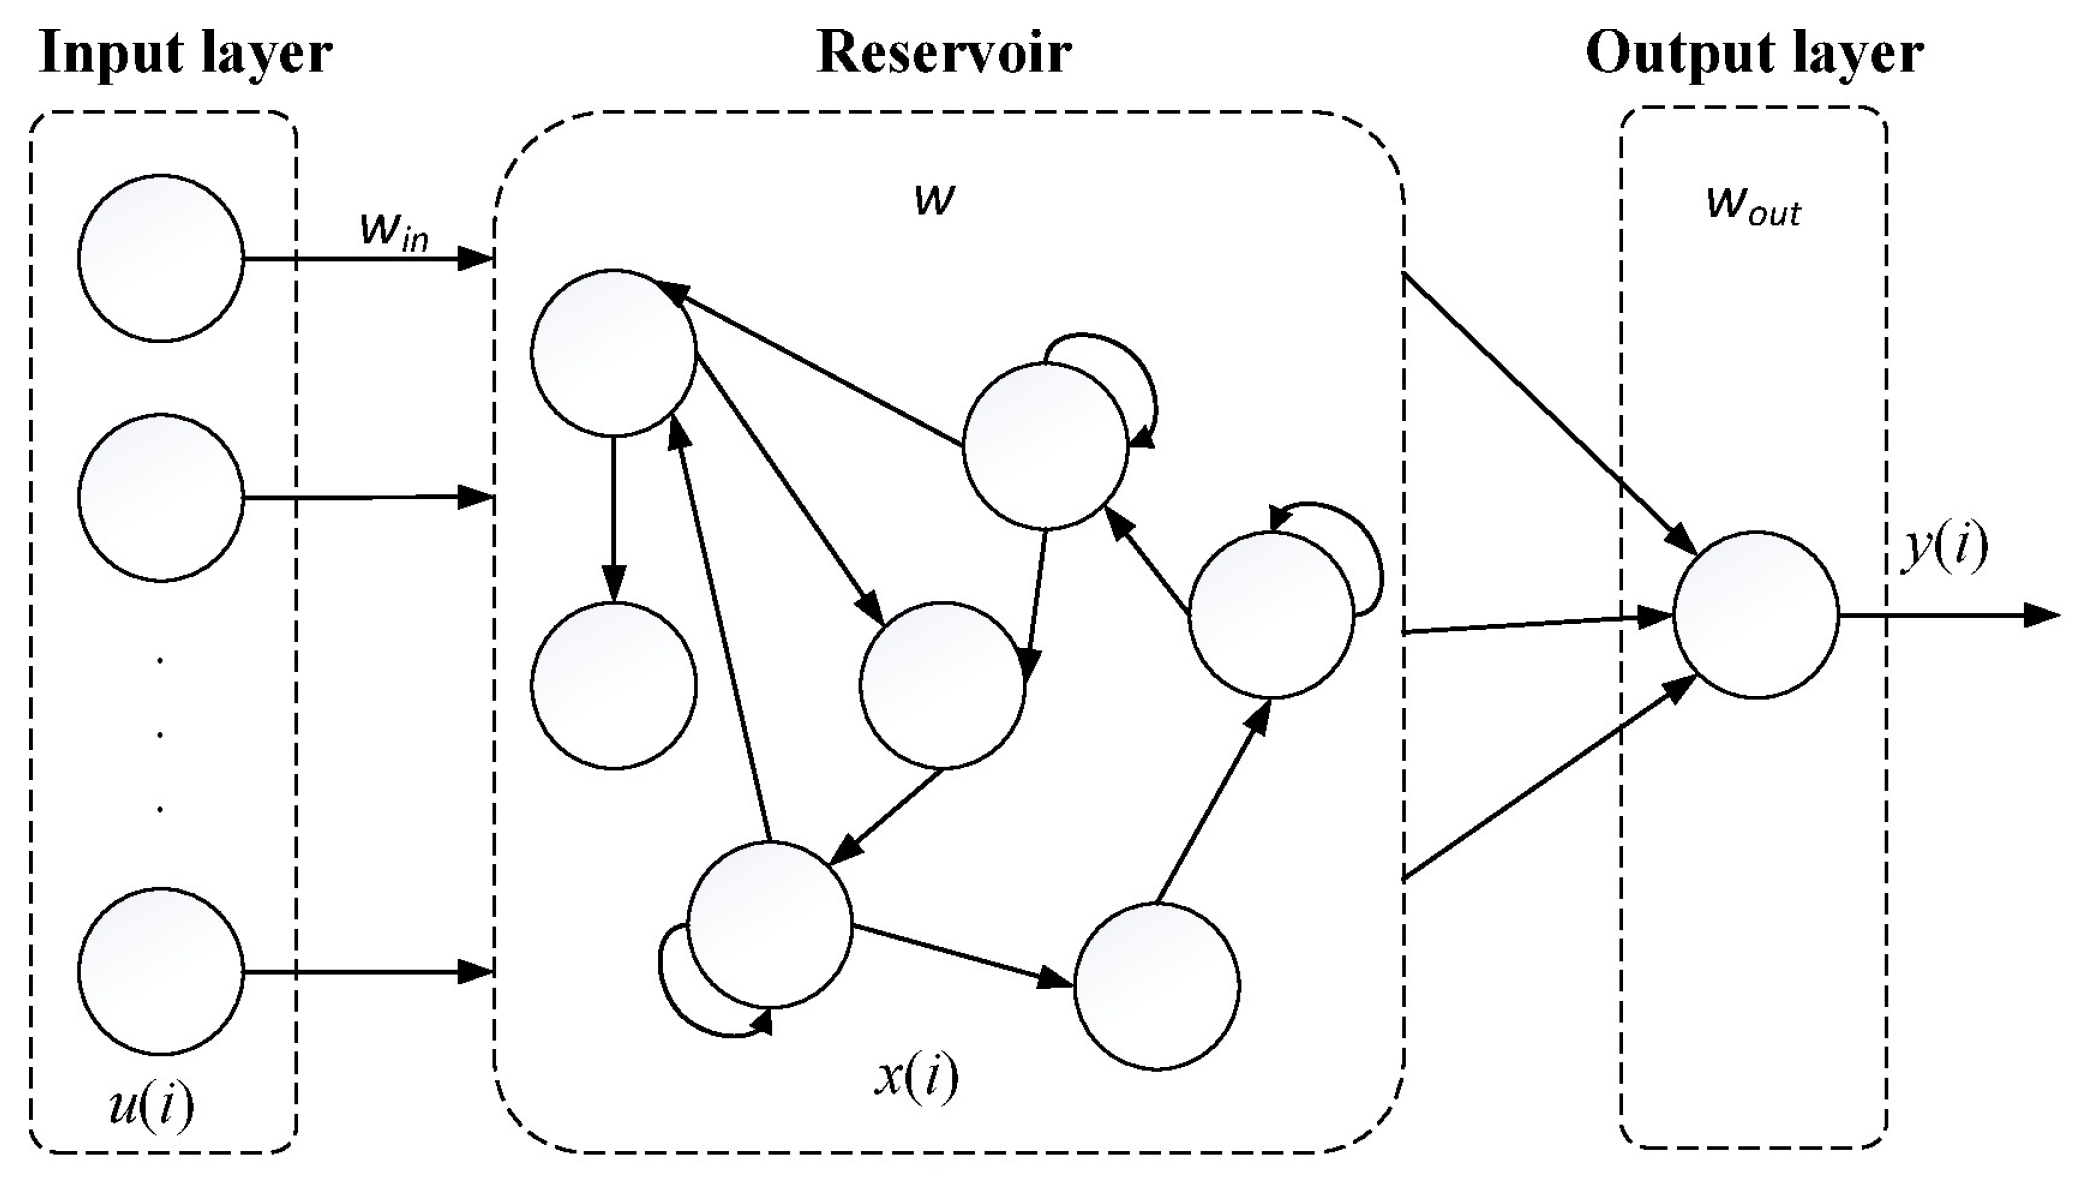
2.6. Echo State Network (ESN)

The Echo State Network (ESN), proposed by Jaeger in 2001 [49], is a recurrent neural network proposal. ESNs generally comprise three layers: the input, the dynamic reservoir, and the output layer. The reservoir presents interconnected artificial neurons, generating a non-linear characteristic. The output layer is responsible for combining the outputs of the dynamic reservoir [39]. This proposal is as shown in Figure 2. The dynamic reservoir provides the network with an “internal memory” suitable for time-dependent problems.
In Figure 2, W i n is the matrix containing the weights of the input layer connections, W the weights of the reservoir, and W o u t the weights of the output layer. The last must be updated during the training process, while the others ( W i n , W ) are set randomly at the time of the creation of the network, without any changes [40,49].
The ESN presents similarities to the ELM as the training process is efficient due to the fast convergence and analytical solution for optimizing the output layer weights. Also, it is a universal approximation [39].
In this work, two reservoir designs were considered. The first, proposed by Jaeger [49], consists of a matrix of weights with three possible values randomly defined according to Equation (3).
W = { 0.4 with probability of 0.025 , 0.4 with probability of 0.025 , 0 with probability of 0.95 .
The second method considered was proposed by Ozturk et al. [50]. This proposal generates a reservoir rich in average entropy of the echo states. Furthermore, its eigenvalues present a uniform distribution in a unit circle, resulting in a canonical matrix according to Equation (4).
W = 0 0 0 0 0 r N 1 0 0 0 0 0 0 1 0 0 0 0 0 0 1 0 0 0 0 0 0 1 0 0 0 0 0 0 1 0
where r is the radial spectrum and N is the number of neurons in the reservoir.
In his pioneer work, Jaeger enunciated the “echo state propriety”, a mathematical proof of the existence of memory in an ESN [49]. If this condition is respected, the architecture can stand untuned, and the output response will be stable. Ozturk et al. followed these premises [50].
To achieve the objectives of this research, an investigation was performed by collecting raw data on sugar prices from four databases: Brazil, the European Union, the United States, and the world. However, it is necessary to transform the database into approximately stationary before training the linear models. Note that the performance of nonlinear models can also be increased using this procedure [39].
The next step is the selection of the inputs, i.e., the previous samples (lags) of the series combined to perform the output response of the forecasting methods. For the linear approaches, this means defining the models’ order. This work uses the Partial Autocorrelation Function (PACF) to guide such selection. Next, the parameters of the models are calculated, the forecasting is performed, and the seasonal or trend components are reinserted.
The aforementioned predictors were developed in Java. For all models (AR, ARMA, MLP, ELM, ELMAN, JORDAN, ESN–Jaeger, and ESN-Ozturk et al.), the predictions were performed for P = 1, 3, 6, and 12 steps ahead, using the direct method [43,51].

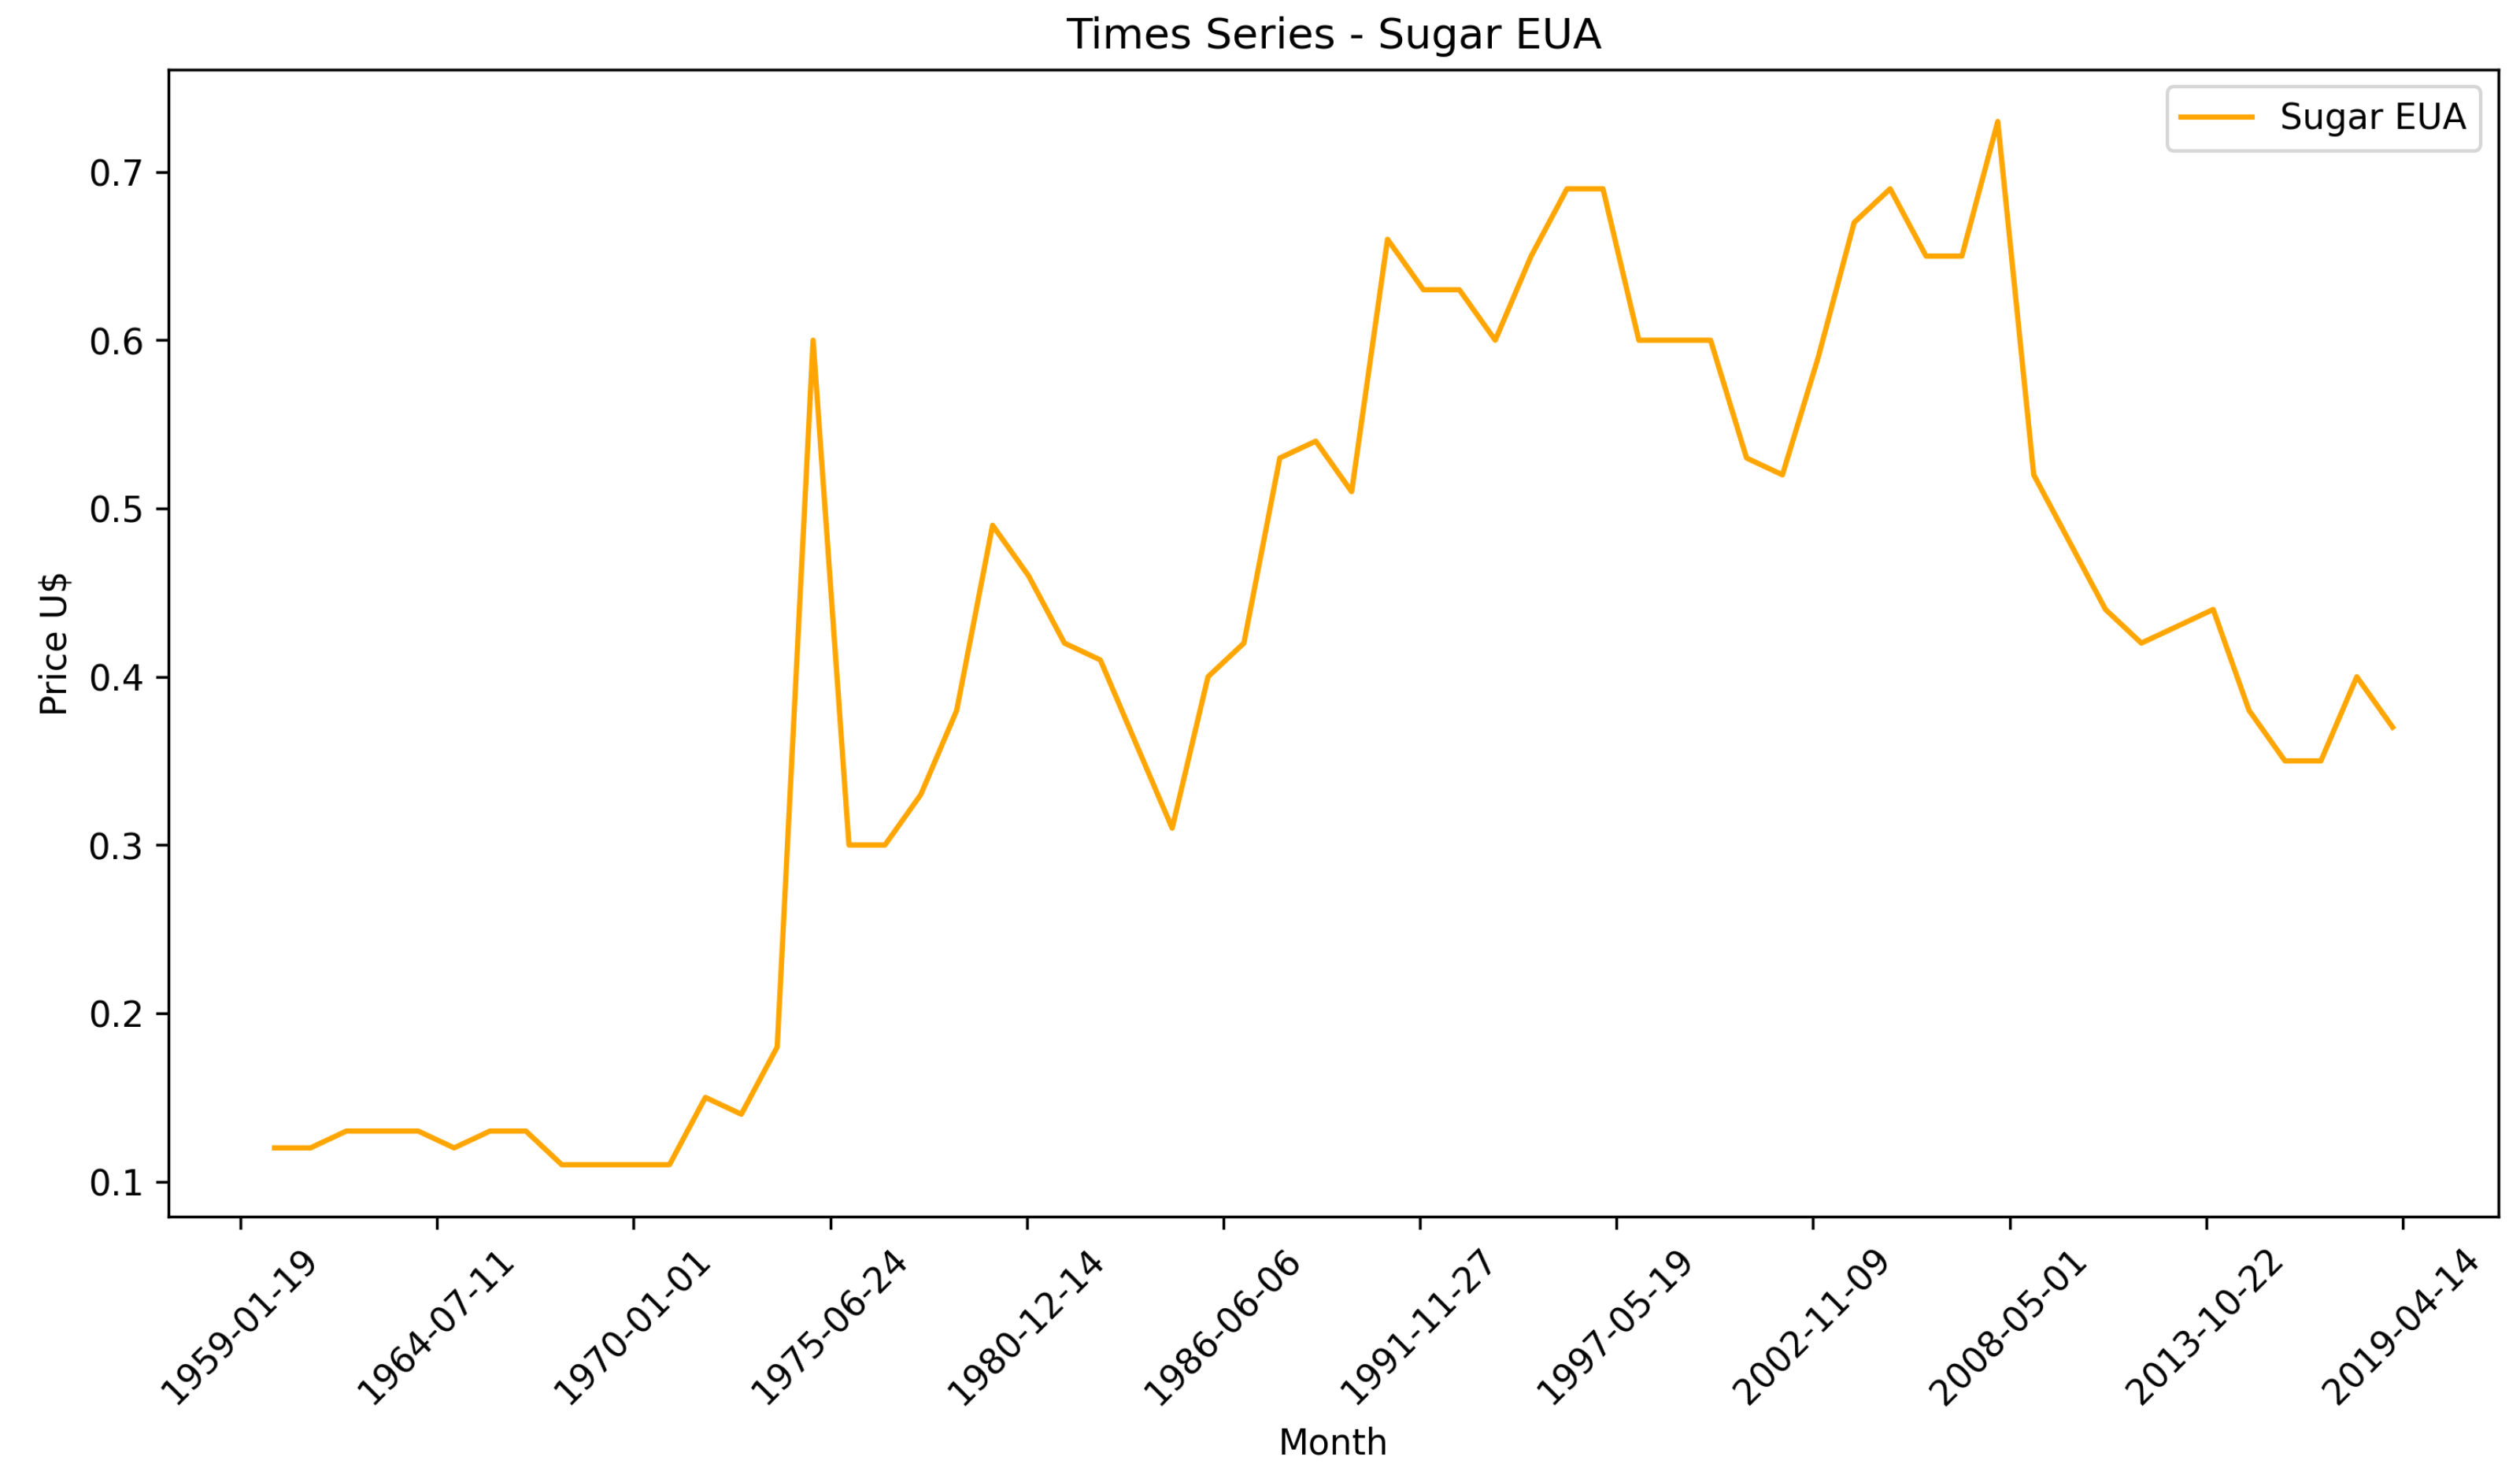
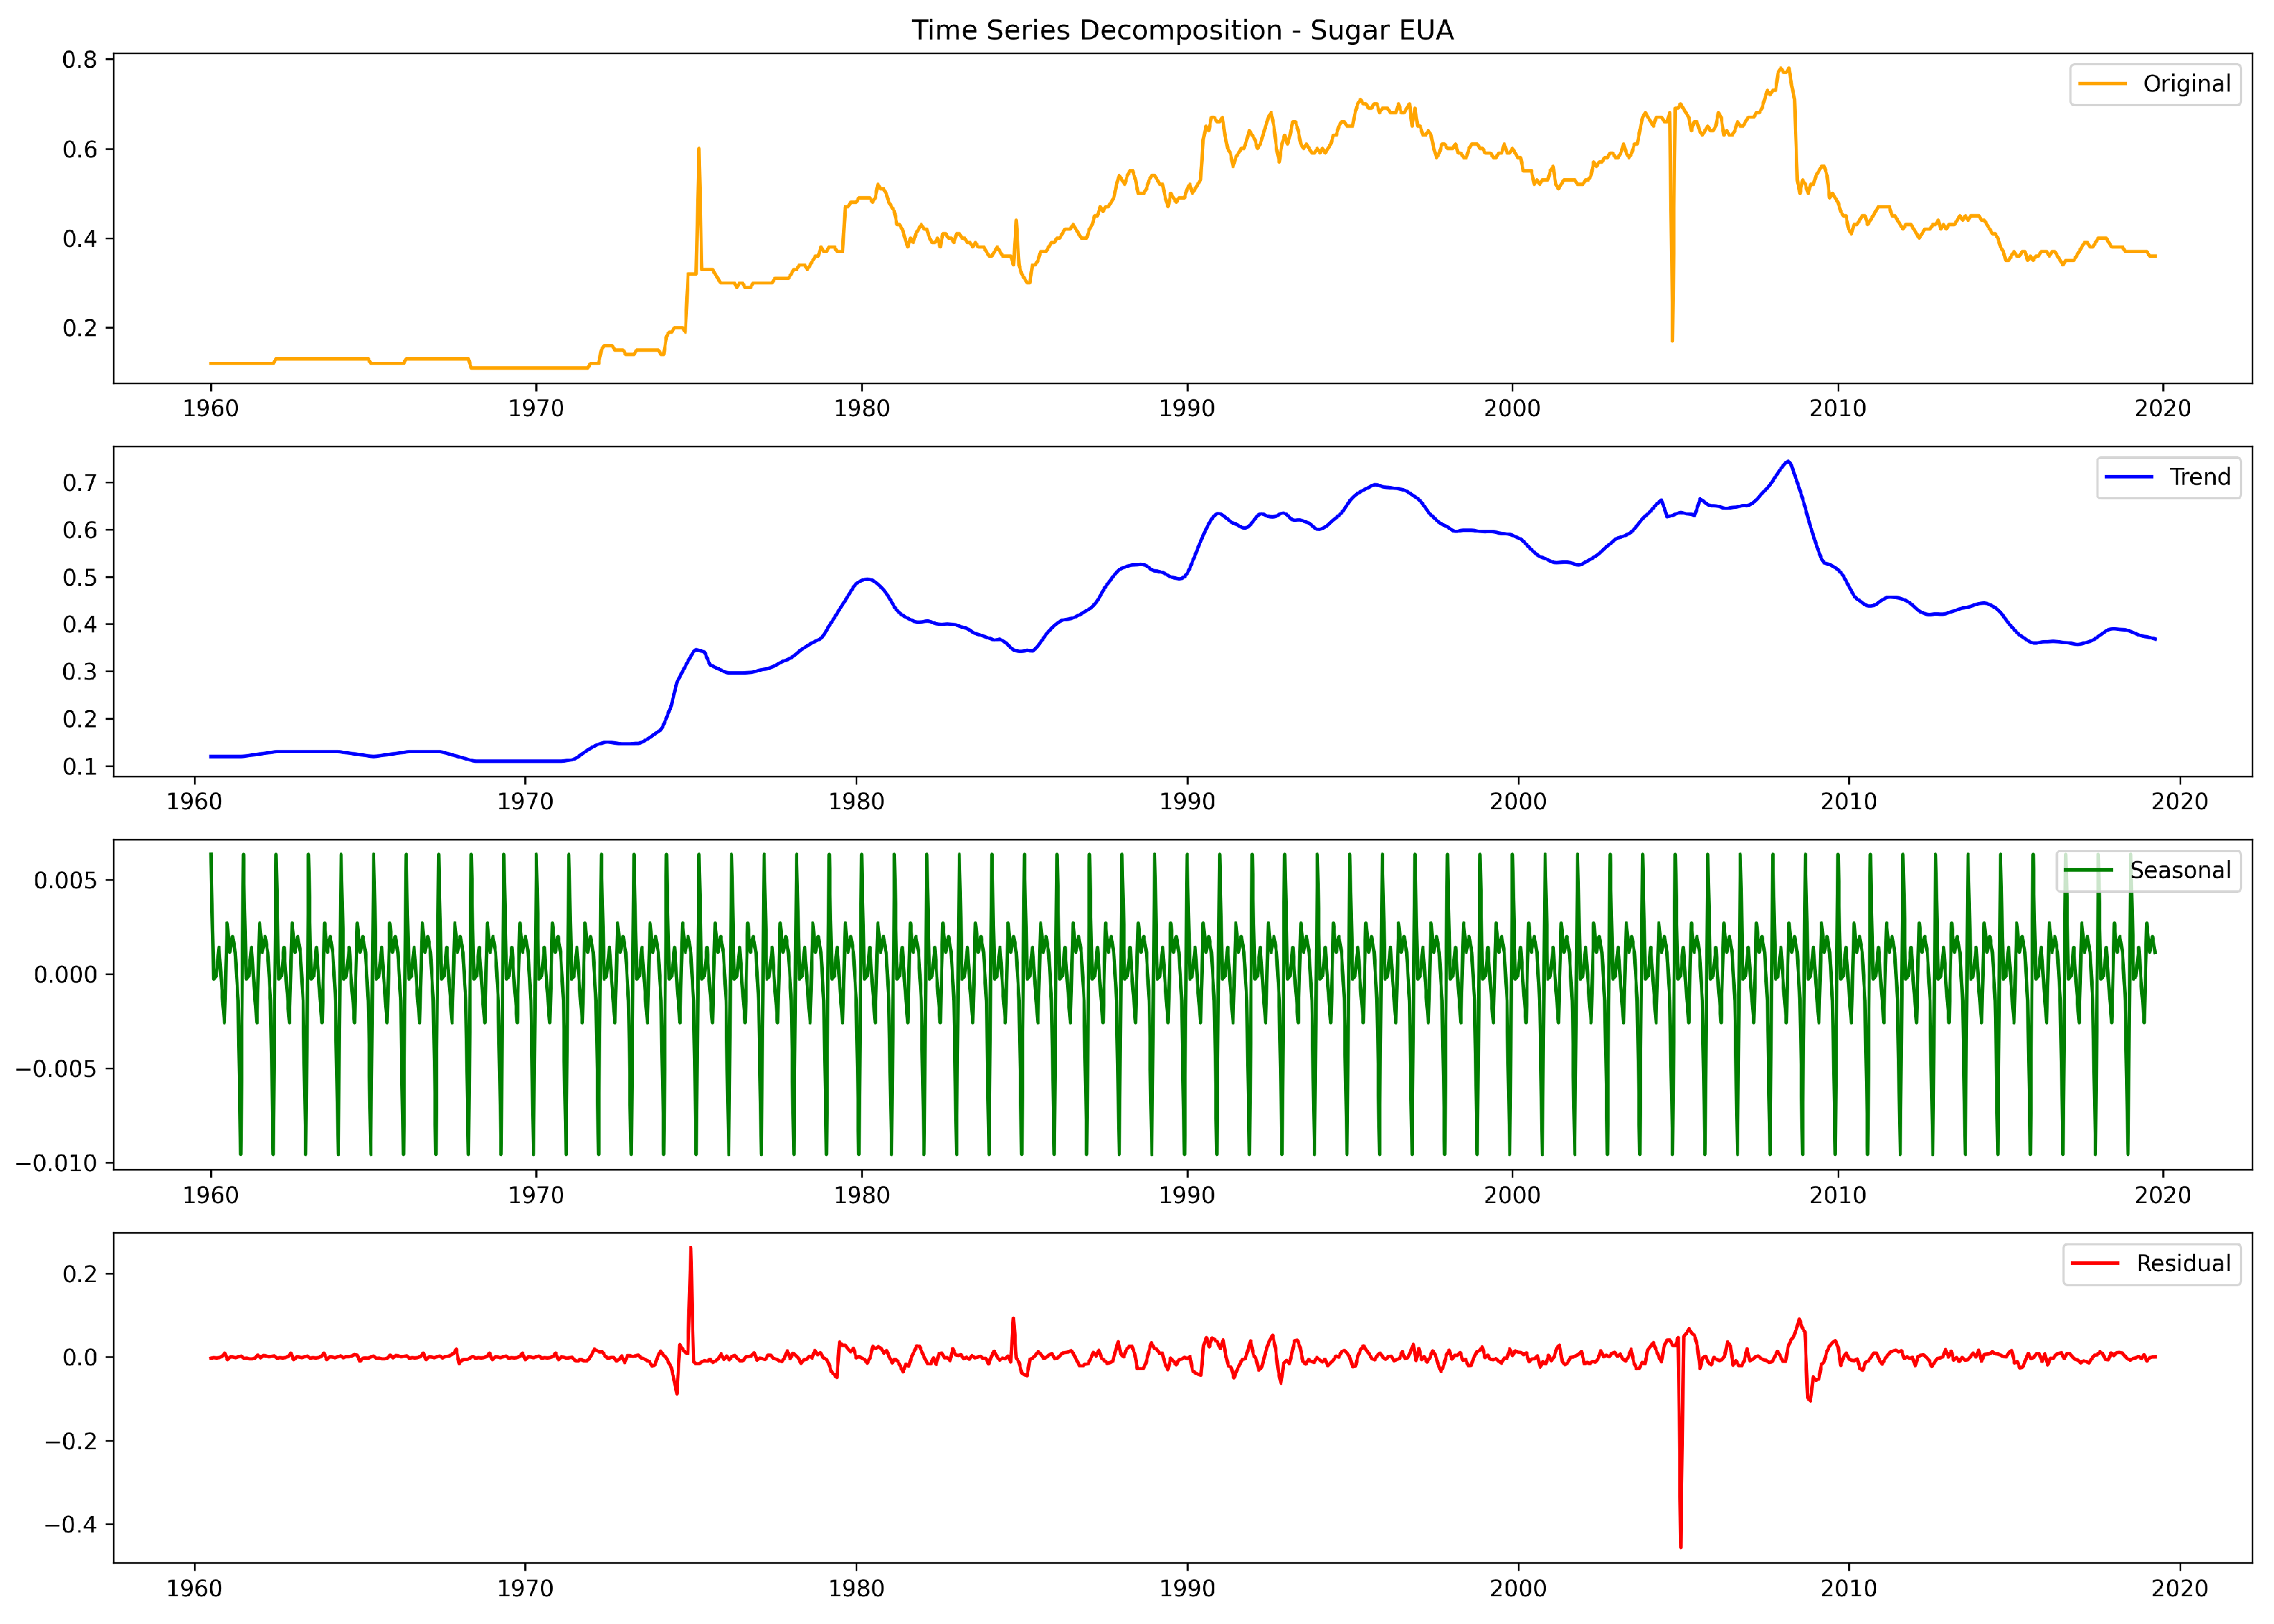
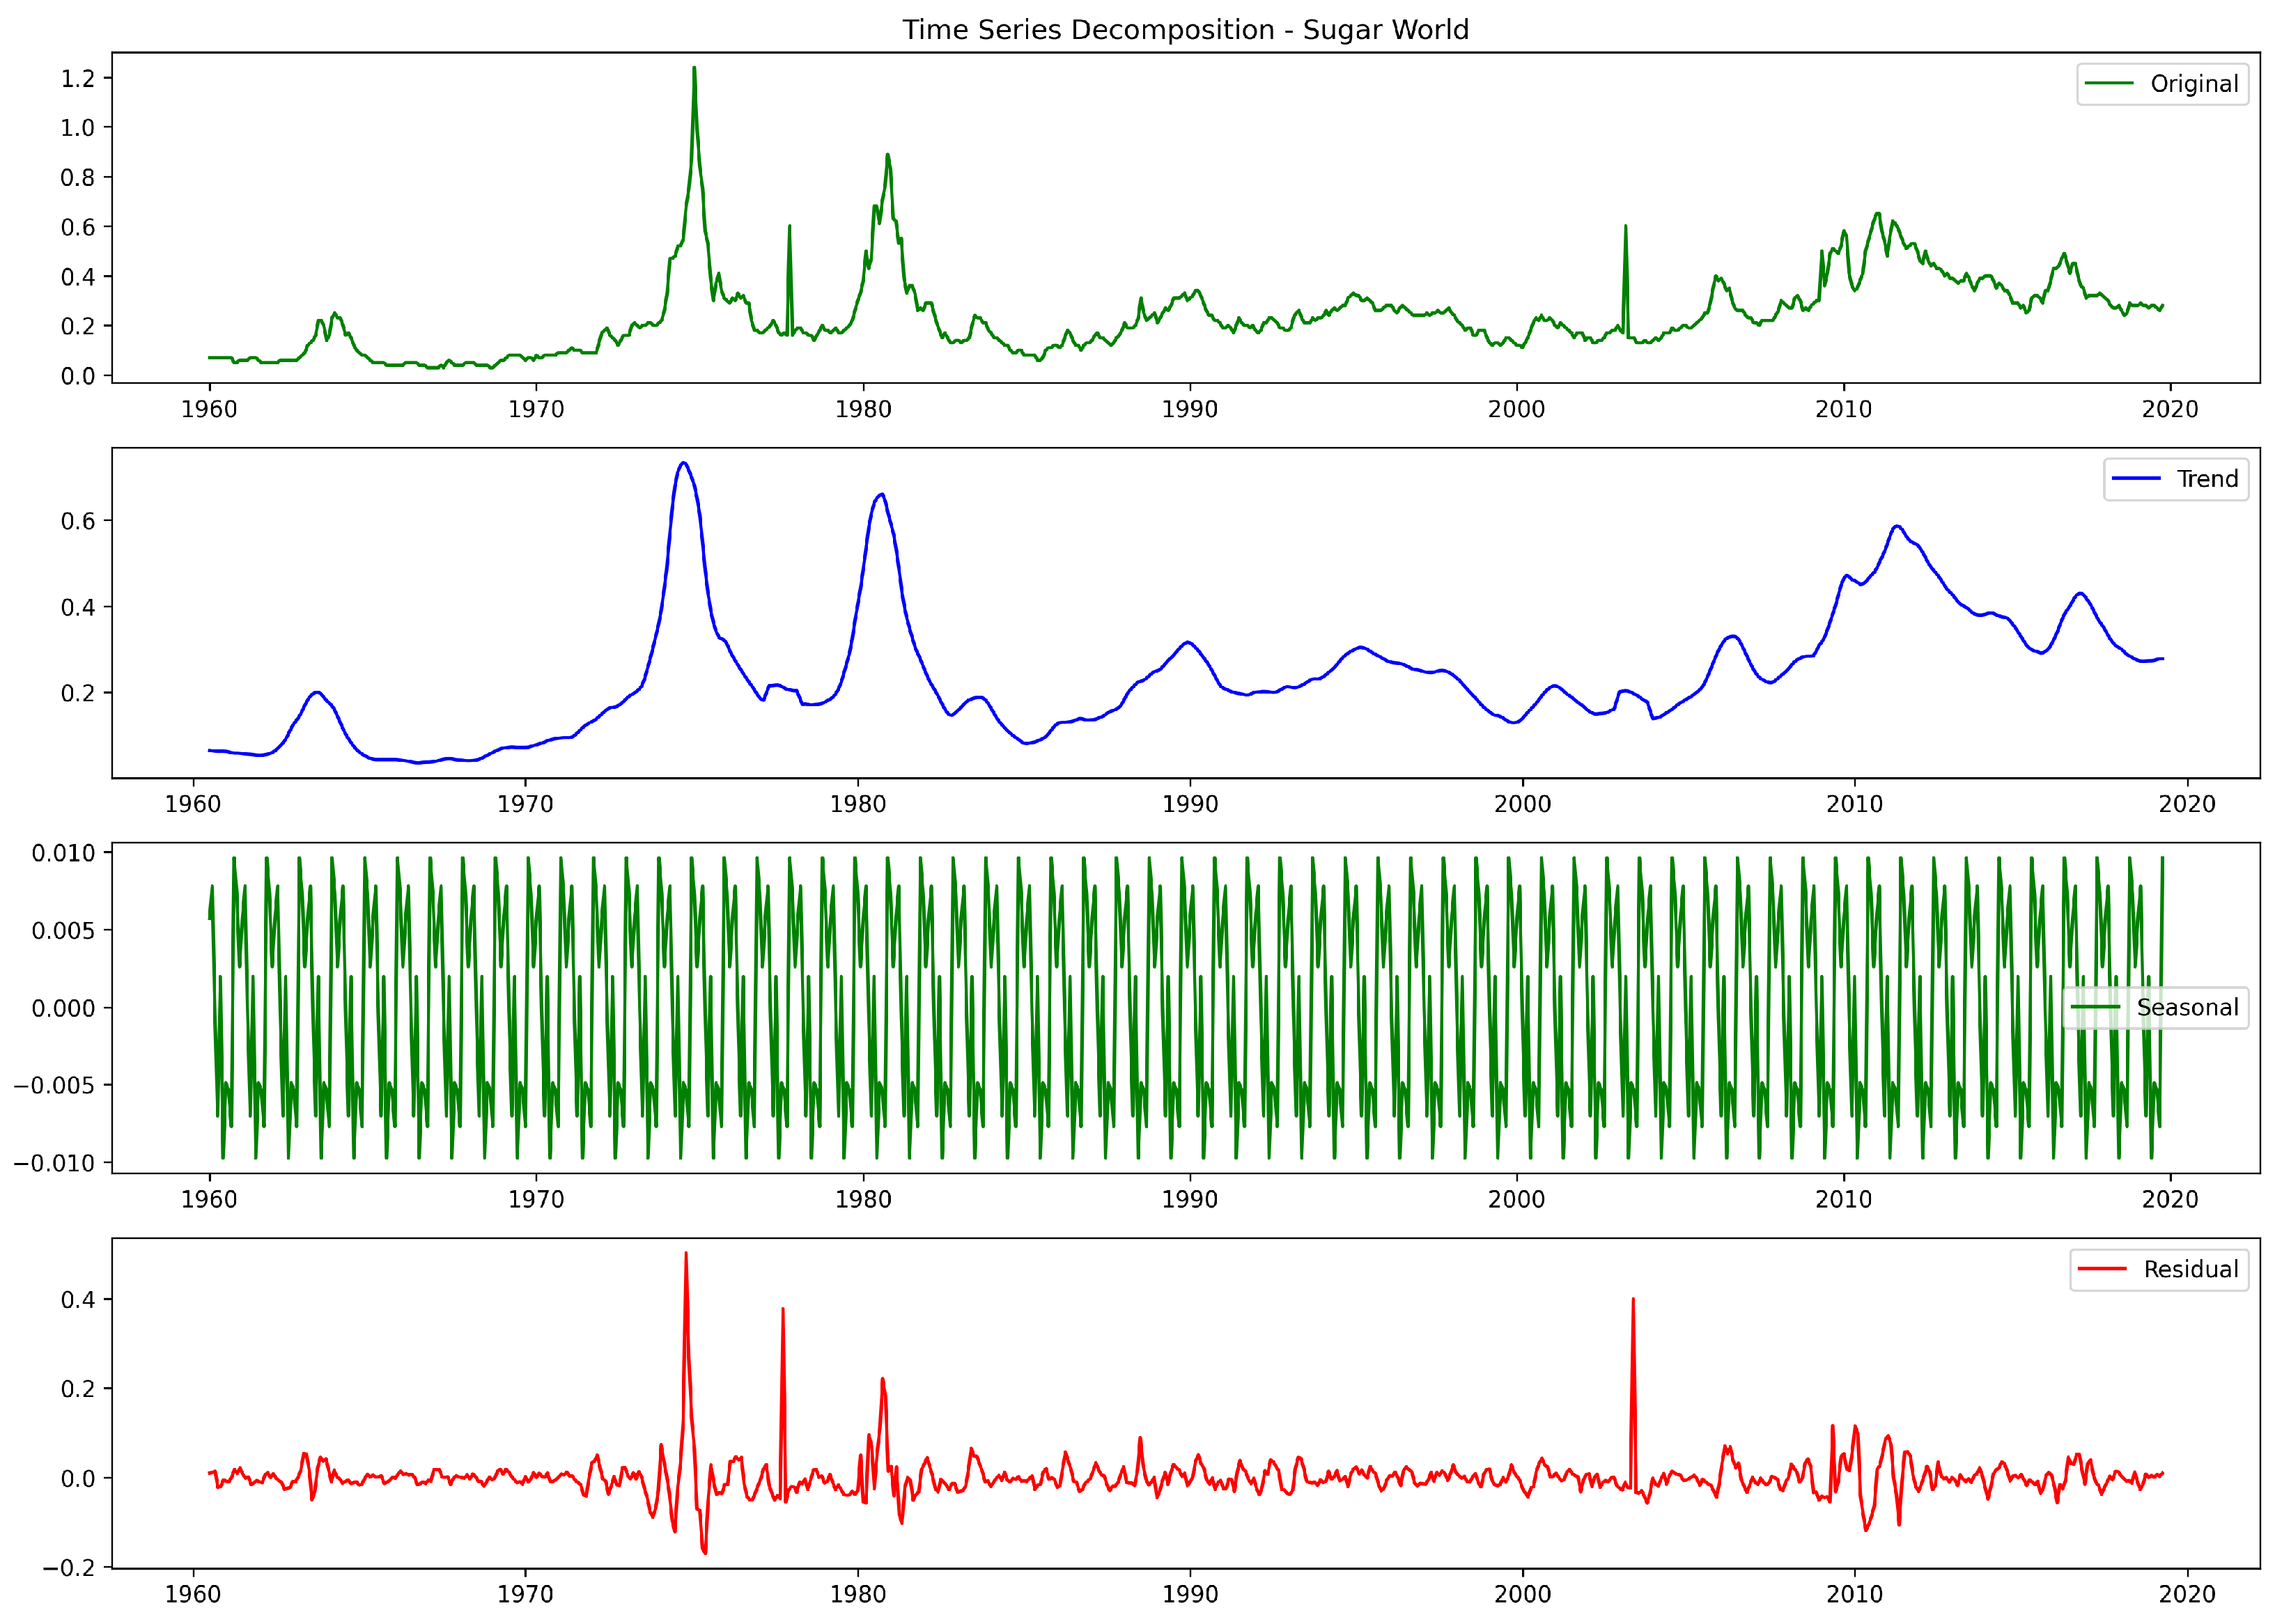
3. Data Analysis and Processing

This section presents the details of the databases used in this work. The historical data from the European Union, the United States, and the World are available on The World Bank website [52]. The samples for Brazilian sugar prices were obtained at the Center for Advanced Studies in Applied Economics-CEPEA [53].
The database from Brazil (Figure 3) corresponds to monthly prices in Reais (R$) (Brazilian currency) per kilogram and comprises the period from May 2003 to March 2020, totaling 203 samples. The European Union (Figure 4), the United States (Figure 5), and the World (Figure 6) databases correspond to monthly prices per kilogram in US dollars (US$) and comprise the period from January 1960 to October 2019, totaling 718 samples. The series was collected until March 2020.
Figure 7, Figure 8, Figure 9 and Figure 10 present the STL decomposition of each series into trend, seasonality and residual components [54].
In order to detect the presence of the trend component, the Kendall test was applied for each series. This component was detected only in the United States series. Thus, the differentiation method made the series approximately stationary [28].
Seasonality can be identified using the Friedman test [28]. It was found that all series were not stationary because they present seasonal components. In this sense, applying an adjustment that excludes the seasonal influences is required. After this process, the series becomes approximately stationary, presenting zero mean and unitary standard deviation, which are mandatory for applying the linear methods. The seasonal adjustment function used in this work was the Z-Score, given by Equation (5):
z t , s = x t , s μ s σ s
in which z t , s is the new adjusted price, x t , s represents the original sugar price in time t, μ s is the mean, σ s is the standard deviation, and s = 1 , , 12 is the seasonality index (in this case, the index of each month) [43].
Next, Figure 11 and Figure 12 were expanded upon to analyze the autocorrelation function (ACF) and partial autocorrelation function (PACF) of each series, respectively. To achieve this, we considered up to 80 lags and the adjusted series.
The ACF of the E.U. and USA present a slow and constant decay, considering the decrease in the correlation of the samples. On the other hand, the ACF of the World and Brazil show an exponential decay. These formed functions present characteristics analogous to those of a combination of sine and damped exponentials, indicating that the generating process is associated with an autoregressive model [28].
Regarding the PACF, the E.U. series presents up to 6 significant lags, the highest value. The other series are limited to 4 lags [28].
To perform the experiments, a separation in the dataset was split into three groups- training, validation, and testing–in which the temporal order is respected. The first 66.67% were used for training, the following 17.01% for validation, and the last 16.32% for testing. Such separation is necessary for the application of Artificial Neural Networks. It is unnecessary for the AR and ARMA models to carry out validation, so the training and validation sets were used to adjust the models. This way, the test set presents the same size and samples for all experiments.
The wrapper method was used to select the most relevant inputs for the ANNs, which performs a systematic search for the best variables [41]. An exhaustive search was carried out for the AR and ARMA models, considering up to order 6. Table 1 presents the selected lags for the ANNs, the p order of the AR models, and the p and q orders of the ARMA models, considering the four series addressed. In Table 1, the inputs are problem-dependent, meaning that the best entries often differ when using the wrapper methodology.

Performance Assessment

To evaluate the results obtained some of the error metrics most frequently used in forecasting tasks are addressed: Mean Absolute Error (MAE), Mean Squared Error (MSE) [41,43]. They are given by the Equations (6) and (7):
M A E = 1 n i = 1 n | e i |
M S E = 1 n i = 1 n e i 2
in which | e i | represents the absolute error, that is, the difference between the predicted value and the real value for n samples.

4. Results and Discussion

This section presents and discusses the forecasting results achieved for Brazil, the European Union, the United States, and world sugar prices. The forecasting methods are shown in Section 2.
To determine the number of neurons for the unique hidden layer of each neural network, a grid search considering from 5 up to 50 neurons was performed for each architecture. Also, 30 independent rounds of simulation were executed for the neural models.
Table 2, Table 3, Table 4 and Table 5 show the best result of the test set for 30 rounds, considering 1-, 3-, 6- and 12 steps-ahead forecasting, respectively. In these tables, NN denotes the number of neurons in the hidden layer of the best configuration. The values in bold represent the most minor errors for each database.
The Wilcoxon test was applied to the results regarding the MSE in the test set. The p-values achieved were close to zero (below 10 6 ). Therefore, we can assume that changing the predictor implies a significant change in the results [29].
It is possible to notice that as the forecasting horizon increases, there is a tendency for errors to increase. This is partly due to the decreasing correlation between the desired inputs and outputs. Figure 11 reveals this behavior, as the lags are less correlated as the temporal distance among the samples increases. Also, the best predictor for MSE is often different for MAE. This behavior can occur since the used metrics penalize the difference between the desired response and the model’s output differently. The MSE strongly penalizes the highest differences, since it uses the square operation. This was observed in previous studies on time series forecasting [40,41].
By analyzing the values highlighted in bold, it is possible to observe that the linear models (specifically the AR) were the winners, only considering one step ahead of the European Union and the MAE. Furthermore, the ARMA and the Jordan network did not show the best results for any scenario.
Observing Table 2, it was noted that the Elman and Jordan networks did not present highlighted results. However, the other recurrent proposal, ESN, created by Jaeger and Ozturk et al., achieved the smallest MSE for three of four series and the best MAE for the world series. The other cases favored the MLP (best MAE for Brazil and the USA) and ELM (best MSE for the EU). In summary, considering the MSE, the most-used metric for forecasting purposes, the unorganized approaches (ELM and ESN) stood out. This is an interesting finding, since these methods are simple to implement and fast to adjust.
The results were different for three steps-ahead prediction. The ELM and Elman performed better, except for the USA, in which the MLP achieved the best errors.
Regarding the six- and twelve steps-ahead horizon, a pattern was observed. The Elman network, ESN-Ozturk et al., and MLP achieved the smallest errors for both metrics considering the Brazil, EU, and USA datasets, respectively. ELM and ESN-Jaeger were the best for the world dataset.
In order to show the general ranking of the models, Table 6 was created based on Borda Count Methodology [55], considering all forecasting horizons. In this case, “N. wins” means the number of wins each model achieved.
The linear models (AR and ARMA) achieved just one best result. This observation was expected since neural models are nonlinear techniques capable of approximating any dataset with a small error. The approach is more flexible than linear structures due to the presence of the nonlinear activation functions in the hidden layer, justifying their wide application in time series prediction [41,51,56]. However, it is essential to mention that the ANNs must be carefully adjusted to avoid overtraining. In this case, the model may “learn” the training samples, but it becomes unable to generalize or indicate a suitable response for unknown samples (test).
Considering the general results of the ANNs, the Jordan network did not perform well. This is remarkable, since the Elman network, which presents a structure with a high similarity to the Jordan proposal, was the best for many cases. Indeed, the delayed output of the hidden layer seems to present more useful information in the composition of the formation of the response of the model than the output response.
The MLP was the architecture that achieved the best results, followed by the Elman network. As can be observed, the results are miscellaneous, but the Elman network was the best for multistep forecasting for Brazil, as well as the MLP for the USA.
The unorganized approaches performed well, too. We highlight the ESN-Jaeger for one step ahead and the ELM for three steps ahead. This is a good indication, since these methods are more accessible in adjusting the parameters, and there is no instability in the response due to a vanishing gradient, as in classic RNN approaches [42]. These results are interesting because they corroborate the findings of previous studies that dealt with daily samples [3].
Finally, Figure 13, Figure 14, Figure 15 and Figure 16 present the output of the best predictor according to the MSE, considering one step-ahead forecasting for the test set of Brazil, the European Union, the United States, and the world, respectively.

5. Conclusions

This study investigated the application of several models to predict the sugar prices from four databases: Brazil, the European Union, the United States, and the world databases. This is an essential task, as sugar is present in several sectors of the economy. Also, it presents a fragmented global market, which is evident from its high volatility.
For this purpose, several prediction methods were evaluated: linear methods (AR and ARMA) and Artificial Neural Networks (MLP, ELM, Elman, Jordan, ESN-Jaeger, and ESN-Ozturk et al.). In this case, the Wrapper method selected the number of inputs of each model. Furthermore, different forecast horizons were considered: P = 1, 3, 6, and 12 steps ahead.
In general, the computational results show superior performance for the neural models. This is unsurprising, since real-world problems are often complex, with linear and nonlinear components. The ability of these methods to process nonlinear information is one of the most important advantages of ANN compared to traditional statistical approaches.
For future investigations, it is suggested to investigate the application of combination models, such as Ensembles and Hybrid Models, based on Error Correction. In addition, using deep neural models is an interesting possibility, mainly applying Long Short-Term Memory (LSTM) networks due to the encouraging results in forecasting tasks reported in the literature [57,58,59,60]. Finally, a comparison of the findings of this work and the use of equilibrium models should be evaluated.

Author Contributions

Conceptualization, T.M.B., P.B. and H.V.S.; methodology, T.M.B., P.B. and H.V.S.; software, T.M.B., P.B. and J.L.F.d.S.; validation, F.C.C., Y.R.K. and S.L.S.J.; formal analysis, F.C.C., Y.R.K., S.L.S.J. and H.V.S.; investigation, T.M.B., P.B., H.N.R. and J.L.F.d.S.; resources, H.V.S.; data curation, T.M.B., P.B. and Y.R.K.; writing—original draft preparation, T.M.B., J.L.F.d.S., S.L.S.J. and H.V.S.; writing—review and editing, P.B., Y.R.K. and F.C.C.; visualization, Y.R.K., H.N.R. and F.C.C.; supervision, Y.R.K. and H.V.S.; project administration, Y.R.K. and H.V.S.; funding acquisition, H.V.S. All authors have read and agreed to the published version of the manuscript.

Funding

This research received no external funding.

Institutional Review Board Statement

Not applicable.

Informed Consent Statement

Not applicable.

Data Availability Statement

Data are contained within the article.

Conflicts of Interest

The authors declare no conflicts of interest.

References

  1. OECD-FAO. OECD-FAO Agricultural Outlook 2019. 2023. Available online: https://www.oecd.org/agriculture/oecd-fao-agricultural-outlook-2019/ (accessed on 1 March 2021).
  2. Salehi, R.; Asaadi, M.A.; Rahimi, M.H.; Mehrabi, A. The information technology barriers in supply chain of sugarcane in Khuzestan province, Iran: A combined ANP-DEMATEL approach. Inf. Process. Agric. 2021, 8, 458–468. [Google Scholar] [CrossRef]
  3. Silva, N.; Siqueira, I.; Okida, S.; Stevan, S.L.; Siqueira, H. Neural Networks for Predicting Prices of Sugarcane Derivatives. Sugar Tech 2019, 21, 514–523. [Google Scholar] [CrossRef]
  4. Deina, C.; Prates, M.H.d.A.; Alves, C.H.R.; Martins, M.S.R.; Trojan, F.; Stevan, S.L., Jr.; Siqueira, H.V. A methodology for coffee price forecasting based on extreme learning machines. Inf. Process. Agric. 2022, 9, 556–565. [Google Scholar] [CrossRef]
  5. Maitah, M.; Smutka, L. The Development of World Sugar Prices. Sugar Tech 2019, 21, 1–8. [Google Scholar] [CrossRef]
  6. der Mensbrugghe, D.V.; Beghin, J.C.; Mitchell, D. Modeling Tariff Rate Quotas in a Global Context: The Case of Sugar Markets in OECD Countries; Food and Agricultural Policy Research Institute (FAPRI): Ames, IA, USA, 2003. [Google Scholar]
  7. OECD and Food and Agriculture Organization of the United Nations. OECD-FAO Agricultural Outlook 2016–2025; OECD: Paris, France, 2016; 136p. [Google Scholar] [CrossRef]
  8. Rumánková, L.; Smutka, L.; Maitah, M.; Benešová, I. The Interrelationship between Sugar Prices at the Main World Sugar Commodities Markets. Sugar Tech 2019, 21, 853–861. [Google Scholar] [CrossRef]
  9. Van der Eng, P. Agricultural Growth in Indonesia: Productivity Change and Policy Impact since 1880; Springer: London, UK, 1996. [Google Scholar]
  10. Yara Brasil. Produção Mundial de Cana-de-Açúcar. Available online: https://www.yarabrasil.com.br/conteudo-agronomico/blog/producao-mundial-de-cana-de-acucar/ (accessed on 1 March 2021).
  11. OECD and Food and Agriculture Organization of the United Nations. OECD-FAO Agricultural Outlook 2019–2028; OECD: Paris, France, 2019; 326p, Available online: https://www.oecd-ilibrary.org/content/publication/agr_outlook-2019-en (accessed on 1 March 2021).
  12. USDA; FAS. Sugar: World Markets and Trade. 2020. Available online: https://fas.usda.gov/data/sugar-world-markets-and-trade (accessed on 1 March 2021).
  13. Lin, B.; Variyam, J.N.; Allshouse, J.E.; Cromartie, J. Food and Agricultural Commodity Consumption in the United States: Looking Ahead To 2020; Agricultural Economic Reports, Number 33959; United States Department of Agriculture, Economic Research Service: Washington, DC, USA, 2003; Available online: https://ideas.repec.org/p/ags/uerser/33959.html (accessed on 1 March 2021).
  14. Pagani, V.; Stella, T.; Guarneri, T.; Finotto, G.; Berg, M.v.; Marin, F.R.; Acutis, M.; Confalonieri, R. Forecasting sugarcane yields using agro-climatic indicators and Canegro model: A case study in the main production region in Brazil. Agric. Syst. 2017, 154, 45–52. [Google Scholar] [CrossRef]
  15. Amrouk, E.M.; Heckelei, T. Forecasting International Sugar Prices: A Bayesian Model Average Analysis. Sugar Tech 2020, 22, 552–562. [Google Scholar] [CrossRef]
  16. Adenäuer, M.; Louhichi, K.; de Frahan, B.H.; Witzke, H.P. Impact of the “Everything but Arms” Initiative on the EU Sugar Sub-Sector. EcoMod2004, 2010, 330600001. Available online: https://ideas.repec.org/p/ekd/003306/330600001.html (accessed on 1 March 2021).
  17. Nolte, S.; Buysse, J.; Huylenbroeck, G.V. Modelling the Effects of an Abolition of the EU Sugar Quota on Internal Prices, Production, and Imports. In Proceedings of the 114th Seminar, Berlin, Germany, 15–16 April 2010; European Association of Agricultural Economists: Wageningen, The Netherlands, 2010. Available online: https://ideas.repec.org/p/ags/eaa114/61346.html (accessed on 1 March 2021).
  18. Stephen Haley. World Raw Sugar Prices: The Influence of Brazilian Costs of Production and World Surplus/Deficit Measures; United States Department of Agriculture: Washington, DC, USA, 2013.
  19. Haley, S. Projecting World Raw Sugar Prices; EMS/USDA: Washington, DC, USA, 2015.
  20. Chang, C.; McAleer, M.; Wang, Y. Modelling Volatility Spillovers for Bio-ethanol, Sugarcane and Corn Spot and Futures Prices. Renew. Sustain. Energy Rev. 2018, 81, 1002–1018. [Google Scholar] [CrossRef]
  21. Rabobank. Sugar Quarterly Q4 2020. Available online: https://research.rabobank.com/far/en/sectors/sugar/sugar-quarterly-q4-2020.html (accessed on 1 March 2021).
  22. Bisgaard, S.; Kulahci, M. Time Series Analysis and Forecasting by Example; John Wiley & Sons: Hoboken, NJ, USA, 2011. [Google Scholar]
  23. Ribeiro, C.; Oliveira, S. A Hybrid Commodity Price-Forecasting Model Applied to the Sugar–Alcohol Sector. Aust. J. Agric. Resour. Econ. 2011, 55, 180–198. [Google Scholar] [CrossRef]
  24. de Melo, B.; Milioni, A.Z.; Júnior, C.L.N. Daily and Monthly Sugar Price Forecasting Using the Mixture of Local Expert Models. Pesqui. Oper. 2007, 27, 235–246. [Google Scholar] [CrossRef]
  25. Esam, A.B. Economic Modelling and Forecasting of Sugar Production and Consumption in Egypt. Int. J. Agric. Econ. 2017, 2, 96–109. [Google Scholar] [CrossRef]
  26. Mehmood, Q.; Sial, M.H.; Riaz, M.; Shaheen, N. Forecasting the Production of Sugarcane in Pakistan for the Year 2018–2030, Using Box-Jenkin’s Methodology. JAPS J. Anim. Plant Sci. 2019, 29, 1396–1401. [Google Scholar]
  27. Vishawajith, K.P.; Sahu, P.K.; Dhekale, B.S.; Mishra, P. Modelling and Forecasting Sugarcane and Sugar Production in India. Indian J. Econ. Dev. 2016, 12, 71–80. [Google Scholar] [CrossRef]
  28. Box, G.E.P.; Jenkins, G.M.; Reinsel, G.C.; Ljung, G.M. Time Series Analysis: Forecasting and Control; John Wiley & Sons: Hoboken, NJ, USA, 2015. [Google Scholar]
  29. Santos, D.S.d., Jr.; Neto, P.S.G.d.; Oliveira, J.a.F.L.d.; Siqueira, H.V.; Barchi, T.M.; Lima, A.R.; Madeiro, F.; Dantas, D.A.P.; Converti, A.; Pereira, A.C.; et al. Solar Irradiance Forecasting Using Dynamic Ensemble Selection. Appl. Sci. 2022, 12, 3510. [Google Scholar] [CrossRef]
  30. Nayak, S.K.; Nayak, S.C.; Das, S. Modeling and Forecasting Cryptocurrency Closing Prices with Rao Algorithm-Based Artificial Neural Networks: A Machine Learning Approach. FinTech 2021, 1, 47–62. [Google Scholar] [CrossRef]
  31. Neto, P.S.G.d.; Oliveira, J.a.F.L.d.; Júnior, D.S.d.O.S.; Siqueira, H.V.; Marinho, M.H.D.N.; Madeiro, F. A Hybrid Nonlinear Combination System for Monthly Wind Speed Forecasting. IEEE Access 2020, 8, 191365–191377. [Google Scholar] [CrossRef]
  32. Suresh, K.K.; Priya, S.R.K. Forecasting Sugarcane Yield of Tamilnadu Using ARIMA Models. Sugar Tech 2011, 13, 23–26. [Google Scholar] [CrossRef]
  33. Kotu, V.; Deshpande, B. (Eds.) Chapter 12–Time Series Forecasting. In Data Science, 2nd ed.; Morgan Kaufmann: Burlington, MA, USA, 2019; pp. 395–445. ISBN 978-0-12-814761-0. [Google Scholar] [CrossRef]
  34. Gyamerah, S.A.; Arthur, J.; Akuamoah, S.W.; Sithole, Y. Measurement and Impact of Longevity Risk in Portfolios of Pension Annuity: The Case in Sub Saharan Africa. FinTech 2023, 2, 48–67. [Google Scholar] [CrossRef]
  35. Siqueira, H.; Luna, I.; Alves, T.A.; Tadano, Y.d. The Direct Connection Between Box & Jenkins Methodology and Adaptive Filtering Theory. Math. Eng. Sci. Aerosp. (MESA) 2019, 10, 27. [Google Scholar]
  36. Maceira, M.E.P.; Damázio, J.M. Use of the PAR (p) Model in the Stochastic Dual Dynamic Programming Optimization Scheme Used in the Operation Planning of the Brazilian Hydropower System. Probab. Eng. Inf. Sci. 2006, 20, 143–156. [Google Scholar] [CrossRef]
  37. Hong, Y. Hypothesis Testing in Time Series via the Empirical Characteristic Function: A Generalized Spectral Density Approach. J. Am. Stat. Assoc. 1999, 94, 1201–1220. [Google Scholar] [CrossRef]
  38. Kosmas, I.; Papadopoulos, T.; Dede, G.; Michalakelis, C. The Use of Artificial Neural Networks in the Public Sector. FinTech 2023, 2, 138–152. [Google Scholar] [CrossRef]
  39. Belotti, J.; Siqueira, H.; Araujo, L.; Stevan, S.L., Jr.; de Mattos Neto, P.S.; Marinho, M.H.N.; Oliveira, J.F.L.d.; Usberti, F.; Filho, M.d.A.L.; Converti, A.; et al. Neural-based ensembles and unorganized machines to predict streamflow series from hydroelectric plants. Energies 2020, 13, 4769. [Google Scholar] [CrossRef]
  40. Siqueira, H.V.; Boccato, L.; Attux, R.; Filho, C.L. Echo state networks in seasonal streamflow series prediction. Learn. Nonlinear Model. 2012, 10, 181–191. [Google Scholar] [CrossRef]
  41. Siqueira, H.; Boccato, L.; Attux, R.; Lyra, C. Unorganized machines for seasonal streamflow series forecasting. Int. J. Neural Syst. 2014, 24, 1430009. [Google Scholar] [CrossRef]
  42. Haykin, S. Neural Networks: A Comprehensive Foundation; Prentice-Hall, Inc.: Hoboken, NJ, USA, 2007. [Google Scholar]
  43. Siqueira, H.; Luna, I. Performance comparison of feedforward neural networks applied to streamflow series forecasting. Math. Eng. Sci. Aerosp. (MESA) 2019, 10, 41. [Google Scholar]
  44. Huang, G.; Zhu, Q.; Siew, C. Extreme learning machine: A new learning scheme of feedforward neural networks. In Proceedings of the 2004 IEEE International Joint Conference on Neural Networks (IEEE Cat. No.04CH37541), Budapest, Hungary, 25–29 July 2004; Volume 2, pp. 985–990. [Google Scholar]
  45. Yu, H.; Yang, L.; Li, D.; Chen, Y. A hybrid intelligent soft computing method for ammonia nitrogen prediction in aquaculture. Inf. Process. Agric. 2021, 8, 64–74. [Google Scholar] [CrossRef]
  46. Tadano, Y.d.; Siqueira, H.V.; Alves, T.A. Unorganized machines to predict hospital admissions for respiratory diseases. In Proceedings of the 2016 IEEE Latin American Conference on Computational Intelligence (LA-CCI), Cartagena, Colombia, 2–4 November 2016; pp. 1–6. [Google Scholar]
  47. Huang, G.; Zhu, Q.; Siew, C. Extreme Learning Machine: Theory and Applications. Neurocomputing 2006, 70, 489–501. [Google Scholar] [CrossRef]
  48. Nahvi, B.; Habibi, J.; Mohammadi, K.; Shamshirband, S.; Razgan, O.S.A. Using self-adaptive evolutionary algorithm to improve the performance of an extreme learning machine for estimating soil temperature. Comput. Electron. Agric. 2016, 124, 150–160. [Google Scholar] [CrossRef]
  49. Jaeger, H. The “Echo State” Approach to Analysing and Training Recurrent Neural Networks-with an Erratum Note; GMD Technical Report; German National Research Center for Information Technology: Bonn, Germany, 2001; Volume 148, p. 13. [Google Scholar]
  50. Ozturk, M.C.; Xu, D.; Principe, J.C. Analysis and Design of Echo State Networks. Neural Comput. 2007, 19, 111–138. [Google Scholar] [CrossRef]
  51. Belotti, J.; Mendes, J.J.; Leme, M.; Trojan, F.; Stevan, S.L.; Siqueira, H. Comparative Study of Forecasting Approaches in Monthly Streamflow Series from Brazilian Hydroelectric Plants using Extreme Learning Machines and Box & Jenkins Models. J. Hydrol. Hydromech. 2021, 69, 180–195. [Google Scholar]
  52. The World Bank. Commodity Markets-Sugar Price. 2019. Available online: https://www.worldbank.org/en/research/commodity-markets (accessed on 1 March 2021).
  53. CEPEA, Center for Advanced Studies in Applied Economy. Sugar Price-Brazil. 2019. Available online: http://cepea.esalq.usp.br (accessed on 21 August 2019).
  54. Hyndman, R.J.; Athanasopoulos, G. Forecasting: Principles and Practice; OTexts: Melbourne, Australia, 2021. [Google Scholar]
  55. Guerreiro, M.T.; Guerreiro, E.M.A.; Barchi, T.M.; Biluca, J.; Alves, T.A.; Tadano, Y.d.; Trojan, F.; Siqueira, H.V. Anomaly detection in automotive industry using clustering methods—A case study. Appl. Sci. 2021, 11, 9868. [Google Scholar] [CrossRef]
  56. Jevšenak, J.; Levanič, T. Should artificial neural networks replace linear models in tree ring based climate reconstructions? Dendrochronologia 2016, 40, 102–109. [Google Scholar] [CrossRef]
  57. Morid, M.A.; Sheng, O.R.L.; Dunbar, J. Time Series Prediction Using Deep Learning Methods in Healthcare. Assoc. Comput. Mach. 2023, 14, 1–29. [Google Scholar] [CrossRef]
  58. Zhang, H.; Wang, C.; Tian, S.; Lu, B.; Zhang, L.; Ning, X.; Bai, X. Deep learning-based 3D point cloud classification: A systematic survey and outlook. Displays 2023, 79, 102456. [Google Scholar] [CrossRef]
  59. Sharifani, K.; Amini, M. Machine Learning and Deep Learning: A Review of Methods and Applications. World Inf. Technol. Eng. J. 2023, 10, 3897–3904. [Google Scholar]
  60. Wang, C.; Ning, X.; Sun, L.; Zhang, L.; Li, W.; Bai, X. Learning discriminative features by covering local geometric space for point cloud analysis. IEEE Trans. Geosci. Remote Sens. 2022, 60, 1–15. [Google Scholar] [CrossRef]
Figure 1. ELM architecture.
Fintech 03 00013 g001
Figure 2. ESN architecture.
Fintech 03 00013 g002
Figure 3. Sugar price data—Brazil.
Fintech 03 00013 g003
Figure 4. Sugar price data—EU.
Fintech 03 00013 g004
Figure 5. Sugar price data—USA.
Fintech 03 00013 g005
Figure 6. Sugar price data—world.
Fintech 03 00013 g006
Figure 7. Decomposition—Brazil.
Fintech 03 00013 g007
Figure 8. Decomposition—EU.
Fintech 03 00013 g008
Figure 9. Decomposition—EUA.
Fintech 03 00013 g009
Figure 10. Decomposition—world.
Fintech 03 00013 g010
Figure 11. Autocorrelation Function.
Fintech 03 00013 g011
Figure 12. Partial Autocorrelation Function.
Fintech 03 00013 g012
Figure 13. Brazil actual × predicted.
Fintech 03 00013 g013
Figure 14. EU actual × predicted.
Fintech 03 00013 g014
Figure 15. USA actual × predicted.
Fintech 03 00013 g015
Figure 16. World actual × predicted.
Fintech 03 00013 g016
Table 1. Input lags for each model according to the database.
SeriesModels
BrazilARp = 3
ARMAp = 1, q = 6
MLP(1, 2)
ELM(1, 2, 3, 5)
Elman(1, 2)
Jordan(1, 2, 6)
ESN-Jaeger(1, 2, 3)
ESN-Ozturk et al.(1, 2, 4, 5)
European UnionARp = 1
ARMAp = 1, q = 2
MLP(1, 5)
ELM(1, 5)
Elman(3, 5)
Jordan(1)
ESN-Jaeger(1, 5)
ESN-Ozturk et al.(1, 3)
United StatesARp = 2
ARMAp = 1, q = 6
MLP(1, 6, 5, 4)
ELM(1, 4, 5, 2)
Elman(3, 1, 4)
Jordan(1, 2, 3, 4, 5)
ESN-Jaeger(1, 5)
ESN-Ozturk et al.(1)
WorldARp = 3
ARMAp = 2, q = 4
MLP(1, 2)
ELM(1, 2)
Elman(1, 2)
Jordan(1, 2)
ESN-Jaeger(1, 2, 4)
ESN-Ozturk et al.(1)
Table 2. Errors achieved by the forecasting models considering 1 step-ahead prediction.
Error MetricBrazilE. UnionUSAWorld
ARMSE0.0066190.0000850.0005070.000862
MAE0.0621400.0068410.0168970.021225
ARMAMSE0.0296780.0000890.0015910.002554
MAE0.1319950.0070730.0299610.036826
MLPNN10202020
MSE0.0070940.0001190.0004970.000838
MAE0.0594270.0088000.0167240.020473
ELMNN1015155
MSE0.0067870.0000800.0005050.000807
MAE0.0626980.0069240.0170990.020540
ELMANNN515155
MSE0.0075620.0003030.0010070.000907
MAE0.0618300.0137660.0247280.021884
JORDANNN1020205
MSE0.0087570.0001090.0005250.000810
MAE0.0746230.0086440.0175550.020608
ESN-JaegerNN520205
MSE0.0065900.0000830.0004770.000786
MAE0.0611120.0072090.0167230.020070
ESN-Ozturk et al.NN1020205
MSE0.0072160.0000880.0004740.000808
MAE0.0682460.0073910.0167930.020520
Table 3. Errors achieved by the forecasting models considering 3 steps-ahead prediction.
Error MetricBrazilE. UnionUSAWorld
ARMSE0.0394940.0003120.0019900.003883
MAE0.1478340.0139430.0337600.044318
ARMAMSE0.0615130.0003220.0033460.004903
MAE0.1892040.0139770.0430250.051552
MLPNN10201020
MSE0.0445940.0005950.0018250.003931
MAE0.1582580.0190430.0303790.045695
ELMNN1015205
MSE0.0496010.0002870.0020480.003379
MAE0.1790470.0139660.0349500.042695
ELMANNN5555
MSE0.0386620.0003230.0046250.018931
MAE0.1464550.0136960.0597070.112465
JORDANNN1020105
MSE0.0896990.0005190.0021360.004182
MAE0.2499850.0187760.0339110.048144
ESN-JaegerNN520105
MSE0.0473910.0003710.0030450.005412
MAE0.1750080.0151390.0392090.052192
ESN-Ozturk et al.NN105105
MSE0.1475450.0003360.0036980.004861
MAE0.309560.0141350.0446120.051995
Table 4. Errors achieved by the forecasting models considering 6 steps-ahead prediction.
Error MetricBrazilE. UnionUSAWorld
ARMSE0.0695700.0008420.0044660.007233
MAE0.2035880.0222350.0480160.064934
ARMAMSE0.0989700.0009100.0070330.007155
MAE0.2473300.0226790.0616770.063863
MLPNN10201020
MSE0.0707320.0018990.0036910.008879
MAE0.2158560.0325070.0438010.076295
ELMNN1015205
MSE0.1131700.0009650.0054500.006052
MAE0.2544390.0225970.0552130.059288
ELMANNN5555
MSE0.0611910.0007140.0151020.030949
MAE0.2000870.0212260.1091640.146331
JORDANNN1020105
MSE0.1054310.0021660.0048390.007149
MAE0.2698620.0364790.0530720.067726
ESN-JaegerNN520105
MSE0.1048360.0009400.0054690.006602
MAE0.2557970.0234340.0533600.058841
ESN-Ozturk et al.NN105105
MSE0.0907180.0006310.0074900.007044
MAE0.2469070.0201410.0644200.064654
Table 5. Errors achieved by the forecasting models considering 12 steps-ahead prediction.
Error MetricBrazilE. UnionUSAWorld
ARMSE0.1100620.0017940.0125350.010816
MAE0.2663670.0319700.0807440.087272
ARMAMSE0.2064220.0020890.0189410.011183
MAE0.3543840.0336240.1028930.085991
MLPNN10201020
MSE0.0885110.0058460.0103900.019925
MAE0.2508430.0613020.0791910.119357
ELMNN1015205
MSE0.1432460.0028460.0203970.008954
MAE0.2959270.0375360.1101220.078879
ELMANNN5555
MSE0.0928920.0014030.0355250.042697
MAE0.2473830.0296940.1702430.180500
JORDANNN1020105
MSE0.1208460.0067250.0175710.013186
MAE0.2764430.0652250.0867540.097899
ESN-JaegerNN520105
MSE0.1466390.0022920.0282070.009144
MAE0.3007210.0344100.1002930.076992
ESN-Ozturk et al.NN105105
MSE0.1280090.0010430.0149850.009644
MAE0.2910280.0264850.0943920.081244
Table 6. Ranking of applied models considering all bases and different forecast horizons.
Models1 Step3 Steps6 Steps12 StepsN. Wins
MSE MAE MSE MAE MSE MAE MSE MAE
AR 1 1
ARMA 0
MLP 21111118
ELM1 211 1 6
ELMAN 1211117
JORDAN 0
ESN-Jaeger21 1 15
ESN-Ozturk1 11115
Disclaimer/Publisher’s Note: The statements, opinions and data contained in all publications are solely those of the individual author(s) and contributor(s) and not of MDPI and/or the editor(s). MDPI and/or the editor(s) disclaim responsibility for any injury to people or property resulting from any ideas, methods, instructions or products referred to in the content.

