

Explaining the Factors Affecting Customer Satisfaction at the Fintech Firm F1 Soft by Using PCA and XAI

 , , ,
, , ,
Abstract
1. Introduction
- to explore and clarify the major influencing factors of customer satisfaction in fintech industry, by virtue of studying F1 Soft of Nepal; and
- to implement the ML model and interpret the results with LIME and SHAP.
2. Related Works
2.1. Customer Satisfaction
2.2. Principal Component Analysis
2.3. Machine Learning
3. Data and Methodology
3.1. Data Collection
3.2. Sampling Adequacy Measure
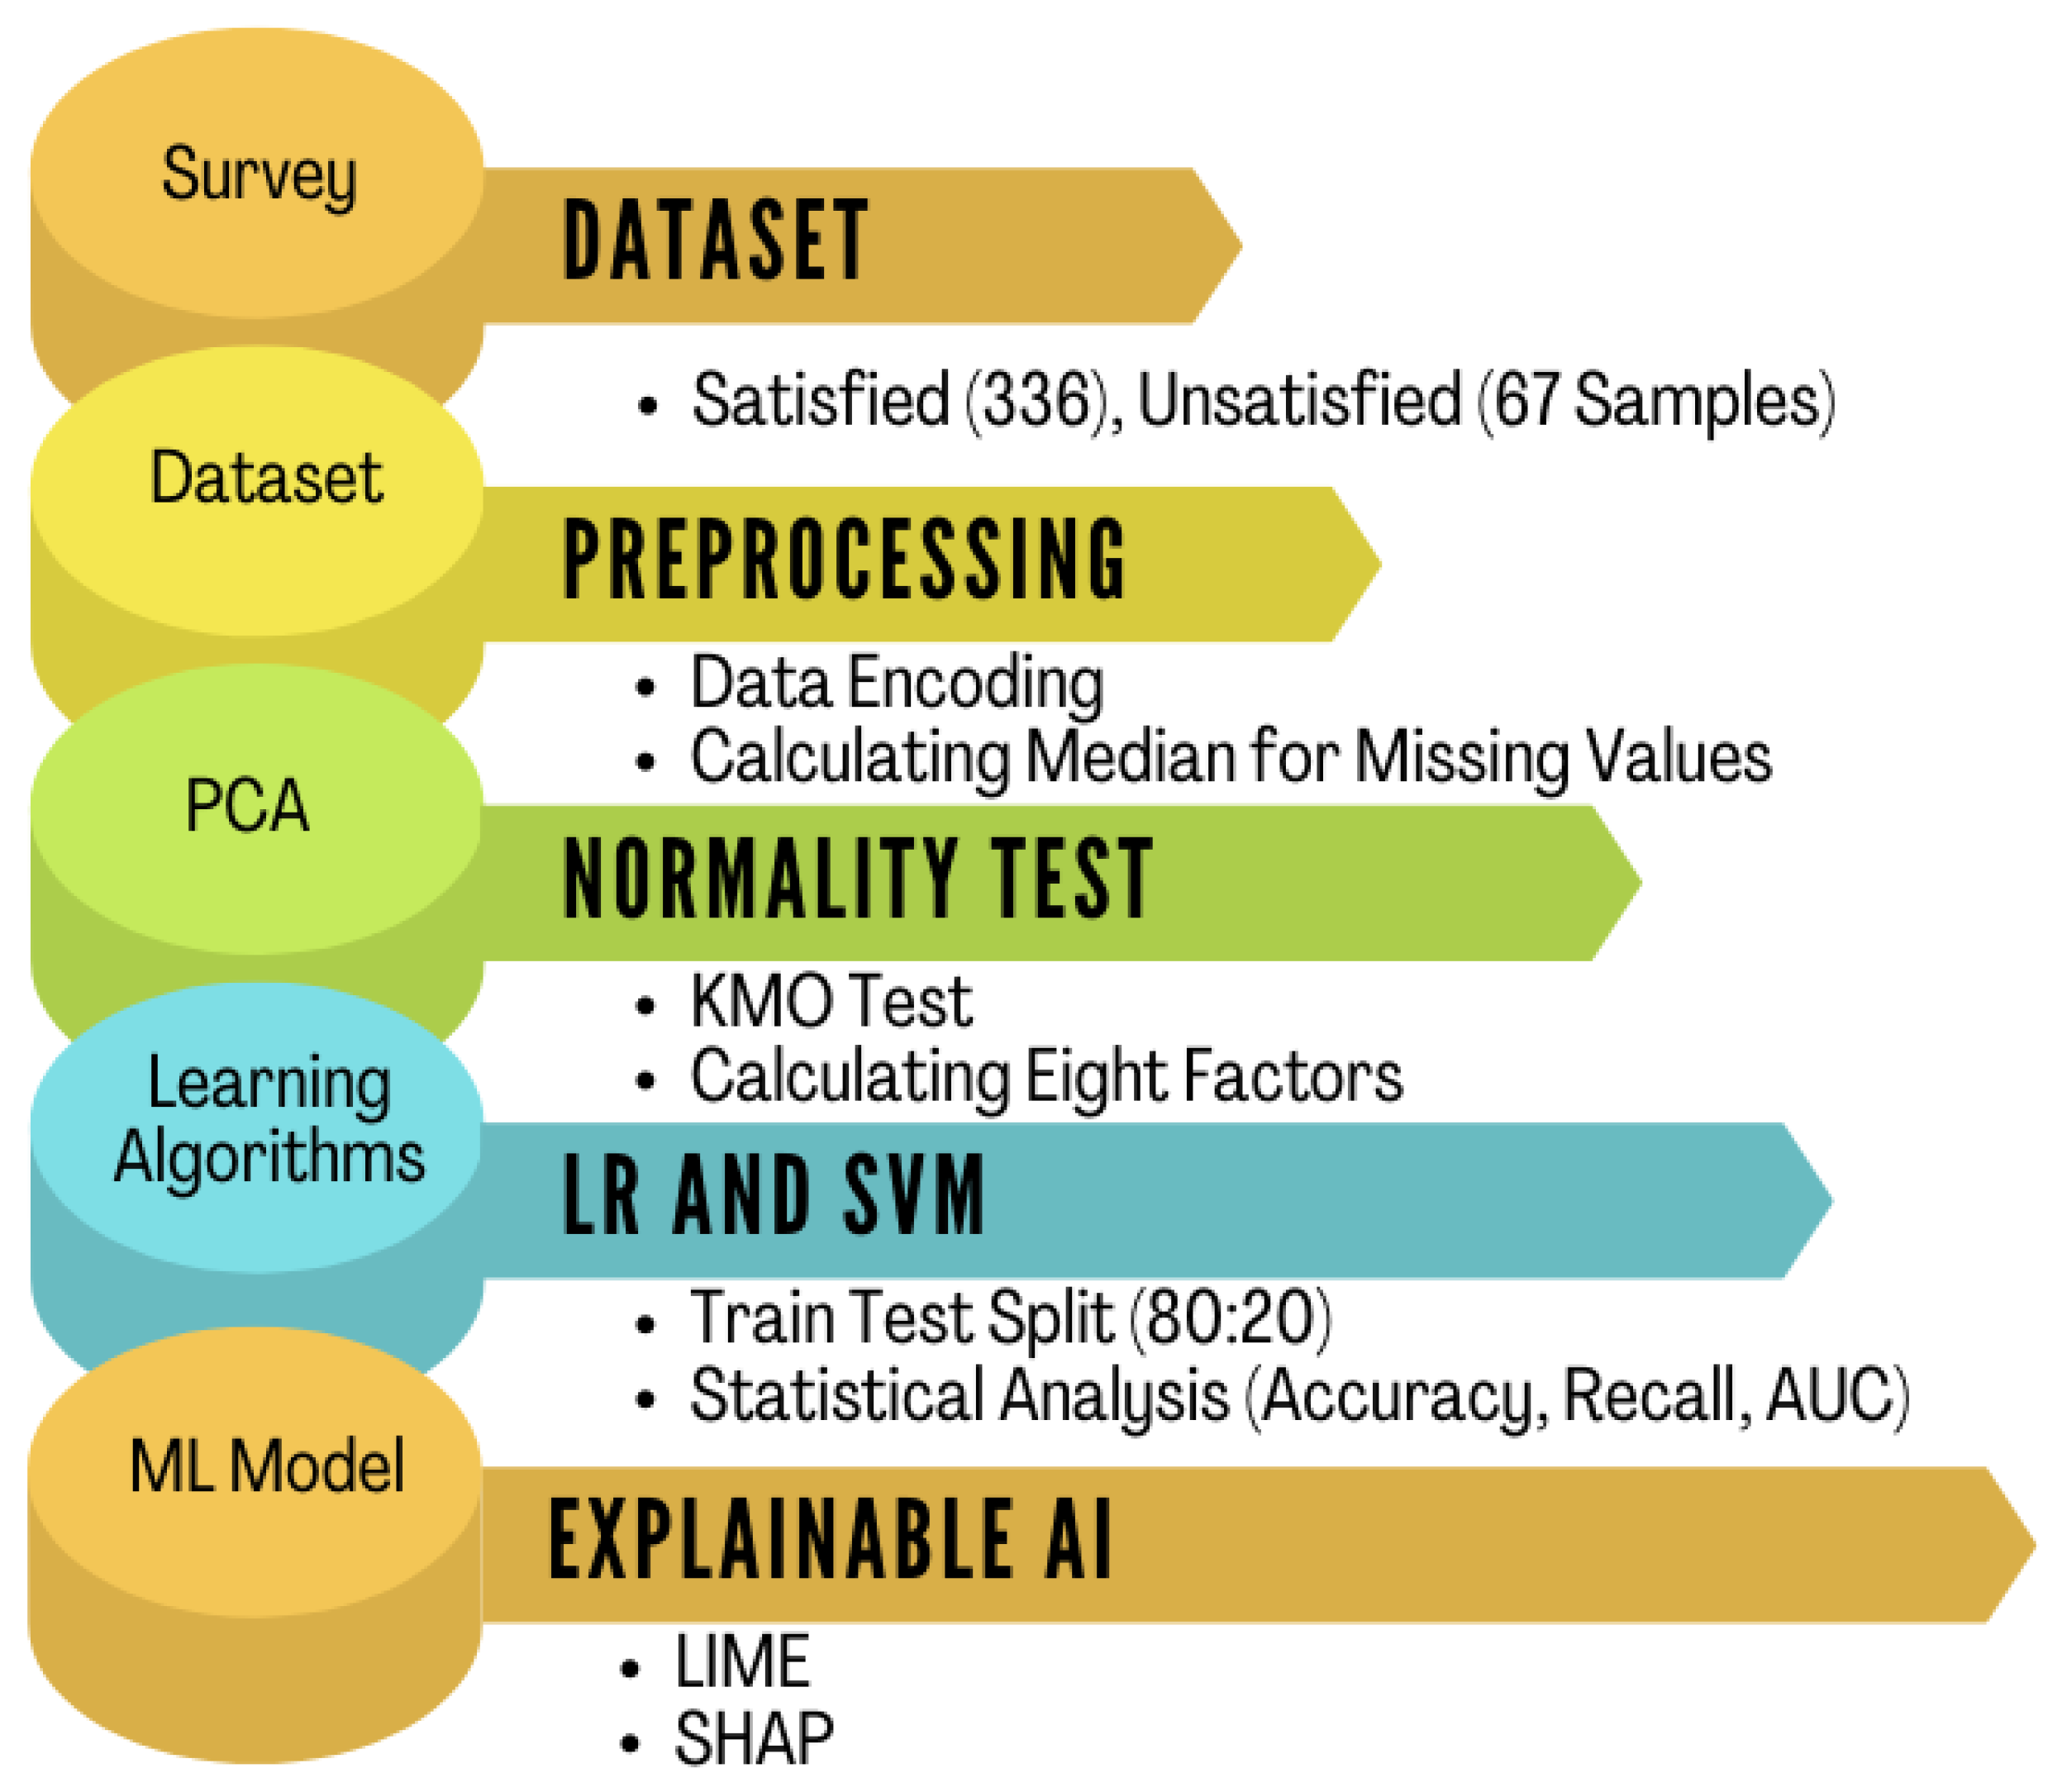
3.3. Proposed Methodology
4. Results and Analysis
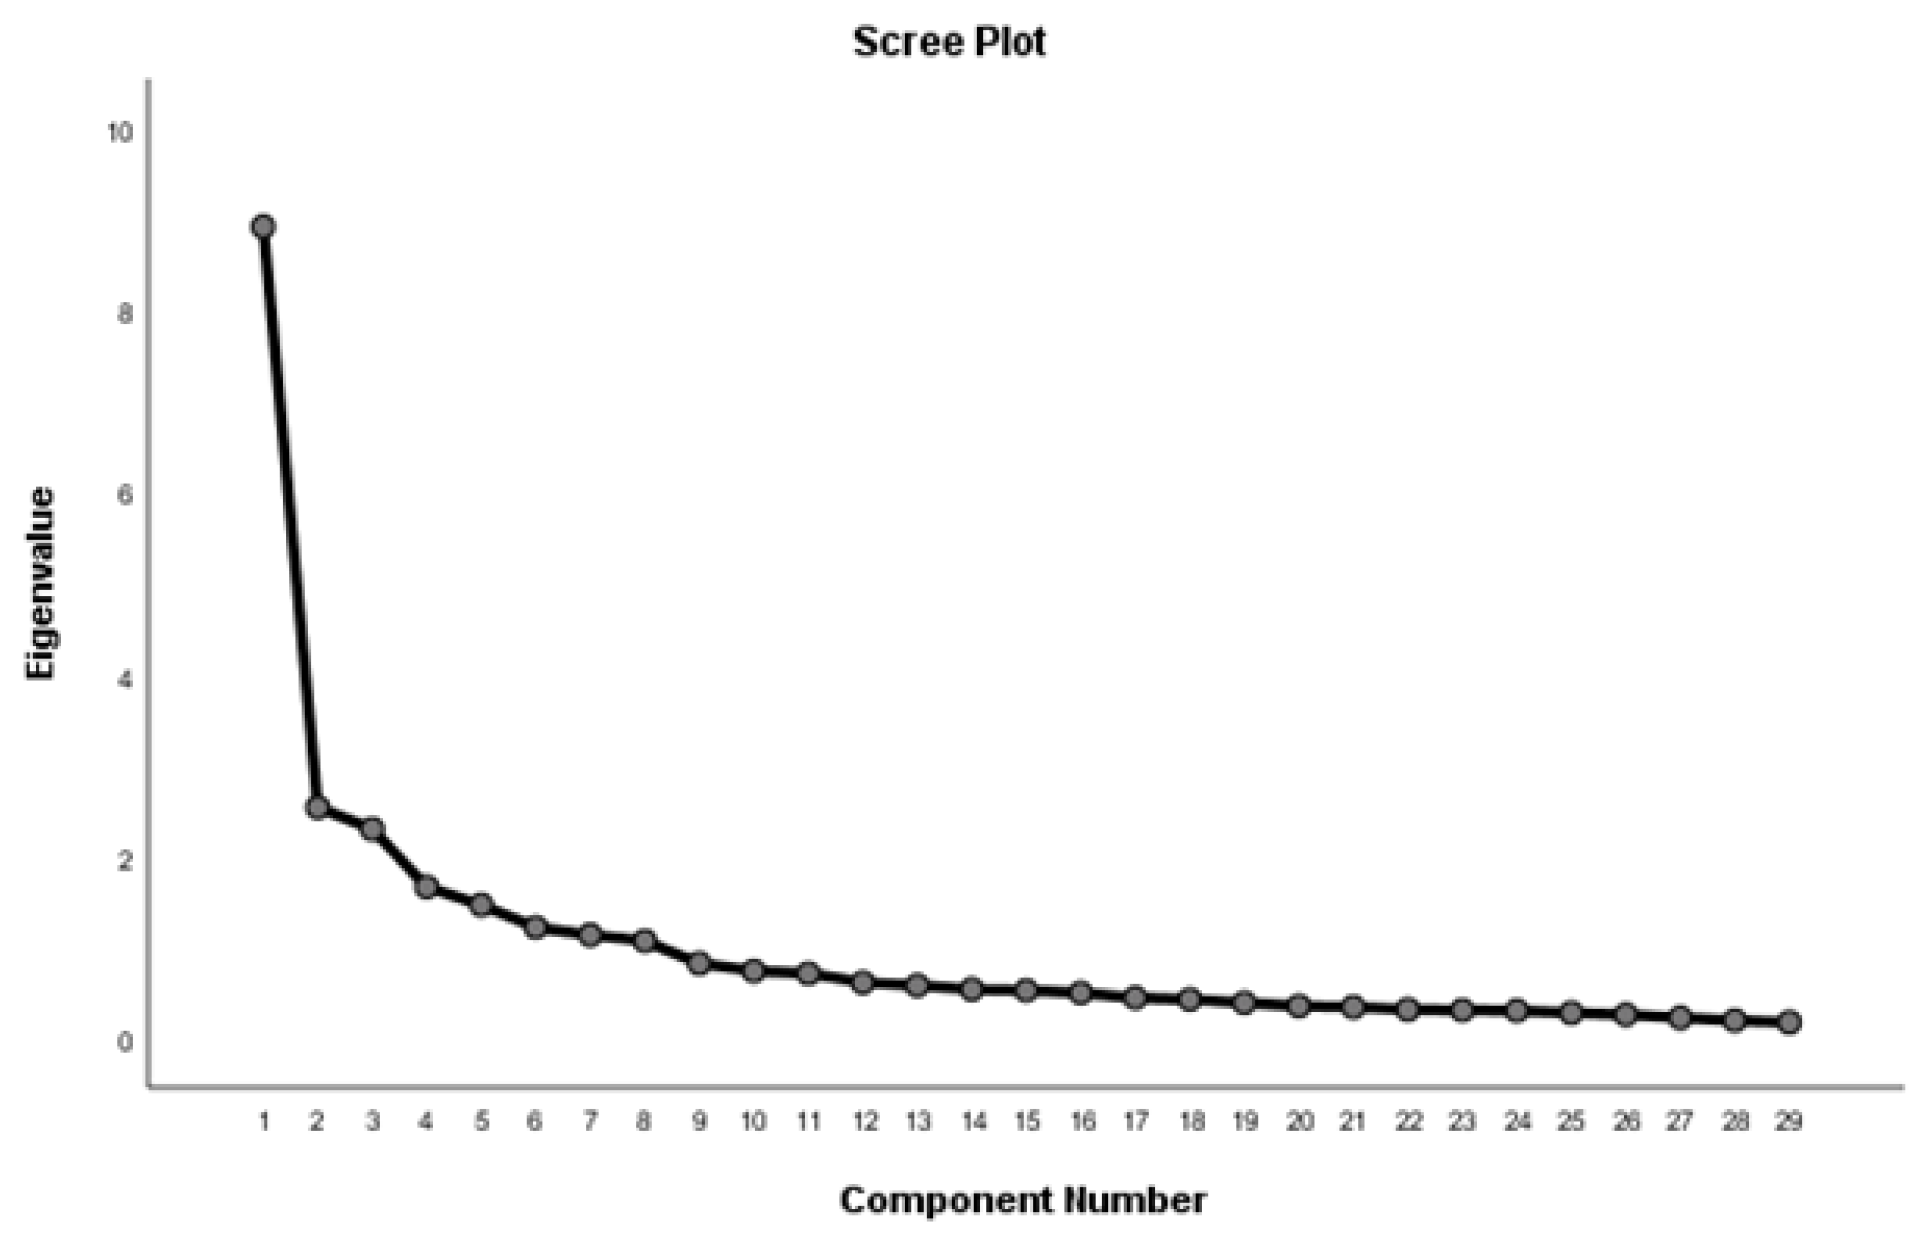
4.1. Principal Component Analysis
4.2. Machine Learning Approach
4.3. Evaluation Metrics
4.4. Support Vector Machine with Radial Basis Kernel
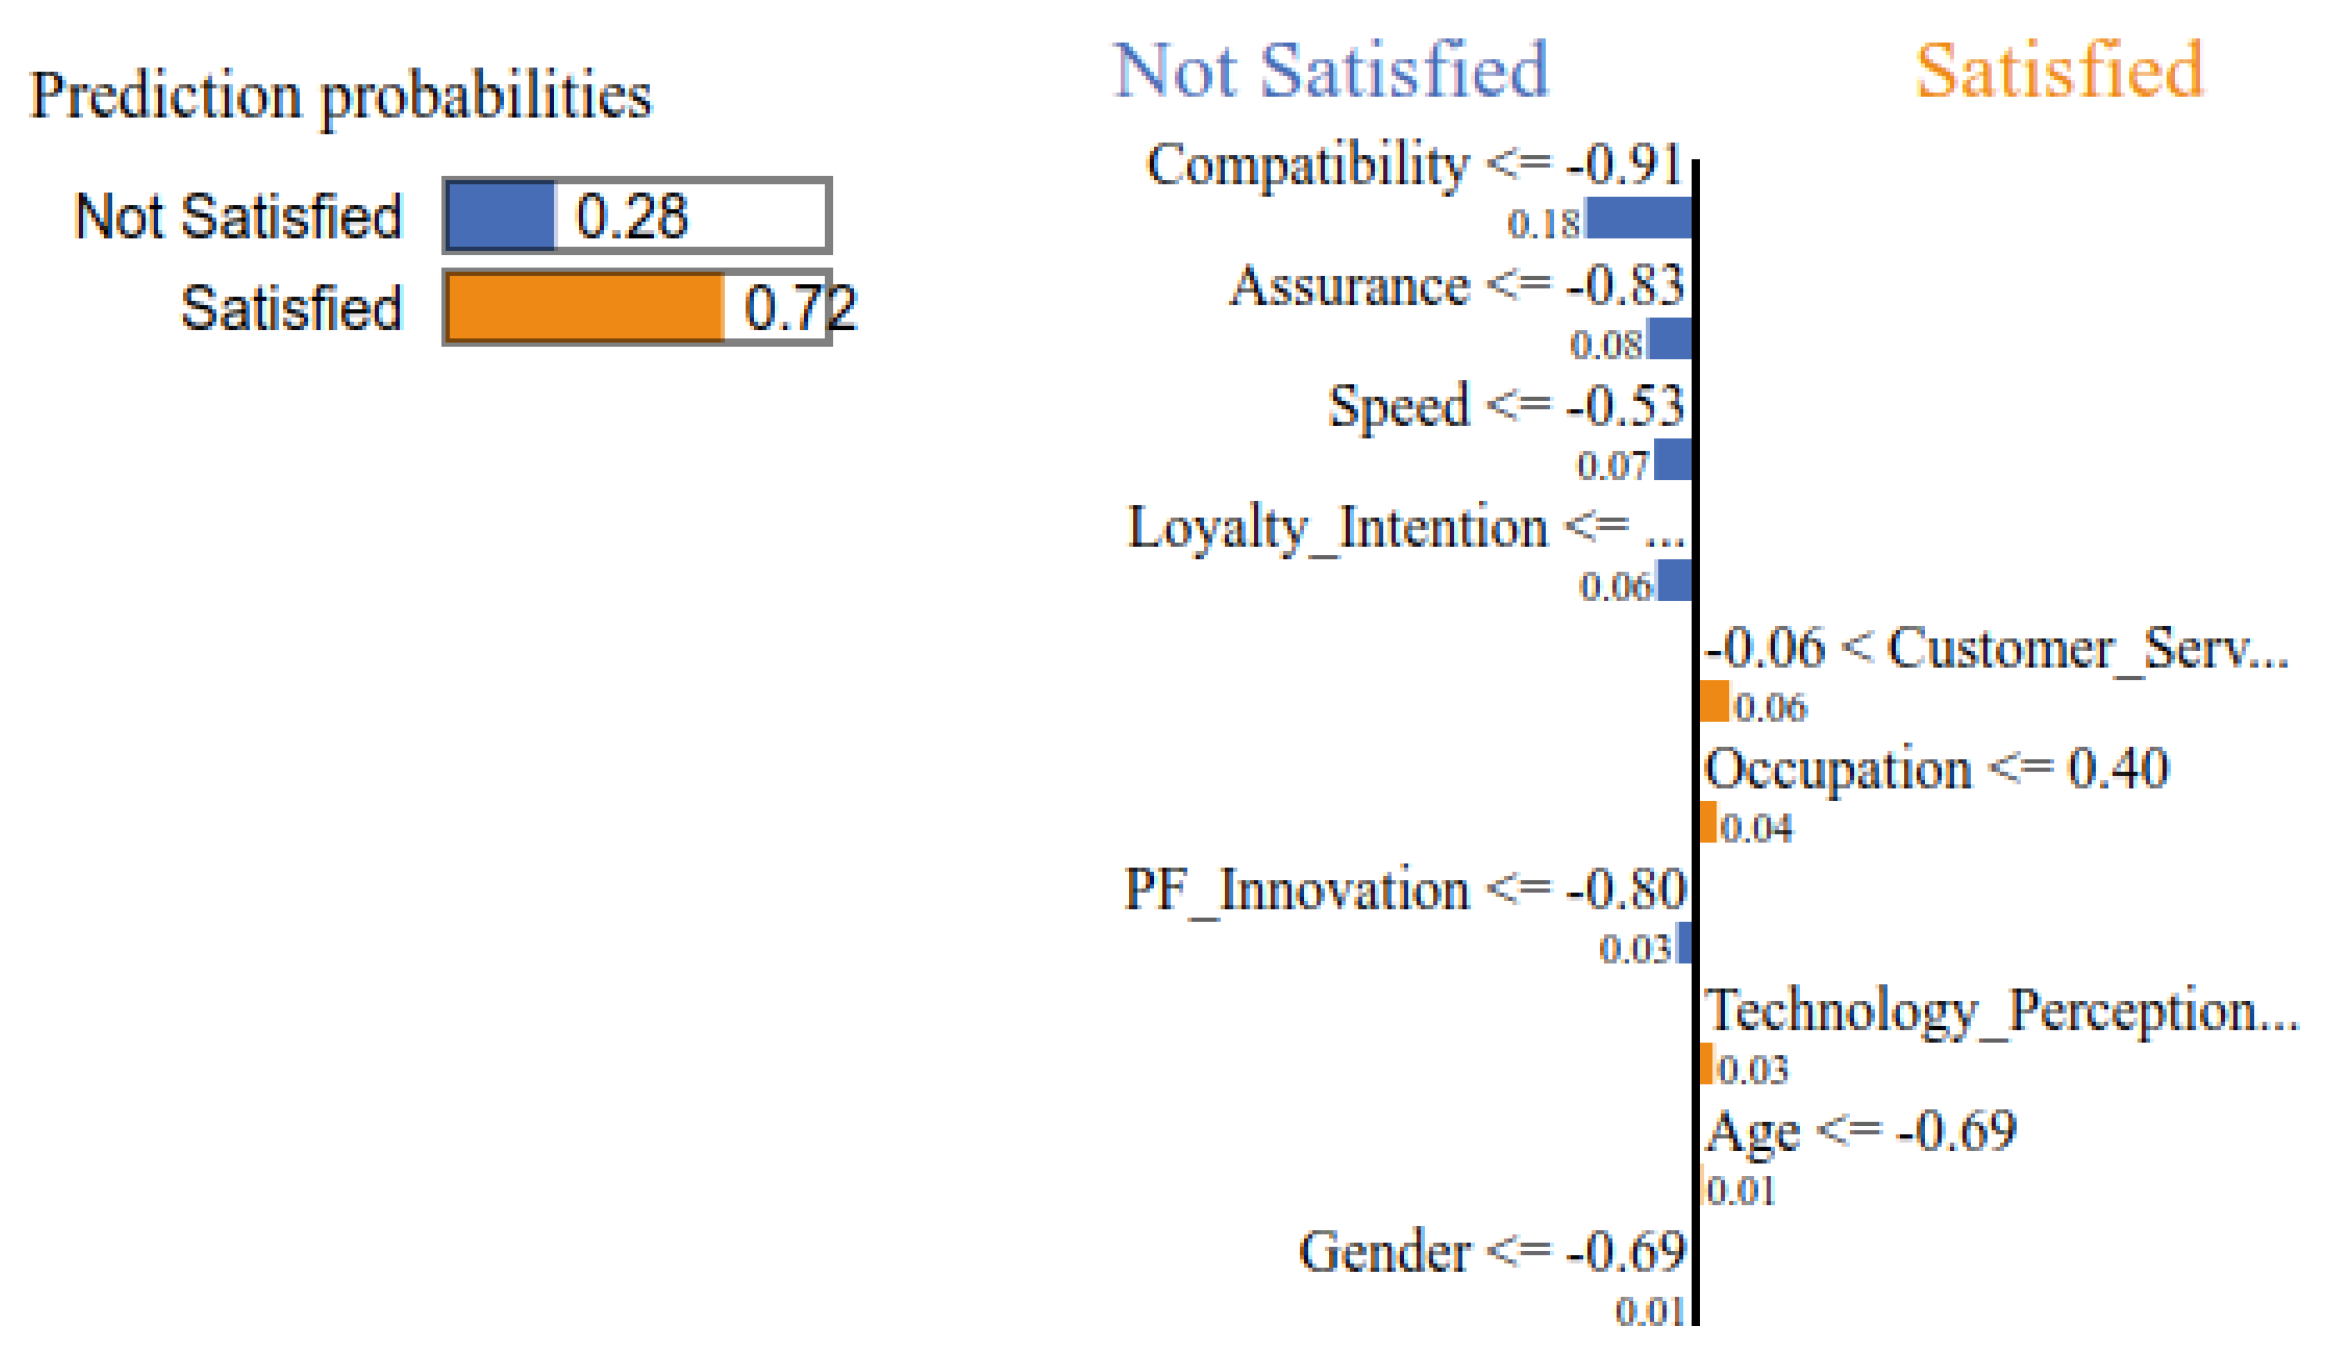
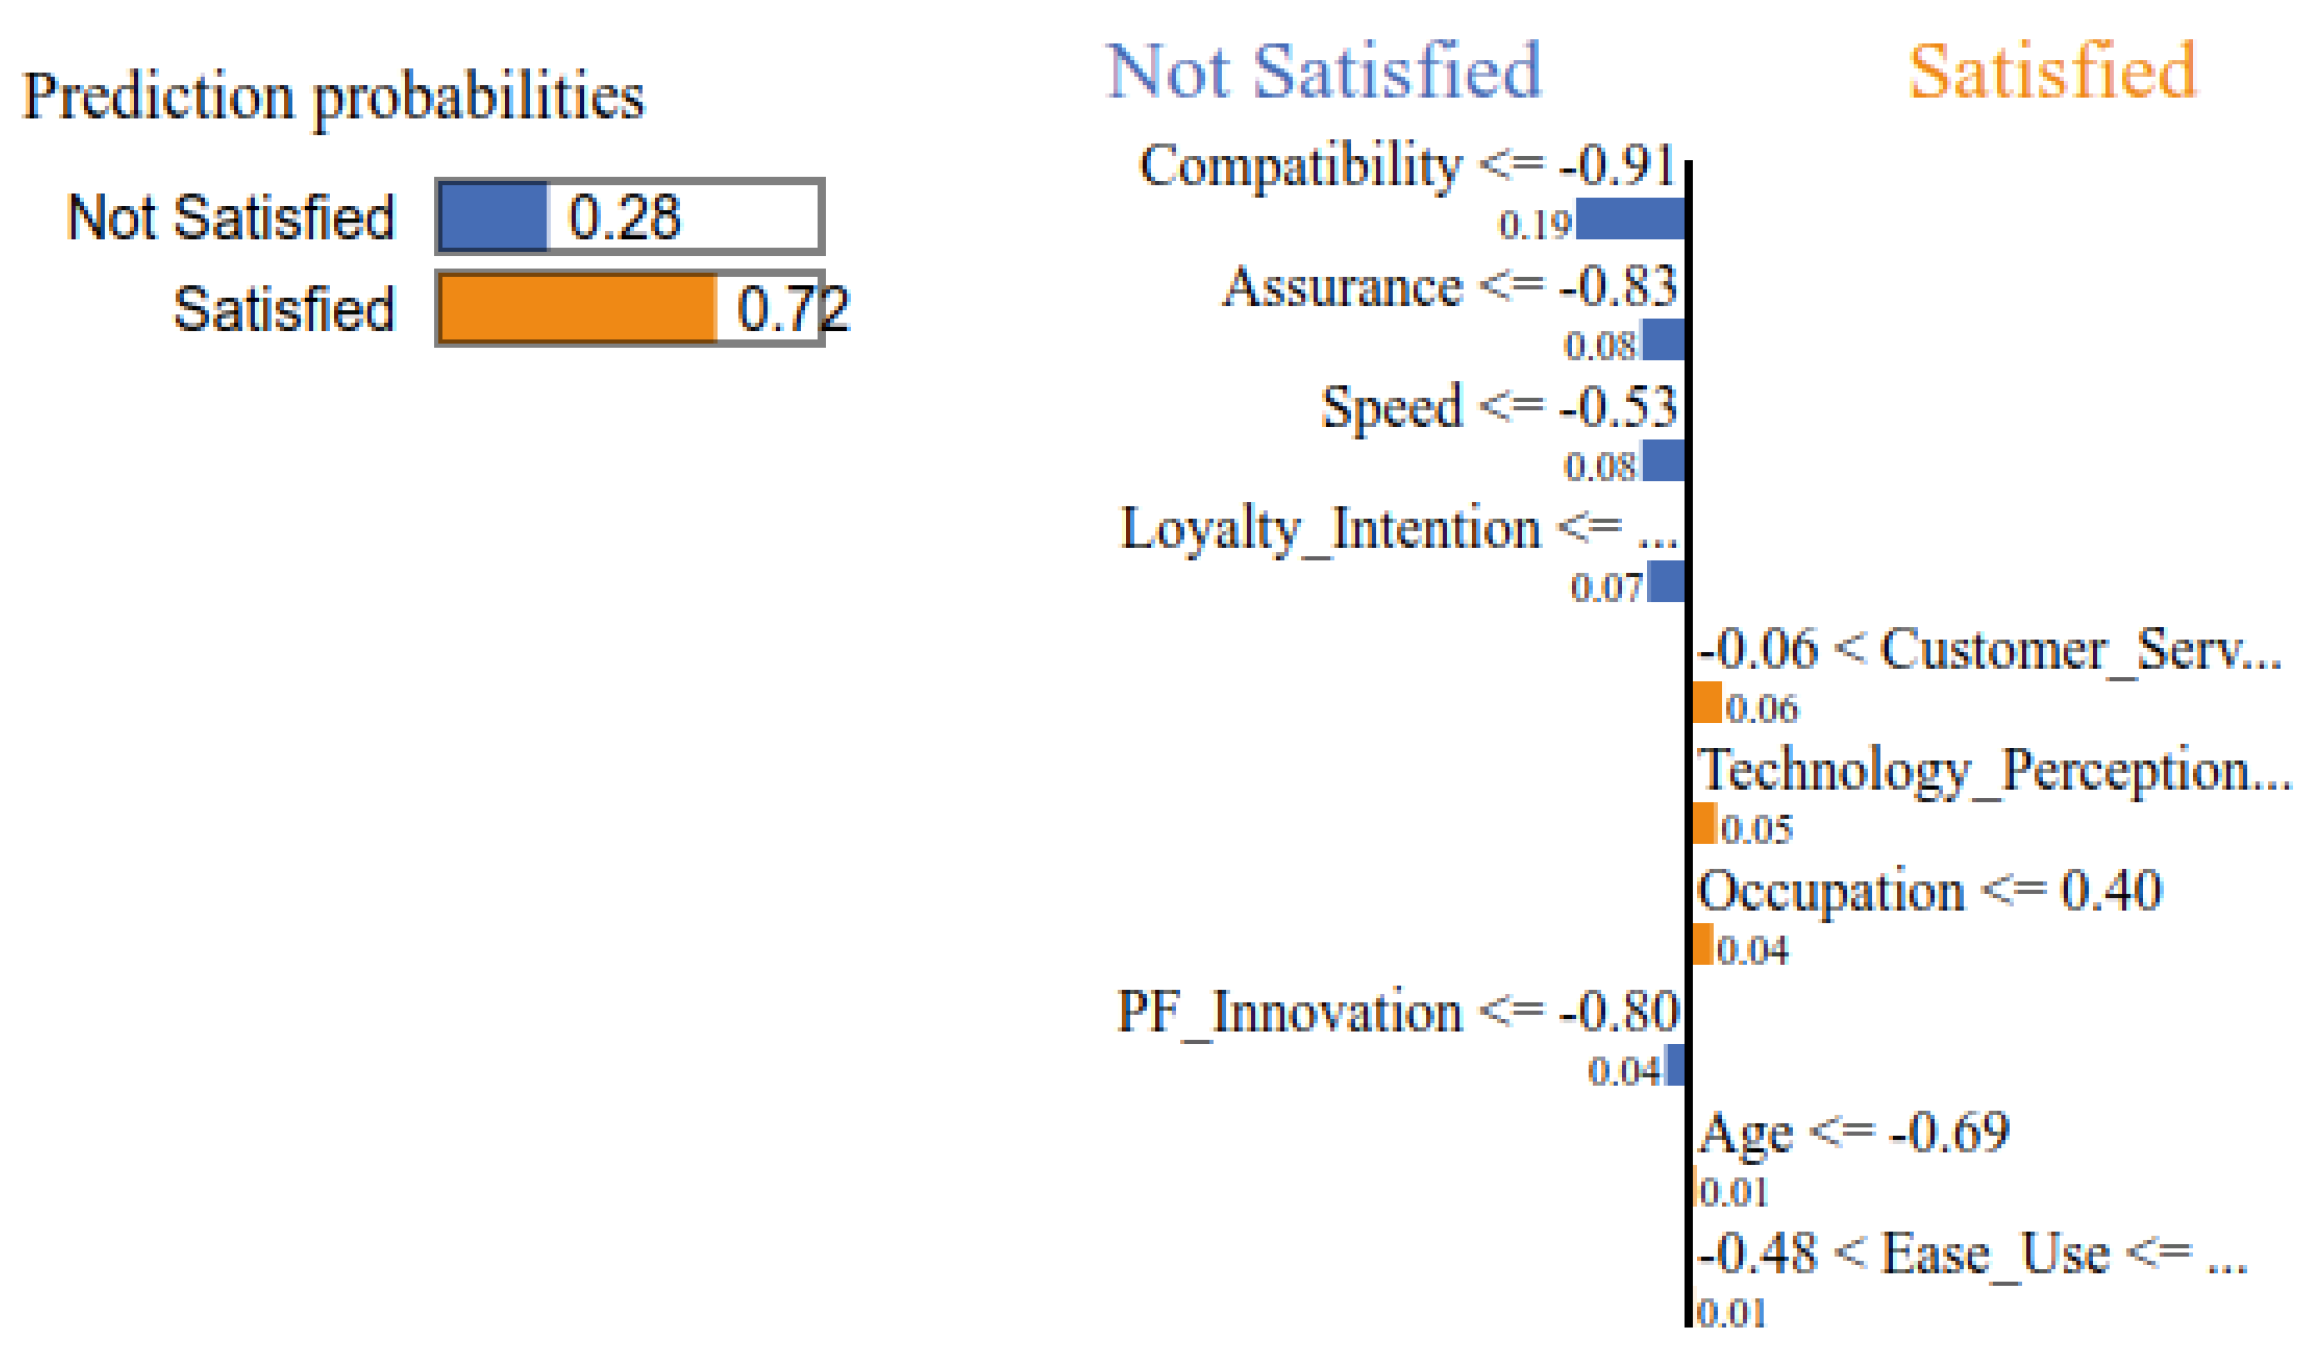
4.4.1. SVM Interpretation with LIME
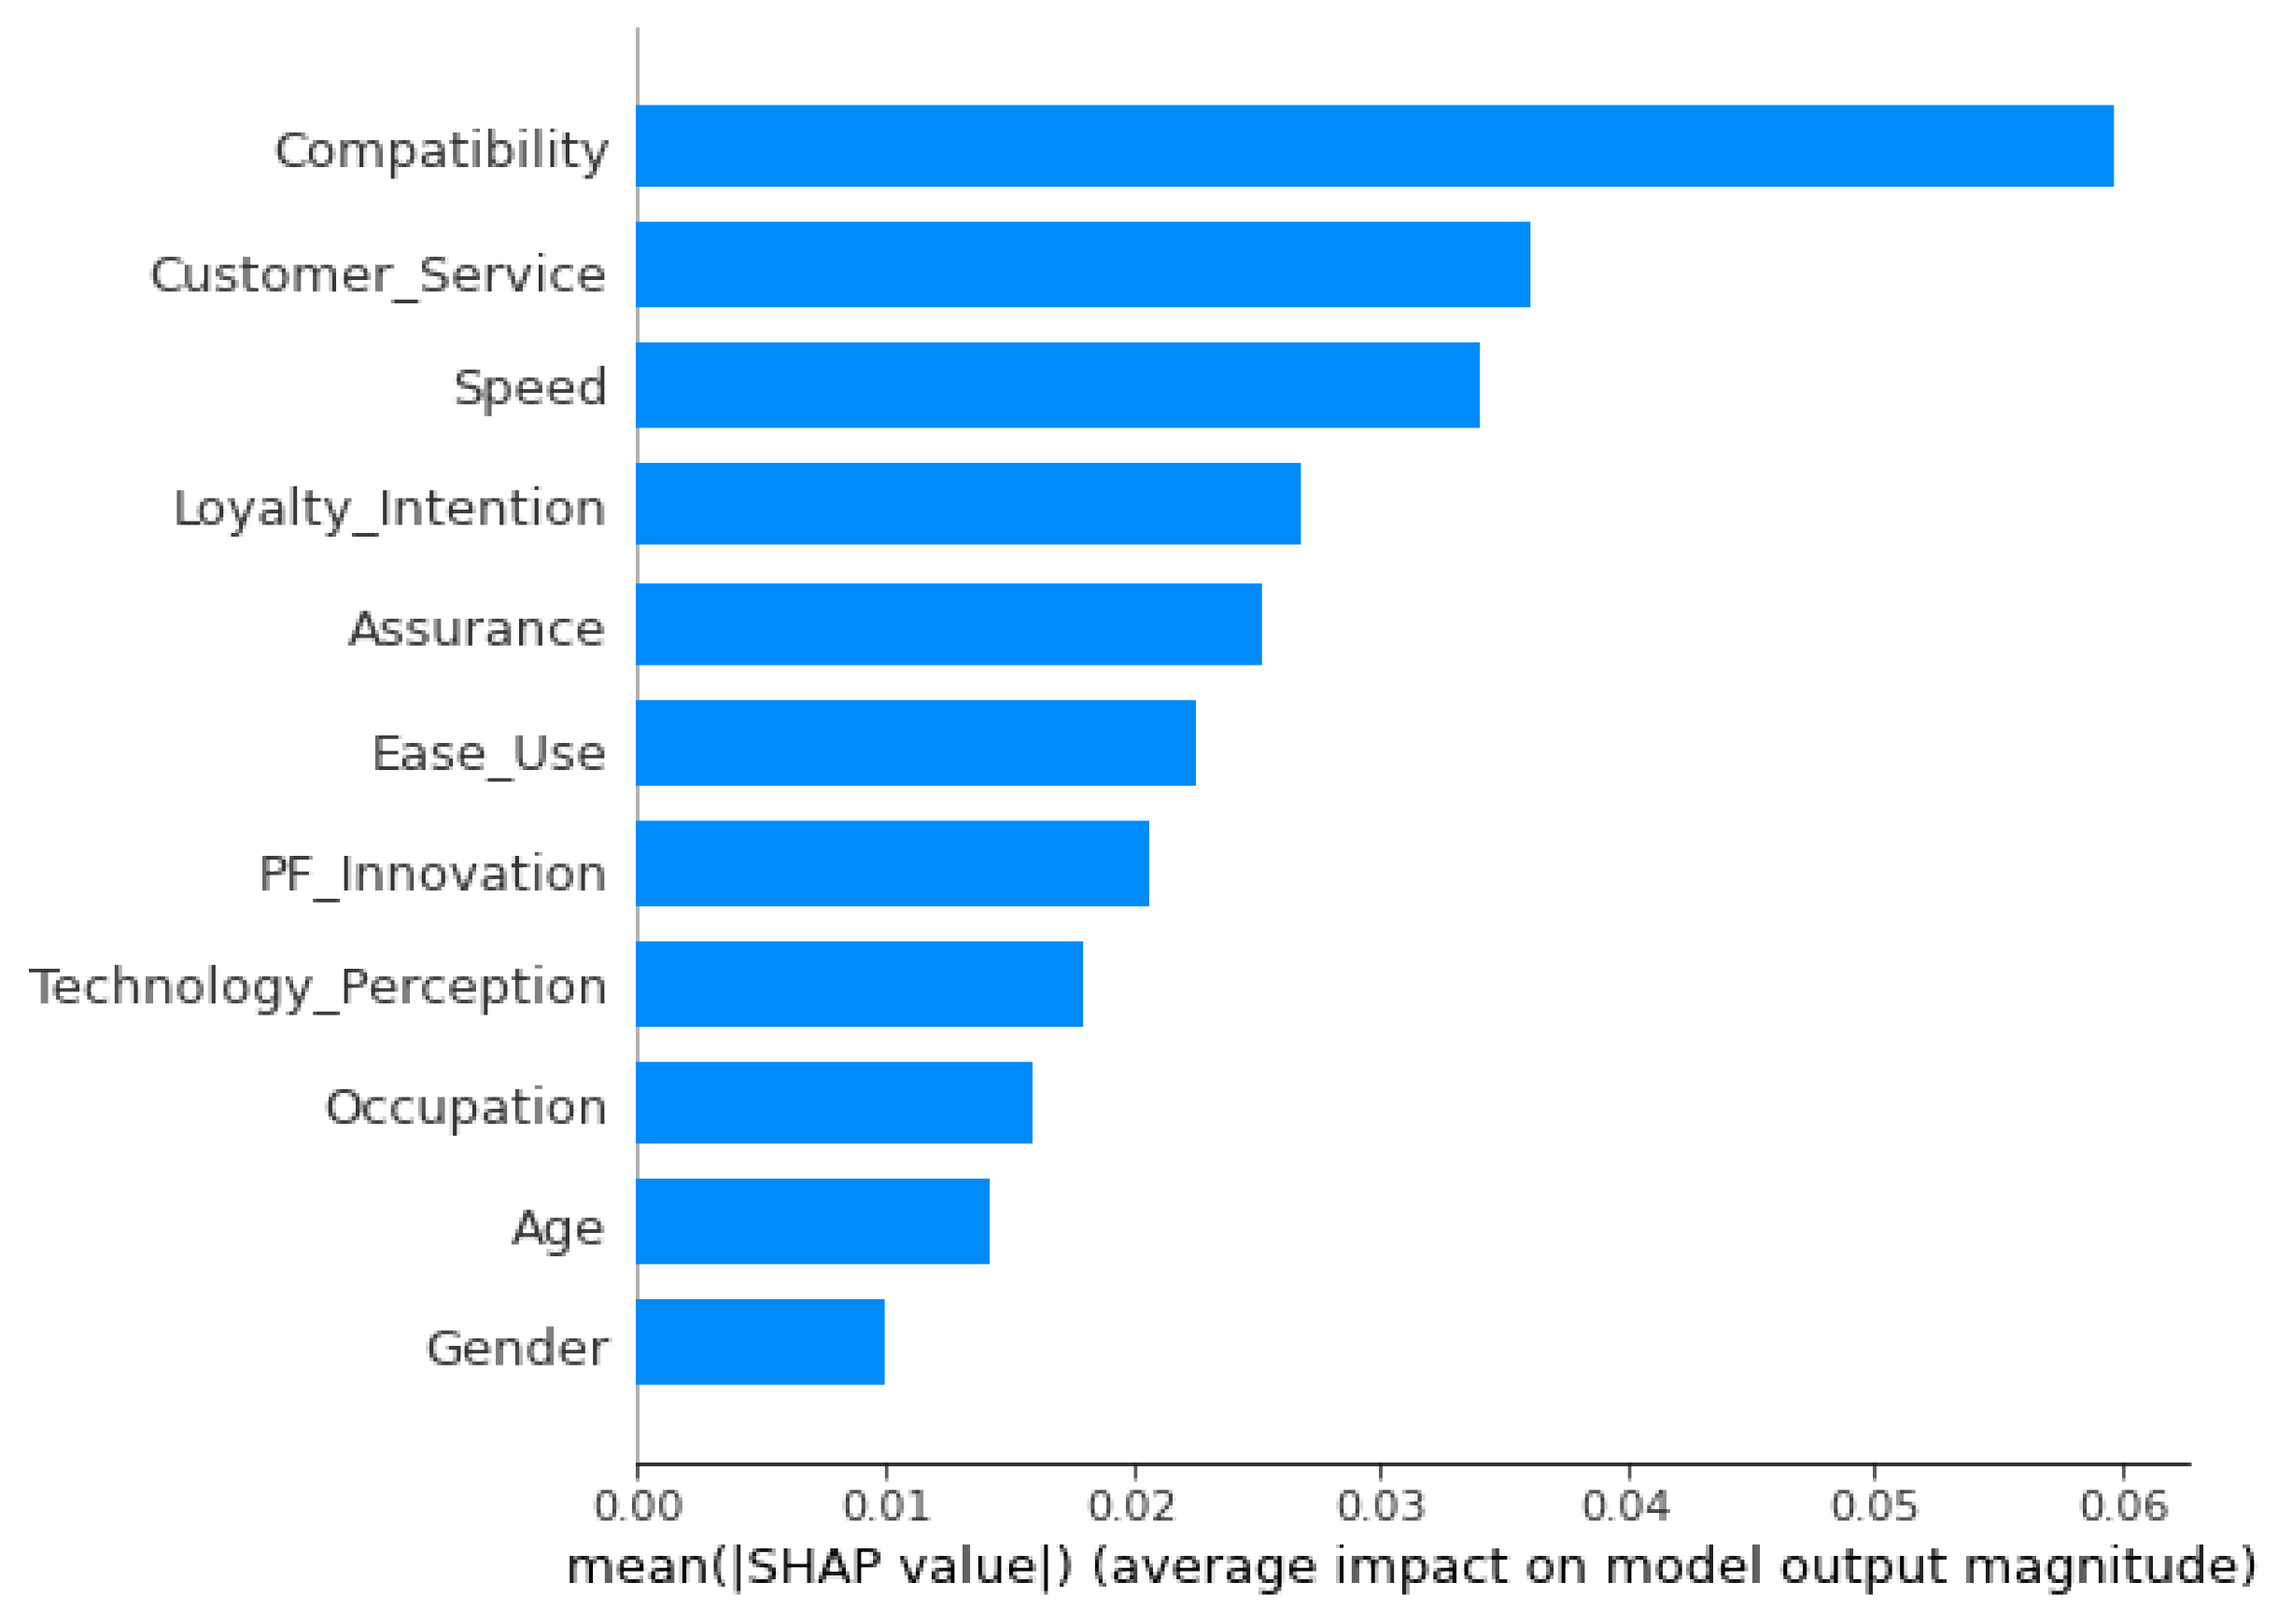
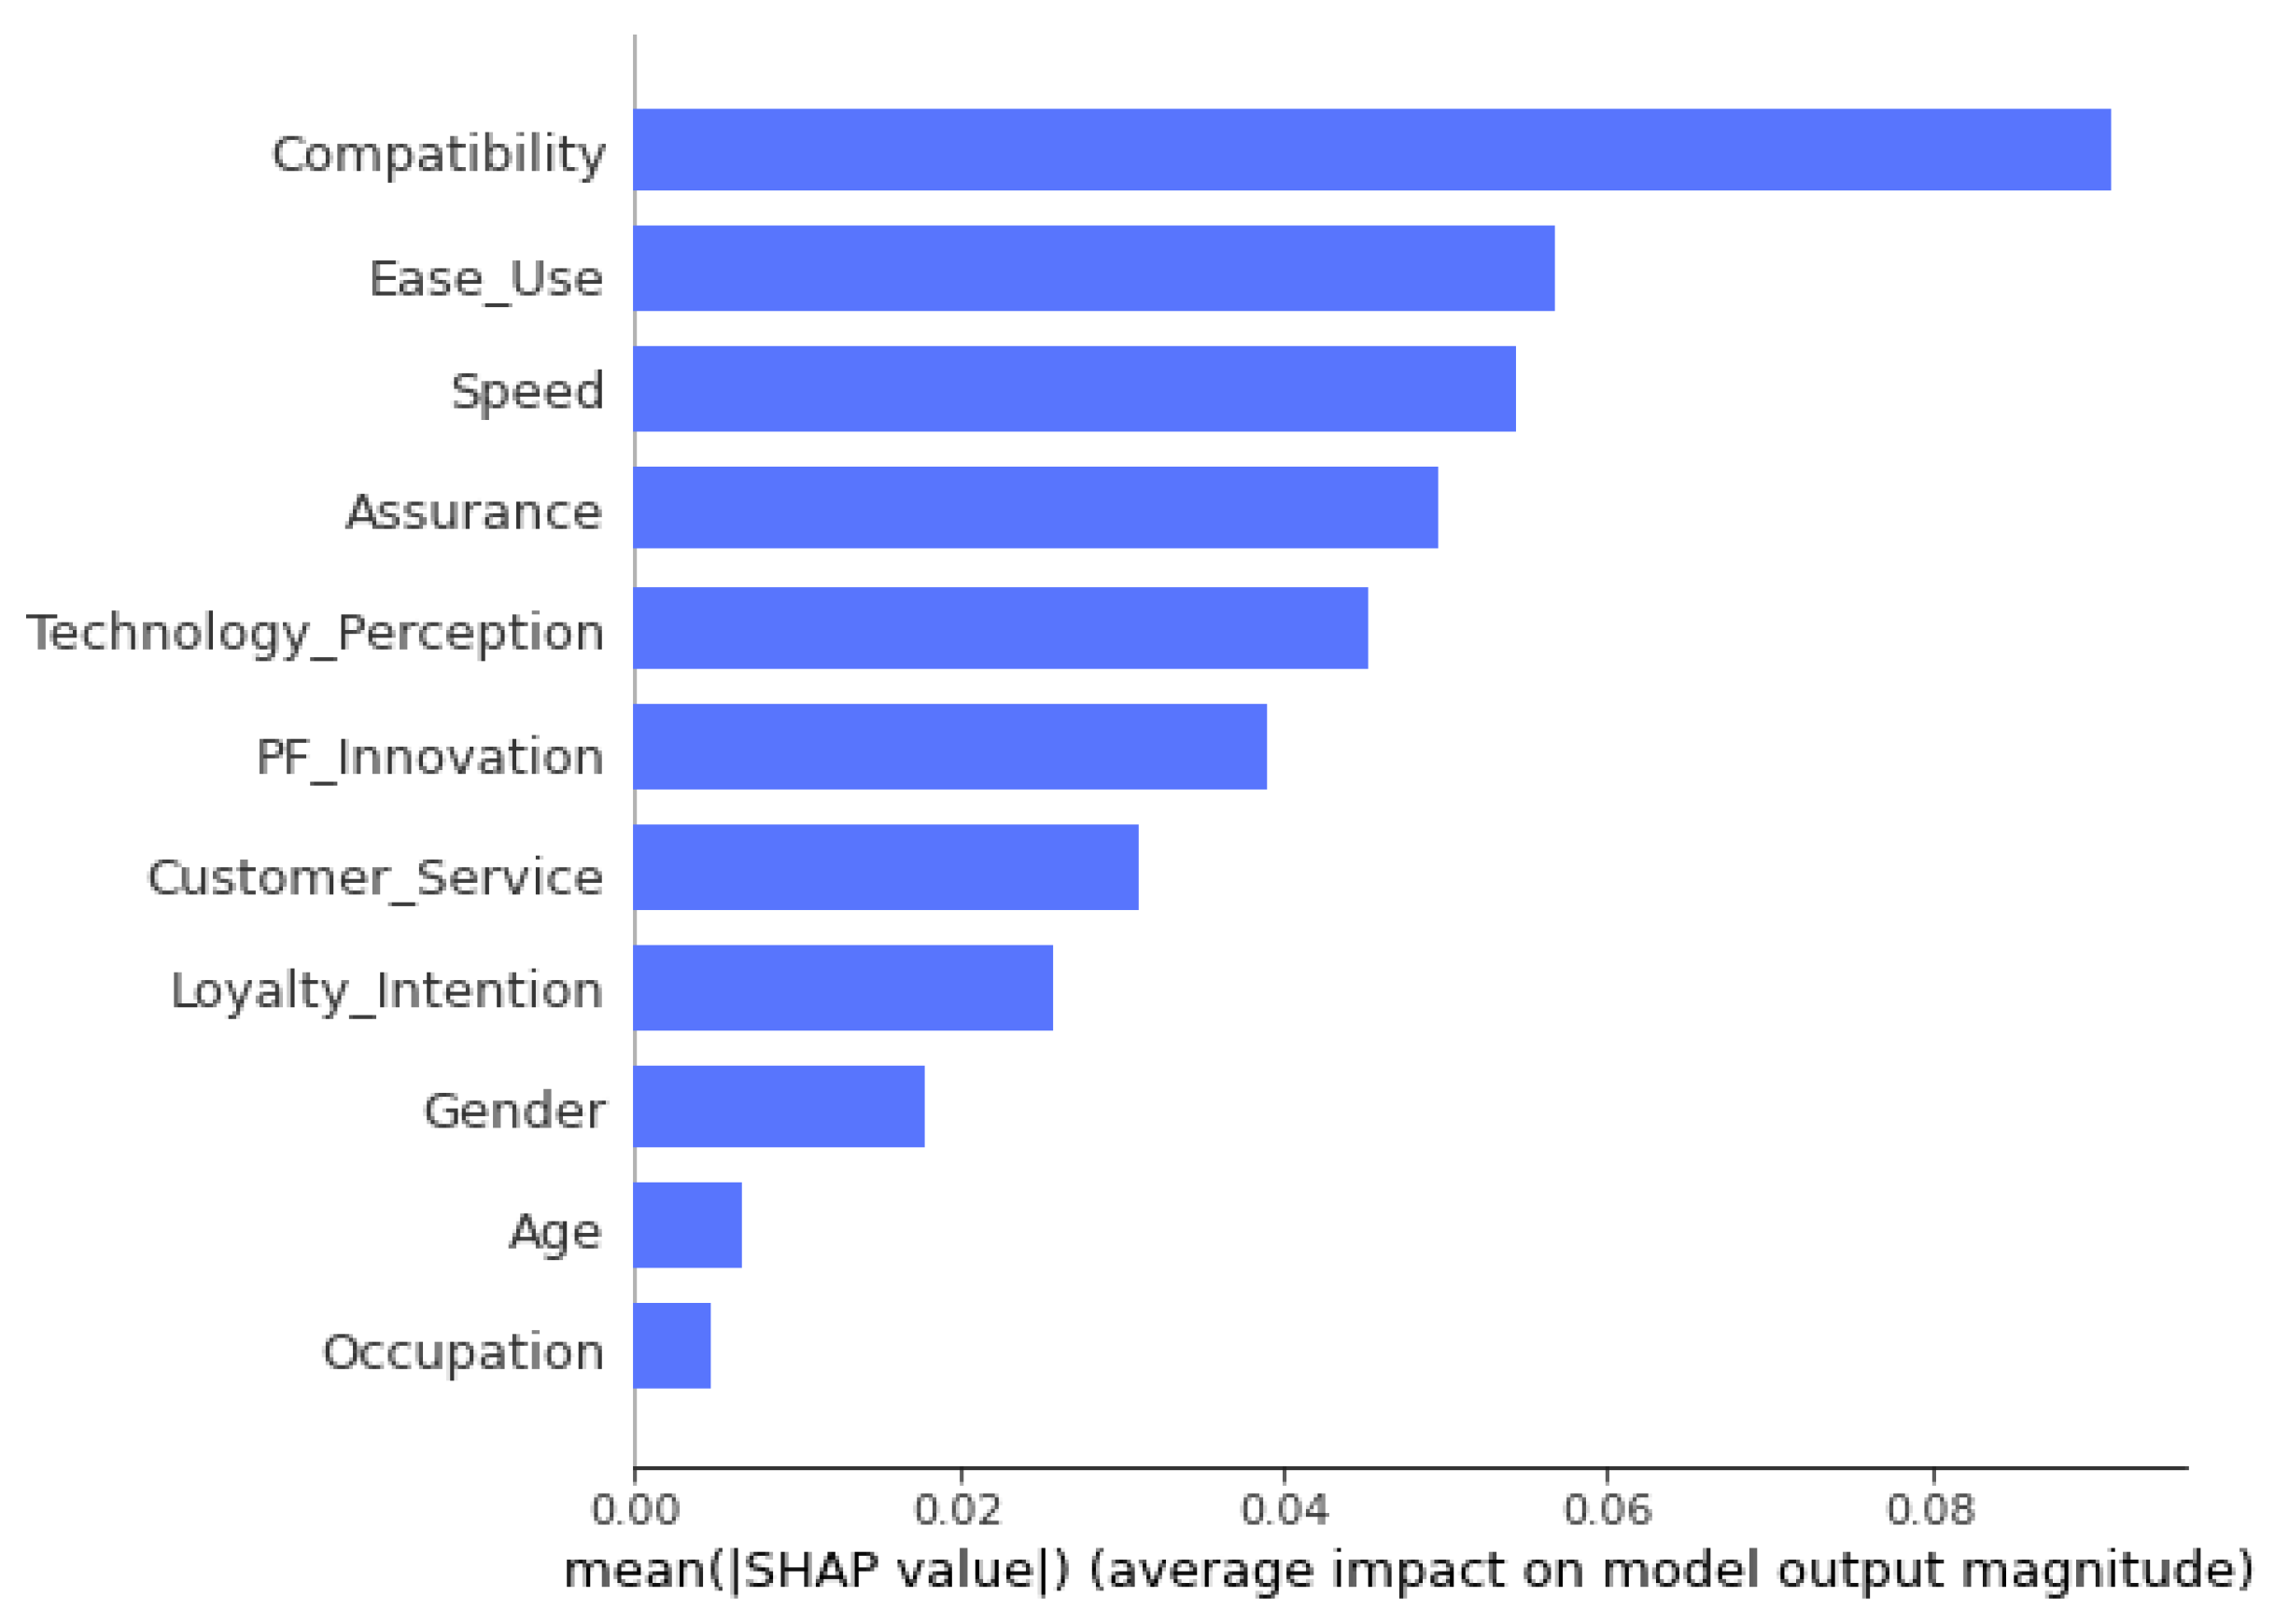
4.4.2. SVM Interpretation with SHAP
4.5. Logistic Regression
4.5.1. LIME Interpretation with LR
4.5.2. SHAP Interpretation with LR
5. Conclusions
5.1. Discussion
5.2. Theoretical Contributions and Practical Implications
5.3. Limitations and Future Research
Author Contributions
Funding
Institutional Review Board Statement
Informed Consent Statement
Data Availability Statement
Conflicts of Interest
Abbreviations
| SQ1 | How long have you been using mobile payment service of the Company? |
| TP1 | Generally, I’ve a positive view in technology. |
| TP2 | I’m a technology friendly. |
| TP3 | When using technology, I often feel overwhelmed. |
| TP4 | I don’t trust technology |
| EU1 | Mobile payment services are Easy to use. |
| EU2 | Requires fewer step to accomplish the transaction. |
| EU3 | Easy and quick recovery from mistake. |
| EU4 | Ease to integrate with bank accounts. |
| EU5 | Ease of personal details verification. |
| PV1 | Cost of using Mobile Payment services is reasonable. |
| PV2 | Feeling superiority of using services. |
| PV3 | The use of Mobile payment service is a good deal. |
| CS1 | Customer support in resolving your issues is good. |
| CS2 | Customer support team answer your inquiry promptly. |
| CS3 | Customer service agents are polite. |
| CS4 | Customer service opening hour is convenient. |
| CS5 | Customer service agents are friendly |
| A1 | Wallet payment is fully secure. |
| A2 | Confidence on transaction is high and identical to the cash transaction. |
| A3 | Statement provided by the company is thorough and accurate. |
| A4 | Mobile payment service is fully reliable. |
| PFI1 | F1 Soft is a dynamic company. |
| PFI2 | F1 Soft is a creative company. |
| PFI3 | F1 Soft is an innovative company. |
| S1 | Fund transfer time is very quick. |
| S2 | Initial log in period is much quicker. |
| S3 | Fund loading from the bank takes very low time. |
| LI1 | Use mobile payment service with us again. |
| LI2 | Recommend our payment service to others. |
| LI3 | Recommend our company to others. |
| LI4 | Favour in the future. |
| E1 | I learned a lot from using mobile payment service of the F1 Soft. |
| E2 | Makes me feel good |
| E3 | Makes me feel enthusiastic. |
| E4 | I consider myself as a member of users of F1 Soft service. |
References
- Abad-Segura, E.; González-Zamar, M.D.; López-Meneses, E.; Vázquez-Cano, E. Financial Technology: Review of Trends, Approaches and Management. Mathematics 2020, 8, 951. [Google Scholar] [CrossRef]
- Nangin, M.A.; Barus, I.R.G.; Wahyoedi, S. The Effects of Perceived Ease of Use, Security, and Promotion on Trust and Its Implications on Fintech Adoption. J. Consum. Sci. 2020, 5, 124–138. [Google Scholar] [CrossRef]
- Lim, S.H.; Kim, D.J.; Hur, Y.; Park, K. An Empirical Study of the Impacts of Perceived Security and Knowledge on Continuous Intention to Use Mobile Fintech Payment Services. Int. J. Hum.-Comput. Interact. 2019, 35, 886–898. [Google Scholar] [CrossRef]
- Suseendran, G.; Chandrasekaran, E.; Akila, D.; Sasi Kumar, A. Banking and FinTech (financial technology) embraced with IoT device. In Data Management, Analytics and Innovation; Springer: Berlin/Heidelberg, Germany, 2020; pp. 197–211. [Google Scholar]
- Weichert, M. The future of payments: How FinTech players are accelerating customer-driven innovation in financial services. J. Payments Strategy Syst. 2017, 11, 23–33. [Google Scholar]
- Yeo, V.C.S.; Goh, S.-K.; Rezaei, S. Consumer experiences, attitude and behavioral intention toward online food delivery (OFD) services. J. Retail. Consum. Serv. 2017, 35, 150–162. [Google Scholar] [CrossRef]
- Chai, L.T.; Yat, D.N.C. Online food delivery services: Making food delivery the new normal. J. Mark. Adv. Pract. 2019, 1, 62–77. [Google Scholar]
- Farah, M. Application of the theory of planned behavior to customer switching intentions in the context of bank consolidations. Int. J. Bank Mark. 2017, 35, 147–172. [Google Scholar] [CrossRef]
- Gunden, N.; Morosan, C.; DeFranco, A. Consumers’ intentions to use online food delivery systems in the USA. Int. J. Contemp. Hosp. Manag. 2020, 32, 1325–1345. [Google Scholar] [CrossRef]
- Ali, S.; Khalid, N.; Javed, H.M.U.; Islam, D.M.Z. Consumer Adoption of Online Food Delivery Ordering (OFDO) Services in Pakistan: The Impact of the COVID-19 Pandemic Situation. J. Open Innov. Technol. Mark. Complex. 2021, 7, 10. [Google Scholar] [CrossRef]
- Ajzen, I. The theory of planned behaviour. Organizational Behaviour and Human Decision Processes. Elsevier 1991, 50, 179–211. [Google Scholar]
- Bhandari, M.; Shahi, T.B.; Siku, B.; Neupane, A. Explanatory classification of CXR images into COVID-19, Pneumonia and Tuberculosis using deep learning and XAI. Comput. Biol. Med. 2022, 150, 106156. [Google Scholar] [CrossRef] [PubMed]
- Gaur, L.; Bhandari, M.; Razdan, T.; Mallik, S.; Zhao, Z. Explanation-Driven Deep Learning Model for Prediction of Brain Tumour Status Using MRI Image Data. Front. Genet. 2022, 13, 448. [Google Scholar] [CrossRef] [PubMed]
- Bhandari, M.; Parajuli, P.; Chapagain, P.; Gaur, L. Evaluating Performance of Adam Optimization by Proposing Energy Index. In Proceedings of the Recent Trends in Image Processing and Pattern Recognition; Santosh, K., Hegadi, R., Pal, U., Eds.; Springer International Publishing: Berlin/Heidelberg, Germany, 2022; pp. 156–168. [Google Scholar]
- Chapagain, P.; Timalsina, A.; Bhandari, M.; Chitrakar, R. Intrusion Detection Based on PCA with Improved K-Means. In Proceedings of the Innovations in Electrical and Electronic Engineering; Mekhilef, S., Shaw, R.N., Siano, P., Eds.; Springer: Singapore, 2022; pp. 13–27. [Google Scholar]
- Bhandari, M.; Panday, S.; Bhatta, C.P.; Panday, S.P. Image Steganography Approach Based Ant Colony Optimization with Triangular Chaotic Map. In Proceedings of the 2022 2nd International Conference on Innovative Practices in Technology and Management (ICIPTM), Pradesh, India, 23–25 February 2022; Volume 2, pp. 429–434. [Google Scholar] [CrossRef]
- Gaur, L.; Bhandari, M.; Razdan, T. Development of Image Translating Model to Counter Adversarial Attacks. In DeepFakes; CRC Press: Boca Raton, FL, USA, 2022; pp. 57–72. [Google Scholar]
- Bhandari, M.; Neupane, A.; Mallik, S.; Gaur, L.; Qin, H. Auguring Fake Face Images Using Dual Input Convolution Neural Network. J. Imaging 2023, 9, 3. [Google Scholar] [CrossRef]
- Giudici, P.; Raffinetti, E. Shapley-Lorenz eXplainable artificial intelligence. Expert Syst. Appl. 2021, 167, 114104. [Google Scholar] [CrossRef]
- Bhatta, K.R.; Durgapal, B.P. Service Quality Perceptions and Customer Satisfaction in Nepalese Banking Sector. Indian J. Commer. Manag. Stud. 2022, 7, 17–23. [Google Scholar]
- Shrestha, P. Service Quality and Customer Satisfaction: Evidence of Nepalese Banks. NCC J. 2018, 3, 121–133. [Google Scholar] [CrossRef]
- Upadhyay, J.P.; Adhikari, P.R. Corporate social responsibility and customer satisfaction in Nepal. TRANS Asian J. Mark. Manag. Res. 2022, 11, 1–10. [Google Scholar] [CrossRef]
- Shrestha, R. Customer Satisfaction with E-Banking Services of Private Commercial Banks in Nepal. Ph.D. Thesis, Department of Management, People’s Campus Paknajol, Kathmandu, Nepal, 2019. [Google Scholar]
- Kim, J.; Choi, I.; Li, Q. Customer satisfaction of recommender system: Examining accuracy and diversity in several types of recommendation approaches. Sustainability 2021, 13, 6165. [Google Scholar] [CrossRef]
- Preziosi, M.; Acampora, A.; Lucchetti, M.C.; Merli, R. Delighting Hotel Guests with Sustainability: Revamping Importance-Performance Analysis in the Light of the Three-Factor Theory of Customer Satisfaction. Sustainability 2022, 14, 3575. [Google Scholar] [CrossRef]
- Prasetyo, Y.T.; Tanto, H.; Mariyanto, M.; Hanjaya, C.; Young, M.N.; Persada, S.F.; Miraja, B.A.; Redi, A.A.N.P. Factors affecting customer satisfaction and loyalty in online food delivery service during the COVID-19 pandemic: Its relation with open innovation. J. Open Innov. Technol. Mark. Complex. 2021, 7, 76. [Google Scholar] [CrossRef]
- Ian, T.J.; Jorge, C. Principal component analysis: A review and recent developments. R. Soc. 2016, 374, 20150202. [Google Scholar]
- Trevor, H.; Robert, T.; Jerome, F. The Elements of Statistical Learning: Data Mining, Inference, and Prediction; Springer: Berlin/Heidelberg, Germany, 2009. [Google Scholar]
- Warraich, U.A.; Awais, M.; Parkash, R.; Ahmad, B. Internal marketing: An application of principal component analysis. J. Adv. Manag. Sci. 2014, 2, 55–60. [Google Scholar] [CrossRef]
- Williams, B.; Onsman, A.; Brown, T. Exploratory factor analysis: A five-step guide for novices. Australas. J. Paramed. 2010, 8, 1–13. [Google Scholar] [CrossRef]
- Olanrewaju, O.I.; Okorie, V.N. Exploring the Qualities of a Good Leader Using Principal Component Analysis. J. Eng. Proj. Prod. Manag. 2019, 9, 142–150. [Google Scholar]
- Kumbhar, V.M. Factors affecting the customer satisfaction in e-banking: Some evidences form Indian banks. Manag. Res. Pract. 2011, 3, 4. [Google Scholar]
- Xu, Z.; Zhu, G.; Metawa, N.; Zhou, Q. Machine learning based customer meta-combination brand equity analysis for marketing behavior evaluation. Inf. Process. Manag. 2022, 59, 102800. [Google Scholar] [CrossRef]
- Wei, Q.; Shi, X.; Li, Q.; Chen, G. Enhancing Customer Satisfaction Analysis with a Machine Learning Approach: From a Perspective of Matching Customer Comment and Agent Note; AIS Elibrary: Grand Wailea, HI, USA, 2020. [Google Scholar]
- F1Soft. Connecting People to Financial Services through Technology and Enabling Their Inclusion in the Formal Economy. Available online: https://f1soft.com/about/company (accessed on 17 October 2022).
- Rasool, S.F.; Wang, M.; Zhang, Y.; Samma, M. Sustainable work performance: The roles of workplace violence and occupational stress. Int. J. Environ. Res. Public Health 2020, 17, 912. [Google Scholar] [CrossRef]
- O’Connor, J. The impact of job satisfaction on the turnover intent of executive level central office administrators in Texas public school districts: A quantitative study of work related constructs. Educ. Sci. 2018, 8, 69. [Google Scholar] [CrossRef]
- Tillyer, R.; Engel, R.S.; Cherkauskas, J.C. Best practices in vehicle stop data collection and analysis. Polic. Int. J. Police Strateg. Manag. 2010, 33, 69–92. [Google Scholar] [CrossRef]
- Mitchell, W.; Wu, Z.; Bruton, G.; Gautam, D. Microlevel Analysis of Institutional Intermediation in a Rudimentary Market-Based Economy: Entrepreneurship in Kathmandu’s Indrachok Market. Organ. Sci. 2022. [Google Scholar] [CrossRef]
- Budhwar, P.S.; Sparrow, P.R. Evaluating levels of strategic integration and devolvement of human resource management in India. Int. J. Hum. Resour. Manag. 1997, 8, 476–494. [Google Scholar] [CrossRef]
- Kaiser, H.F. The varimax criterion for analytic rotation in factor analysis. Psychometrika 1958, 23, 187–200. [Google Scholar] [CrossRef]
- Kaiser, H.F. A second generation little jiffy. Psychometrika 1970, 35, 401–415. [Google Scholar] [CrossRef]
- Kaiser, H.F. An index of factorial simplicity. Psychometrika 1974, 39, 31–36. [Google Scholar] [CrossRef]
- Bartlett, M.S. A note on the multiplying factors for various χ 2 approximations. J. R. Stat. Soc. Ser. 1954, 296–298. [Google Scholar] [CrossRef]
- Loveleen, G.; Mohan, B.; Shikhar, B.S.; Nz, J.; Shorfuzzaman, M.; Masud, M. Explanation-Driven HCI Model to Examine the Mini-Mental State for Alzheimer’s Disease. ACM Trans. Multimedia Comput. Commun. Appl. 2022. [Google Scholar] [CrossRef]
- Chollet, F. Keras. 2015. Available online: https://github.com/fchollet/keras (accessed on 17 October 2022).
- Van Rossum, G.; Drake, F.L. Python 3 Reference Manual; CreateSpace: Scotts Valley, CA, USA, 2009. [Google Scholar]
- Carneiro, T.; Medeiros Da NóBrega, R.V.; Nepomuceno, T.; Bian, G.B.; De Albuquerque, V.H.C.; Filho, P.P.R. Performance Analysis of Google Colaboratory as a Tool for Accelerating Deep Learning Applications. IEEE Access 2018, 6, 61677–61685. [Google Scholar] [CrossRef]
- Tang, Y. Deep learning using linear support vector machines. arXiv 2013, arXiv:1306.0239. [Google Scholar]
- Yo, P.W.; Kee, D.M.H.; Yu, J.W.; Hu, M.K.; Jong, Y.C.; Ahmed, Z.; Gwee, S.L.; Gawade, O.; Nair, R.K. The influencing factors of customer satisfaction: A case study of Shopee in Malaysia. Stud. Appl. Econ. 2021, 39. [Google Scholar] [CrossRef]
- Vasić, N.; Kilibarda, M.; Kaurin, T. The influence of online shopping determinants on customer satisfaction in the Serbian market. J. Theor. Appl. Electron. Commer. Res. 2019, 14, 70–89. [Google Scholar] [CrossRef]
- Choi, Y.; Sun, L. Reuse intention of third-party online payments: A focus on the sustainable factors of Alipay. Sustainability 2016, 8, 147. [Google Scholar] [CrossRef]


| Distribution Variable | Frequency | Valid Percent |
|---|---|---|
| Gender | ||
| Male | 276 | 68.5 |
| Female | 127 | 31.5 |
| Total | 403 | 100 |
| Education | ||
| SLC/SEE | 1 | 0.2 |
| Plus 2/Intermediate | 29 | 7.2 |
| Bachelor | 313 | 77.7 |
| Master and above | 60 | 14.9 |
| Total | 403 | 100 |
| Occupation | ||
| Business | 12 | 3 |
| Industry | 7 | 1.7 |
| Service | 77 | 19.1 |
| Student | 288 | 71.5 |
| Others | 19 | 4.7 |
| Total | 403 | 100 |
| Kaiser–Meyer–Olkin Measure of Sampling Adequacy | 0.882 | |
| Bartlett’s Test of Sphericity | Approx. Chi-Square | 5951.899 |
| df | 406 | |
| Sig. | 0.000 | |
| Attempt | KMO | p-Value of BTS | MV AIC | MVC | % of VE | Number of Factors |
|---|---|---|---|---|---|---|
| 1 (36 items) | 0.893 | 0 | 0.612 (TP4) | 0.380 (PV1) | 65.333 | 9 |
| 2 (35 items) | 0.891 | 0 | 0.611 (TP4) | 0.386 (TP4) | 66.385 | 9 |
| 3 (34 items) | 0.892 | 0 | 0.669 (SQ1) | 0.465 (PV3) | 67.956 | 9 |
| 4 (33 items) | 0.890 | 0 | 0.657 (SQ1) | 0.450 (PV2) | 68.865 | 9 |
| 5 (32 items) | 0.888 | 0 | 0.677 (SQ1) | 0.554 (A4) | 69.923 | 9 |
| 6 (31 items) | 0.886 | 0 | 0.675 (TP2) | 0.318 (SQ1) | 67.690 | 8 |
| 7 (30 items) | 0.889 | 0 | 0.674 (TP2) | 0.508 (TP3) | 69.449 | 8 |
| 8 (29 items) | 0.882 | 0 | 0.674 (674) | 0.523 (TP3) | 69.792 | 8 |
| Item\Factor | F1 | F2 | F3 | F4 | F5 | F6 | F7 | F8 | Communalities |
|---|---|---|---|---|---|---|---|---|---|
| CS5 | 0.781 | 0.694 | |||||||
| CS3 | 0.773 | 0.645 | |||||||
| CS2 | 0.722 | 0.618 | |||||||
| CS4 | 0.718 | 0.563 | |||||||
| CS1 | 0.662 | 0.557 | |||||||
| E2 | 0.808 | 0.802 | |||||||
| E4 | 0.800 | 0.718 | |||||||
| E3 | 0.786 | 0.736 | |||||||
| E1 | 0.756 | 0.740 | |||||||
| EU1 | 0.755 | 0.715 | |||||||
| EU5 | 0.727 | 0.641 | |||||||
| EU2 | 0.718 | 0.640 | |||||||
| EU4 | 0.687 | 0.600 | |||||||
| A2 | 0.791 | 0.710 | |||||||
| A1 | 0.775 | 0.676 | |||||||
| A3 | 0.685 | 0.616 | |||||||
| A4 | 0.602 | 0.546 | |||||||
| LI2 | 0.828 | 0.852 | |||||||
| LI3 | 0.801 | 0.791 | |||||||
| LI1 | 0.707 | 0.743 | |||||||
| PFI2 | 0.801 | 0.824 | |||||||
| PFI3 | 0.790 | 0.815 | |||||||
| PFI1 | 0.754 | 0.726 | |||||||
| TP2 | 0.870 | 0.807 | |||||||
| TP1 | 0.862 | 0.789 | |||||||
| TP3 | 0.684 | 0.523 | |||||||
| S1 | 0.804 | 0.753 | |||||||
| S2 | 0.790 | 0.743 | |||||||
| S3 | 0.738 | 0.657 | |||||||
| Variance explained | 3.200 | 3.11 | 2.55 | 2.47 | 2.3 | 2.29 | 2.17 | 2.16 | 20.25 |
| % of Variance explained | 11.04 | 10.72 | 8.80 | 8.50 | 7.93 | 7.89 | 7.48 | 7.43 | 69.79 |
| Component | Initial Eigenvalues | Extraction SSL | Rotation SSL | ||||||
|---|---|---|---|---|---|---|---|---|---|
| Total | Variance | Cumulative | Total | Variance | Cumulative | Total | Variance | Cumulative | |
| 1 | 8.93 | 30.78 | 30.78 | 8.93 | 30.78 | 30.78 | 3.2 | 11.04 | 11.04 |
| 2 | 2.53 | 8.72 | 39.5 | 2.53 | 8.72 | 39.5 | 3.11 | 10.72 | 21.76 |
| 3 | 2.29 | 7.90 | 47.39 | 2.29 | 7.90 | 47.39 | 2.55 | 8.80 | 30.56 |
| 4 | 1.65 | 5.70 | 53.09 | 1.65 | 5.70 | 53.09 | 2.47 | 8.50 | 39.06 |
| 5 | 1.46 | 5.02 | 58.11 | 1.46 | 5.02 | 58.11 | 2.30 | 7.93 | 46.99 |
| 6 | 1.21 | 4.16 | 62.27 | 1.21 | 4.16 | 62.27 | 2.29 | 7.89 | 54.88 |
| 7 | 1.12 | 3.87 | 66.14 | 1.12 | 3.87 | 66.14 | 2.17 | 7.48 | 62.36 |
| 8 | 1.06 | 3.65 | 69.79 | 1.06 | 3.65 | 69.79 | 2.16 | 7.43 | 69.79 |
| 9 | 0.81 | 2.79 | 72.58 | ||||||
| 10 | 0.73 | 2.51 | 75.09 | ||||||
| 11 | 0.70 | 2.41 | 77.50 | ||||||
| 12 | 0.60 | 2.07 | 79.57 | ||||||
| 13 | 0.57 | 1.95 | 81.53 | ||||||
| 14 | 0.52 | 1.81 | 83.33 | ||||||
| 15 | 0.51 | 1.76 | 85.09 | ||||||
| 16 | 0.49 | 1.67 | 86.77 | ||||||
| 17 | 0.43 | 1.49 | 88.25 | ||||||
| 18 | 0.41 | 1.43 | 89.68 | ||||||
| 19 | 0.38 | 1.30 | 90.97 | ||||||
| 20 | 0.34 | 1.18 | 92.15 | ||||||
| 21 | 0.33 | 1.13 | 93.28 | ||||||
| 22 | 0.30 | 1.04 | 94.32 | ||||||
| 23 | 0.29 | 1.01 | 95.33 | ||||||
| 24 | 0.29 | 1.00 | 96.33 | ||||||
| 25 | 0.27 | 0.91 | 97.24 | ||||||
| 26 | 0.25 | 0.85 | 98.09 | ||||||
| 27 | 0.21 | 0.73 | 98.82 | ||||||
| 28 | 0.18 | 0.63 | 99.44 | ||||||
| 29 | 0.16 | 0.56 | 100.00 | ||||||
| Des/Factor | CS | E | EU | A | LI | FI | TP | S |
|---|---|---|---|---|---|---|---|---|
| Number of items | 5 | 4 | 4 | 4 | 3 | 3 | 3 | 3 |
| Cronbach’s alpha | 0.832 | 0.882 | 0.797 | 0.785 | 0.872 | 0.866 | 0.773 | 0.791 |
| Mean | 17.14 | 14.57 | 16.3 | 14.43 | 15.53 | 10.68 | 11.49 | 11.12 |
| Std. deviation | 3.41 | 2.95 | 2.54 | 2.75 | 2.93 | 2.11 | 2.73 | 2.15 |
| Skewness | −0.41 | −0.58 | −1.09 | −0.32 | −0.85 | −0.29 | −1.03 | −0.71 |
| Minimum | 5 | 4 | 4 | 4 | 4 | 3 | 3 | 3 |
| Maximum | 25 | 20 | 20 | 20 | 20 | 15 | 15 | 15 |
| N | 403 | 403 | 403 | 403 | 403 | 403 | 403 | 403 |
Disclaimer/Publisher’s Note: The statements, opinions and data contained in all publications are solely those of the individual author(s) and contributor(s) and not of MDPI and/or the editor(s). MDPI and/or the editor(s) disclaim responsibility for any injury to people or property resulting from any ideas, methods, instructions or products referred to in the content. |
© 2023 by the authors. Licensee MDPI, Basel, Switzerland. This article is an open access article distributed under the terms and conditions of the Creative Commons Attribution (CC BY) license (https://creativecommons.org/licenses/by/4.0/).
Share and Cite
Khanal, M.; Khadka, S.R.; Subedi, H.; Chaulagain, I.P.; Regmi, L.N.; Bhandari, M. Explaining the Factors Affecting Customer Satisfaction at the Fintech Firm F1 Soft by Using PCA and XAI. FinTech 2023, 2, 70-84. https://doi.org/10.3390/fintech2010006
Khanal M, Khadka SR, Subedi H, Chaulagain IP, Regmi LN, Bhandari M. Explaining the Factors Affecting Customer Satisfaction at the Fintech Firm F1 Soft by Using PCA and XAI. FinTech. 2023; 2(1):70-84. https://doi.org/10.3390/fintech2010006
Chicago/Turabian StyleKhanal, Mohan, Sudip Raj Khadka, Harendra Subedi, Indra Prasad Chaulagain, Lok Nath Regmi, and Mohan Bhandari. 2023. "Explaining the Factors Affecting Customer Satisfaction at the Fintech Firm F1 Soft by Using PCA and XAI" FinTech 2, no. 1: 70-84. https://doi.org/10.3390/fintech2010006
APA StyleKhanal, M., Khadka, S. R., Subedi, H., Chaulagain, I. P., Regmi, L. N., & Bhandari, M. (2023). Explaining the Factors Affecting Customer Satisfaction at the Fintech Firm F1 Soft by Using PCA and XAI. FinTech, 2(1), 70-84. https://doi.org/10.3390/fintech2010006