1. Introduction
Music as an emotional support is indispensable in people’s daily life. Music is mainly divided into live music and recorded music. People will go to live music performances to experience seeing their favorite artists performing live and the atmosphere associated with a live performance. Live music can elicit positive emotions from the audience through visual and auditory stimulation. Enjoying music live with others also enhances the audience’s musical experience in a way that recorded music cannot give [
1]. The closure policy associated with the pandemic deeply affected live music, causing many live music events to be cancelled. Survey data on total live music spending shows that due to the pandemic, spending on live music has dropped by 46.8 percent compared to the pre-pandemic period [
2]. Recorded music, however, appeared to receive a boost from the pandemic as people’s demand to listen to music during the pandemic increased. According to a survey conducted by [
3], almost half of the respondents in Israel said that they listened to more songs than usual during the pandemic and had more negative emotions than usual during the lockdown. This increase in negative emotions was cited as being a reason for the increased demand for recorded music. Therefore, we wanted to study the impact of the pandemic on the music industry.
Of the three companies chosen for this paper, Live Nation Entertainment represents live music, and Tencent Music Entertainment and Warner Music Group represent recorded music. Live Nation Entertainment’s business mainly consists of organizing live music events and selling tickets. By analyzing its stock price movement, we can predict its profit information. Tencent Music Entertainment is an online music entertainment business platform with four music apps, and it holds more than half of the market share of music streaming services in China. Warner Music Group is a multinational record company whose business focuses on recording music and music distribution, and it is one of the world’s largest music distributors.
As described in [
4], live music was greatly affected by the pandemic. Most of the concerts and music festivals were canceled or postponed, and some albums even postponed their release dates. Furthermore, [
4] also mentions that, in China, people’s daily habits have changed due to staying at home for long periods of time because of the pandemic, and people are now paying much more attention to news media. In this situation, the consumption of live music has shifted to consumption on online music platforms [
4].
From [
5], we can observe that in 2020, Tencent’s music streaming platform had a total revenue of 1.42 billion dollars, up 32 percent from the previous year. Additionally, [
5] mentions that according to Tencent officials, the revenue growth of Tencent’s music streaming service is mainly due to an increase in the number of paying subscribers from 24.4 million in 2018 to 33.7 million in 2019, a 31.8 percent increase.
The popularity of the coronavirus is gradually changing listeners’ habits, and Warner Music Group’s digital music rights revenue for 2020 is up 32% compared to the fourth quarter of last year [
6]. WMG’s revenue in the then most recent quarter came primarily from music streaming and other digital channels, according to reports from November 2020 [
6].
There are many studies on the economic developments during the COVID-19 period. We can refer to [
7,
8,
9,
10] in order to better understand the economic transition during the COVID-19 pandemic.
This paper will focus on the impact of the pandemic on live and recorded music, and we will analyze the stock prices of three representative companies: Live Nation Entertainment, Tencent Music Entertainment, and Warner Music Group.
The remainder of this paper is organized as follows:
Section 2 provides a description of the data and an empirical data analysis.
Section 3 provides the data analysis using a linear regression model and the three different correlation coefficient statistical methods. The discussion is presented in
Section 4.
2. Data Description and Data Analysis
We used stock data from the Tencent Music Entertainment Group and Live Nation Entertainment beginning on 1 January 2019, through 1 June 2022, and stock data for Warner Music Group beginning on 3 June 2020, through 1 June 2022. All stock data were acquired from the Yahoo Finance website
https://finance.yahoo.com (Accessed on 1 October 2022.). Since Warner Music Group did not go public until May 2020, it has fewer data points than the other two companies. We will use “TME” for Tencent Music Entertainment Group, “LYV” for Live Nation Entertainment, “WMG” for Warner Music Group. To deal with the large number of stock prices, we used R to analyze the stock data of Tencent Music Entertainment Group, Live Nation Entertainment, and Warner Music Group. During our analysis, we used the R packages “quantmod” and “ggplot2”. We also used Excel to make descriptive statistics of the log-return series of the three companies and a stock price graph of the average monthly stock prices of the three companies in recent years. We mainly use the adjusted close stock prices for our analysis.
First, we used the output of the descriptive statistics of the log-return series of two companies to produce
Table 1, which is divided into two periods: before and after the pandemic.
Before the pandemic, the “Skewness” of both companies’ log returns was negative, which proves that both companies had negative profits before the pandemic. After the pandemic, Tencent Music Entertainment’s “Skewness” value was lower than before, and its revenue was worse than before, while Live Nation Entertainment’s revenue was positive, changing from a loss to a profit.
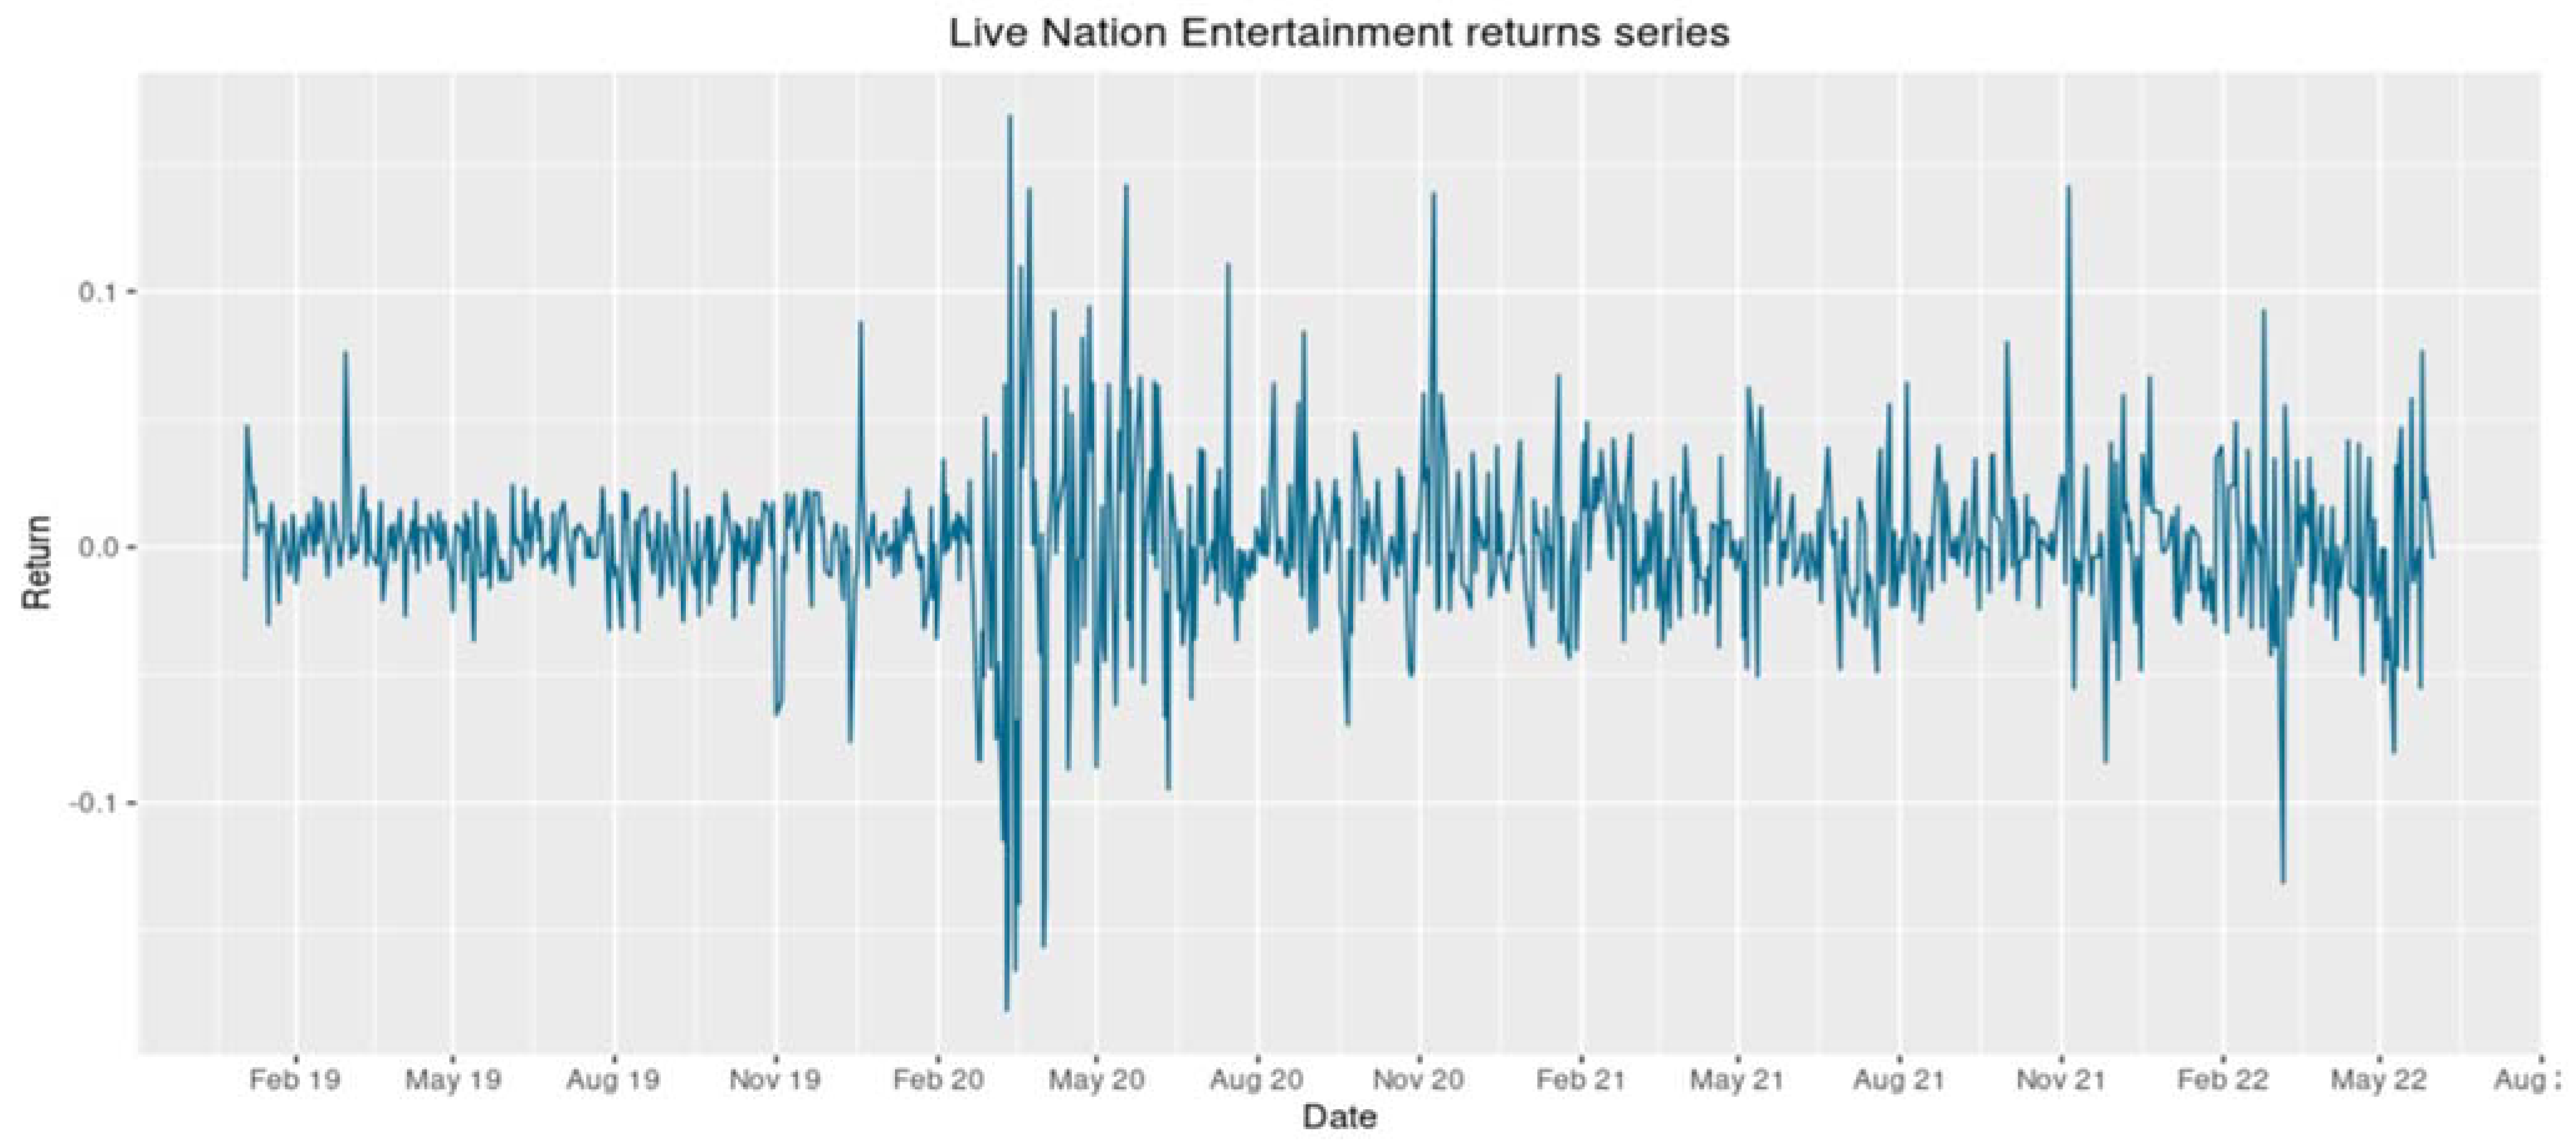
Figure 1 shows the log-returns of the Live Nation Entertainment. From the chart, we can see that both the minimum and maximum returns occurred around March 2020. For more visual observation, we have created a separate chart of LYV returns for 2020.
Table 2 shows the summary statistics of LYV log-returns from January 2019 to June 2022.
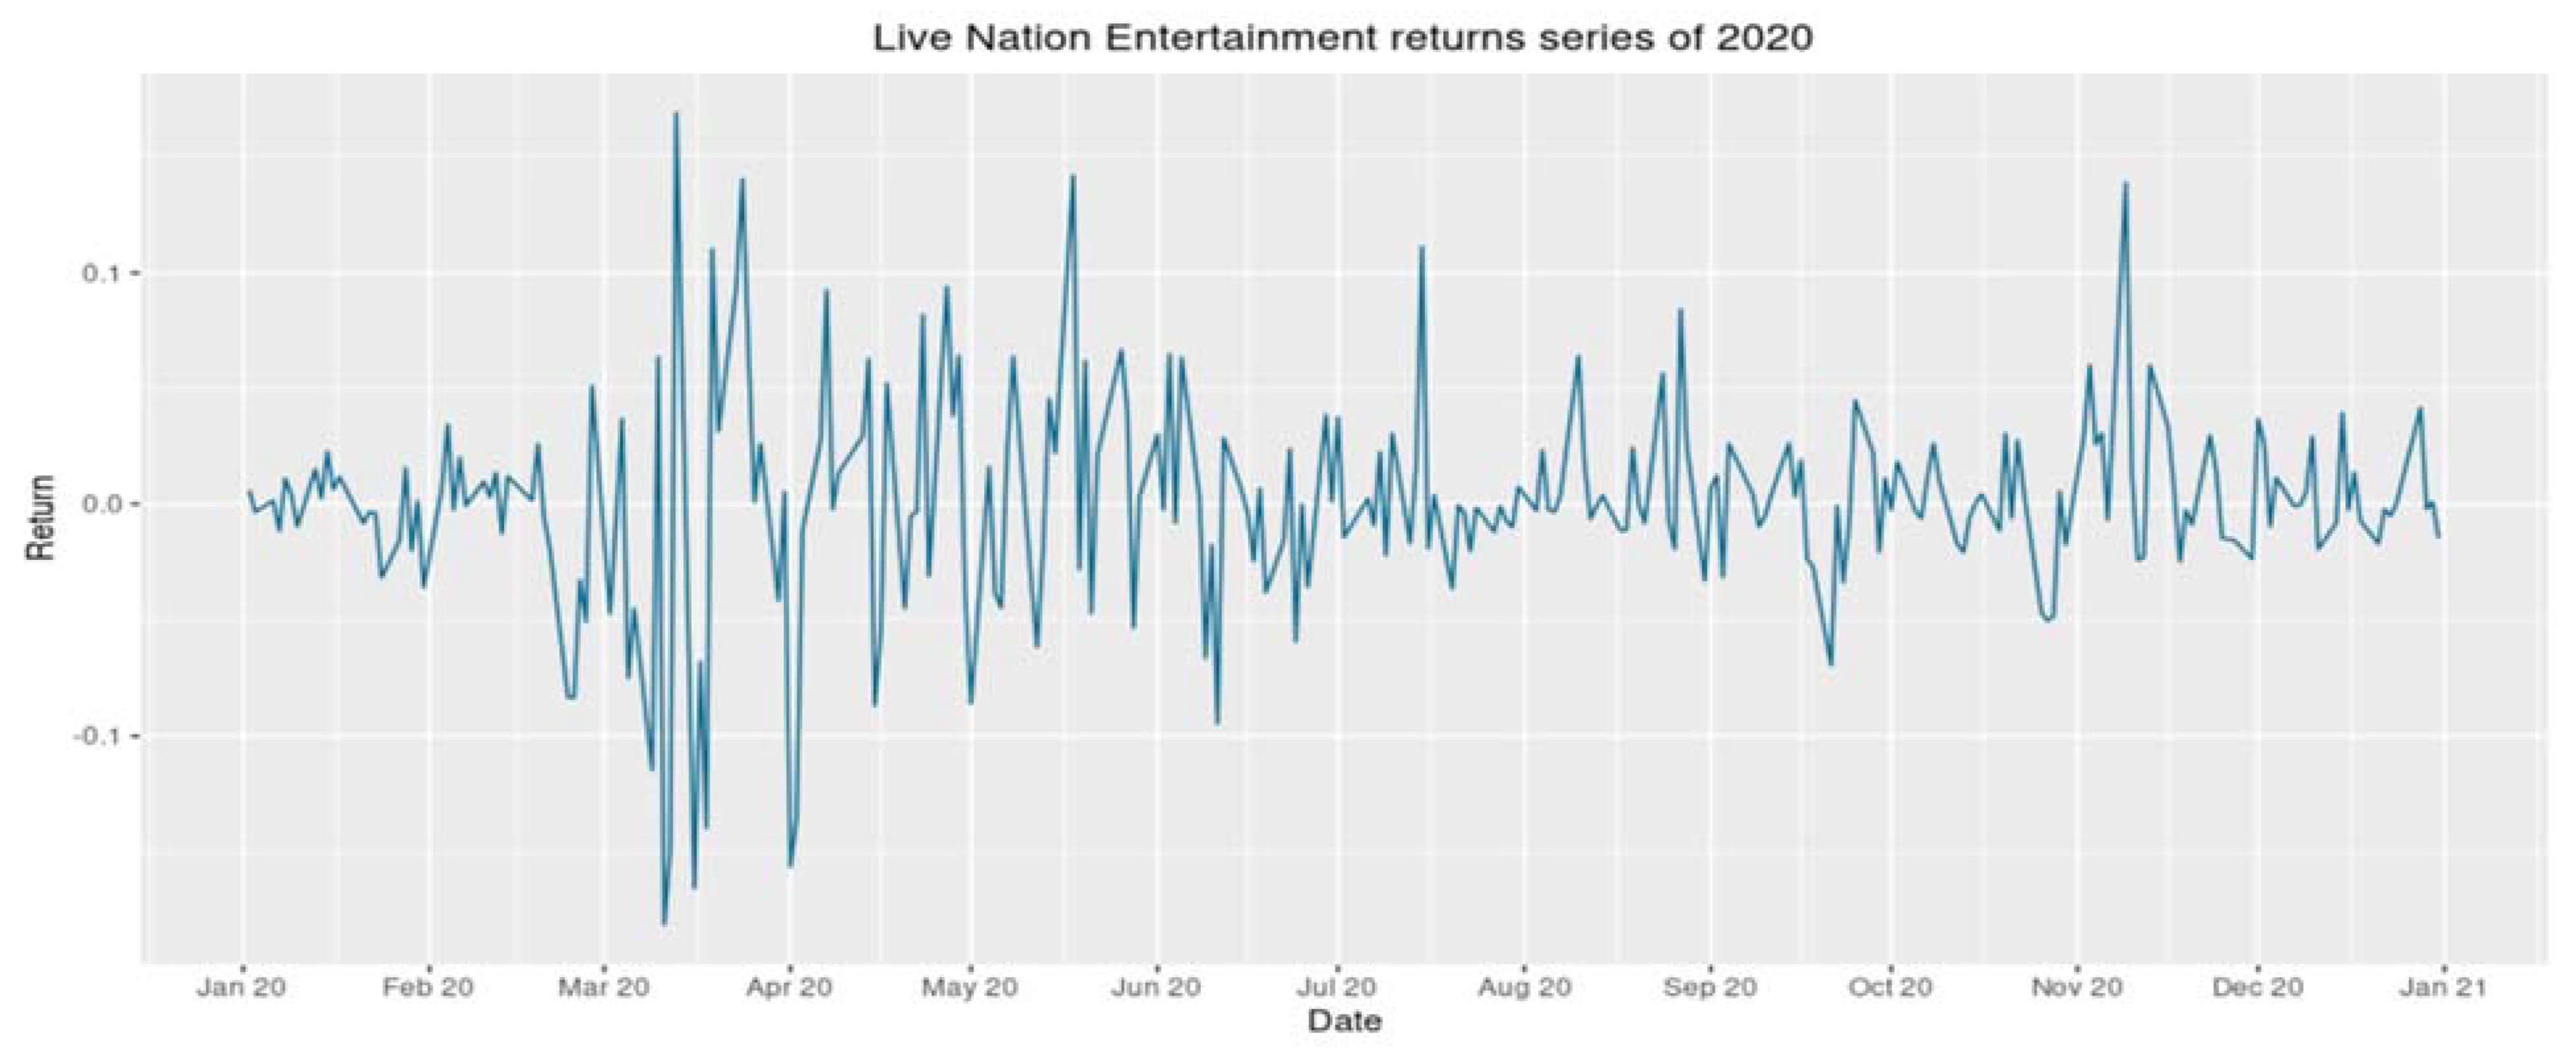
As shown in
Figure 2, we can observe that within a few months the company reached the highest and lowest returns. According to [
10], we can understand that LYV announced the cancellation of almost all global events until the end of March due to the COVID-19 pandemic, which directly led to the drop in LYV’s stock price by approximately 50% in March 2020. LYV’s stock price dropped by approximately 50% in March, and despite a subsequent recovery, the net drop was 25%. This also explains why LYV’s returns reached their lowest in March 2020 [
11].
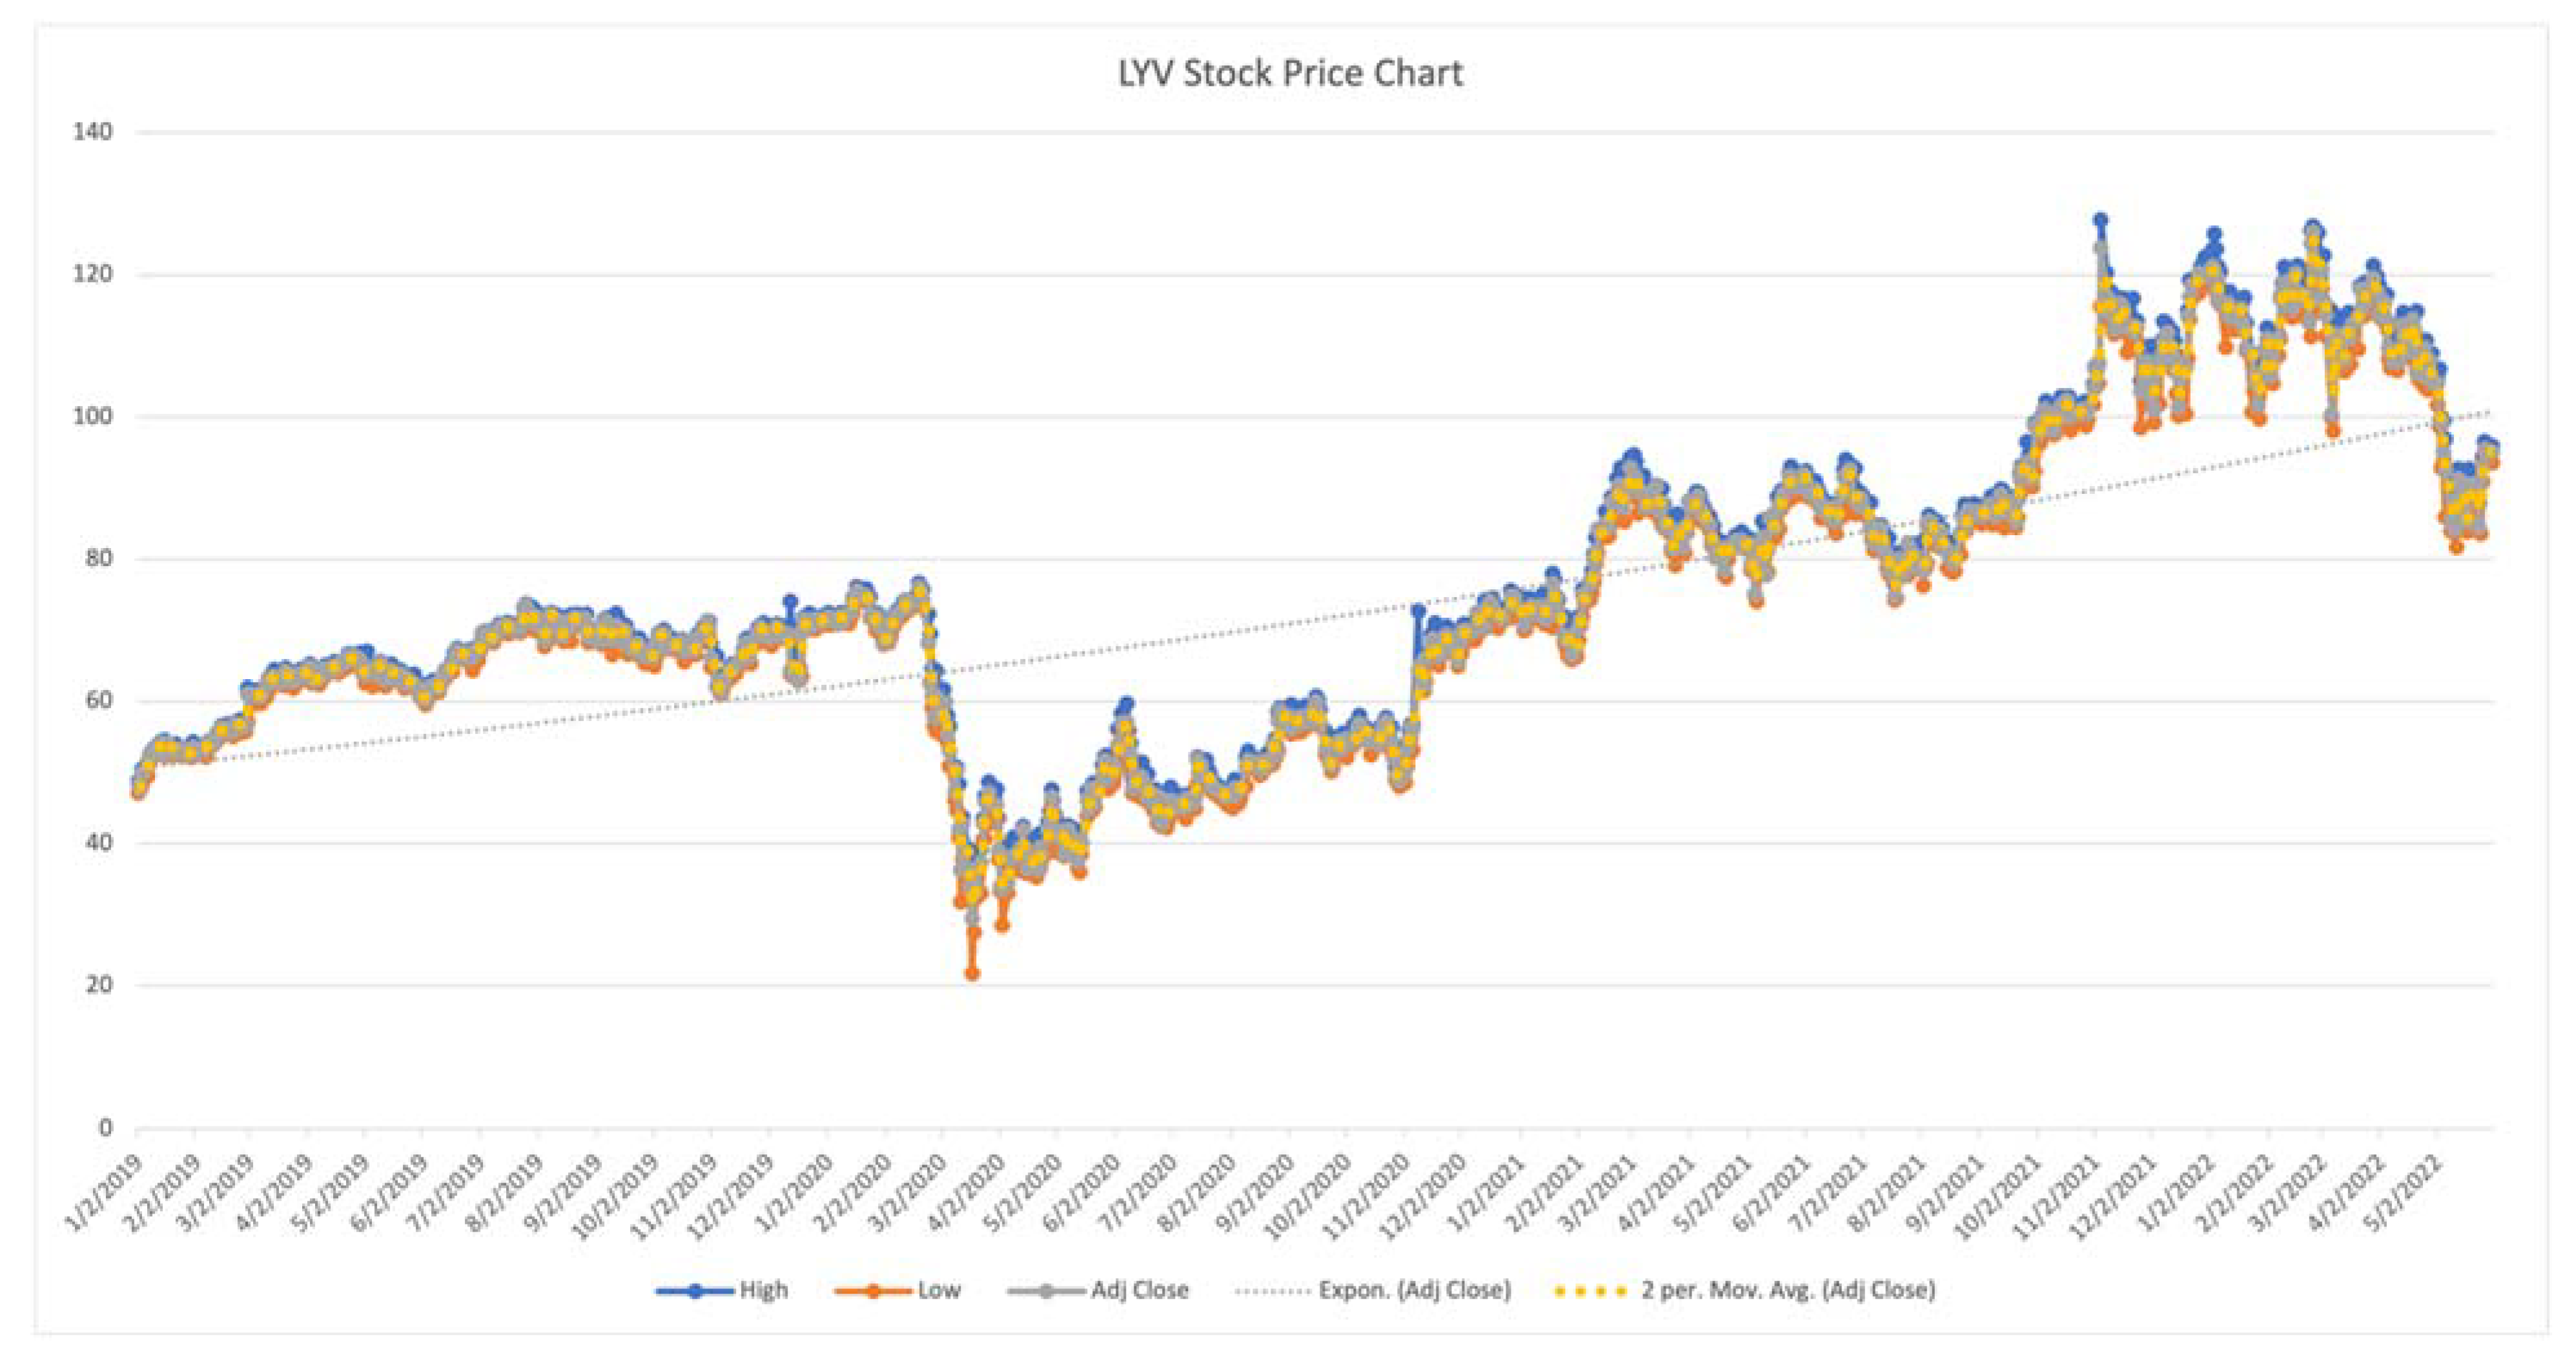
Figure 3 contains the high stock price, low stock price, and the adjusted close price of LYV from 2019 to June 2022. We have also added the average trend line and the exponential trend line for the adjusted closed stock price.
Based on the average trend line, we can see that LYV’s stock price had been steadily rising before the outbreak but suddenly declined once the outbreak of the COVID-19 virus began. The pandemic hit live music significantly, but after 2021, LYV’s stock price started to rise again due to availability of the COVID-19 vaccine. The impact of the pandemic on live music is only temporary, and according to the exponential trend line, LYV’s future stock market is very optimistic in the long run.
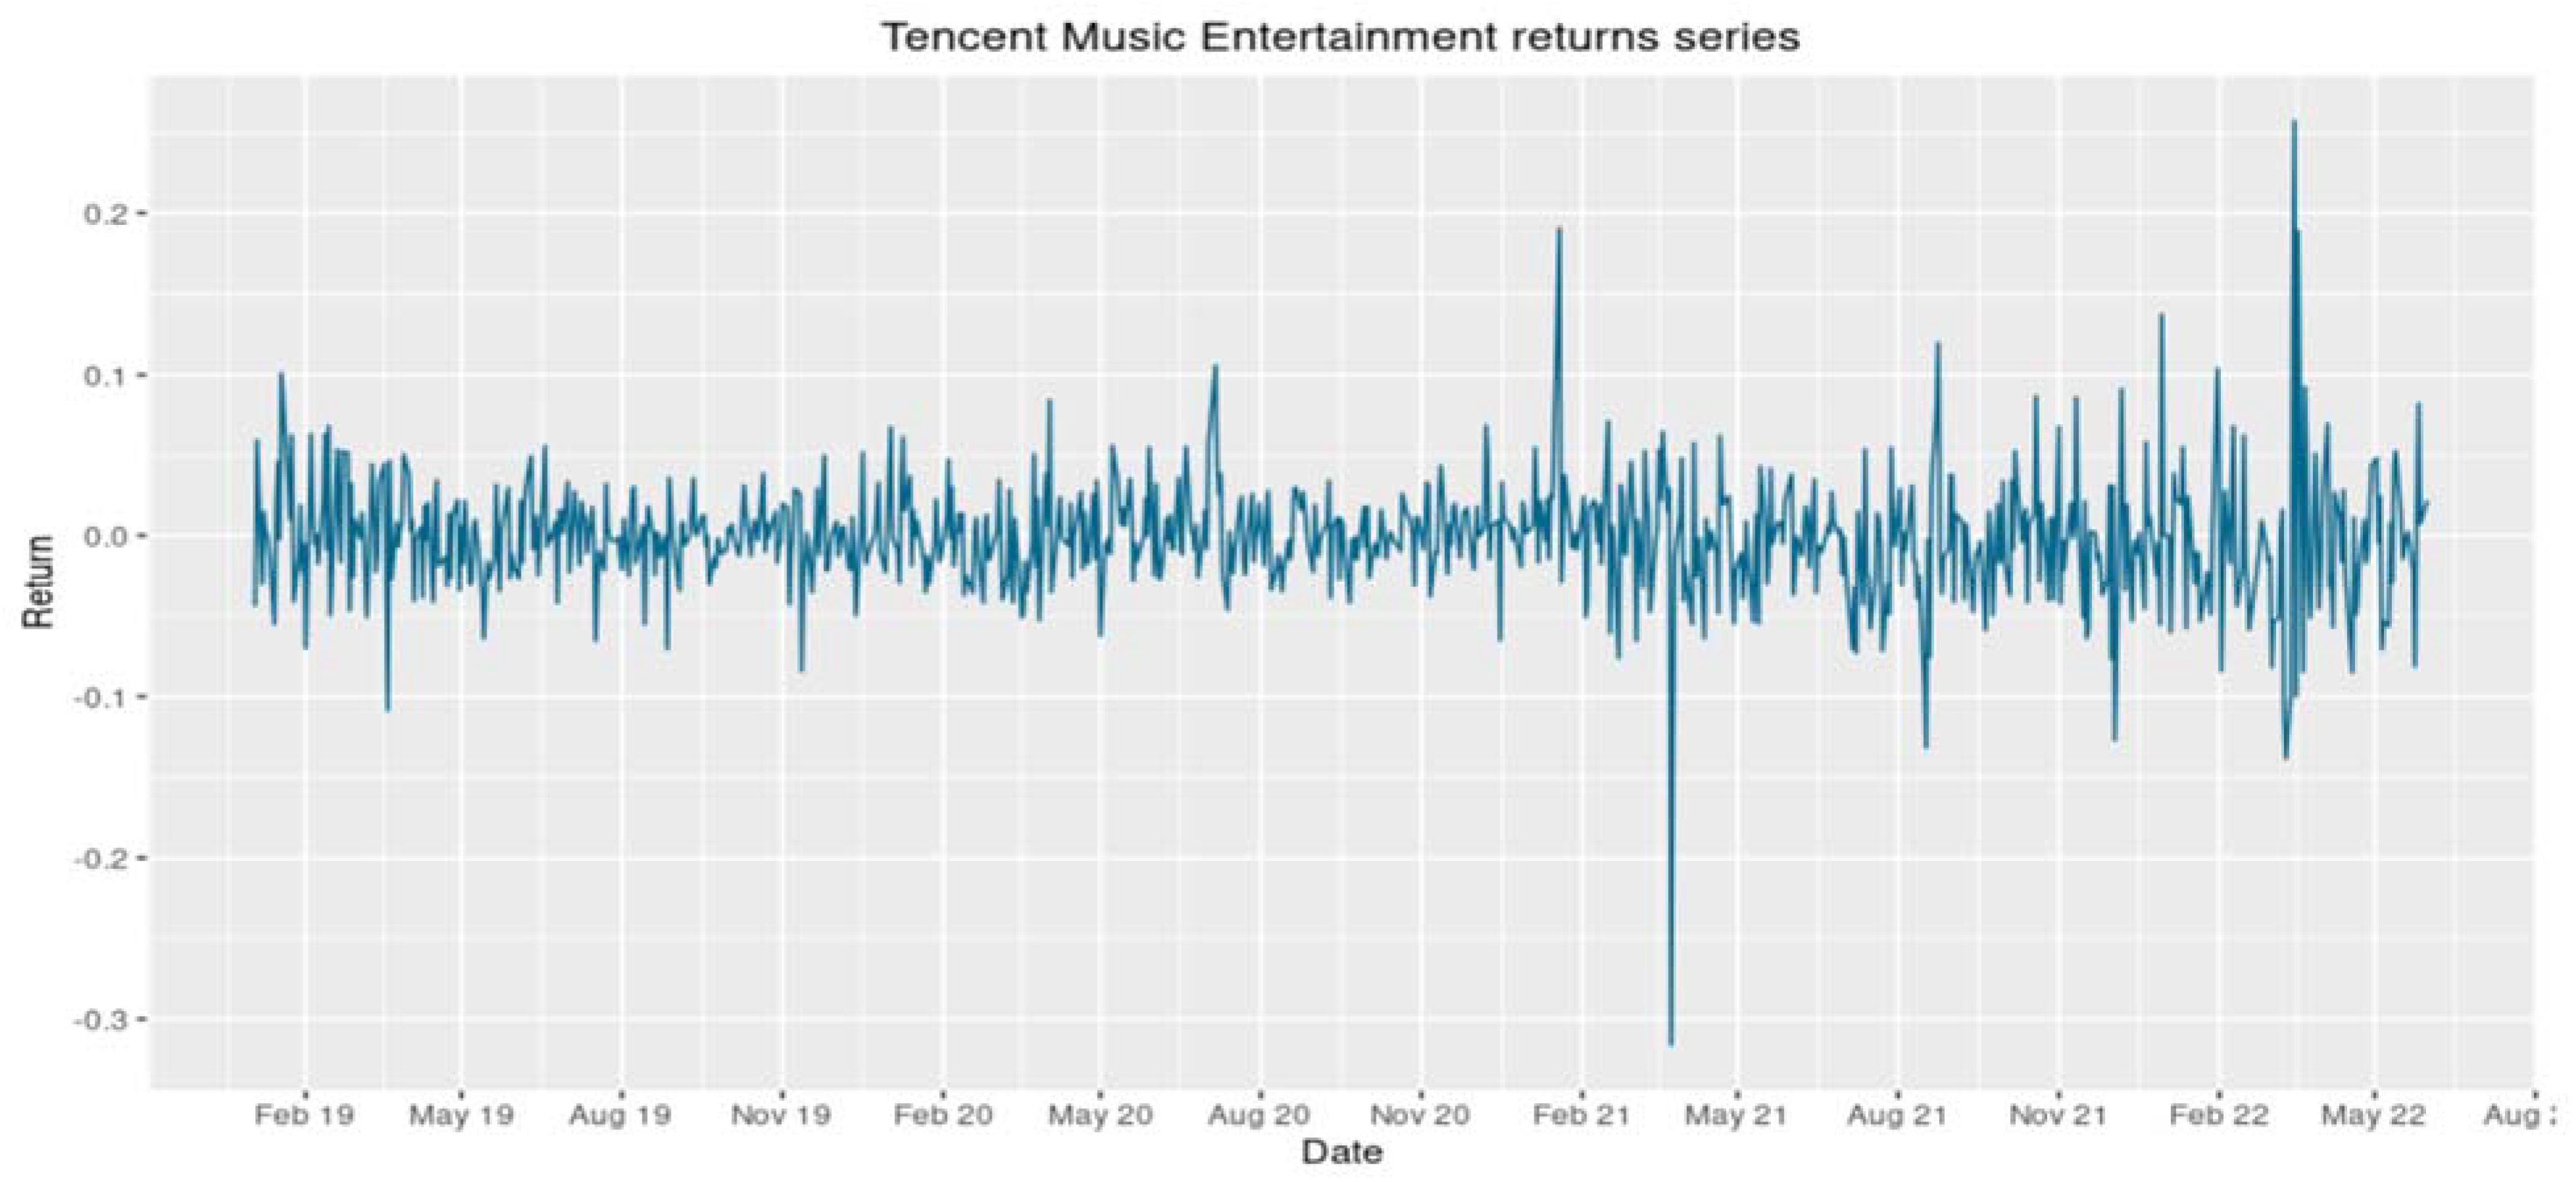
Table 3 shows the summary statistics of TME log-returns from January 2019 to June 2022.
From
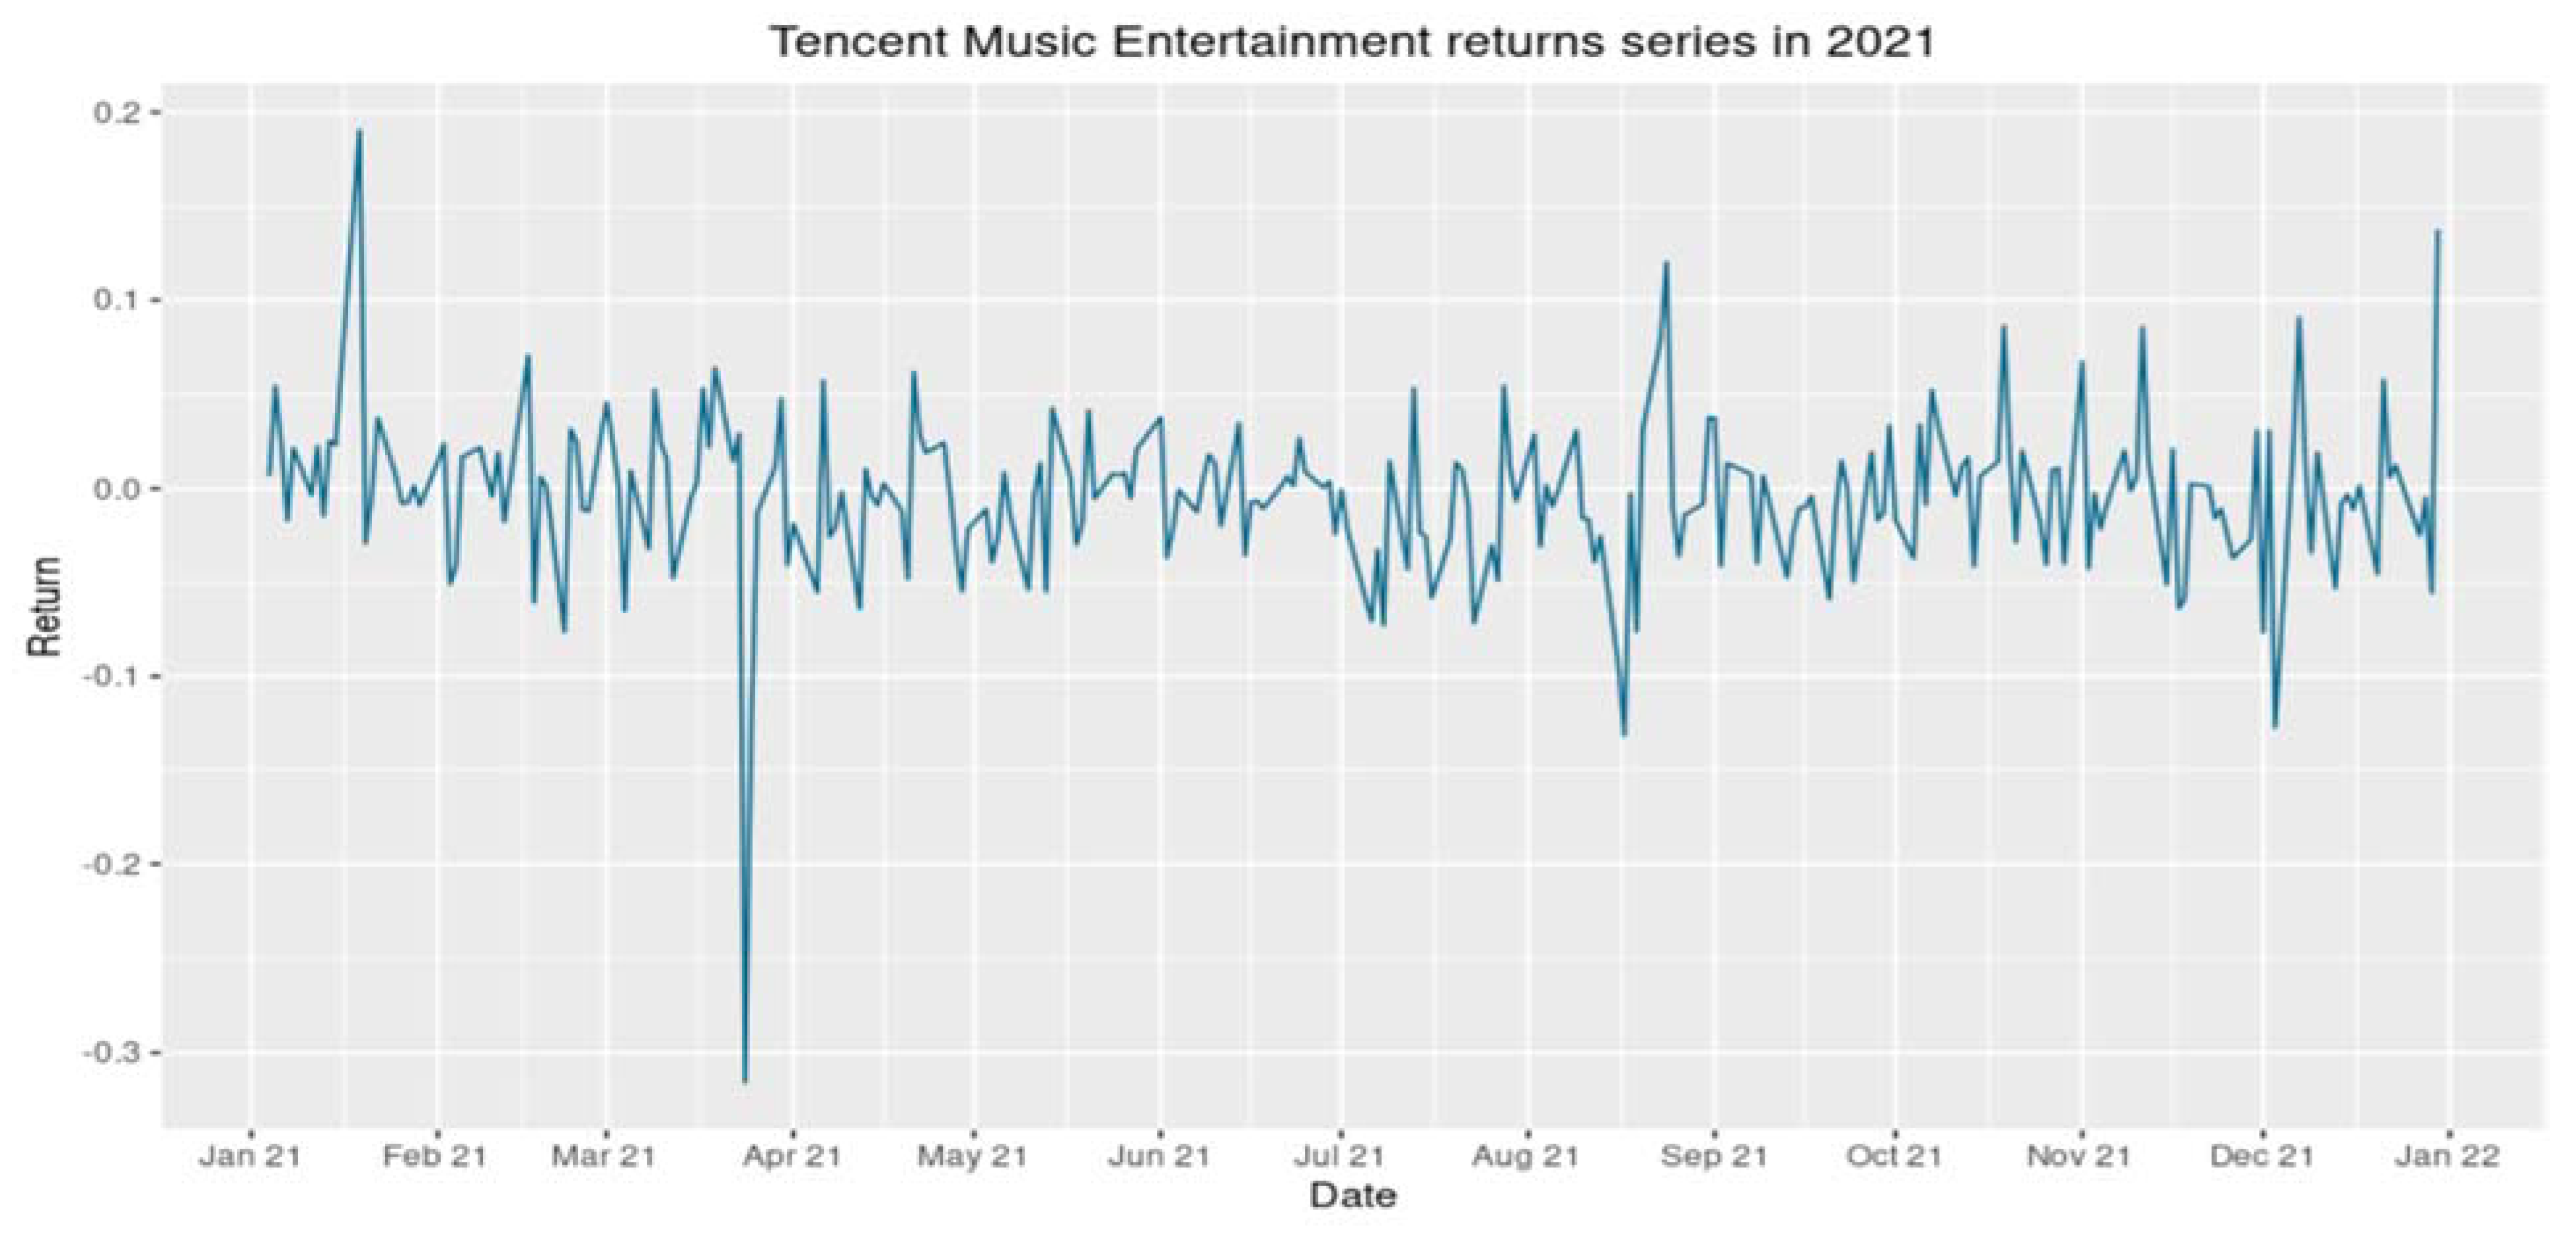
Figure 4, we can see that TME had high returns at the beginning of 2021 but reached its lowest returns in April of the same year. Since we are looking at the impact of the pandemic on the recorded music industry, we will not analyze the high returns in March 2022. To observe the 2021 trend more clearly, we created the returns graph for TME in 2021.
From
Figure 5, we can observe that TME reached the lowest returns in April 2021. The reason for this dip was because Tencent Music Entertainment was the primary target of China’s antitrust authorities in April because the company had more than 75% of the market share of streaming music in China and its monopolistic behavior was detrimental to other companies in the same industry [
12].
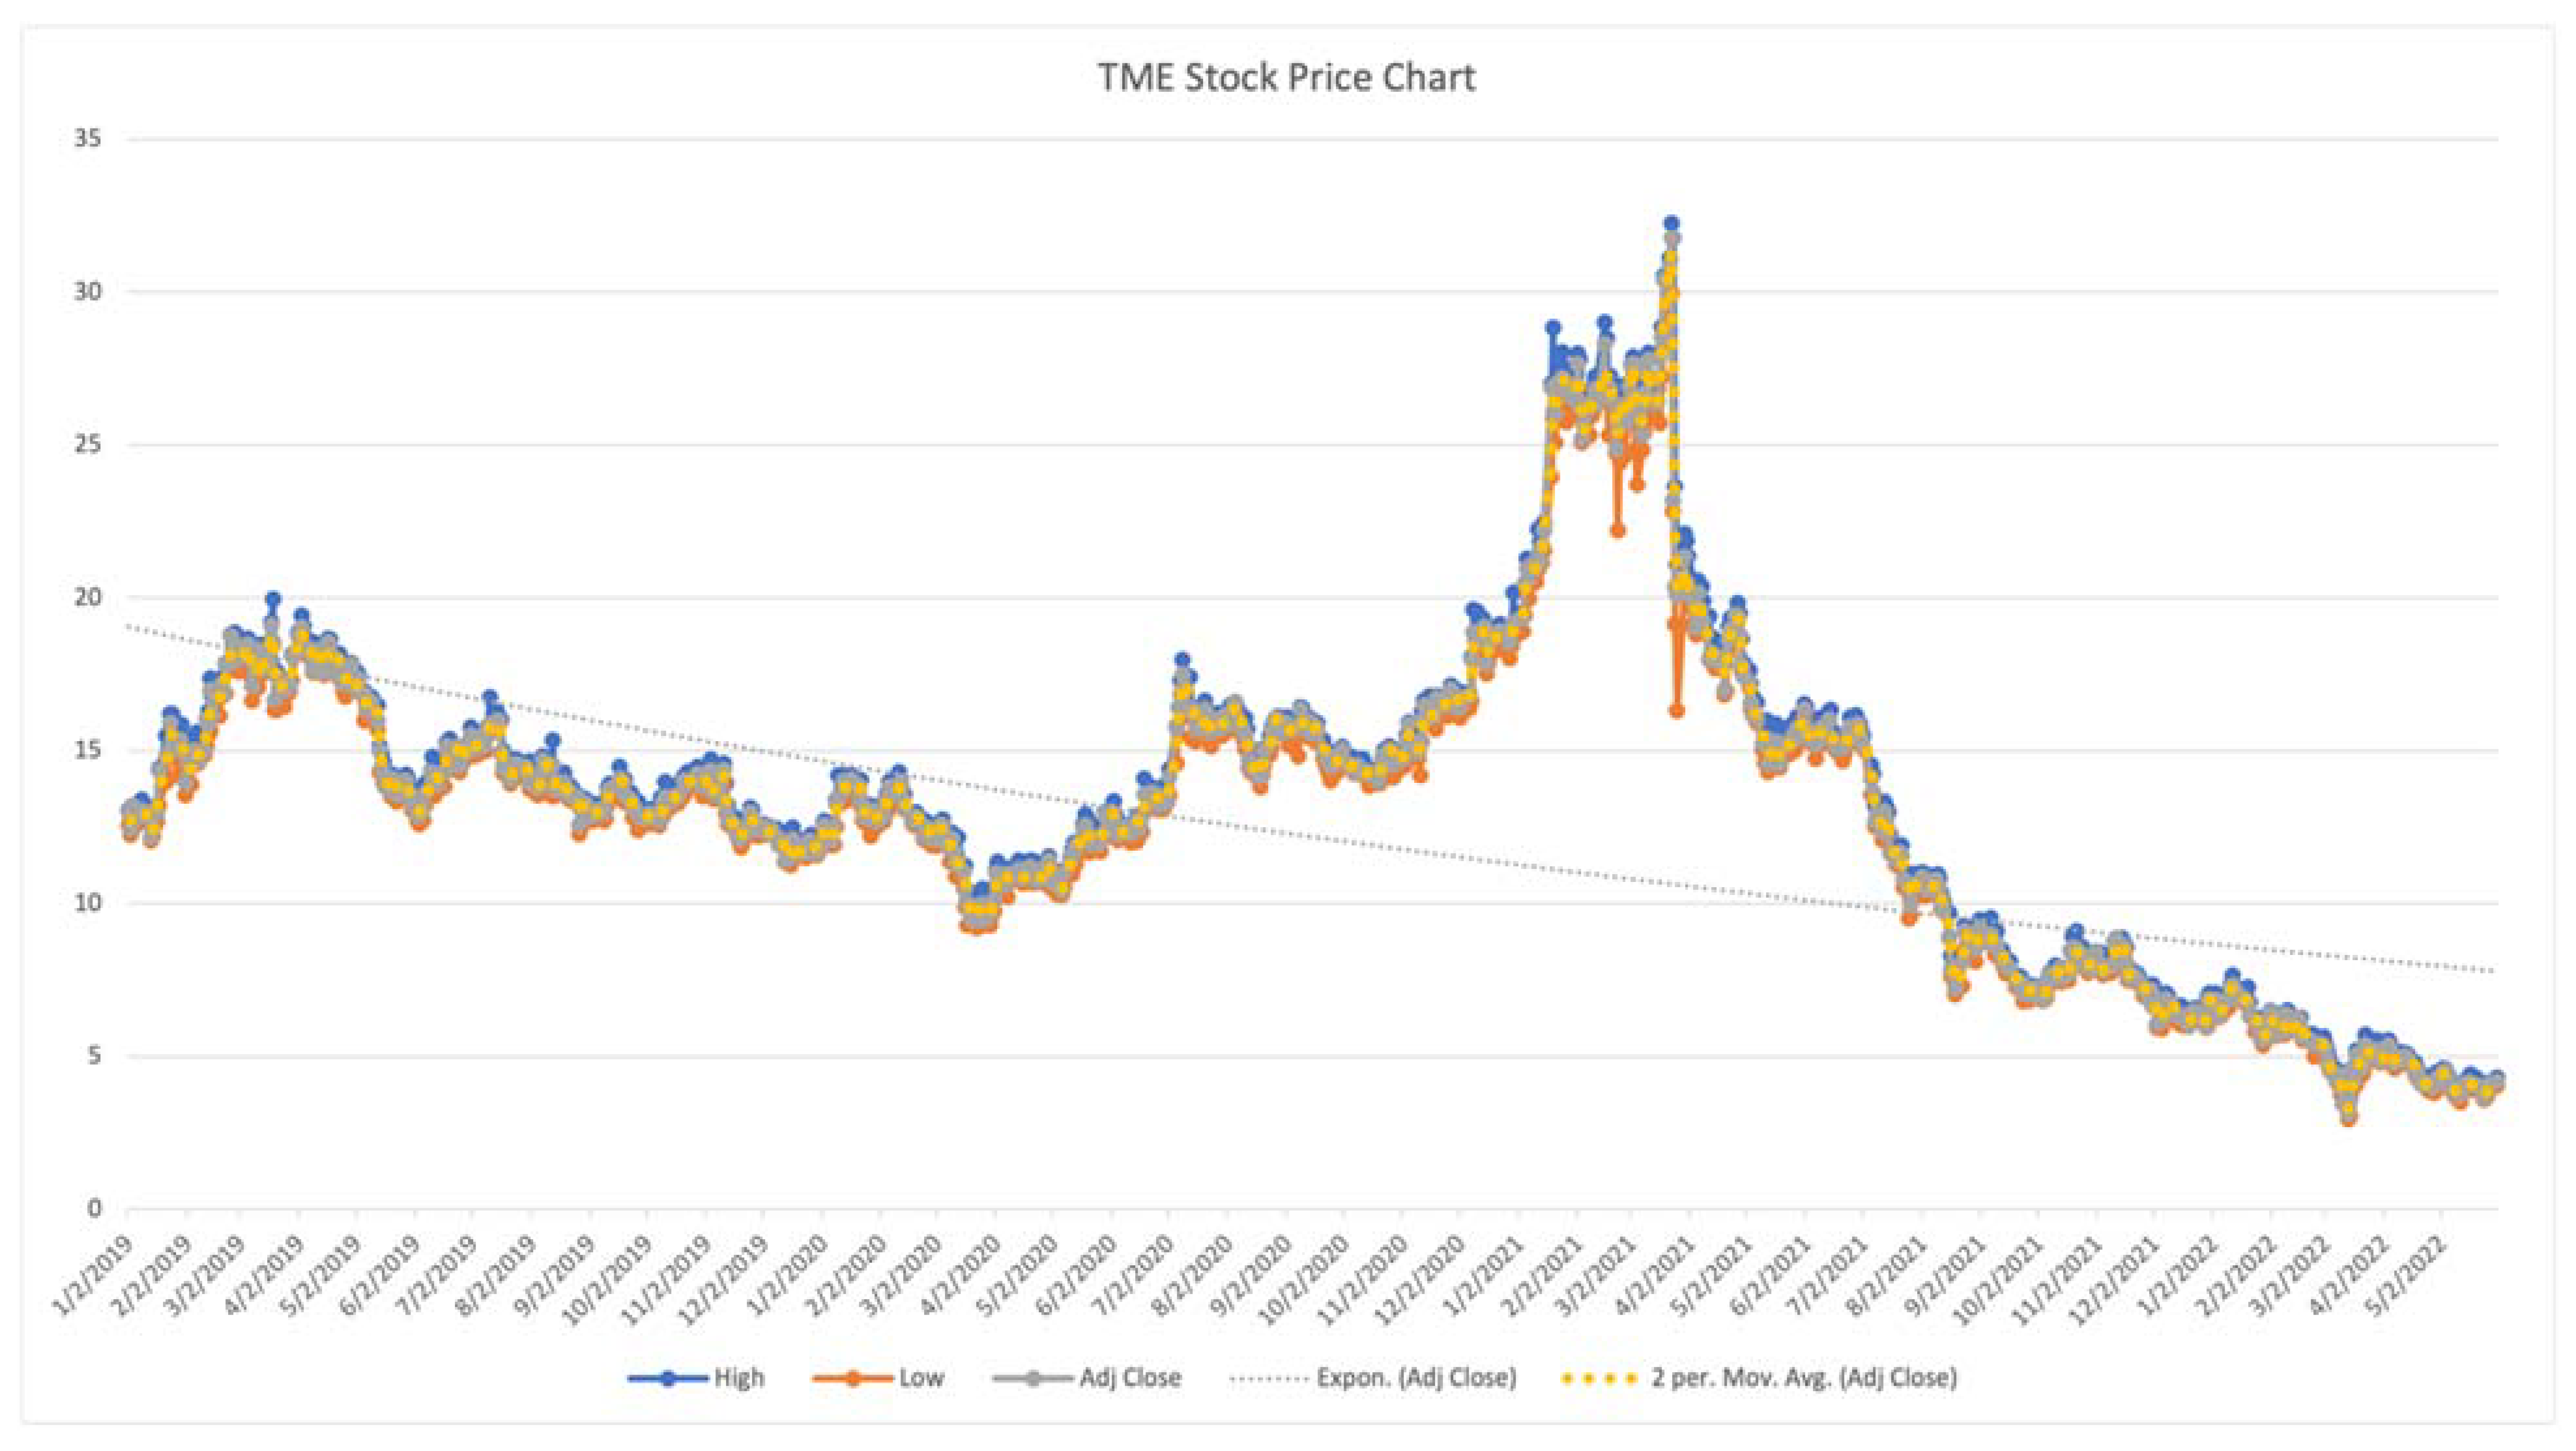
In
Figure 6, we used the stock prices of Tencent Music Entertainment from January 2019 to June 2022 and made a stock price chart. This stock price chart contains the high stock price, low stock price, and adjusted close price. We also added the average trend line and the exponential trend line for the adjusted close stock price.
According to the average trend line, TME’s stock price was trending flat before the outbreak. We can clearly see that from 2020 to early 2021, TME’s stock price rose and reached its historical peak. Compared to live music, the impact of the pandemic on recorded music was positive, as it stimulated the consumption of streaming services. However, in the long run, the impact is as short-term as the one on live music, and the future of TME’s stock market is not very optimistic.
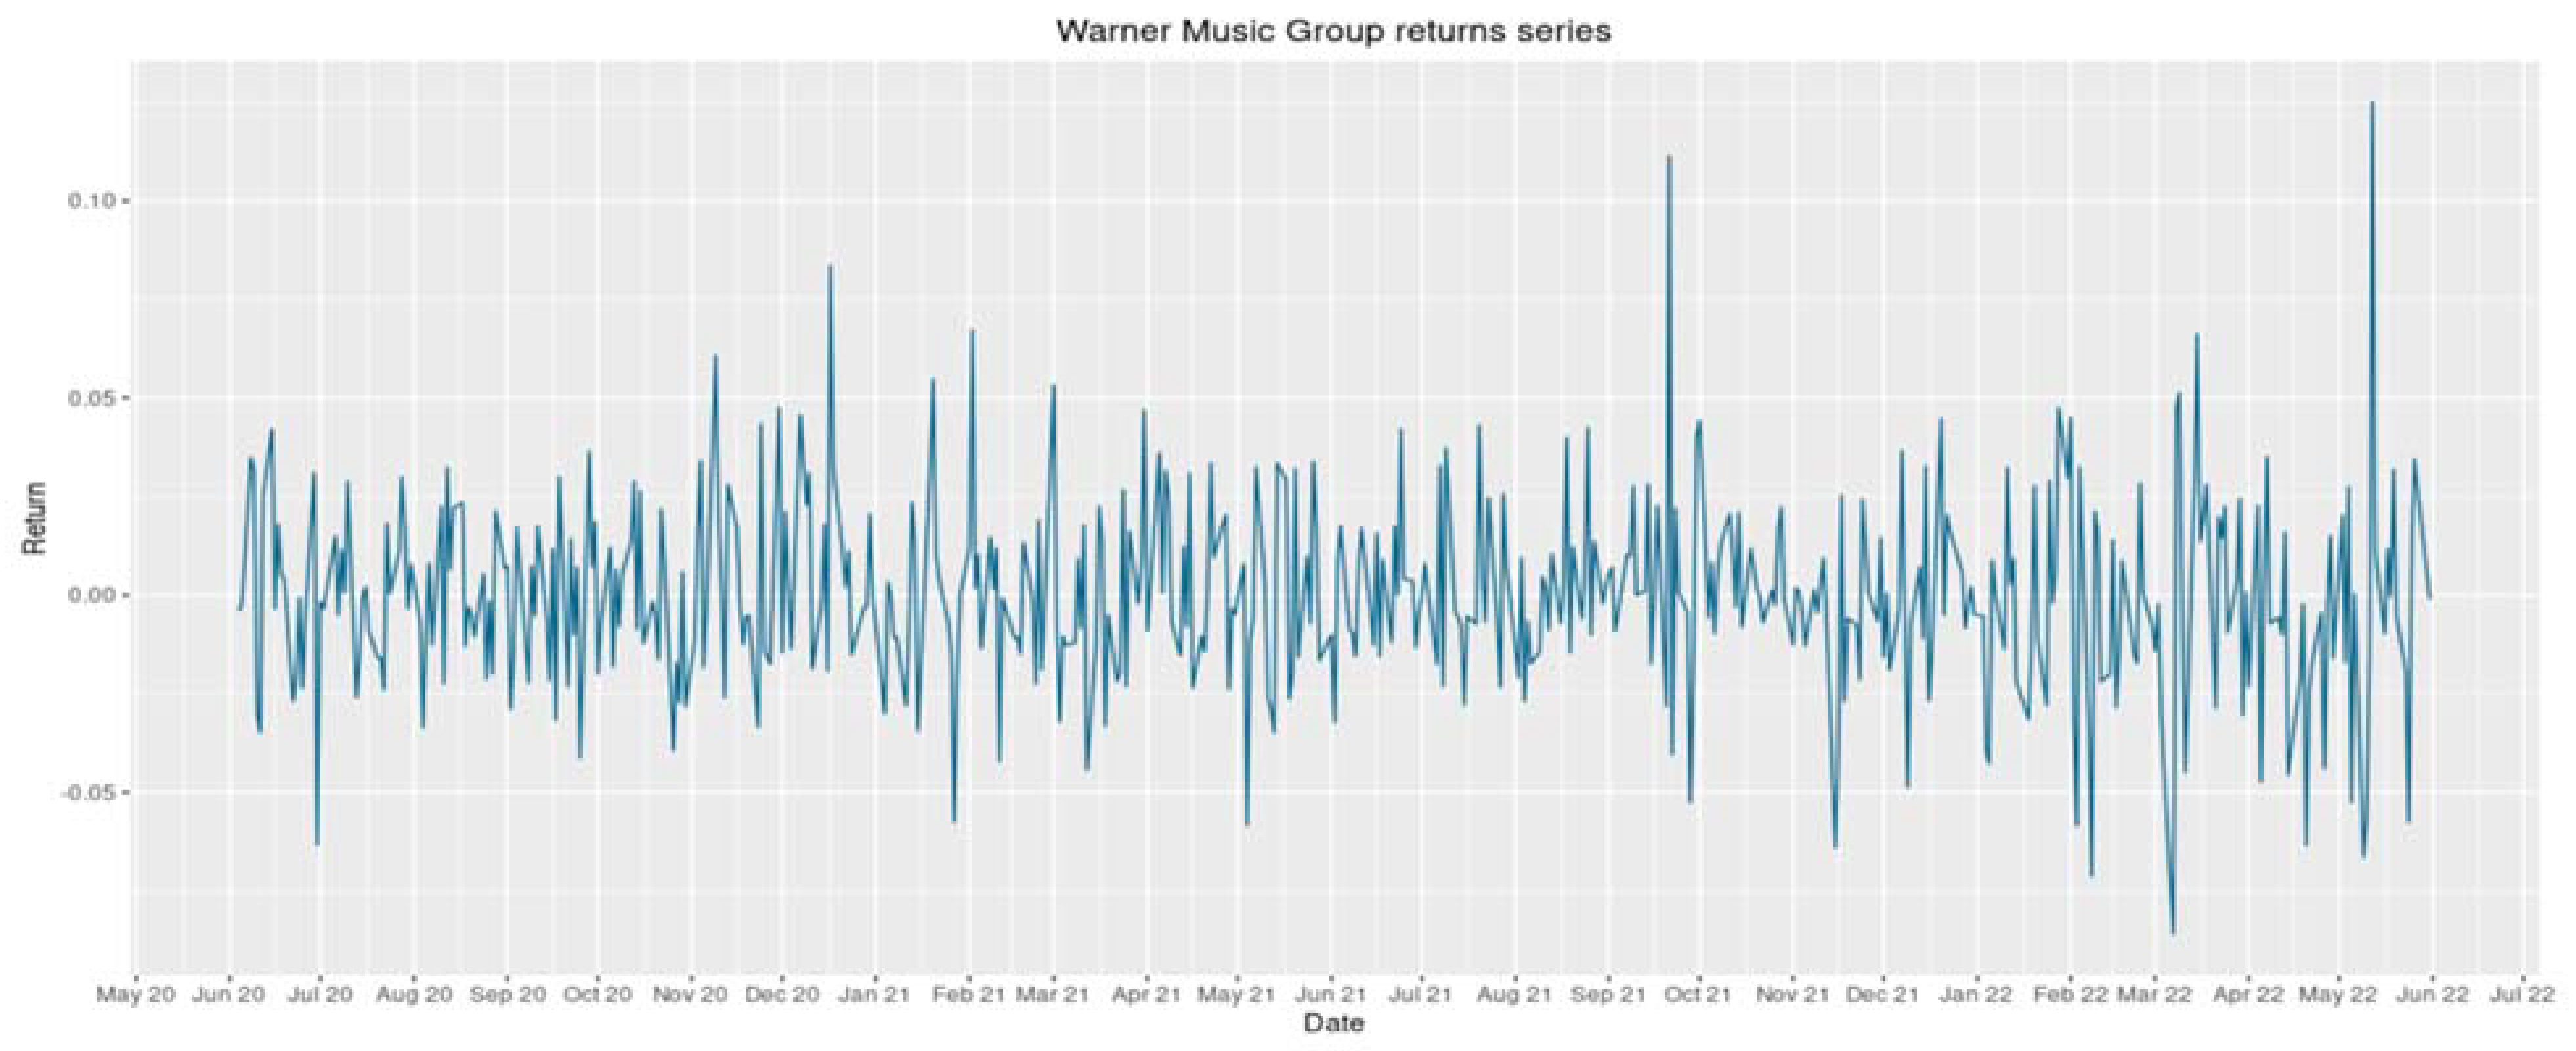
Table 4 shows the summary statistics of WMG log-returns from June 2020 to June 2022.
Figure 7 shows the log returns for WMG from June 2020 to June 2022, and we can see that WMG shows mostly negative returns from November 2021 to May 2022. WMG reached very high returns around the end of September 2021 and in the middle of May 2022.
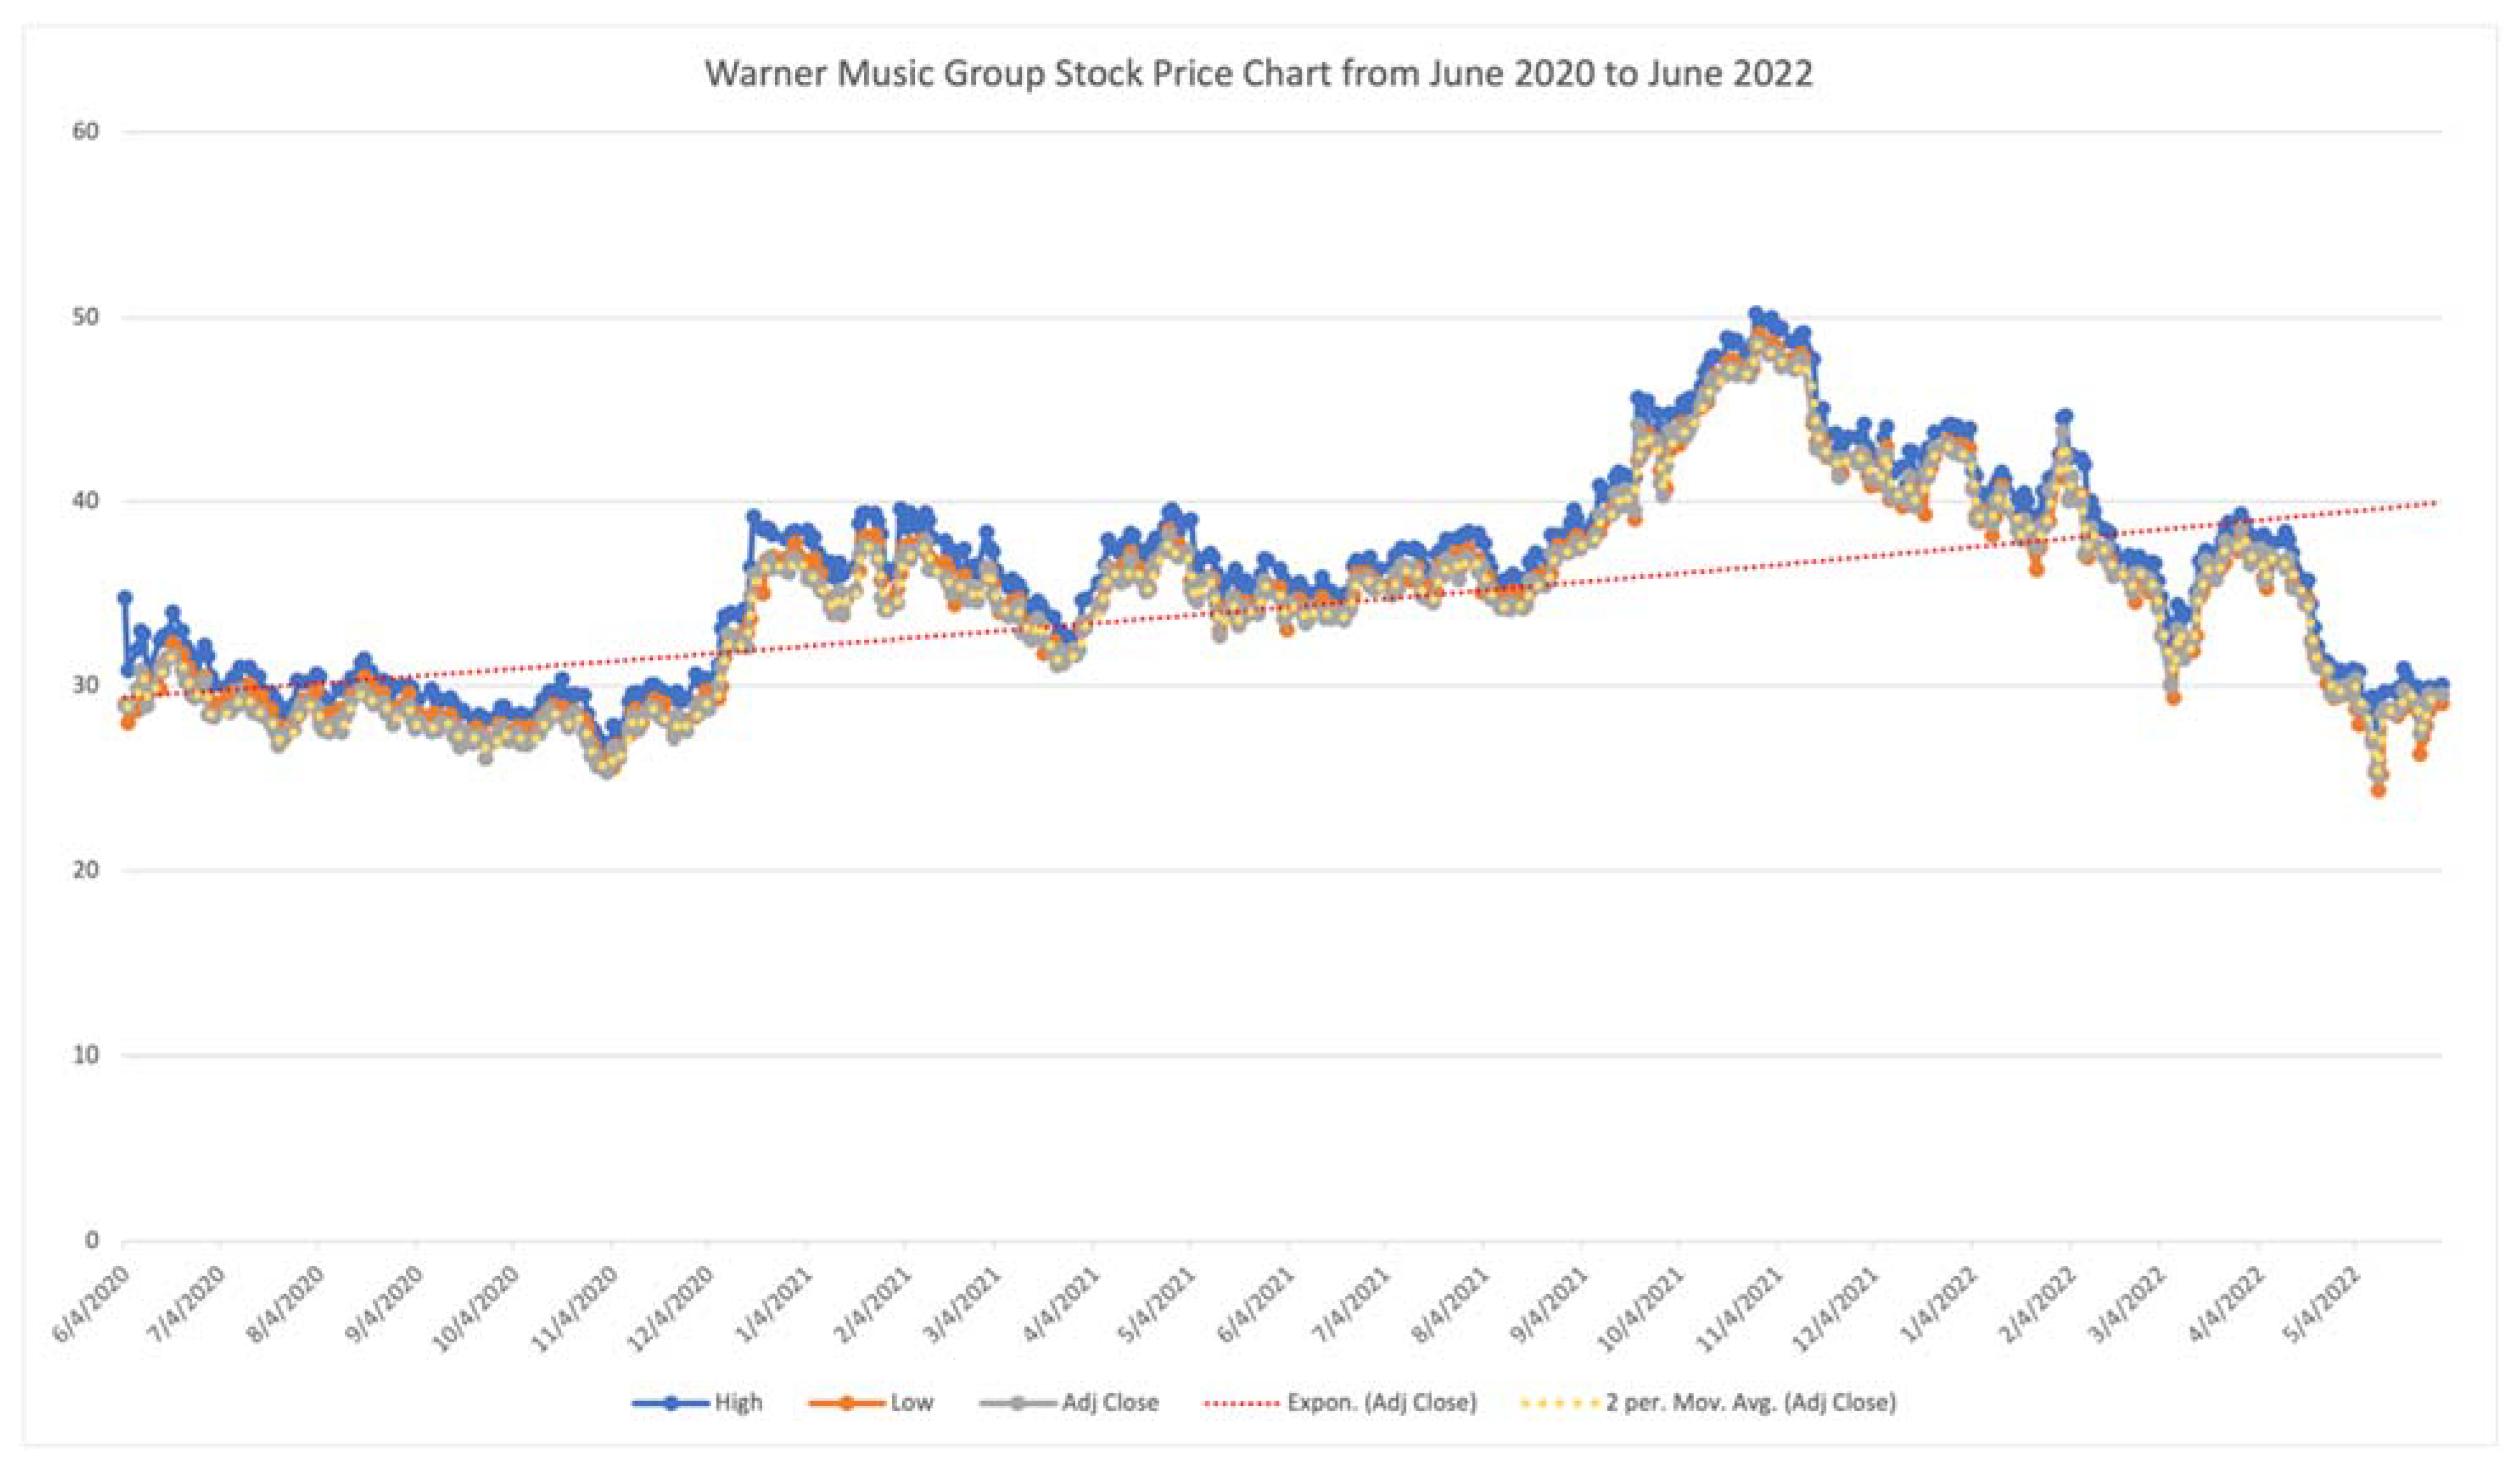
We also created a chart of the WMG stock price, in which we added the trend line of the adjusted stock price and its moving average line. From
Figure 8, we can see that the stock price of WMG increased significantly in January and November 2021 and then decreased again. In 2021, there was a significant increase in the stock price of WMG. Benefiting from the coronavirus that changed people’s music listening habits, WMG digital revenues grew by more than 20% in 2021, not only because of increased streaming subscriptions but also because of the increase in subscribers and the fact that they were paying more money [
13]. We can observe from the exponential trend line of the adjusted close price that WMG’s stock price is showing an increasing trend, which proves that the future of WMG’s stock market is promising.
Nevertheless, we also need to consider that the pandemic has had a negative impact on the overall stock market in early 2020, and research evidence showed that COVID-19 had a negative impact on the major stock indices of representative countries, including the United States and China [
6]. The COVID-19 pandemic also affected the stock indices of the music companies considered in this paper.
Overall, at the peak of the pandemic (early 2020), the log-return of LYV showed a substantial decline, while the return of TME reached a new high. Although WMG’s data is somewhat lacking, being only available after June 2020, the general trend of WMG’s stock price was upward during this period, contrary to TME. We believe this was influenced by the different scope of operations of the two companies, with TME’s main business lying in the Chinese market and WMG being a multinational corporation; the former was influenced by Chinese pandemic prevention and control policies and regulators while the latter was not. However, both the positive and negative effects of the pandemic seemed to be temporary because the pandemic did not last forever.
3. Statistical Relationship by Linear Regression and Correlation Coefficients
Because both TME and WMG represent recorded music, we first explored the relationship between the log return of TME and LYV before conducting a study of the relationship between WMG and LYV.
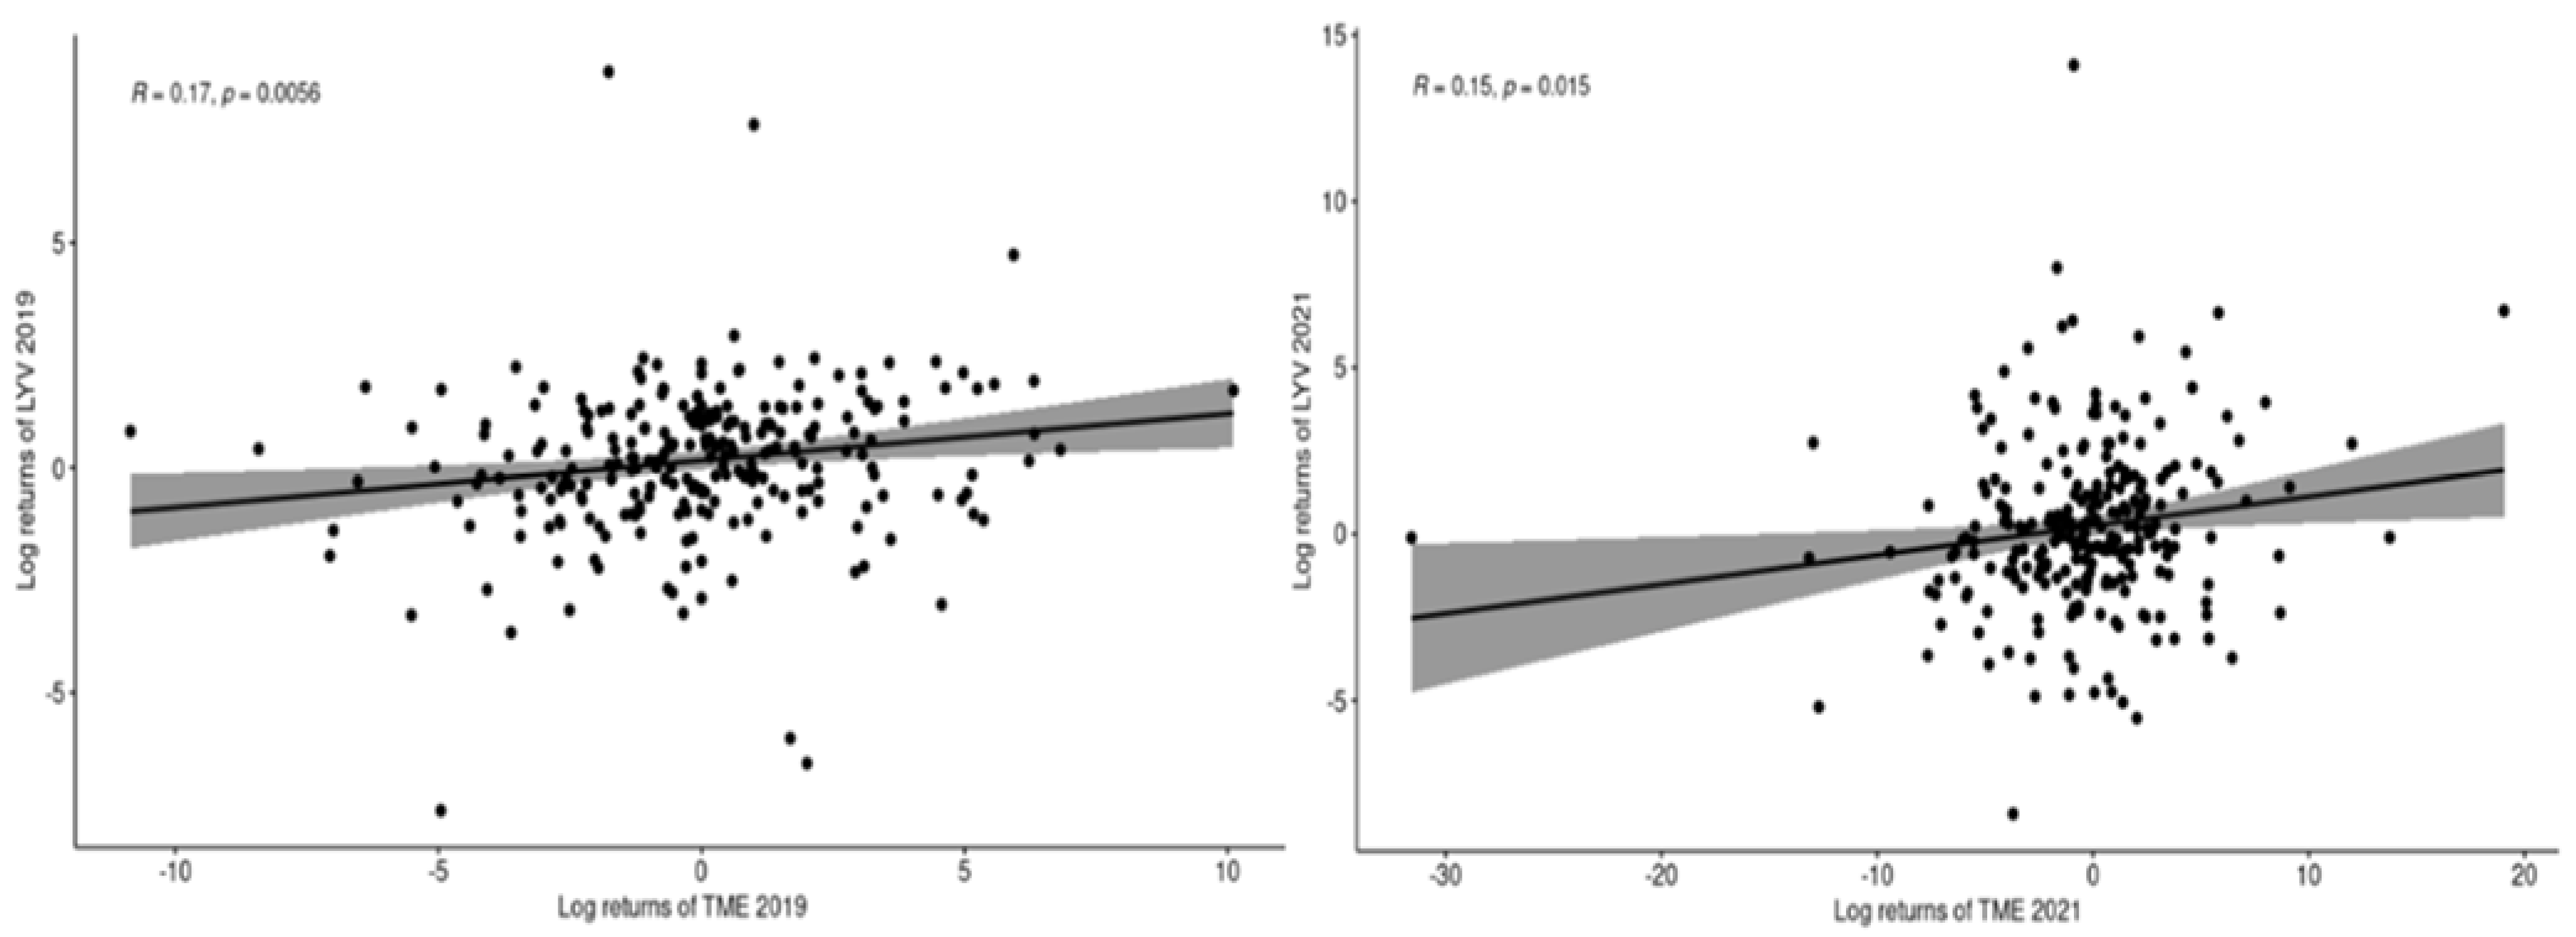
We first studied the relationship between the returns of TME and LYV. To explore whether there was a relationship between the log return of the two companies, we calculated the correlation between them. By comparing the correlation before and after the pandemic, we could observe whether there was a significant effect of the pandemic on live music and recorded music. To make the results more accurate, we chose data from the whole year of 2019 and the whole year of 2021 for the analysis. First, we calculated the linear regression of the TME log return and LYV log return before and after the pandemic. We also used the log return of TME as the predictor variable and the log return of LYV as the response variable.
Table 5 shows the output of the linear regression of the TME log return and the LYV log return before the pandemic. The null hypothesis is that there is no linear relationship between the log return of LYV and the log return of TME, and the alternative hypothesis is that there is a linear relationship between the log return of LYV and the log return of TME. Since the
p-value is smaller than the 5% significance level, the data are inconsistent with null hypothesis (NH). Therefore, we have evidence to doubt the NH and evidence to support the alternative hypothesis (AH). We have evidence to support that there is a linear relationship between the log return of LYV and the log return of TME. Both the upper and the lower values of the confidence interval are positive, meaning there is evidence the true coefficient is positive, and therefore, there is a positive association between the log return of LYV and the log return of TME. As the log return of TME increases by one unit, the log return of LYV will also increase by 0.1041.
Table 6 shows the output of the linear regression of the TME log return and the LYV log return after the pandemic. The null hypothesis is that there is no linear relationship between the log return of LYV and the log return of TME, and the alternative hypothesis is that there is a linear relationship between the log return of LYV and the log return of TME. Since the
p-value is smaller than the 5% significance level, the data are inconsistent with NH. Therefore, we have evidence to doubt NH and evidence to support AH. We have evidence to support that there is a linear relationship between the log return of LYV and the log return of TME. Both the upper and the lower values of the confidence interval are positive, meaning there is evidence the true coefficient is positive, and therefore, there is a positive association between the log return of LYV and the log return of TME. As the log return of TME increases by one unit, the log return of LYV will also increase by 0.087.
We found that the coefficient after the pandemic was smaller than the coefficient before the pandemic, although the difference is very small. We do not have enough evidence to conclude anything from it. With the R software, we obtained the outputs of the Pearson correlation test and the scatter plot of the log returns of the two companies.
Figure 9 shows that both show a slightly increasing trend, and both the
p-values are smaller than the 5% significance level.
We used these three correlation parametric and nonparametric tests in this paper.
Table 7 shows the outputs. It can be observed that both before and after the pandemic, the correlation coefficients obtained by three methods were positive but close to zero and the
p-values were smaller than the 5% significance level.
Nevertheless, the post-pandemic correlation coefficients are a little smaller than the pre-pandemic ones but only by a small margin. We cannot conclude that there is a negative relationship between the log returns of LYV and TME but it shows a low positive relationship between them.
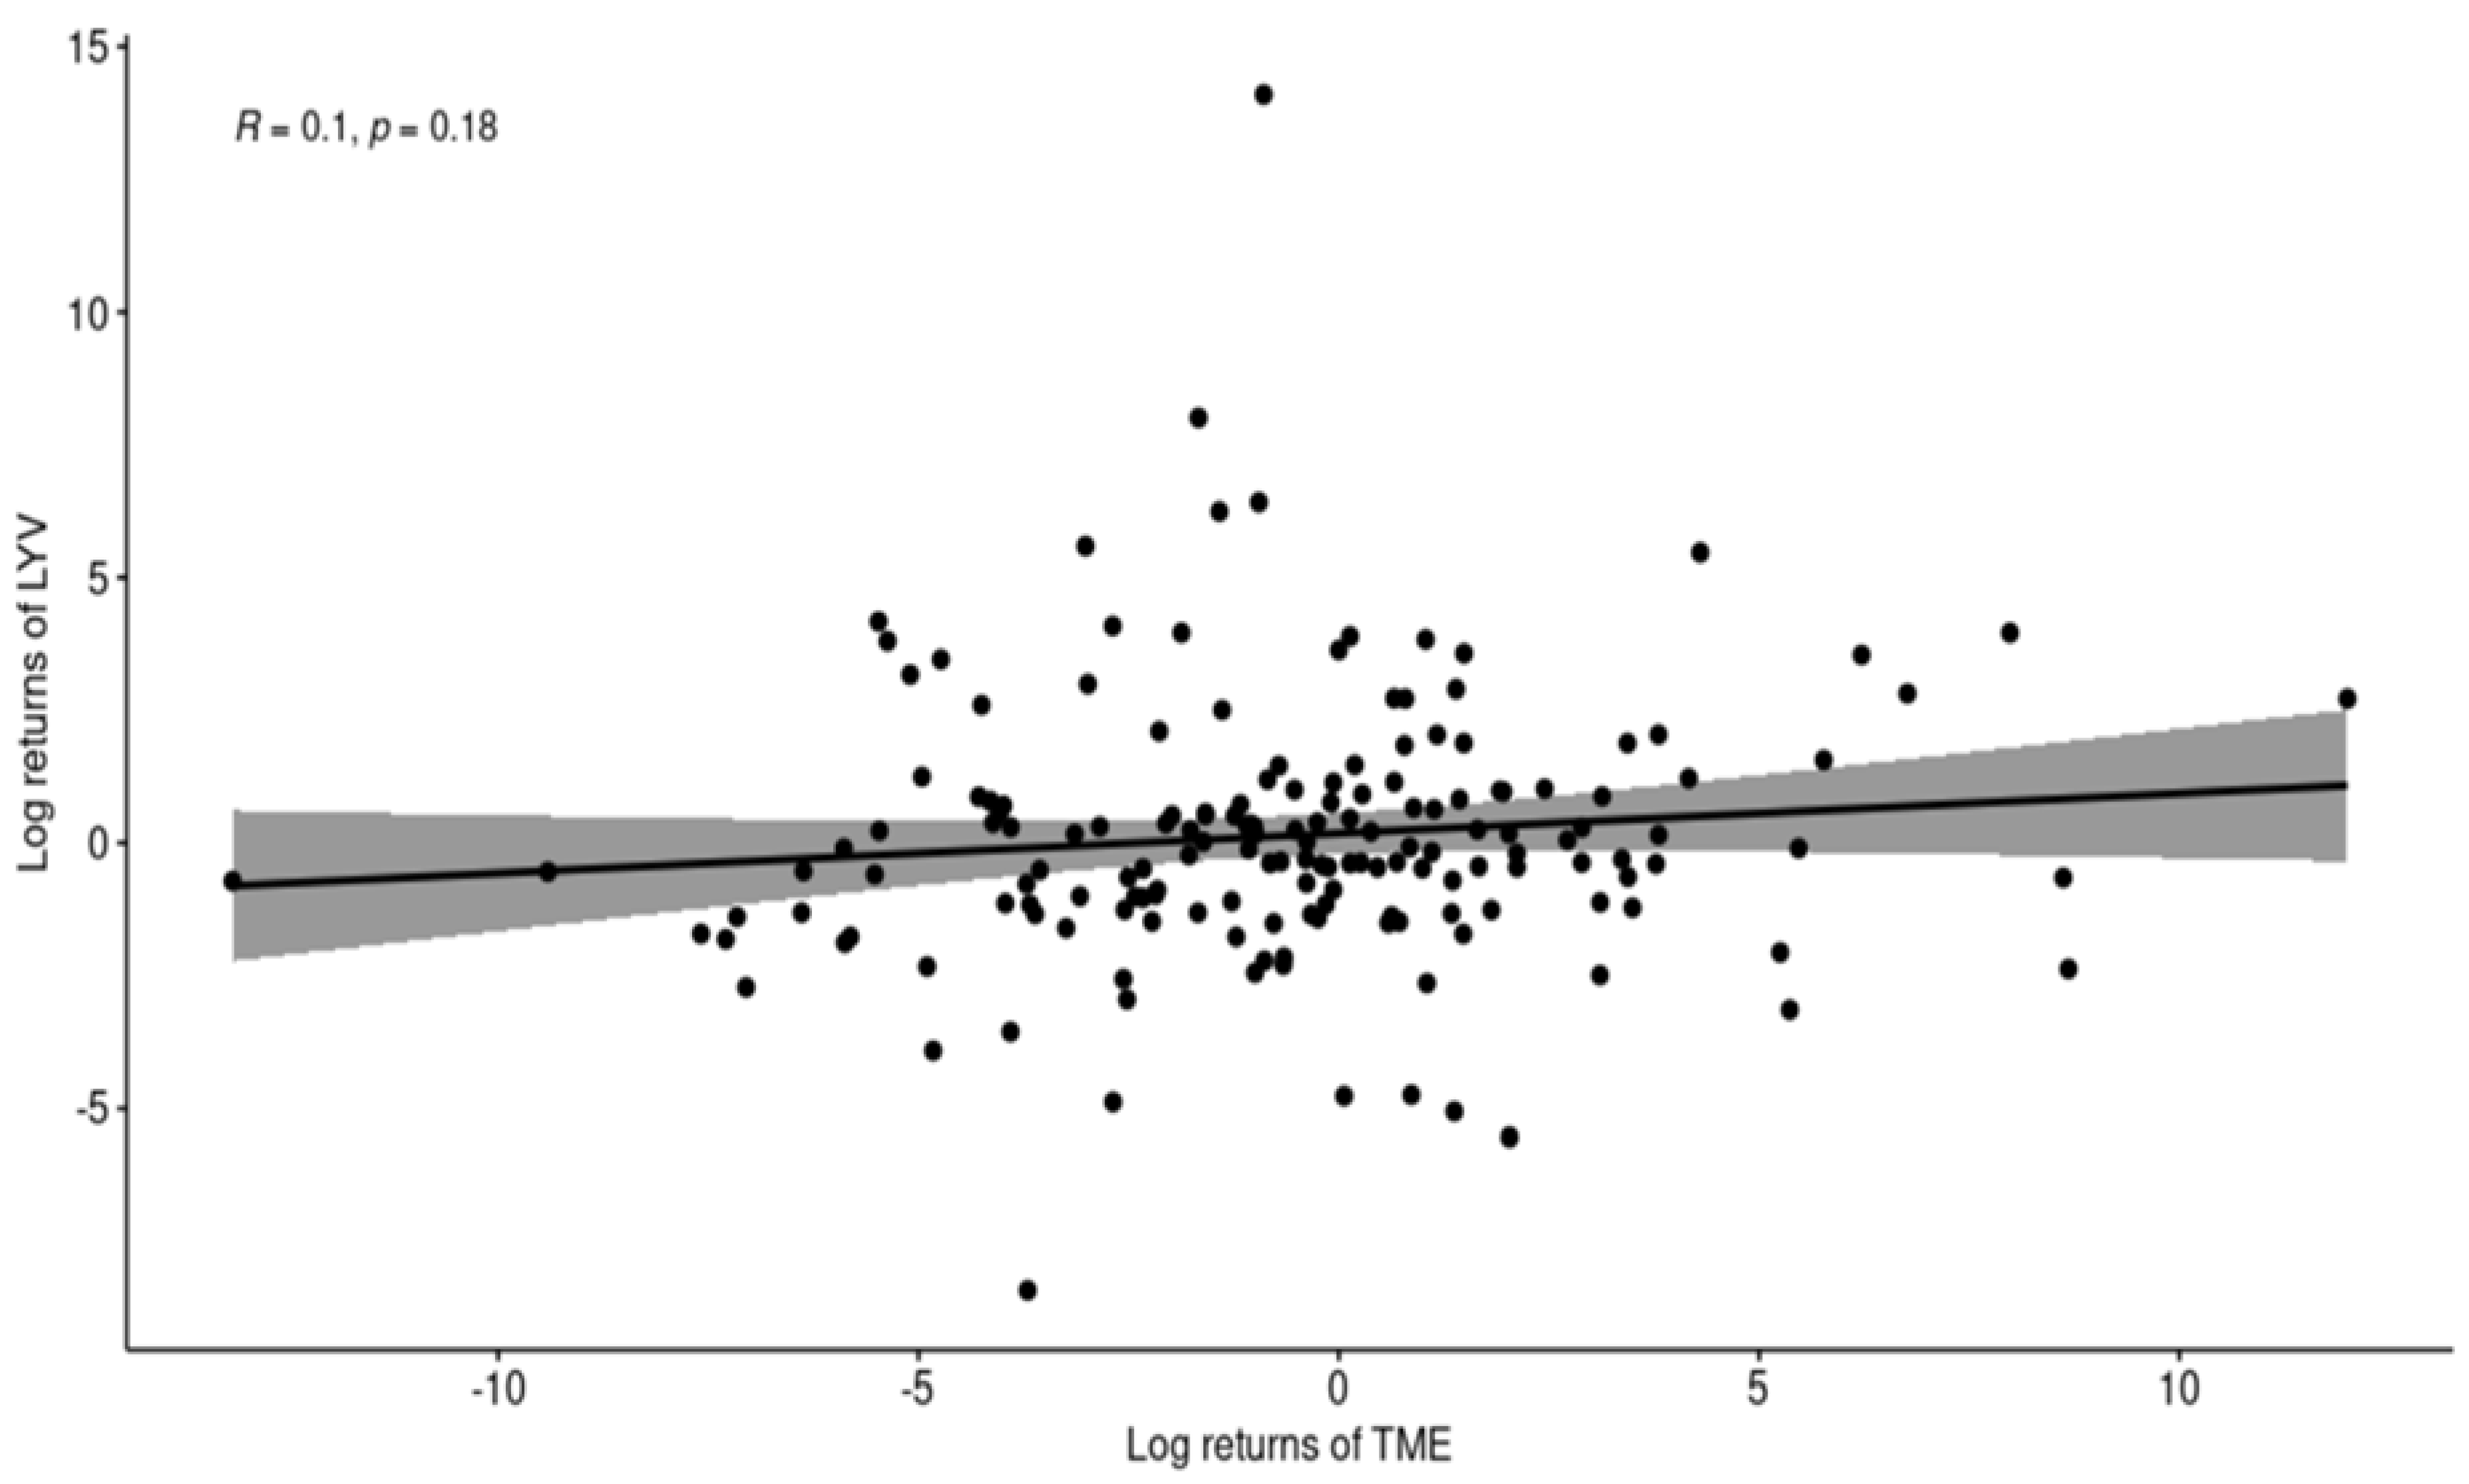
Since these results are not what we expected, we performed the test of the correlation between LYV and TME, using only data from April 2021 to November 2021, because most American people were COVID-19 vaccinated during this time.
Figure 10 shows the scatter plot of the log-returns of TME and LYV from April 2021 to November 2021. It shows a slightly positive trend, but the
p-value is more than 5% significance level. Then, we use these three correlation tests,
Table 8 shows the outputs of correlation coefficients from April 2021 to November 2021.
The null hypothesis is that there is no correlation between the log returns of TME and LYV, and the alternative hypothesis is that there is a correlation between the log returns of TME and LYV. From the outputs, we found that all p-values were larger than 0.05. They were not statistically significant, so we could not reject the null hypothesis and had no evidence to support the alternative hypothesis. This means there is no correlation between the log returns of TME and LYV.
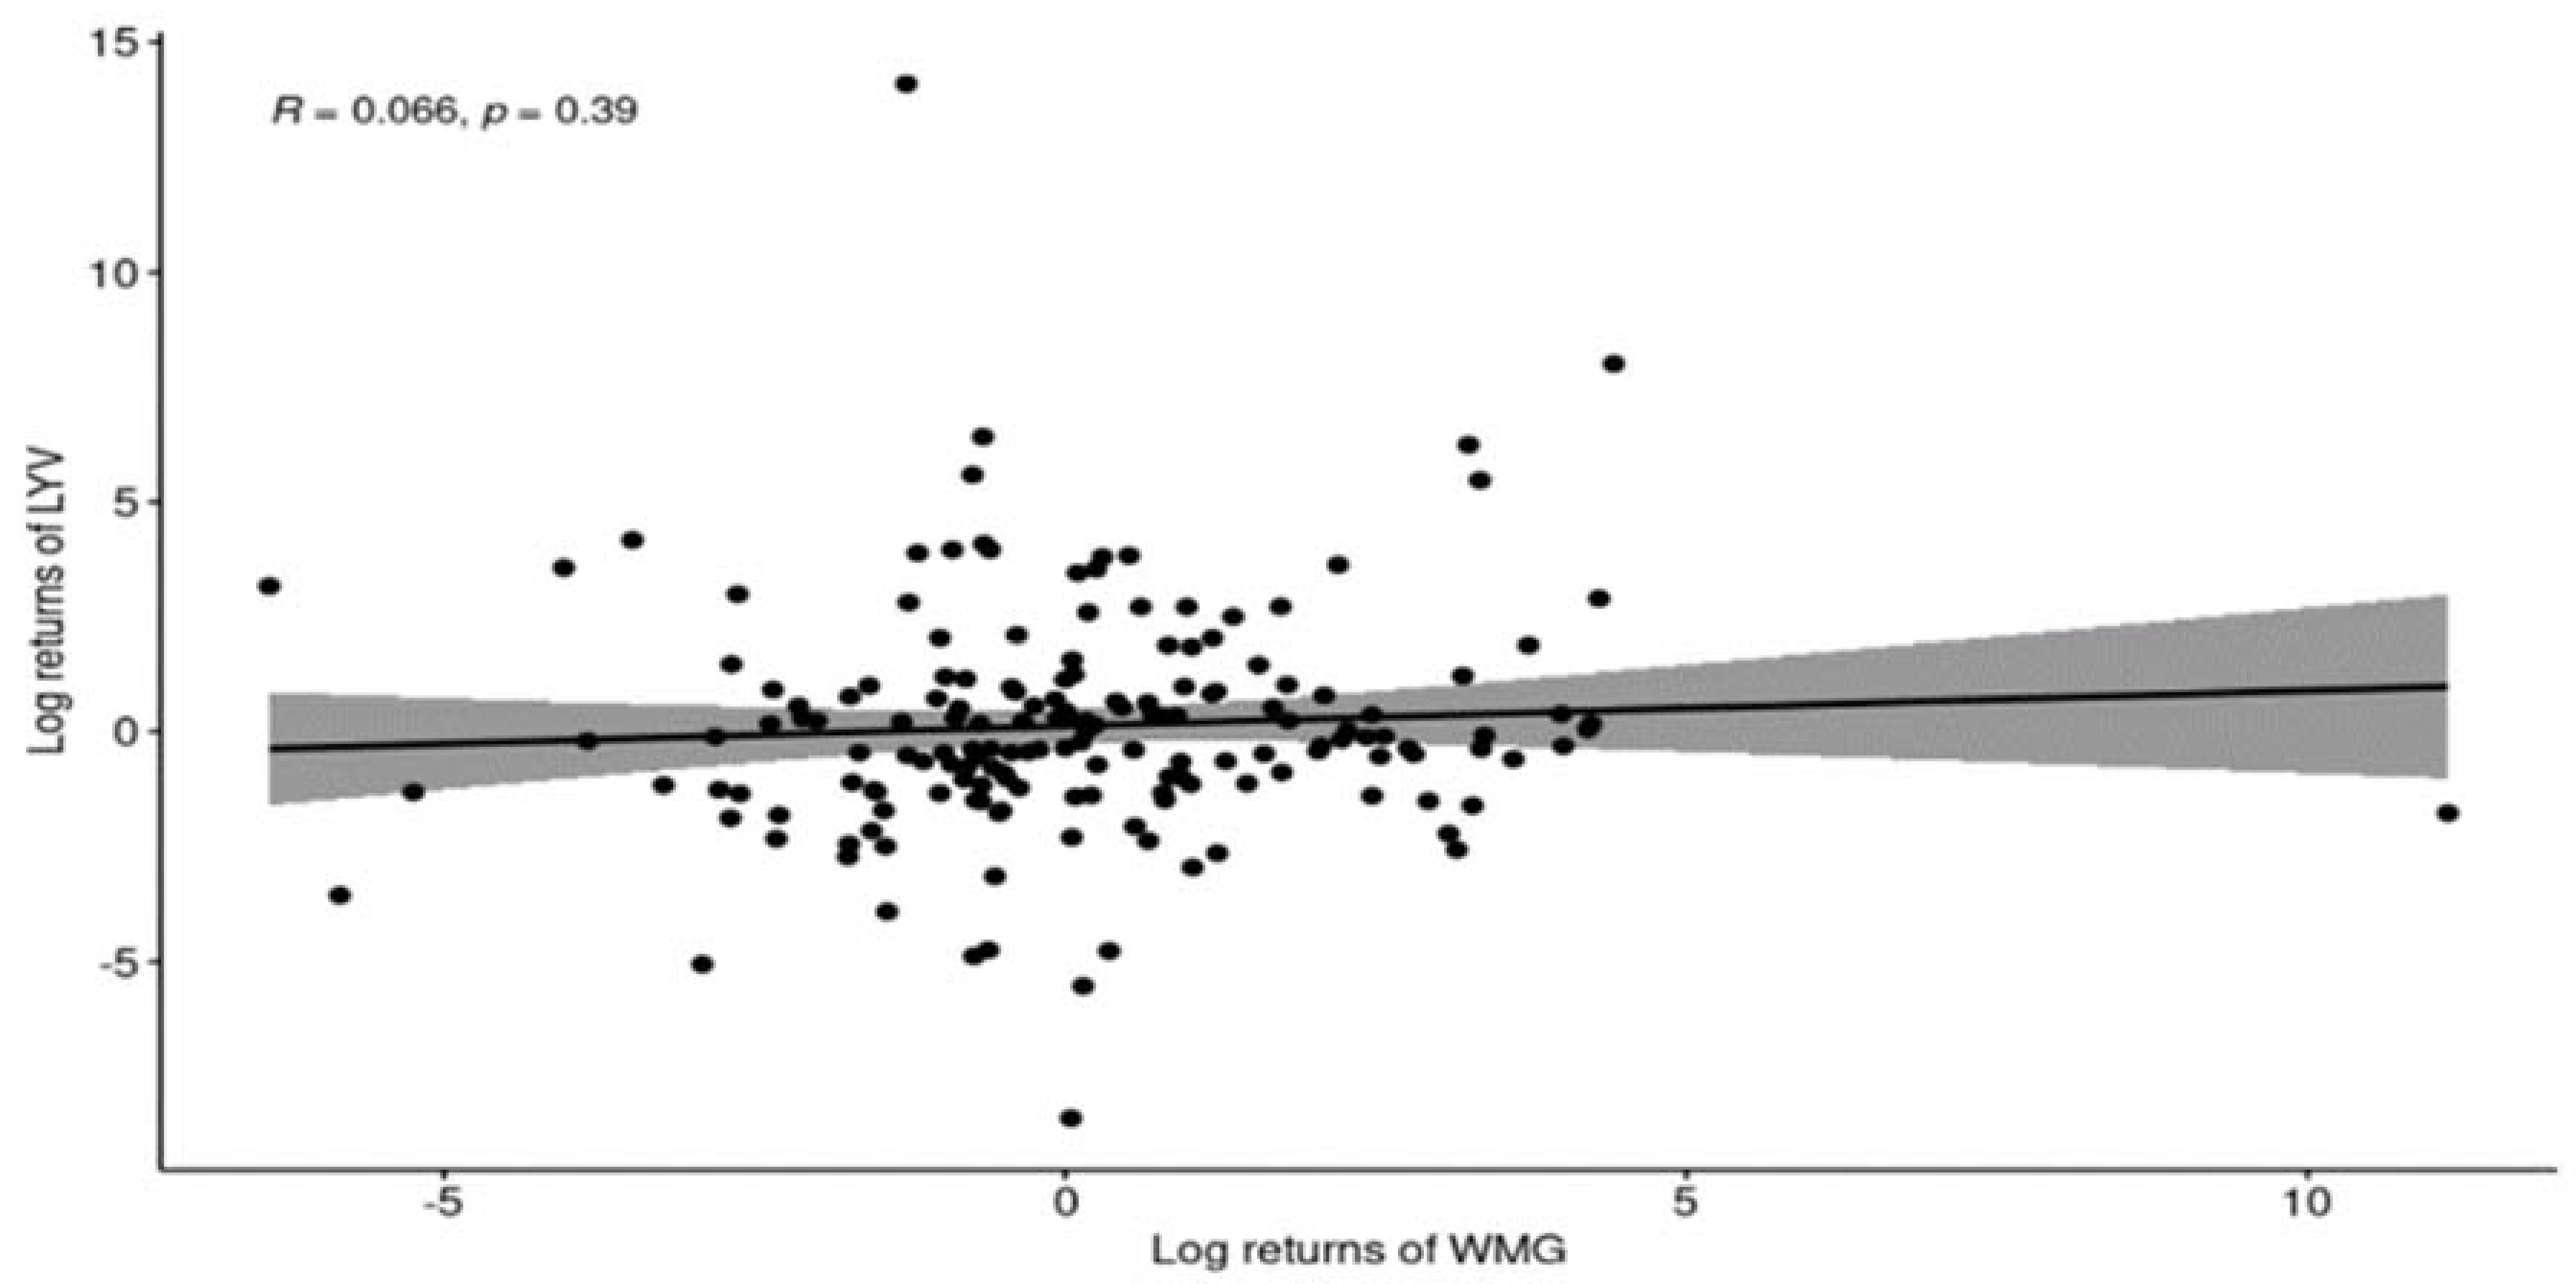
Then, we used the same methods to deal with the data of WMG and LYV. Since the data of WMG are not available prior to June 2020, we only performed the test of correlation between the log return of WMG and LYV after the pandemic. We obtained the outputs of the Pearson correlation test and the scatter plot of the log returns of these two companies from April to November 2021, which is when most people were vaccinated.
From
Figure 11, we can see that the line is almost flat, and the
p-value is more than the 5% significance level.
Table 9 shows the outputs of three correlation tests.
The null hypothesis is there is no correlation between the log returns of WMG and LYV, and the alternative hypothesis is there is a correlation between the log returns of WMG and LYV. From the outputs we can find that all
p-values in
Table 9 are larger than the 5% significance level. They are not statistically significant at the 5% significance level, so we could not reject the null hypothesis and have no evidence to support the alternative hypothesis. This means there is no correlation between the log returns of WMG and LYV during this period.
We can conclude that there is no correlation between the log-returns of the live music and online music company stocks after the COVID-19 vaccine became widely available even though there is a small correlation during the whole COVID-19 pandemic period.
4. Discussion
As mentioned before, for live music, COVID-19 greatly reduced people’s outings and severely affected live performances, resulting in a significant drop in revenue. However, people’s demand for music has not changed, rather they have turned their attention to recorded music, and paid subscriptions to streaming music services have risen considerably, bringing great benefits to music companies.
At the beginning of 2021, when the pandemic outbreak was at its worst, live music was restricted by anti-pandemic policies, leading to many event cancellations and a significant drop in revenue, proving that the pandemic greatly hit the live music industry, whereas recorded music benefited as a result, with Tencent Music’s revenue increasing significantly. From our research results, we did not have a negative correlation in the log-returns of live music and online recorded music company stocks during the whole pandemic period, but we found that there was no correlation in the log-returns of live music and online recorded music company stocks after COVID-19 vaccines were available. There still exists many extraneous factors, such as Tencent Music Entertainment being warned by China’s antitrust organization for taking up too large a share of the Chinese music market, that could also affect our results.
However, in the long run, Tencent Music is back to its previous level after a big increase in revenue, and both Warner Music Group and Live Nation Entertainment show a positive trend. In addition, we also found that the Tencent Music Entertainment Group was more affected by the pandemic than Warner Music Group, so it seems that China’s strict pandemic prevention and control policies have had a more serious impact on the company. We simply know that pandemic has changed the habits of most listeners and people are going to the media more often to listen to music, which has led to a significant increase in Warner Music Group’s digital earnings in the epidemic year. Looking at the stock chart, WMG has a bright future, as does LYV. Overall, although the pandemic has taken a toll on live music and stimulated people’s consumption of recorded music, the effect of it is temporary; the future still depends on the enterprise themselves.


