
Assessment of Optimal Seeding Rate for Fine and Coarse Rice Varieties Using the Direct Seeded Rice (DSR) Method

 , , , ,
  and
and
Abstract
1. Introduction
2. Materials and Methods
2.1. Experimental Site
2.2. Experimental Design and Treatments
2.3. Crop Husbandry
2.4. Data Recording
2.5. Statistical Analysis
3. Results
3.1. Analysis of Variance (ANOVA)
3.2. Season 2020–21
Plants Traits and Their Correlation

| Source | Plant Height | Tillers/ Plant | Panicle Length | Grains/ Panicle | Thousand Grain Weight | Grain Yield/m2 |
|---|---|---|---|---|---|---|
| Replication | 2.00 | 27.12 | 0.9472 | 51.26 | 0.225 | 30.00 |
| Treatment | 0.51 ns | 2480.2 ** | 5.8059 ** | 348.99 ** | 0.814 * | 8057 ** |
| Varieties | 1366.55 ** | 11,201.8 ** | 75.0834 ** | 2845.99 ** | 233.75 ** | 130,577 ** |
| Treatments × Varieties | 12.9 ** | 98.9 * | 2.7073 * | 56.88 * | 0.704 * | 673 ** |
| Error | 1.49 | 30.2 | 0.9489 | 12.41 | 0.167 | 42 |
| Grand mean | 123.46 | 237.6 | 25.894 | 90.527 | 25.296 | 448.79 |
| CV | 0.99 | 2.31 | 3.76 | 3.89 | 1.61 | 1.44 |
| Treatments | Varieties | Plant Height | Tillers/ Plant | Panicle Length | Grains/ Panicle | Thousand Grain Weight | Grain Yield/m2 |
|---|---|---|---|---|---|---|---|
| 27 kg/ha | Basmati | 132.50 A | 28 A | 26.50 BC | 76 E | 22.00 CD | 403.94 E |
| 22 kg/ha | Basmati | 131.57 AB | 27 A | 26.33 C | 73 E | 21.80 D | 388.51 F |
| 17 kg/ha | Basmati | 130.10 B | 26 B | 28.07AB | 85 D | 22.70 C | 371.71 G |
| 12 kg/ha | Basmati | 129.87 B | 23 D | 29.75 A | 85 D | 22.20 CD | 335.94 H |
| 27 kg/ha | Coarse | 114.00 E | 24 C | 23.83 D | 99 B | 27.60 B | 583.06 A |
| 22 kg/ha | Coarse | 115.00 DE | 22 D | 23.60 D | 91 C | 29.00 A | 525.89 B |
| 17 kg/ha | Coarse | 117.67 C | 21E | 24.833 CD | 115 A | 28.66 A | 505.81 C |
| 12 kg/ha | Coarse | 117.00 CD | 19 F | 24.23 D | 101 B | 28.40 A | 475.43 D |
| S.E. | 0.99 | 2.24 | 0.79 | 2.87 | 0.34 | 5.27 | |
| CV | 2.14 | 4.81 | 1.70 | 6.16 | 0.72 | 11.30 | |
| CTV | 2.15 | 2.14 | 2.14 | 2.14 | 2.15 | 2.145 |
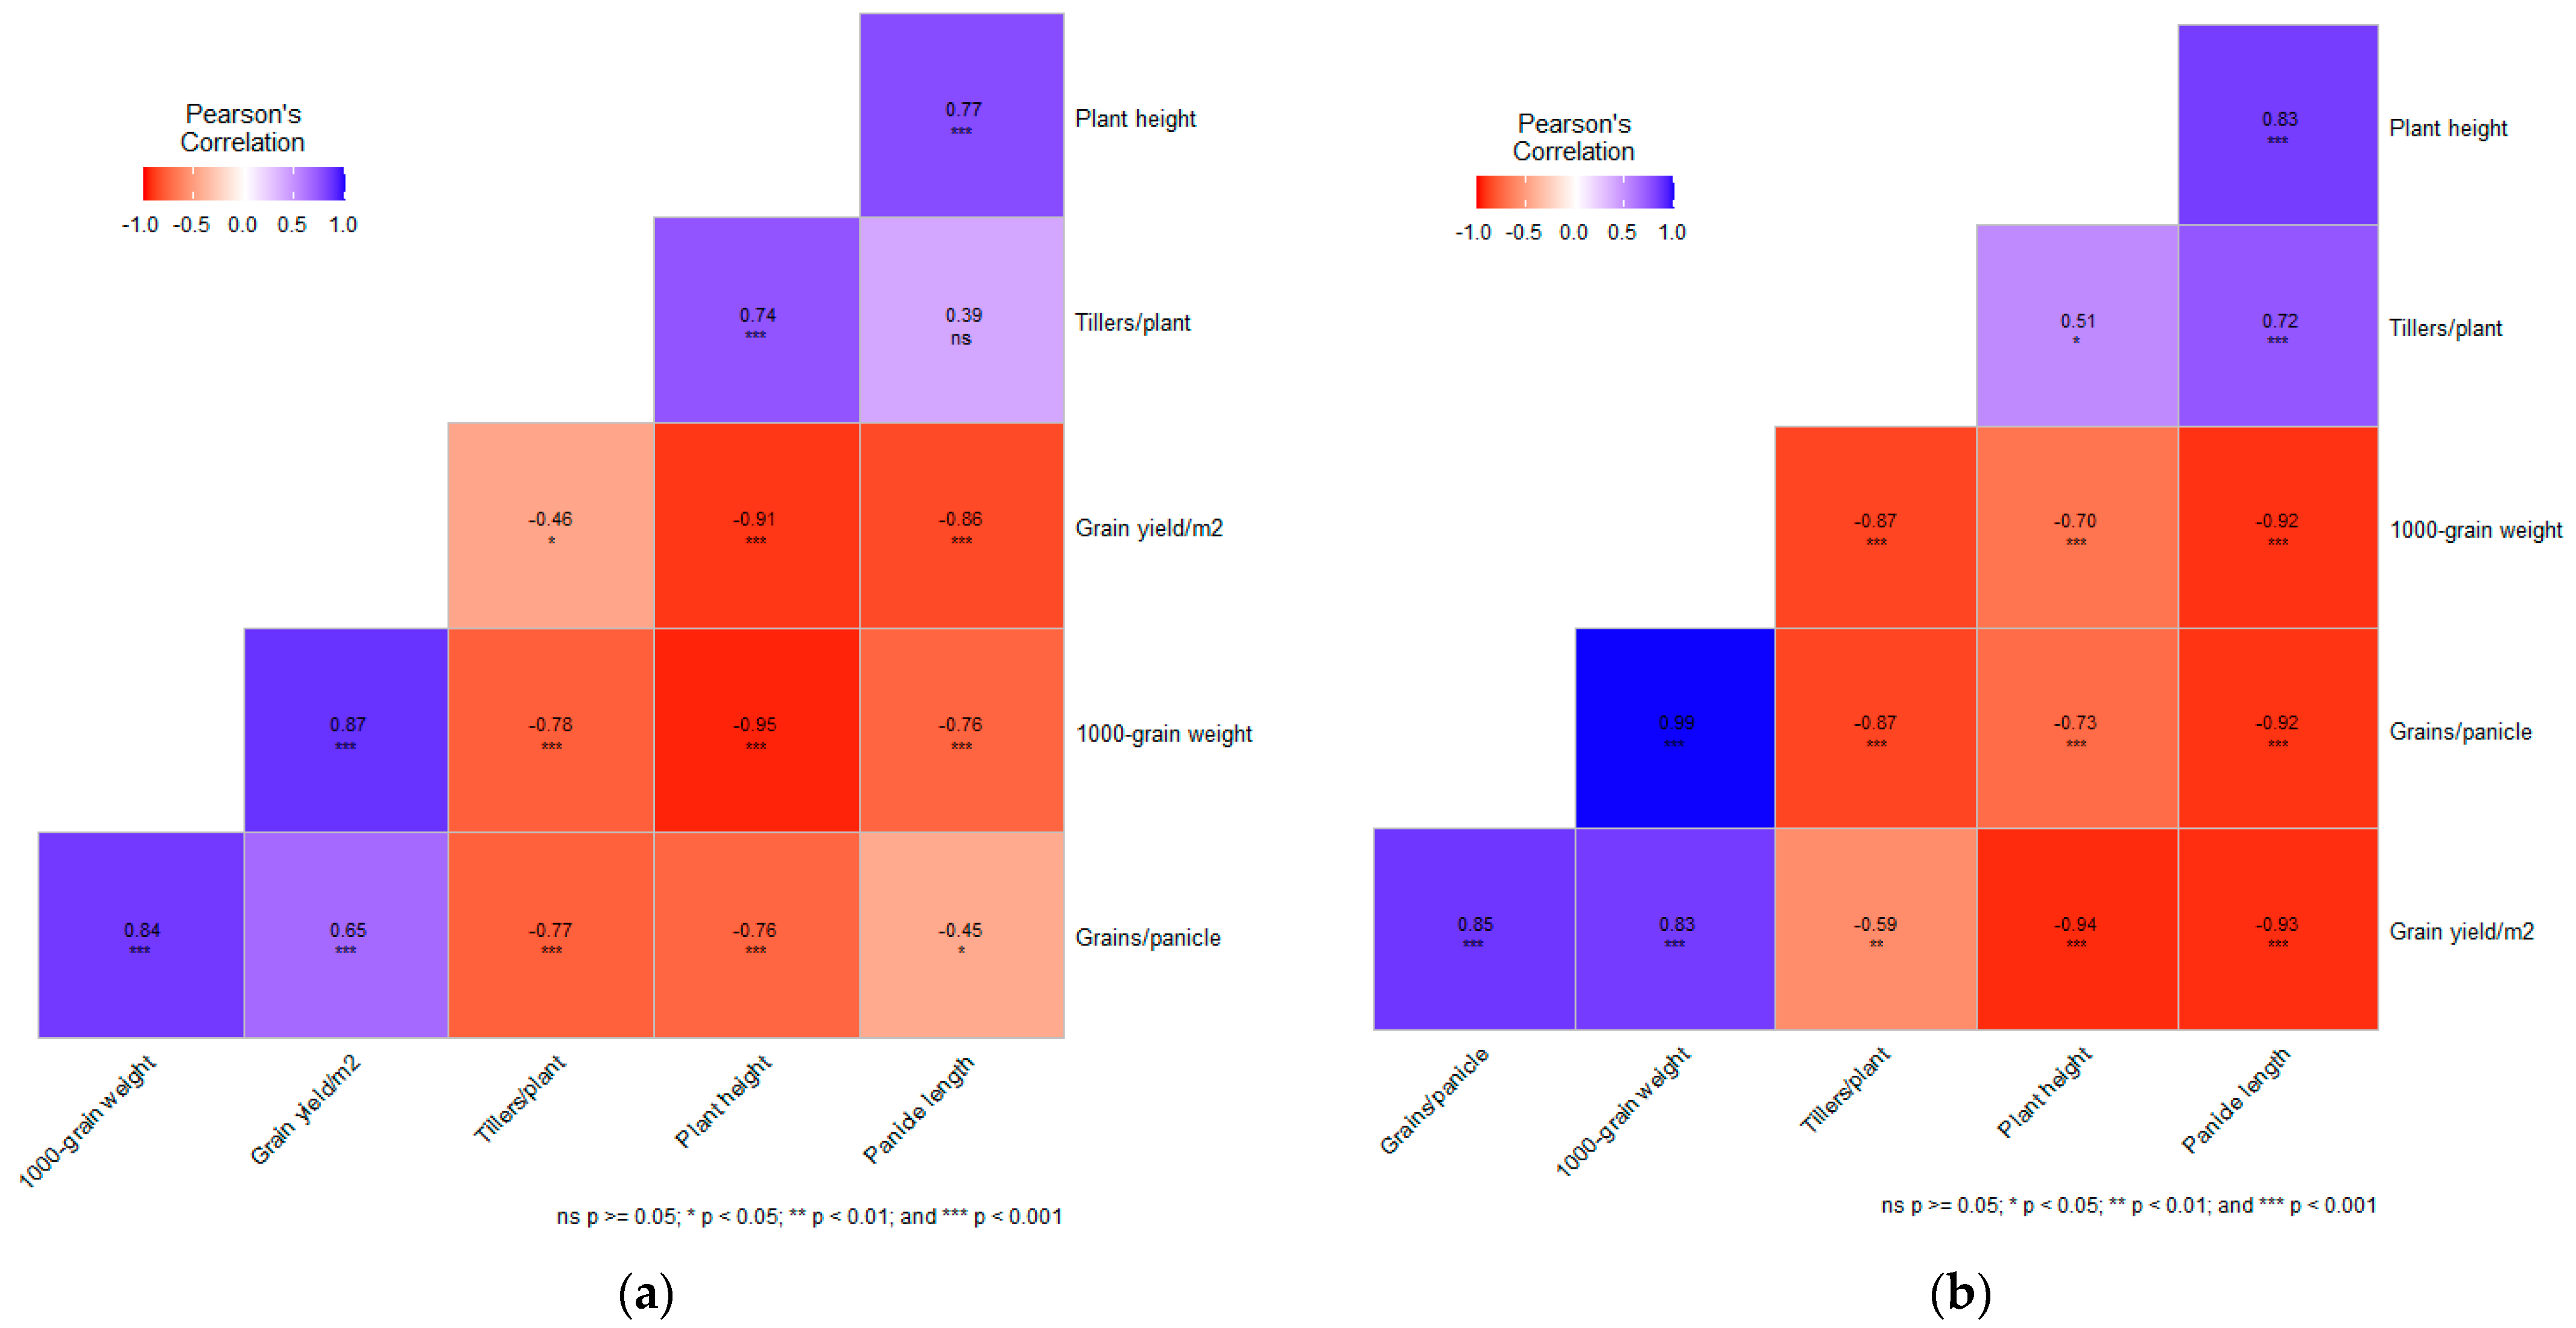
| Traits | Plant Height | Tillers/ Plant | Panicle Length | Grains/ Panicle | Thousand Grain Weight |
|---|---|---|---|---|---|
| Tillers/Plant | 0.72 ** | - | |||
| Panicle length | 0.77 ** | 0.38 ** | - | ||
| Grains/panicle | −0.76 ** | −0.77 ** | −0.45 * | - | |
| Thousand grain weight | −0.95 ** | −0.77 ** | −0.76 ** | 0.84 ** | - |
| Grain yield/m2 | −0.91 ** | −0.45 * | −0.86 ** | 0.65 ** | 0.87 ** |
| Traits | Plant Height | Tillers/ Plant | Panicle Length | Grains/ Panicle | Thousand Grain Weight |
|---|---|---|---|---|---|
| Plant Height | −1.78 | −0.24 | −1.25 | −0.48 | 2.82 |
| Tillers/Plant | −1.34 | −0.32 | −0.63 | −0.49 | 2.32 |
| Panicle length | −1.53 | −0.14 | −1.45 | −0.32 | 2.50 |
| Grains/panicle | 1.46 | 0.27 | 0.81 | 0.58 | −2.44 |
| Thousand grain weight | 1.74 | 0.26 | 1.26 | 0.49 | −2.88 |
3.3. Season 2021–22
Plants Traits and Their Correlation
| Source | Plant Height | Tillers/ Plant | Panicle Length | Grains/ Panicle | Thousand Grain Weight | Grain Yield/m2 |
|---|---|---|---|---|---|---|
| Replication | 0.686 | 220.9 | 0.0079 | 3.26 | 0.063 | 6.7 |
| Treatments | 113.97 ** | 29,952.8 ** | 30.375 ** | 9707.45 ** | 118.148 ** | 79,194.2 ** |
| Varieties | 16.587 ** | 2182.7 ** | 0.9894 ** | 43.80 ** | 0.665 ** | 6813.5 ** |
| Treatments × Varieties | 18.39 ** | 509.6 * | 0.7694 ** | 42.64 ** | 0.046 ns | 4065.7 ** |
| Error | 0.97 | 134 | 0.0422 | 3.03 | 0.023 | 57.1 |
| Grand mean | 124.56 | 236.39 | 26.158 | 95.31 | 25.602 | 311.37 |
| CV | 0.79 | 4.9 | 0.79 | 1.83 | 0.6 | 2.43 |
| Treatments | Varieties | Plant Height | Tillers/ Plant | Panicle Length | Grains/ Panicle | Thousand Grain Weight | Grain Yield/m2 |
|---|---|---|---|---|---|---|---|
| 27 kg/ha | Basmati | 126.27 AB | 29 A | 27.4 B | 76 D | 23.1 D | 264.04 D |
| 22 kg/ha | Basmati | 127.37 A | 28 AB | 27 C | 74 D | 23.7 C | 255.98 DE |
| 17 kg/ha | Basmati | 127.07 A | 27 B | 27 C | 75 D | 23.5 C | 251.56 DE |
| 12 kg/ha | Basmati | 126.27AB | 24 C | 27.8 A | 76 D | 23.2 D | 244.11 E |
| 27 kg/ha | Coarse | 119.47 C | 23 C | 24.6 F | 114 B | 27.6 B | 436.14 A |
| 22 kg/ha | Coarse | 119.47 C | 19 D | 24.4 F | 121 A | 28.2 A | 401.87 B |
| 17 kg/ha | Coarse | 125.27 B | 19 D | 25.8 D | 118 A | 28.1 A | 320.40 C |
| 12 kg/ha | Coarse | 125.33 B | 19 D | 25.4 E | 109 C | 27.4 B | 316.84 C |
| S.E. | 0.80 | 9.45 | 0.16 | 1.42 | 0.12 | 6.17 | |
| CV | 1.72 | 20.27 | 0.35 | 3.04 | 0.26 | 13.2 | |
| CTV | 2.14 | 2.14 | 2.14 | 2.14 | 2.14 | 2.14 |
| Traits | Plant Height | Tillers/ Plant | Panicle Length | Grains/ Panicle | Thousand Grain Weight |
|---|---|---|---|---|---|
| Tillers/Plant | 0.509 * | ||||
| Panicle length | 0.826 ** | 0.724 ** | |||
| Grains/panicle | −0.733 ** | −0.871 ** | −0.919 ** | ||
| Thousand grain weight | −0.698 ** | −0.872 ** | −0.921 ** | 0.992 ** | |
| Grain yield/m2 | −0.939 ** | −0.590 * | −0.930 ** | 0.849 ** | 0.830 ** |
| Traits | Plant Height | Tillers/ Plant | Panicle Length | Grains/ Panicle | Thousand Grain Weight |
|---|---|---|---|---|---|
| Plant Height | −0.09465 | −0.20908 | −0.7473 | −2.07339 | 1.733041 |
| Tillers/Plant | −0.05355 | −0.36956 | −0.63385 | −2.44616 | 2.144322 |
| Panicle length | −0.08368 | −0.27713 | −0.84525 | −2.5154 | 2.219695 |
| Grains/panicle | 0.072687 | 0.334839 | 0.787516 | 2.69979 | −2.36967 |
| Thousand grain weight | 0.068988 | 0.333293 | 0.789101 | 2.690758 | −2.37763 |
4. Discussion
5. Conclusions
Author Contributions
Funding
Data Availability Statement
Acknowledgments
Conflicts of Interest
References
- Khush, G.S. What it will take to feed 5.0 billion rice consumers in 2030. Plant Mol. Biol. 2005, 59, 1–6. [Google Scholar] [CrossRef]
- Pakistan’s Rice Exports Surge by over 76.5% in First Six Months—Profit by Pakistan Today. Available online: https://profit.pakistantoday.com.pk/2024/01/20/pakistans-rice-exports-surge-by-over-76-5-in-first-six-months/ (accessed on 25 October 2024).
- U.S. Department of Agriculture (USDA). Report: Pakistan Grain and Feed Annual; U.S. Department of Agriculture (USDA): Washington, DC, USA, 2024.
- Davies, S.; Akram, I.; Ali, M.; Hafeez, M.; Ringler, C. The Economywide Impacts of Increasing Water Security through Policies on Agricultural Production: The Case of Rice and Sugarcane in Pakistan; International Food Policy Research Institute: Washigton, DC, USA, 2024; pp. 1–43. [Google Scholar]
- Economic Survey of Pakistan, 2023–2024—Google Scholar. Available online: https://scholar.google.com/scholar?hl=en&as_sdt=0%2C5&q=Economic+Survey+of+Pakistan%2C+2023-24&btnG= (accessed on 25 October 2024).
- Ahmed, S.; Salim, M.; Chauhan, B.S. Effect of weed management and seed rate on crop growth under direct dry seeded rice systems in bangladesh. PLoS ONE 2014, 9, e101919. [Google Scholar] [CrossRef] [PubMed]
- Mahajan, G.; Kaur, G.; Chauhan, B.S. Seeding rate and genotype effects on weeds and yield of dry-seeded rice. Crop Prot. 2017, 96, 68–76. [Google Scholar] [CrossRef]
- Onwuchekwa-Henry, B.C.; Ogtrop, F.V.; Roche, R.; Tan, D.K.Y. Seeding rate, fertiliser and herbicide effects on canopy growth and productivity of direct-seeded rice (DSR) under different management practices. Field Crop Res. 2022, 284, 108565. [Google Scholar] [CrossRef]
- Wu, L.; Yu, K.; Zou, J.; Bao, X.; Yang, T.; Chen, Q.; Zhang, B. Management of seeding rate and nitrogen fertilization for lodging risk reduction and high grain yield of mechanically direct-seeded rice under a double. Agronomy 2024, 14, 522. [Google Scholar] [CrossRef]
- Shekhawat, K.; Rathore, S.S.; Chauhan, B.S. Weed management in dry direct-seeded rice: A review on challenges and opportunities for sustainable rice production. Agronomy 2020, 10, 1264. [Google Scholar] [CrossRef]
- Majeed, A.; Ahmed, M.S.; Javaid, R.A.; Siddique, F.; Hassan, M.J. Effect of different seed rates on rice yield following dsr technology in potohar region. Pak. J. Agric. Agric. Eng. Vet. Sci. 2022, 38, 143–149. [Google Scholar] [CrossRef]
- Akhter, M.; Ahmad, M.; Ramzan, M.; Awan, T.H. KSK 133-a high yielding, stiff stemmed and extra long grain coarse rice variety. J. Anim. Plan. Sci. 2007, 17, 63–66. [Google Scholar]
- Akhter, M.; Haider, Z. Basmati Rice Production and Research in Pakistan. In Sustainable Agriculture Reviews 39; Lichtfouse, E., Ed.; Sustainable Agriculture Reviews; Springer: Cham, Switzerland, 2020; pp. 119–136. [Google Scholar] [CrossRef]
- Akhtar, M.; Akhtar, M.S.; Haider, Z. PK 386: A new high yielding, early maturing, long grain rice (Oryza sativa L.) variety. J. Agric. Res. 2015, 53, 321–323. [Google Scholar]
- Zafar, U.N.; Wasti, S.E.; Jan, B. Annual Analytical Report on External Trade Statistics of Pakistan FY-2023; Pakistan Bureau of Statistics: Lahore, Pakistan, 2023; pp. 1–52.
- Steel, R.G.D.; Torrie, J.H. Principles and Procedures of Statistics, a Biometrical Approach. In Principles and Procedures of Statistics; McGraw-Hill Book Company, Inc.: New York, NY, USA, 1961; p. 481. [Google Scholar]
- Li, R.; Li, M.; Ashraf, U.; Liu, S.; Zhang, J. Exploring the relationships between yield and yield-related traits for rice varieties released in china from 1978 to 2017. Front Plant Sci. 2019, 10, 543. [Google Scholar] [CrossRef] [PubMed]
- Wu, D.H.; Chen, C.T.; Yang, M.D.; Wu, Y.C.; Lin, C.Y.; Lai, M.H.; Yang, C.Y. Controlling the lodging risk of rice based on a plant height dynamic model. Bot. Stud. 2022, 63, 25. [Google Scholar] [CrossRef] [PubMed]
- Corbin, J.L.; Walker, T.W.; Orlowski, J.M.; Krutz, L.J.; Gore, J.; Cox, M.S.; Golden, B.R. Evaluation of trinexapac-ethyl and nitrogen management to minimize lodging in rice. Agron. J. 2016, 108, 2365–2370. [Google Scholar] [CrossRef]
- Aklilu, E. Effect of seed rate and row spacing on yield and yield components of upland rice (Oryza sativa L.) in Metema, West Gondar, Ethiopia. Am. J. Agric. For. 2020, 8, 112–125. [Google Scholar] [CrossRef]
- Han, X.; Thomasson, J.A.; Bagnall, G.C.; Pugh, N.A.; Horne, D.W.; Rooney, W.L.; Jung, J.; Chang, A.; Malambo, L.; Popescu, S.C.; et al. Measurement and calibration of plant-height from fixed-wing uav images. Sensors 2018, 18, 4092. [Google Scholar] [CrossRef] [PubMed]
- Mukesh, M.; Vidyabhushan, J.; Anand, K.; Mankesh, K.; Shweta, K. Correlation and path coefficient analysis in rice (Oryza sativa L.) genotypes for yield and its attributing traits. J. Pharma. Phytochem. 2018, 7, 285–290. [Google Scholar]
- Lan, D.; Cao, L.; Liu, M.; Ma, F.; Yan, P.; Zhang, X.; Hu, J.; Niu, F.; He, S.; Cui, J.; et al. The identification and characterization of a plant height and grain length related gene hfr131 in rice. Front. Plant Sci. 2023, 14, 1152196. [Google Scholar] [CrossRef] [PubMed]
- Saketh, T.; Shankar, V.G.; Srinivas, B.; Hari, Y. Correlation and path coefficient studies for grain yield and yield components in rice (Oryza sativa L.). Int. J. Plant Soil Sci. 2023, 35, 1549–1558. [Google Scholar] [CrossRef]
- Kumar, A.; Kumar, H.; Gupta, V.; Khosla, G.; Sharma, P.K. Correlation and path coefficient analysis for yield and yield component traits in rice (Oryza sativa L.). Agric. Sci. Dig.-A Res. J. 2011, 31, 275–279. [Google Scholar]
- Liu, Y.; Xin, W.; Chen, L.; Liu, Y.; Wang, X.; Ma, C.; Zhai, L.; Feng, Y.; Gao, J.; Zhang, W. Genome-wide association analysis of effective tillers in rice under different nitrogen gradients. Int. J. Mol. Sci. 2024, 25, 2969. [Google Scholar] [CrossRef] [PubMed]
- Lakshmi, M.; Suneetha, Y.; Srinivas, T. Genetic variability, correlation and path analysis for grain yield and yield components in rice genotypes. J. Pharma. Phytochem. 2021, 10, 1369–1372. [Google Scholar]
- Yang, G.; Wang, Q.; Yang, G.; Zhang, G.; Chen, H.; Wag, X.; Ma, P.; Hu, Y. Application of open panicle traits in improving the filling characteristics at the base of indica rice panicles. Plants 2024, 13, 2035. [Google Scholar] [CrossRef]
- Saha, S.R.; Hassan, L.; Haque, M.A.; Islam, M.M.; Rasel, M. Genetic variability, heritability, correlation and path analyses of yield components in traditional rice (Oryza sativa L.) landraces. J. Bangladesh Agric. Univ. 2019, 17, 26–32. [Google Scholar] [CrossRef]
- Gupta, S.; Upadhyay, S.; Koli, G.K.; Rajendra, R.S.; Bisen, P.; Loitongbam, B.; Singh, P.K.; Sinha, B. Trait association and path analysis studies of yield attributing traits in rice (Oryza sativa L.) germplasm. Int. J. Bio-resour. Stress Manag. 2021, 11, 508–517. [Google Scholar] [CrossRef]
- El-Aty, M.S.A.; Abo-Youssef, M.I.; Sorour, F.A.; Salem, M.; Gomma, M.A.; Ibrahim, O.M.; Khanghahi, M.Y.; Al-Qahtani, W.H.; Abdel-Maksoud, M.A.; El-Tahan, A.M. Performance and stability for grain yield and its components of some rice cultivars under various environments. Agronomy 2024, 14, 2137. [Google Scholar] [CrossRef]
- Zuo, Z.W.; Zhang, Z.H.; Huang, D.R.; Fan, Y.Y.; Yu, S.B.; Zhuang, J.Y.; Zhu, Y.J. Control of thousand-grain weight by OsMADS56 in rice. Int. J. Mol. Sci. 2022, 23, 125. [Google Scholar] [CrossRef] [PubMed]
- Jarvis, D.I.; Hodgkin, T.; Brown, A.H.; Tuxill, J.D.; Noriega, I.L.; Smale, M.; Sthapit, B. Crop Genetic Diversity in the Field and on the Farm: Principles and Applications in Research Practices; Yale University Press: New Haven, CT, USA, 2016. [Google Scholar]
- Huang, G.; Guo, L.; Zeng, Y.; Huang, S.; Zeng, Y.; Xie, X. Changes in the grain yield and quality of early indica rice from 2000 to 2020 in southern China. Agronomy 2024, 14, 295. [Google Scholar] [CrossRef]
- Gasparis, S.; Miłoszewski, M.M. Genetic basis of grain size and weight in rice, wheat, and barley. Int. J. Mol. Sci. 2023, 24, 16921. [Google Scholar] [CrossRef] [PubMed]
Disclaimer/Publisher’s Note: The statements, opinions and data contained in all publications are solely those of the individual author(s) and contributor(s) and not of MDPI and/or the editor(s). MDPI and/or the editor(s) disclaim responsibility for any injury to people or property resulting from any ideas, methods, instructions or products referred to in the content. |
© 2024 by the authors. Licensee MDPI, Basel, Switzerland. This article is an open access article distributed under the terms and conditions of the Creative Commons Attribution (CC BY) license (https://creativecommons.org/licenses/by/4.0/).
Share and Cite
Naeem, A.; Ali, M.; Jawad, A.; Ameen, A.; Mehwish; Liaqat, T.; Nazeer, S.; Akram, M.Z.; Hussain, S. Assessment of Optimal Seeding Rate for Fine and Coarse Rice Varieties Using the Direct Seeded Rice (DSR) Method. Seeds 2025, 4, 1. https://doi.org/10.3390/seeds4010001
Naeem A, Ali M, Jawad A, Ameen A, Mehwish, Liaqat T, Nazeer S, Akram MZ, Hussain S. Assessment of Optimal Seeding Rate for Fine and Coarse Rice Varieties Using the Direct Seeded Rice (DSR) Method. Seeds. 2025; 4(1):1. https://doi.org/10.3390/seeds4010001
Chicago/Turabian StyleNaeem, Atif, Madad Ali, Ahmad Jawad, Asif Ameen, Mehwish, Talha Liaqat, Samreen Nazeer, Muhammad Zubair Akram, and Shahbaz Hussain. 2025. "Assessment of Optimal Seeding Rate for Fine and Coarse Rice Varieties Using the Direct Seeded Rice (DSR) Method" Seeds 4, no. 1: 1. https://doi.org/10.3390/seeds4010001
APA StyleNaeem, A., Ali, M., Jawad, A., Ameen, A., Mehwish, Liaqat, T., Nazeer, S., Akram, M. Z., & Hussain, S. (2025). Assessment of Optimal Seeding Rate for Fine and Coarse Rice Varieties Using the Direct Seeded Rice (DSR) Method. Seeds, 4(1), 1. https://doi.org/10.3390/seeds4010001