Article

Genetic Parameters in Mesocotyl Elongation and Principal Components for Corn in High Valleys, Mexico

by
Antonio Villalobos-González
1,
Ignacio Benítez-Riquelme
1,*,
Fernando Castillo-González
1,
Ma. del Carmen Mendoza-Castillo
1 and
Alejandro Espinosa-Calderón
2
1
Program of Genetic Resources and Productivity-Genetic, College Postgraduate, Texcoco 56264, Mexico
2
Commission Intersecretarial of Biosafety of the Organisms Genetically Modified, City Mexico 03940, Mexico
*
Author to whom correspondence should be addressed.
Seeds 2024, 3(1), 149-168; https://doi.org/10.3390/seeds3010012
Submission received: 7 December 2023 / Revised: 26 February 2024 / Accepted: 28 February 2024 / Published: 13 March 2024

Abstract

:
Corn germplasm with different mesocotyl elongation was characterized for High Valleys in Mexico by estimating the general combinatory aptitude (GCA), specific combinatory aptitude (SCA), heterosis (H), inbreeding depression (ID) and principal component aptitude (PCA), with the purpose of directing the improvement for deep sowing. The hypothesis was that the parents and crosses of mesocotyl present variability in seedling and adult plant traits based on deep sowing. The 36 F1 and F2 crosses—derived from nine parents, three with short mesocotyl (S), three medium (M) and three long (L), obtained through Griffing diallel II—plus the parents were planted in sand beds and polyethylene bags in a greenhouse during the spring–summer cycles of 2021 and 2022. The following traits were measured: length of mesocotyl (LM), length of coleoptile, total seedling dry matter and 10 cob traits in addition to total dry matter. In 11 of the 14 traits, there was a positive and significant correlation (p ≤ 0.05) between the GCA of the parents and their LM. The highest SCA, H and ID (p ≤ 0.05) were for crosses L × L for all the traits measured. When comparing the GCA/SCA proportions, this relation varied from 0.76 to 0.97, which points to practically equal additive effects with those of dominance; however, in parents and L × L crosses, this relation was on average 0.94, 1.07 in M × M, 0.22 in S × S and 0.36 in L × S. In both F1 and F2, the variation was explained by two principal components: 89.5% for GCA and 73.4% for SCA. In both generations, the parents with higher GCA were H-48, HS-2 and Promesa, the three with long mesocotyl, while those with the highest GCA were crosses between these three hybrids.

1. Introduction

Effective improvement in populations is based on studying the genetics of traits in parents and their progeny [1], including the general (GCA) and specific (SCA) combinatory aptitude [2], the GCA/SCA relation [3], heterosis [4] and inbreeding depression [5] to the principal component aptitude (PCA) of the grain yield and components [6]. With this, the plant breeder could generate an efficient improvement plan system for future genotypes [7].
To have an idea of the magnitude of the aforementioned research, the diallel designs proposed by Griffing can be used [8], which constitute a useful tool to characterize and estimate the capacity of GCA and SCA of parents and their crosses [9], as well as to define the most adequate method of genetic breeding to predict superior crosses and combine the best traits of the parents [10]. In this regard, various results have confirmed the utility of these designs in corn to estimate GCA and SCA, the GCA/SCA relation and the heterosis of the parents [2] and to classify them into heterotic groups based on the genetic expression of the traits studied [11], such as mesocotyl–coleoptile elongation [12], which carries out an important role in the emergence and development of a normal seedling [13], and the components of grain yield [3], which are crucial in corn yield.
Diverse studies confirm that breeders have successfully introduced adequate traits in corn to face limitations in production (e.g., biotic and abiotic stress) with the application of classic principles for genetic improvement [14] in various agricultural regions of the world; however, the breeder must expand the genetic base of the germplasm and evaluate it to have broad knowledge of the type of genic action [15] of the materials in study to identify the traits of greatest importance in seedlings. In addition to mesocotyl [12] and coleoptile elongation, which is associated with tolerance to deep sowing [16], studies are also necessary on the dry matter of structures of the aerial part and root during the early and adult stages of corn that could help quantify and associate both stages (seedling and adult plant) with grain yield and the components of yield [3].
In this regard, the authors of [17] explain that the components of corn yield, including the number of lines, number of grains per line, grain thickness, grain width, grain length, weight of 100 grains and weight of the volume, directly affect the grain yield [17]. Although there is considerable intent to increase grain yield, in the improvement process, other variables will also be evaluated in the early and adult stages of corn in choosing useful phenotypes, although it has been seen that some of them have limited variation, which makes the selection of superior phenotypes difficult based on traits in those corn stages.
Later studies [18] suggest that for the optimal selection of phenotypes, the PCA analysis can be used, and the graphic dispersion analysis can be used as a tool to identify the variables of greater weight, the genotypes and the interrelation between them that best explain the variation studied. This will allow for choosing the best breeding plan that maximizes the genetic variance and thus increases and fixes the frequency of favorable genes in the population [19].
Despite studies directed at tolerating biotic and abiotic stress in the early and adult stages of corn, as well as the development of methodologies, guides, varieties and corn hybrids from improvement programs and institutions such as INIFAP, universities and the private sector [16], the global and national demand has not yet been satisfied in terms of production and consumption in Mexico. This is the result of the combination of many factors including global population growth, which is why it is necessary to direct studies toward traits in the early and adult stages of corn to face climate change [20] and the main biotic and abiotic limitations that afflict the crop [21], such as deep sowing [16].
Based on this, in regions such as High Valleys in a country where deep sowing is a common practice, it is necessary to carry out related studies about the exploration of the GCA and SCA capacity, the GCA/SCA relation, the heterosis and endogamic depression during the early and adult stages of corn, as well as the relation of these estimations with the expression of the principal components of yield. Therefore, the study and relation of traits in the early and adult stages could be useful to broaden and strengthen plant breeding programs for deep sowing due to the increasingly lower residual moisture and/or late start of rainfall. With the hypothesis that some parents and their crosses present variability in the early and adult stages under conditions of deep sowing, GCA, SCA, heterosis, endogamic depression and aptitude of the main components. In this sense, the objective was to estimate the GCA, SCA, GCA/SCA relation, heterosis and inbreeding depression of crosses of mesocotyl (long, medium and short) and their F1 and F2 generations based on the traits of seedlings, adult plants and total dry matter of corn in High Valleys, Mexico, with the purpose of directing improvement for deep sowing.

2. Materials and Methods

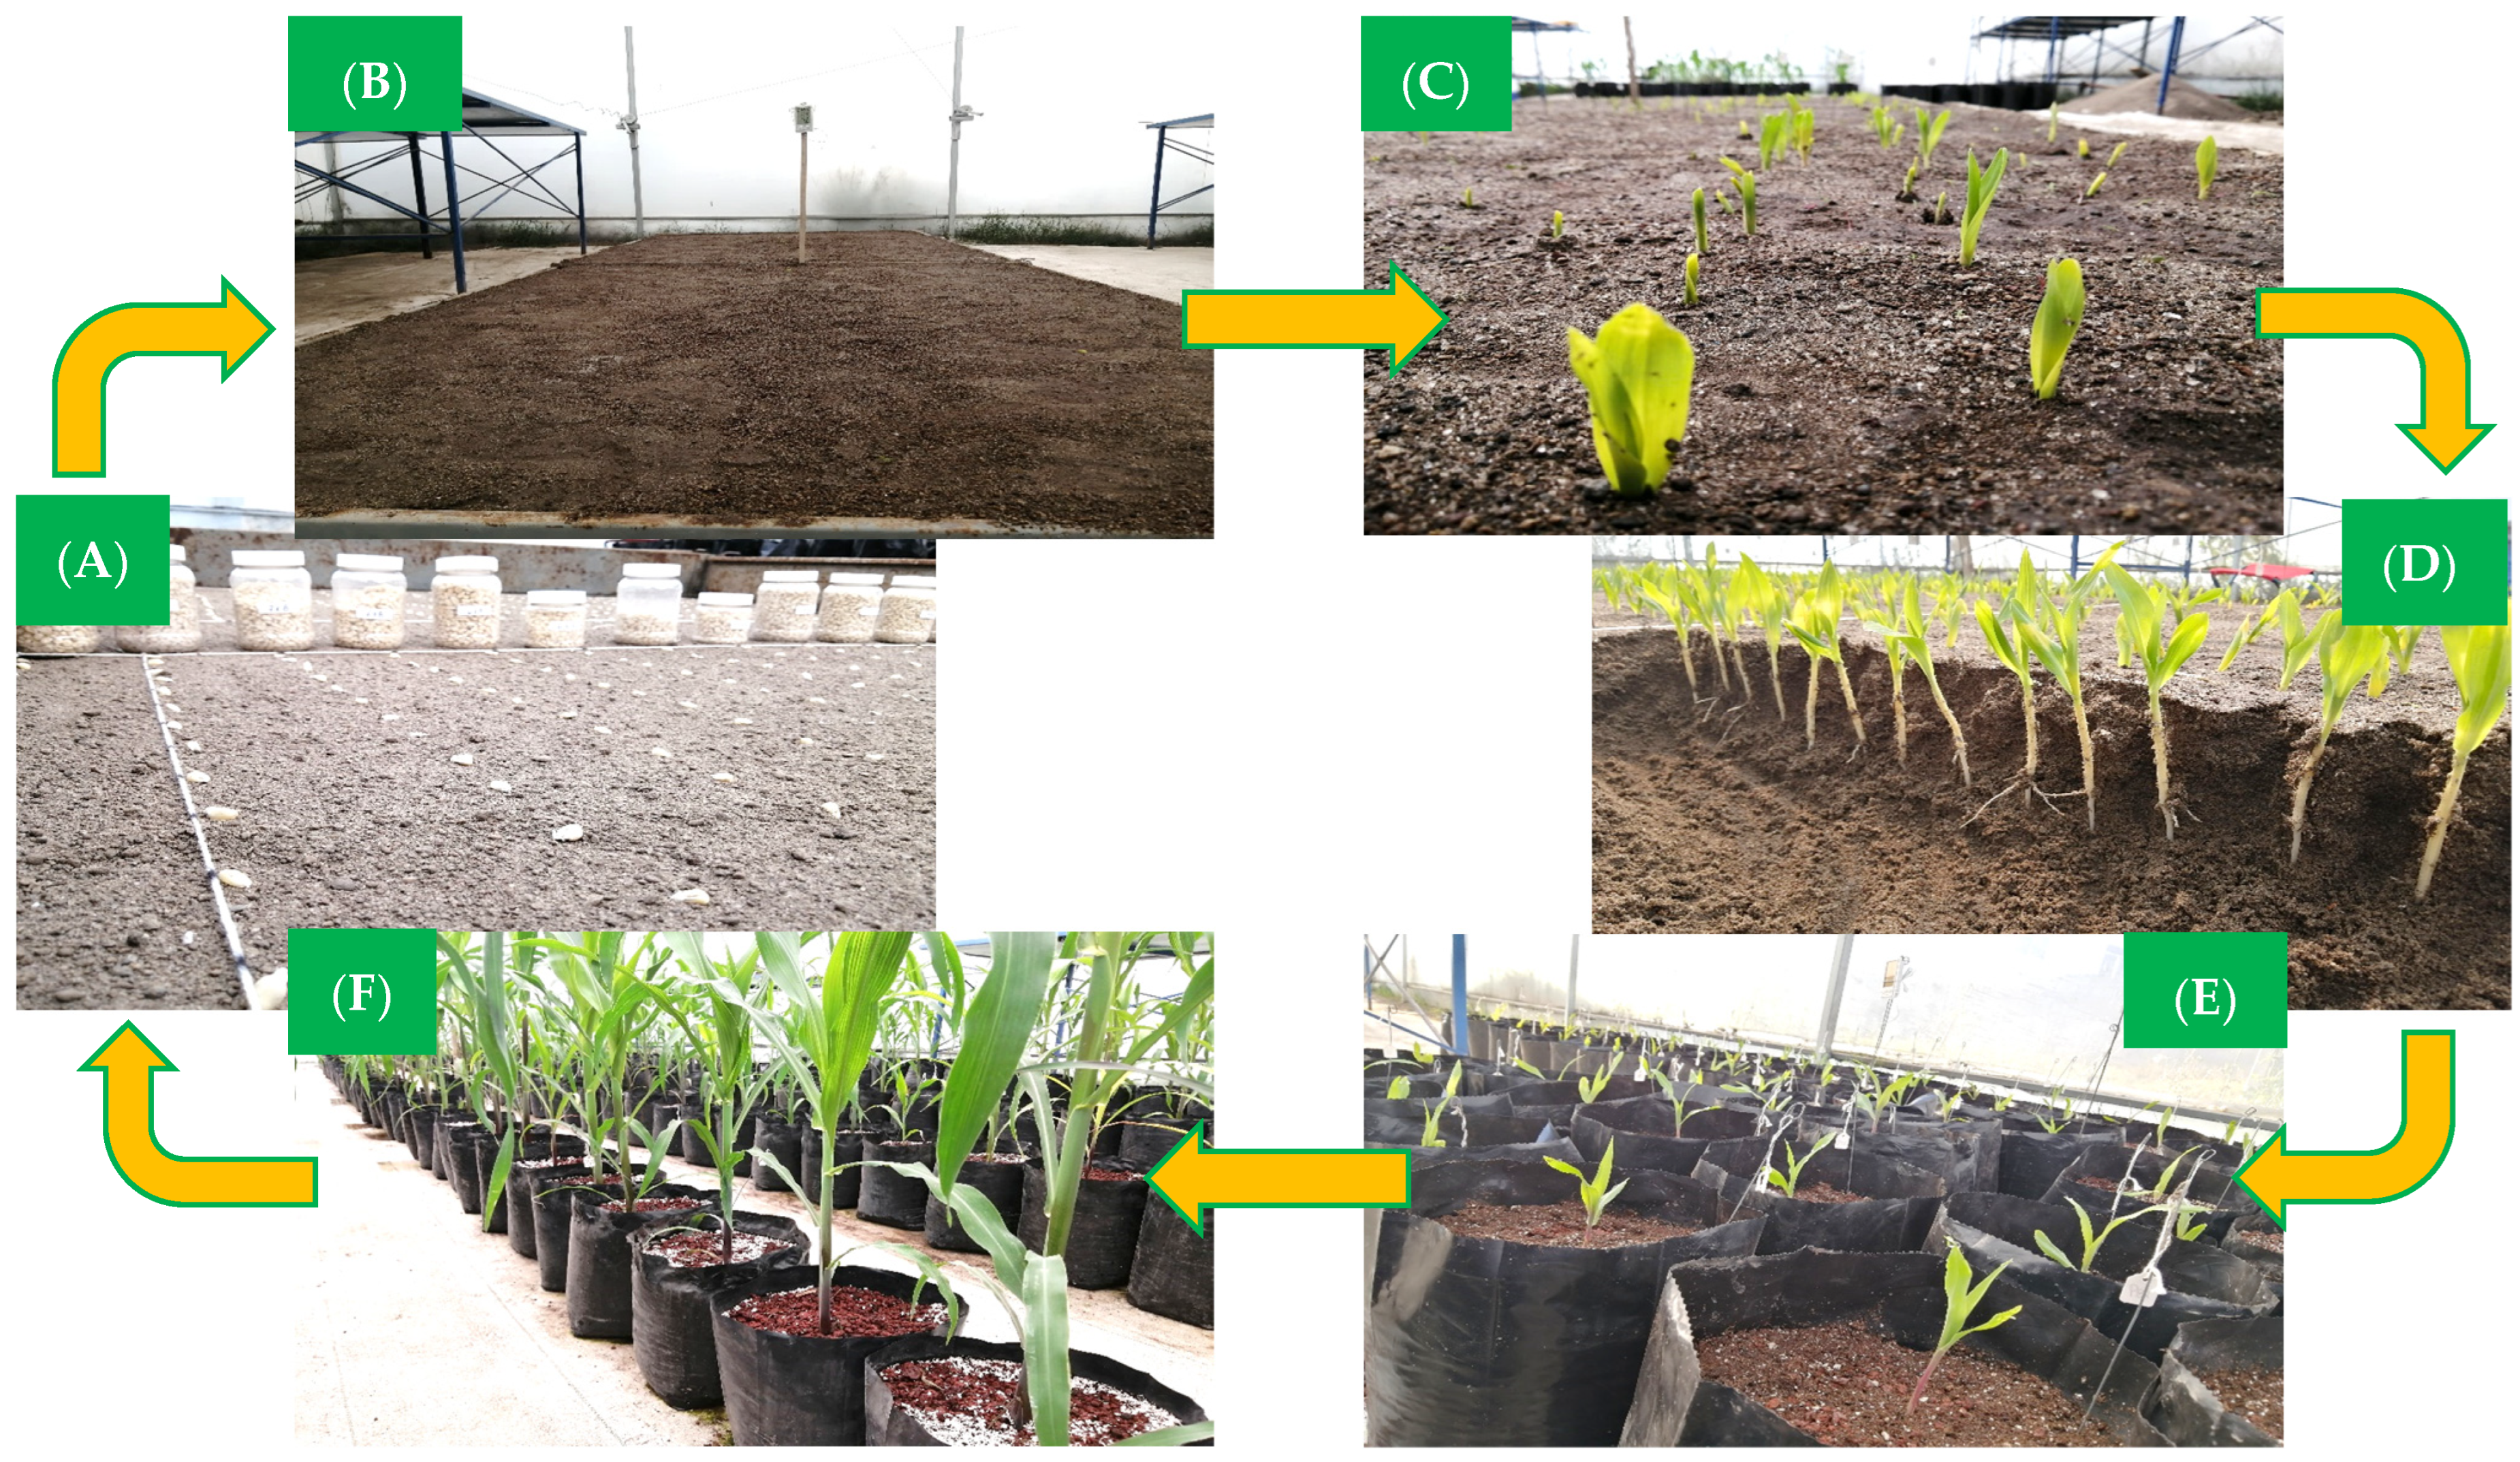
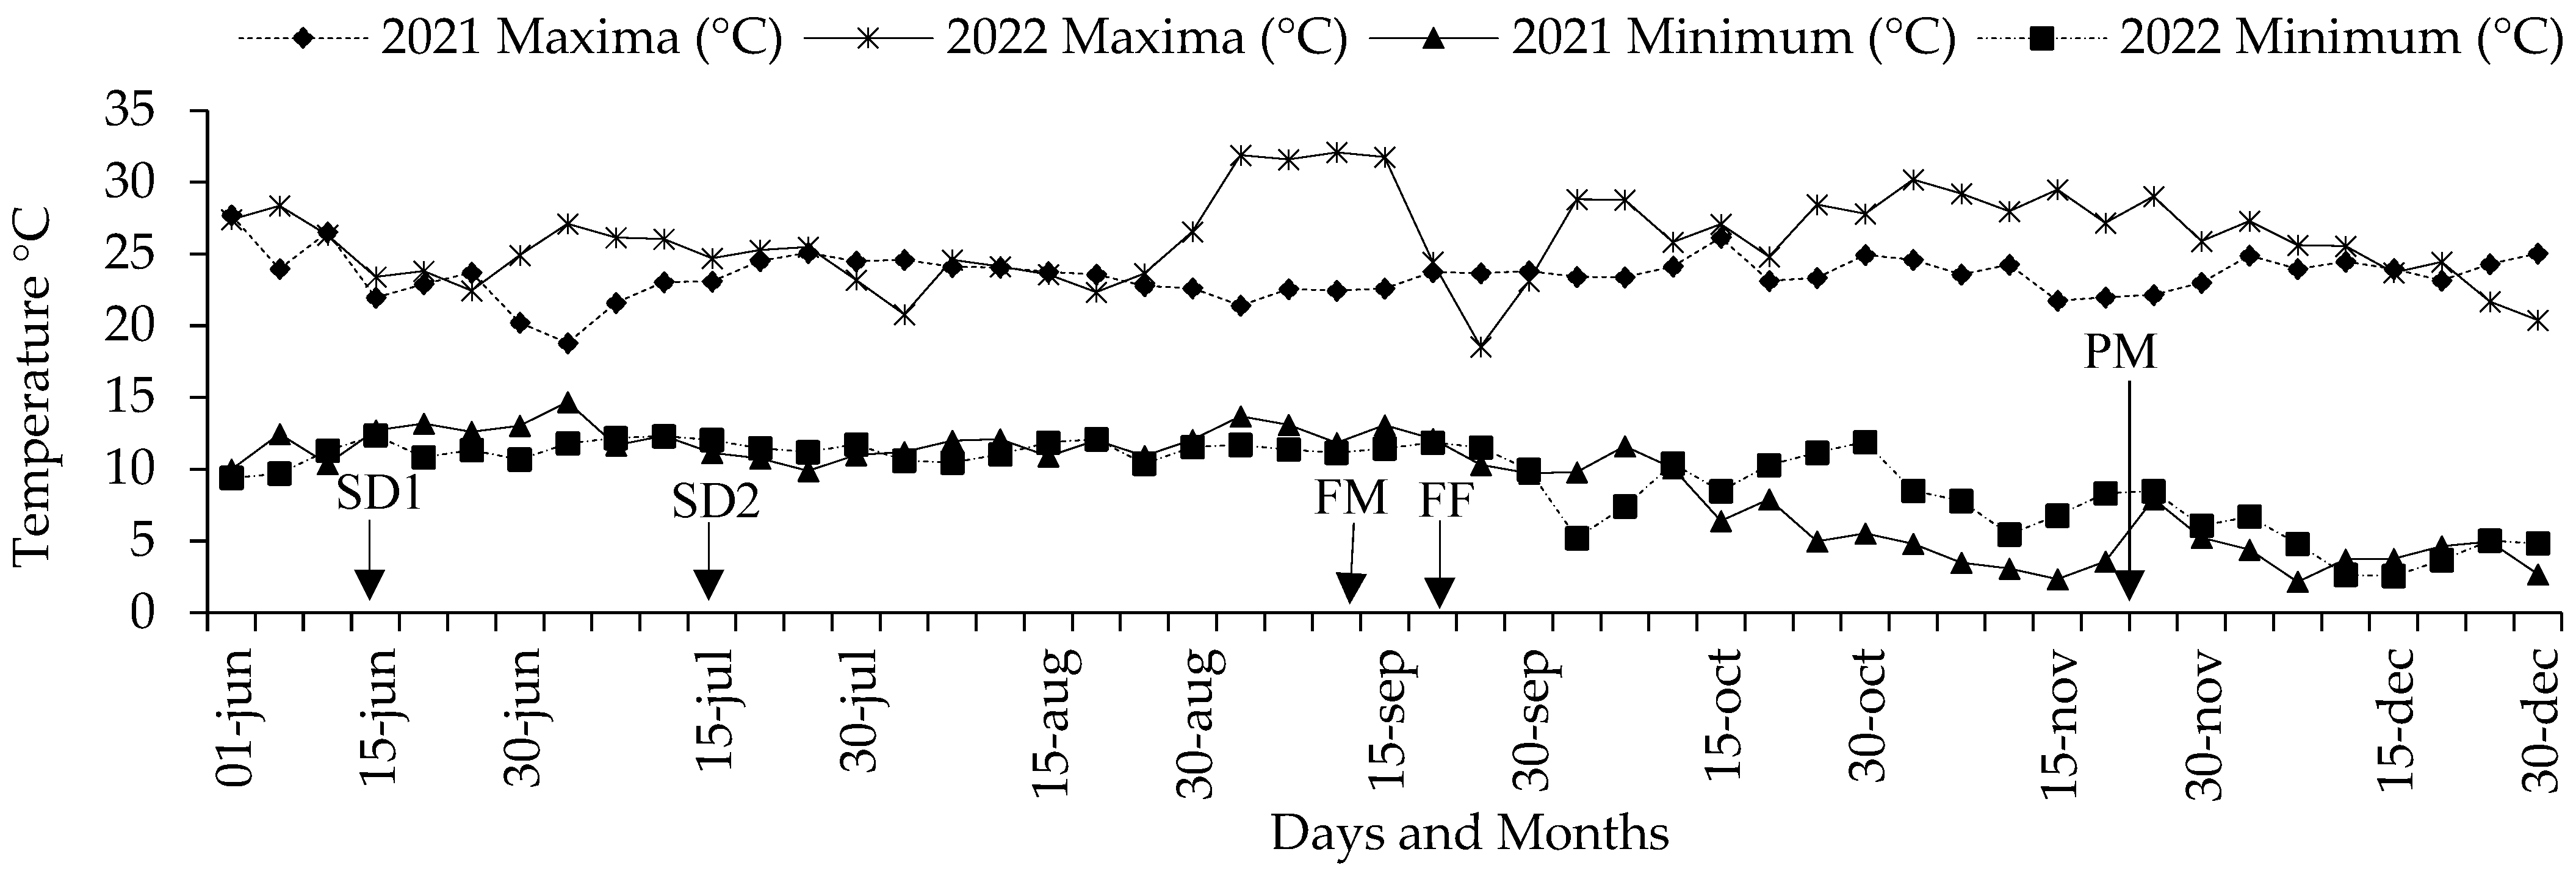
2.1. Localization of the Experiments

The seeds of the F1 and F2 crosses and their nine parents were established in sand beds and polyethylene bags in June 2021 (F1 seed) and July 2022 (F2 seed) in the spring–summer (S-S) cycles under greenhouse conditions at the Postgraduate College, Texcoco, Mexico.

2.2. Genetic Material and Conditions of Experiments

Nine recommended genotypes were used in the study for crops in High Valleys, Mexico, all of them hybrids that contrast in mesocotyl elongation: long (L) [H-48, HS-2 (trilinear hybrids) and Promesa (double hybrid); medium (M) (H-44, H-52, double hybrids and H-70, trilinear hybrid); and short (S) [H-49 AE, H-40 (trilinear hybrids) and H-32 (double hybrid)]. The F1 generation was self-fertilized to obtain the F2 population. In addition, from each cultivation cycle and in the sand beds, measurements of three seedling traits: length of mesocotyl, length of coleoptile and total seedling dry matter were taken in 25 plants sown in four repetitions at 20 cm depth (Figure 1A). After the emergence (Figure 1B) of each repetition in the sand beds, a plant was used (Figure 1D) to transplant and deposit it at a depth of 20 cm in the 40 × 40 black polyethylene bags that contained up to 20 cm of substrate based on peat moss + pearlite + red tezontle (6 kg). Before and after transplantation of all the seedlings, irrigation was applied one to two times (Figure 1B) per day until physiological maturity of the plants. Likewise, two applications of fertilizer based on nitrogen (35 g), phosphorus (15 g), and potassium (10 g) were performed (one at 25 days and another at 50 days after transplant) per plant. The bags had a separation of 80 cm between pot rows, and 10 cob traits were measured in 5 plants (Figure 1F) plus the total dry matter (plant plus root).

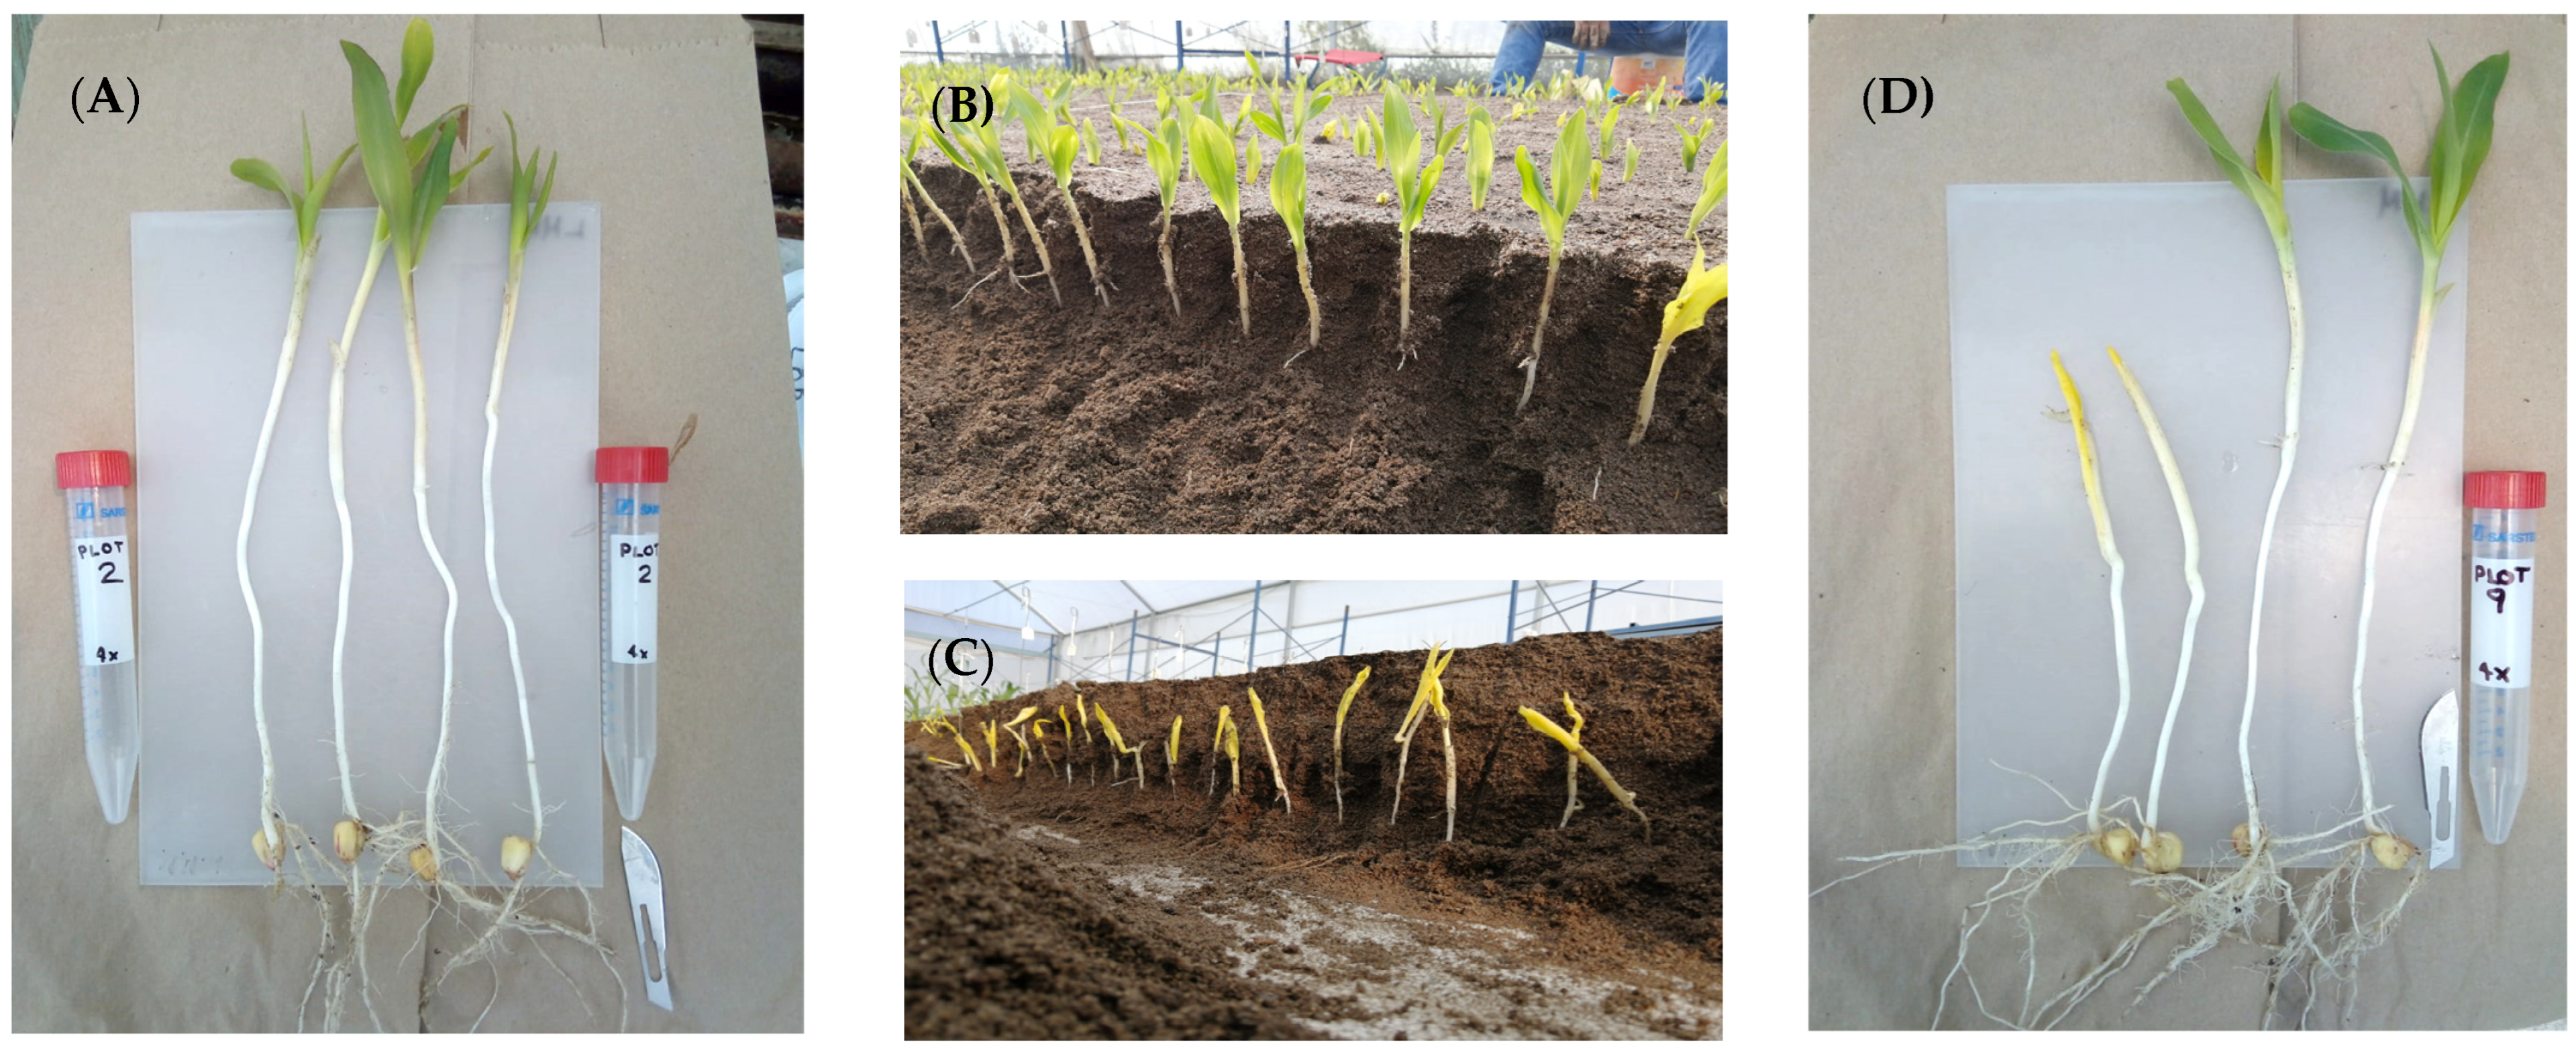
2.3. Variables and Statistical Analysis

The length (GL) and width (GW) of 10 grains selected randomly were measured using a millimetric ruler. Likewise, the cob length and width were recorded with a Vernier (CW, in cm), and the grain yield per plant (GYP, in g) and weight of 100 grains (WHG, in g) selected randomly were quantified using a digital scale. Just like the rest of the variables, the number of rows in the cob (NRC), number of grains per row on the cob (NGR) and number of grains per cob (NGC) were determined in each cob of the five plants. The total biomass dry weight (TBWA, in g) involved the following structures: pod and leaf blade, stem, spike, bracts, corncob, and root. The de-kernelling index (DKI %) was calculated as percentage of grain with regard to the cob weight.
In each seedling, the length of the mesocotyl (LM, cm) was measured from the union with the seed to the base of the coleoptile and the length of the coleoptile (LC, cm) was measured from the base of the coleoptile to its apex with a metric ruler. The dry weight of the total biomass (mesocotyl, coleoptile, root and developing green leaves) of the seedling (TBWS, in g) was also obtained. Both TBWS and total biomass dry weight of adult plants (TBWA) were dried in an oven (Blue M Electric Company, Blue Island, IL, USA) at 70 °C for 72 h.
The maximum and minimum temperatures (°C) of the air and soil were recorded daily. A digital thermometer TER-150 (Electronica Steren, S.A. of C.V., City Mexico, Mexico) was used for air data. While the temperature, humidity and luminosity of the soil were determined at 20 cm depth using a soil thermometer KC-300B (Green Tech Instruments, Veracruz, Mexico).
Variance analyses were made with the statistical package SAS®, v. 9.0, for Windows [22], and the effects of general (GCA) and specific (SCA) combinatory aptitude were calculated [8]. Later, a principal component analysis (PCA) was applied based on the correlation matrix between traits with the PRINCOMP procedure by SAS. Likewise, un-Plot was developed with SAS using the vectors of the first two principal components, which as a whole explain most of the total variation accumulated in the mean values of the principal components (PCA) [23] for parents, combinations by type of mesocotyl and crosses. The average heterosis was calculated as the difference, expressed in percentage, between the cross and the average of the parents.
The relative heterosis (MP) was determined and expressed as a percentage [24]. The heterosis was calculated using the differences between the mean of F1 crosses and the mid-parental value for a given characteristic.
Mid-parent heterosis = [(F1 − MP)/MP]  ×  100 (relative heterosis)
where F1 is the mean value of F1, and MP is the mean value of the parents involved in F1, i.e., (P1 + P2)/2.
The inbreeding depression (ID%) of the 36 crosses was estimated as the difference F1–F2 expressed as a percentage of the F1. The diallel analysis was performed with the information of diallel crosses (36) and their parents (9) with Griffing’s method II [8], where the crosses and their parents were considered fixed effects. The effects of GCA and SCA were estimated based on the following statistical model:
Yij = µ + gi + gj + sij;
where i, j = 1, 2, …, p parent; Yij = phenotypical value of the ij-th cross; µ = mean of the population; gi = effect of GCA of the i-th parent; gj = effect of GCA of the j-th parent; sij = effect of SCA for the combination of the i-th with the j-th parents. The relative importance of GCA and SCA was evaluated with the formula exposed by [25,26]: [2×MS_ GCA]/[2 ×* MS_GCA + MS_SCA], where MSGCA = mean square of the general combinatory aptitude and MSSCA = mean square of the specific combinatory aptitude.

3. Results

3.1. Variability in the GCA and SCA

Parents (Figure 2A,D) and F1 and F2 crosses (Figure 2B,C) presented significant variation (p ≤ 0.05) for GCA, SCA and GCA/SCA for all the traits measured of the seedling, adult plant and total dry matter (Table 1 and Table 2); that is, for the contrast length of mesocotyl (Figure 2), there is significant variation both for the additive effects and for those of dominance, thus suggesting the possibility of exercising the improvement in the length of mesocotyl in the field of hybridization or selection [25]. Regarding the contrast of GCA/SCA, the effects of GCA were practically equal to those of SCA for all the traits measured in both generations; that is, with purposes of breeding, there would be equal success in the field of selection than in that of hybridization and better still would be the combination of both.
In the change from F1 to F2, the GCA/SCA decreased (p ≤ 0.01), primarily for components of the cob (Table 1 and Table 2): GYP, GL, number of grains per cob (NGC), number of lines (NRC), grain length (GL), CL and CW. The increase in the variability in F2, compared to the variation in parents, which are hybrids of trilinear and double crosses, could be the cause of this decrease in the GCA/SCA relation, adding to the decrease in all the traits measured [27]. The exceptions where the progeny F2 maintained its values close to the unit were the length of mesocotyl (LM) (Figure 2), WHG and grain width (GW).

3.2. GCA of the Parents

The components of the GCA based on the parents presented significant variation (Figure 3). In this regard, the two principal components (PC1 and PC2) together explain 90% in F1 (Figure 3A) and 83% in F2 (Figure 3B) of the total variation accumulated in the mean values of the principal components measured by genotype. According to the projection and angles of the vectors, in F1, GW was associated negatively with NRC and DKI % (Figure 3A) and in F2 with CL (Figure 3B). Likewise, NGR was associated positively with CL and WHG, CW with TBWA and NGC with GYP in F1, and there was a positive association of GL with NGC, CL with NRC, CW with GL and TBWA with GYP in F2.
In relation to the dispersion of parents, H-48 was positively associated in a higher proportion with NGC, GYP and GL in F1 (Figure 3A, second quadrant) and with DKI % in F2 (Figure 3B). Meanwhile, HS-2 was positively associated with WHG, CL and NGR in F1 (Figure 3A, fourth quadrant) and with CW, CL, TBWA and GYP in F2 (Figure 3B, second quadrant); Promesa was positively associated with NGC and GL in F1 (Figure 3A, second quadrant) and with DKI % in F2 (Figure 3B, fourth quadrant) in comparison to the parents of the intermediate (H-70) and short mesocotyl (H-49 AE, H-32 and H-40), which showed a negative association for most of the PCA. Therefore, it was seen that inferior genotypes (p ≤ 0.05) in the LM show a lower proportion of association with the traits of the cob and dry matter (GYP, WHG, NGC, GL, CL, CW, NGR and TBWA).
The values obtained based on the elongation of mesocotyl from parents and their F1 and F2 crosses, as well as the corresponding estimation of the GCA, SCA and aptitude of the principal components of yield, come from corn seedlings and adult plants that were established in a greenhouse under climatic conditions that presented variation in air temperature (Figure 4 and Figure 5A) and soil (Figure 5B) as well as variation in soil moisture (Figure 5C) and luminosity (Figure 5D).
These climate variations had a fundamental role during the experiments in sand beds and polyethylene bags in 2021 and 2022, when the temperature was found to range between 13 and 31 °C for the air (Figure 5A) and from 19 to 25 °C for the soil (Figure 5B); likewise, the luminosity was 100 to 2000 lumens (Figure 5D) and the humidity ranged between 8 and 10 (Figure 5C), which partially interacted with the expression of the mesocotyl elongation and its structures. Meanwhile, in an adult plant, the air temperature ranged from 3 to 30 °C (Figure 4).
In this sense, the study allowed the observation of a positive and significant correlation (p ≤ 0.05) between the two principal components (PC1 and PC2) and the GCA of the parents; that is, with a higher GCA of the parents in F1 and F2, the association of the parents was higher compared to the two principal components (PC1 and PC2). However, in the parents and crosses L × L, this relationship was higher with regards to the parents and crosses M × M and S × S in F1 (Figure 3A) and F2 (Figure 3B). In this context, these results indicate that, in general, the parents H-48, HS-2 and Promesa gather in their genotype a higher number of dominant genes that are favorable for a high GCA than the parents of intermediate (H-44, H-52 and H-70) and short (H-49 AE, H-32 and H-40) mesocotyl do, which can be because they show a lower capacity to transmit alleles of an additive effect. Some reports [6] suggest that by selecting parent lines with positive GCA effects in most of the components of grain yield, the progeny has a high possibility of showing high grain yields. This fact was confirmed with the parents H-49 AE, H-32, H-40 and H-70, which presented lower GCA and a negative relation (p ≤ 0.05) compared to the two principal components (PC1 and PC2) in F1 and F2 (Figure 3), in comparison to the parents of long mesocotyls, where the highest positive associations for PC1 and PC2 were concentrated.

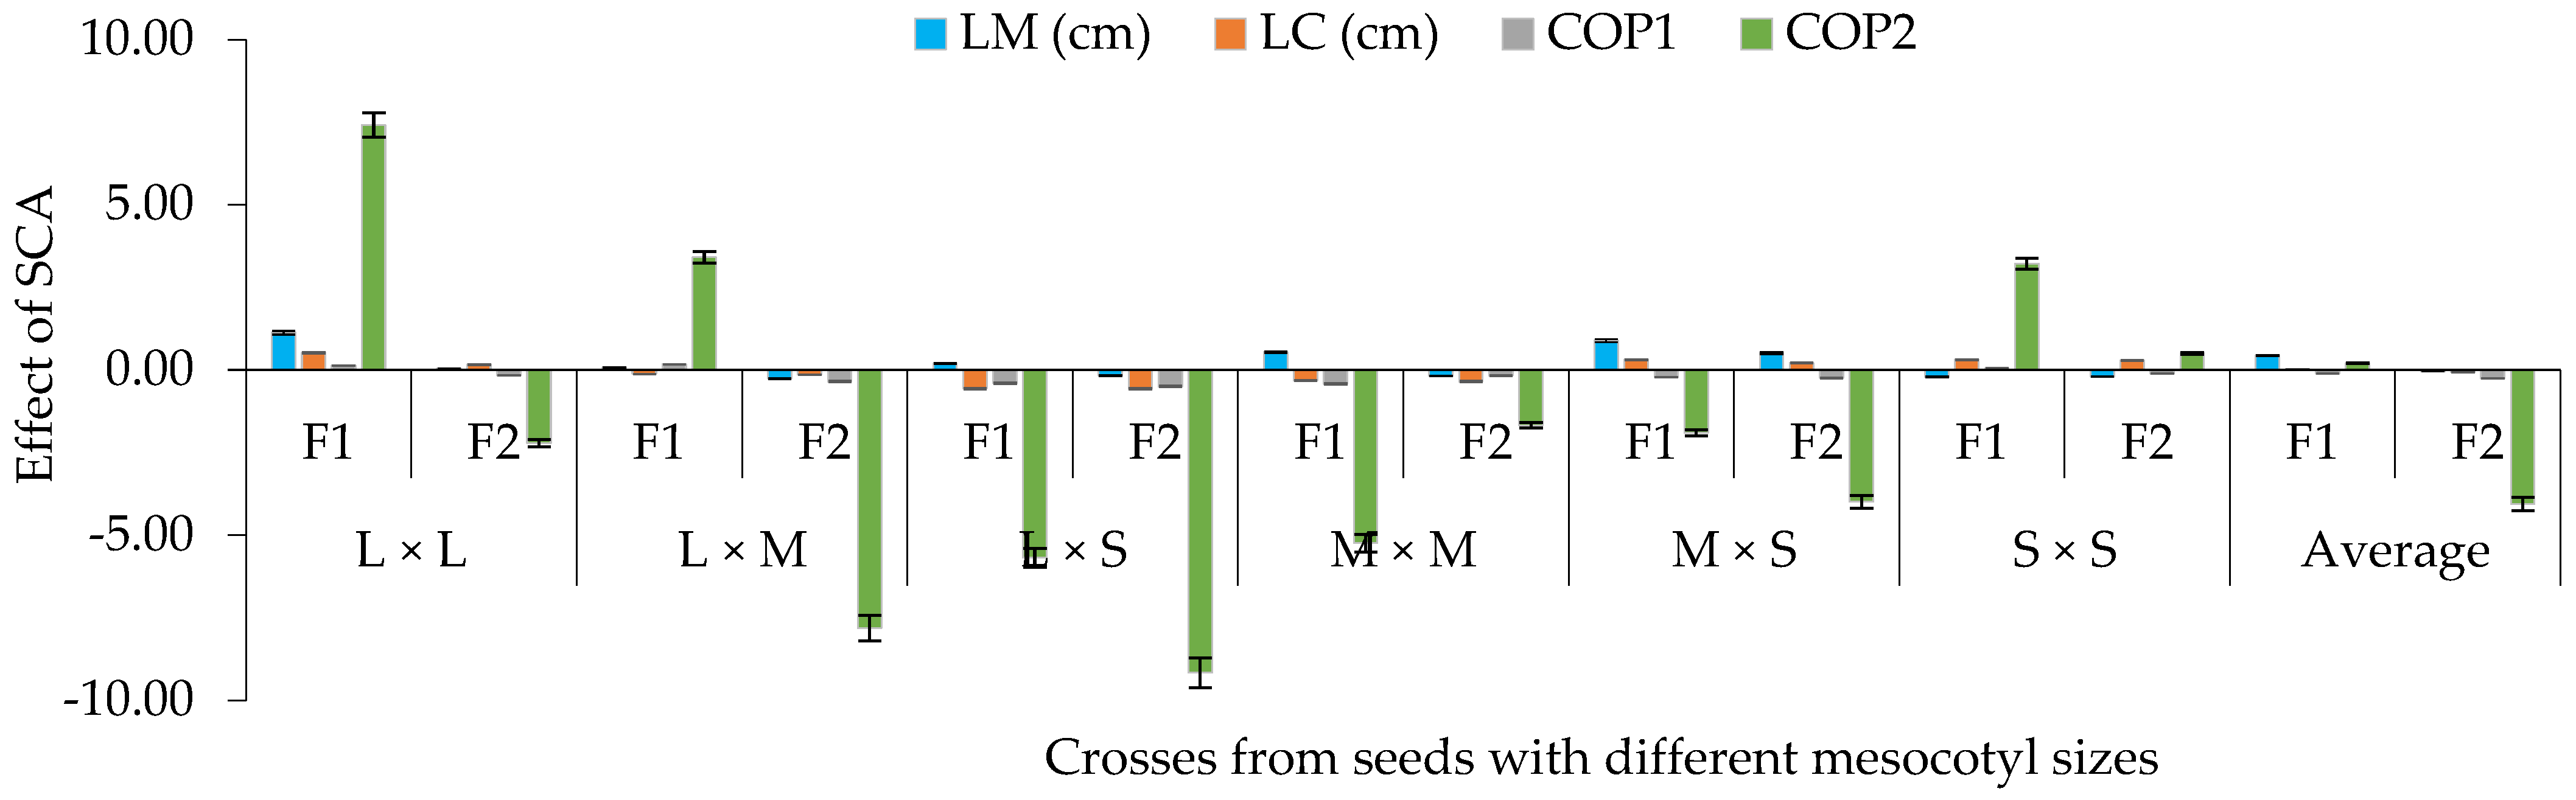
3.3. SCA for Crosses

The effects of SCA based on the contrast of mesocotyl elongation presented significant differences (p ≤ 0.05) for traits of the seedling, cob and dry matter (Figure 6). For this purpose, it was seen that, in F2, the effects of SCA were lower than in F1 for LM–LC and for component one (COP1), which grouped CL, CW, GL, GW, NL and NGL, and for component two (COP2), which grouped NGC, GYP, WHG, DKI %, TBWS and TBWA (Figure 6). Therefore, the study reveals that when combining long and intermediate mesocotyls, on average, a greater effect of SCA was obtained in both filial generations for LM and COP2, which grouped NGC, GYP [28], WHG [29] and TBWA [30] (Figure 6).

3.4. Interaction between Crosses, Yield and Length of Mesocotyl

The analysis of the PCA based on mesocotyl crosses and crosses showed that the first two components (PC1 and PC2) together explained 74.3% in F1 and 72.5% in F2 of the phenotypical variation observed in the mesocotyl crosses (Figure 7A,B) and crosses (Figure 8A,B and Figure 9A,B) studied here, with their own values of 6.4 and 1.7 in F1 and 6.3 and 1.5 in F2, and the specific contribution of 58.6 and 15.7% in F1 and 58.1 and 14.4% in F2 of the total variability. In this sense, according to their own vectors, in the first component (PC1) the variables with greater importance based on the mesocotyl crosses were GYP, TBWA, GL and WHG in F1 (Figure 7A) and F2 (Figure 7B). In the second component (PC2), the original variables of greater weight were NRC, NGC and DKI % for both generations (Figure 7A,B).
Regarding the thirty-six crosses, Figure 8 shows that ten crosses were classified as outstanding in F1 and seven in F2, which are located in quadrants 2 and 4 for both generations, where some crosses showed expressions that stood out for a trait in particular, such as 1 × 2 in GYP, TBWA, CL and CW (Figure 8A, fourth quadrant), 1 × 4 in WHG (Figure 8A, fourth quadrant) and 1 × 5 in NGR (Figure 8A, second quadrant) in F1, and 1 × 2 in GYP, 2 × 3 in GL, 1 × 3 in TBWA (Figure 8B, second quadrant) and 2 × 4 in CW in F2.
Now, if we compare the expression of the crosses against their parents, it can be found that although H-48 and HS-2 showed a desirable expression in CW, CL, WHG, TBWA and GYP in F1, this was lower than that of the combination 1 × 2 (Figure 8A). This situation was observed when these were compared in F2; however, on this occasion, 1 × 2 was higher in GYP, GL, WHG, DKI % and GW (Figure 8B). The cross 2 × 3 was also higher in relation to the expression of its parents (HS-2 and Promesa) in F1 and F2; however, this was in WHG and GL. Also, this behavior was similar among some traits in particular when other crosses were compared with regard to their filial parents of medium and short mesocotyls in F1 and F2 (Figure 8A,B).
Likewise, the use of the PCA allowed us to perform an integral classification of the mesocotyl combinations and crosses to discriminate more than 70% superior crosses, and it is inferred that the ones of superior combinatory aptitude were those that, in combination with long mesocotyls, showed the superior phenotypical expression (Figure 8).

3.5. Heterosis and Inbreeding Depression (ID)

The heterosis of all characters decreased from F1 to F2 (Figure 9). However, with the M × S and S × S mesocotyl crosses, positive values were presented in the second generation for LM. This situation coincides with the argument that the heterotic response depends on the genetic background of the genotypes involved in the crossing [31]. On average, among characters, the length of the coleoptile presented a greater reduction in heterosis in F1 (−19%) and F2 (−26%) with crosses of L × S mesocotyls.
In the percentage heterosis with regards to the average parent of F1 of the crosses (Figure 9), it was observed that the heterosis of the L × L and M × M mesocotyl crosses was higher than in crosses of L × M and L × S mesocotyls, with the exception of crosses of M × S for LM. Meanwhile, for LC, COP1 and COP2, only superiority of the L × L crosses was observed compared to the other contrasts of mesocotyls (Figure 9), with an average heterosis for LC of 1%, 2% for COP1 and 14% for COP2. These results are explained by the balance that is established between the magnitude of the GCA for parents (Figure 3) and SCA between the contrasts of mesocotyl (Figure 7), given that parents of low GCA and negative SCA participated in the L × S crosses (H-49 AE, H-32 and H-40). In this context, the variables studied expressed the effects of the metabolic process called heterosis or hybrid vigor [32], through which the offspring, in this case, the mesocotyl crosses L × L in LM [33], LC, COP1 and COP2 [34], L × M in LM and COP2, L × S and M × M in LM, M × S in LM and LC, S × S in LM, LC and COP2 (Figure 9), assume larger dimensions compared to the parents.
In relation to the ID%, on average, a greater depression was obtained for LM and COP2 based on all the mesocotyl crosses (Figure 9). In this sense, the combinations of L × L and L × M mesocotyls had a higher ID% than the combinations L × S, M × M, M × S and S × S. Therefore, the high heterosis in F1 of some crosses was associated with a high ID% of these combinations for LM, LC, COP1 and COP2 (Figure 10). Similar results were observed [35] between crosses of two commercial corn hybrids (P2 and P3) based on characters related to COP1 and COP2 [36] of the present study. Likewise, [37] indicates that it is important to explore germplasm with emphasis on inbreeding depression and its relationship with seedling traits and ear characters, such as ear weight and grain weight per ear of corn hybrids, to generate population base due to the high degree of genetic improvement in these genotypes, their adaptation to cultivation conditions and the presence of favorable alleles for traits of interest [37].

4. Discussion

Later studies [2,32,33,34,35,36,37,38,39] indicate that diallelic designs constitute a useful tool to characterize and estimate the GCA and SCA of parents and their crosses [9,40]; however, the main limitation of the use of complete diallels is the fact that the number of crosses to be evaluated increases considerably as more parents in the study are influenced [41,42]. Also, in practice, it is often not possible to obtain all the hybrid combinations possible because of different factors that include a low density of seeds, problems of fertilization and variation in adaptation, as well as losses of hybrids caused by the lack of germination. However, in this study, when using an incomplete diallel, low germination of parents and F1 and F2 crosses was also observed, which could be due to climatic factors, such as air (Figure 4 and Figure 5A) and soil (Figure 5B) temperature, luminosity (Figure 5D) and soil moisture (Figure 5C), where some genotypes and crosses show an inability for elongation of their mesocotyls and coleoptiles to emerge in deep sowing [16].
Both in complete and incomplete diallels [43,44], restrictions are often applied both to the parameters and to the solutions used to solve the equations to calculate the GCA and SCA. However, the parametric restrictions that are part of both models are also used to expand the set of sizable functions and provide more appropriate interpretations with regard to the hypothesis formulated [43]. However, care must be taken when working with incomplete diallels [45], since sometimes there may be overdominance because cases may be found in which the order of classification of the genotypes changes when some crosses present parents with a low frequency of the favorable allele [43]. In this sense, based on the hypothesis of this study, variability in the GCA, SCA and GCA/SCA values was observed in relation to the characteristics of the corn seedling and adult plant (Table 1 and Table 2). which presents a contrast to other similar studies [11] that found a higher GCA/SCA correlation with LM, with the exception of TBWS [46]. In this regard, [7] point out that when detecting greater effects in the GCA, it is feasible to exploit the additive proportion of genetic variance through recurrent selection; on the contrary, in crosses where there is a higher SCA, a recurring reciprocal or hybridization selection program may be implemented. Likewise, studies related to traits of the cob (Table 1 and Table 2) indicate that there are differences in the results obtained based on the traits evaluated under field and greenhouse conditions, such as [9], who found higher effects of GCA than those of SCA on cob length (CL), number of grains per line (NGR) and grain yield, but not cob width (CW). These results were the same as [47] in terms of CW, CL, NGR, weight of 100 grains (WHG), grain yield per plant (GYP) and de-kernelling index (DKI %). Other authors, such as [48,49], have obtained similar results, including those for grain yield. While, at the other extreme, Ref. [50] found that the non-additive effects were higher than the additive ones for grain yield, cob weight, and CL for some genotypes [10].
This study also shows that the two principal components together for both generations explain, on average, more than 80% of the total accumulated variation in the mean values of the principal components measured by genotype (Figure 3 and Figure 7) and contrasts with other studies, such as [51], who found inconsistency between the values of Pearson’s simple correlation (100%) and those of PCA that only explained 69.2% of that variation for the two principal components.
The study also revealed a positive association between parents and their crosses in a different way based on the elongation of the mesocotyls and some traits of the seedling and adult plant, such as the number and weight of grain per cob and grain length in F1 and de-kernelling index in F2 of the parent H-48. In a similar study, Ref. [52] associated these differences with the contrasting expression between genotypes for the GYP in deep sowing at 25, 51 and 76 mm. Likewise, other authors found that genotype FA0410 [53] and other varieties [29] are positively associated with CW, NGR and GYP. Meanwhile, others [28] observed that the Creole variety Tuza Morada, Maicito, Joco, Taberón I and the improved ICTA B-7 presented a lower association for GYP. In other studies, Ref. [54] considers that these differences in the contrasting expressions between genotypes for the cob traits (yield and CL) were given by the variation in the climatic conditions, such as air temperature, as happened during the early and adult stages of corn in both evaluation cycles (2021 and 2022) in this study, when there was a minimum temperature that ranged from 3 to 9 °C and a maximum between 24 and 30 °C during the growth stage (grain filling) of the plants (Figure 4) and which are related to those observed by other authors [55], where the meteorological factors significantly affected the weight of the corn grain (p < 0.05). Before anthesis, the total duration of sunshine exposure, the average temperature, the relative humidity and the accumulated temperature had strong effects on the grain weight. After anthesis, the daily average temperature, total rainfall, difference in temperature, accumulated temperature, highest daily average temperature and total hours of sunshine had strong effects on the grain weight [55].
Likewise, the study allowed the observation of a positive correspondence between the two principal components (PC1 and PC2) and the GCA of the parents; that is, with a higher GCA of the parents in F1 and F2, the association of the parents regarding the two principal components (PC1 and PC2) was higher and is similar to those obtained by other studies, where positive correlations were observed with the 1197AM (Pionner) corn in the field, OH, USA, for grain weight when a depth of 51 and 76 mm was established [52]. Therefore, the adjustments in the depth of sowing can improve the PCA of some genotypes, although the responses of grain yield can differ according to the soil type [56], as is the case of H-48, HS-2 and Promesa, ST34, ST11 and ST112 of Chalqueño race [57], IBM Syn10, B73, Mo17 [58], US13, Hopi, Navajo [59] and P11974M [47], which show a different response to the depth of sowing and soil, where the GCA of the LM–LC of some genotypes were associated with the speed and percentage of emergence and these were associated successively with the two principal components (PC1 and PC2) in the agricultural practice known as deep sowing, which is still used in semi-arid regions of Mexico [60] and in southwest USA [13]. Therefore, the parents (H-48, HS-2 and Promesa) with a higher GCA in LM–LC presented a greater relation with the two principal components, which suggests that LM–LC could be a response trait to stress from deep sowing [13].
On the other hand, the variation that originated in relation to the effects of the SCA on mesocotyl crosses for all the traits measured in seedling, cob and dry matter was higher in F1 than in F2 in relation to all the traits evaluated (LM, LC, COP1 and COP2). Therefore, it can be said that the elongation of the mesocotyl of some crosses was positively associated, while others were not, with the expression of some traits, such as the number and weight of grain per cob and the production of dry matter in seedling and adult plants. In this regard, studies, such as [61], indicate that some genotypes show different genetic capacities for mesocotyl elongation in deep sowing while others do not, which leads to low emergence percentages and population density, with “re-sowing” being necessary, which increases production costs and negatively affects the grain yield [62]. This could be due to the darkness that persists in deep sowing and inhibits the LM of some seedlings from emerging, so some lines of corn within each sub-population are heterogeneous concerning their response patterns in the dark and light [61].
In other studies [63], a positive association of the development and total dry weight of the root in adult plants was observed, a fact that was related to a higher amount of aerial biomass and TBWA, which contributes to a better expression of the yield components [64], as happened with the parents of long mesocotyl (H-48, HS-2 and Promesa) and L × L mesocotyl crosses, which showed a favorable GCA/SCA relation in the TBWA, where the dry weight of roots contributed, on average, 15 and 10% of the total biomass produced during the early and adult stages in F1 and F2 (Table 1 and Table 2). Likewise, there was a higher effect of SCA on LM and COP2. Later studies, such as [48], indicate that this could be useful to identify parents and combinations for a better yield, which could later be useful in recurrent–reciprocal selection or hybridization programs [65]. However, the SCA for LM–LC and TBWS (Table 1 and Figure 3) of some contrasts of mesocotyls could be underestimated and negatively affected by the variation in the air and soil temperatures during seedling emergence, which ranged between 13 and 31 °C and between 19 and 25 °C (Figure 5A), since corn is a crop that is sensitive to variation in air temperatures [66], where high and low temperatures can reduce the growth rate and seedling development [67]. Likewise, another factor that could influence the SCA in LM and LC is luminosity [68], which ranged between 100 lumens (7:00 am) and 2000 lumens (12:30 pm), and the humidity on a scale of 8 to 10 (Figure 5C,D), which was found in the study.
Some studies, such as [69], point out that at least two principal components are enough to adequately represent the variation of the variables evaluated, such as what happened in this study based on mesocotyl crosses and crosses, where the two components together explain more than 70% of the phenotypical variation observed in mesocotyl crosses and crosses in both generations, and where traits such as grain weight per cob and total dry matter weight, grain length and weight of 100 grains presented higher weight in F1 and F2. In this regard, Ref. [70] observed that the traits of the cob that are associated most with the grain yield were GYP, NGC, CW, CL, NRC and dry weight of roots, with the exception of total dry matter [71]. In this context, based on the PCA (PC1 and PC2), Figure 4 shows that the crosses of L × L mesocotyls in F1 and F2 were those that were mostly associated with PC1, which is characteristic of its greatest relevance in the explanation of the variation observed between mesocotyl crosses. Meanwhile, the L × M and M × M crosses were prominent for some traits of PC2. Likewise, there was a close relation of crosses L × L for GYP and TBWA in both generations compared to the mesocotyl crosses L × S, M × S and S × S, which presented a negative relation for all the cob traits. This behavior of the degree of variability and correlation of the PCA based on the mesocotyl crosses could be useful for the type, reach and direction of the selection and at the same time help to determine the level of relation between two separate traits [72], as well as the level in which these traits are mutually variable. Therefore, the grain yield can be increased by understanding the relation between the yield and its components and determining the type of relation between them [28].
In this context, 10 crosses of the 36 evaluated showed outstanding expressions for some traits in particular, such as 1 × 2 in the grain weight per cob, total dry matter weight and cob length and width. Likewise, these crosses were superior compared to their parents in at least one trait in particular, such as cross 2 × 3 in F1 and F2; however, this was in the weight of 100 grains and grain length. In a similar study, Ref. [73] observed that the crosses BALU-182 × Tropical and BALU-94 × Mista exceeded their parents in cob and grain weight, so the specificity between the parents involved in the crosses was exhibited, which was explained by the effects of GCA and SCA, where the effects of the GCA were higher than those of the SCA for all the traits, indicating that the additive effects are more important than the dominant ones [11] and where the GCA explained the best parent and the SCA explained the most promising crosses.
In this sense, these results can be of use in guiding breeders in the selection of cultivars adapted to stress environments of deep sowing. It is seen that a viable option for High Valleys in Mexico could be the use of crosses between genotypes or races with traits that prosper under conditions of water stress and from deep sowing, such as the LM–LC. This could be a selection criterion to improve genotypes that are less outstanding in the regions of High Valleys in Mexico, where it has been observed that the races Cacahuacintle, Cónico and Chalqueño show specific traits that allow them to develop [47] at altitudes of 2200 to 3000 m, where corn sowing prevails under conditions of “irrigation tip”, residual humidity and rainfed with low temperature events (frosts) [73] and where seeds must frequently be deposited at around 20 to 30 cm deep to reach the moisture available. Therefore, they could be useful populations in later studies related to stress from deep sowing, such as crosses 1 × 2, 1 × 3 and 2 × 3 from parent combinations (H-48, HS-2 and Promesa) of long mesocotyls, which presented favorable associations based on the PCA (Figure 6 and Figure 7).
The magnitude of the heterosis in parents, crosses of mesocotyl and crosses was explained in the values from lower to higher based on favorable expressions for the effects of GCA and SCA and the aptitude of the principal components, where the crosses of long and intermediate mesocotyls showed superiority compared to crosses of short mesocotyls for all the traits quantified in seedlings and adult plants. In this regard, ref. [5] observed high heterosis in CL, CW, NGC and GYP in a corn population that was associated with a high ID% of these traits. The authors of [74] indicate that the more divergent the parents are, the higher that heterosis will be in their hybrid or progeny; likewise, ref. [4] describes that, as the homozygosity increases in a population that suffers from ID% in the absence of selection, the frequency of the genotype changes, while the frequency of the allele remains unchanged. Inbreeding can happen involuntarily as a result of the selection or the maintenance of small populations [75].

5. Conclusions

Based on traits of the seedling, adult plant and total dry matter, in both generations of F1 and F2, there was significant variation in the effects of both GCA and SCA and a positive correspondence of both effects with the length of mesocotyl. The highest SCA was for L × L crosses, followed by L × M and S × S. On average, when comparing proportions of GCA/SCA, this relation varied from 0.76 to 0.97, which signals practically equal additive effects with those of dominance; however, in the parents and L × L crosses, this relation was 0.90, while it was 1.07 in M × M, 0.22 in S × S and 0.36 in L × S. The maximum expressions of heterosis and inbreeding depression were in the L × L crosses. The principal component analysis and dispersion allowed the visualization that the parents with larger mesocotyl and GCA stood out, H-48, HS-2 and Promesa, as well as the crosses between them; the crosses L × M, L × S, M × M, M × S and S × S followed, in that order.
In some regions of High Valleys in the country, biotic and abiotic stress is one of the main causes of the reduction in corn productivity, and this was also seen in this study since variability was demonstrated based on the stress effect from deep sowing during the early and adult stages of some parents, crosses of mesocotyl and crosses regarding the expression of the structures evaluated. However, with this study, it was possible to observe that the mesocotyl, the coleoptile, the roots and the dry matter of corn seedlings are useful selection criteria to evaluate stress (abiotic and biotic), the response and the tolerance to deep sowing during the early stage of seedling growth. Likewise, it was possible to visualize that there is genetic diversity of genotypes in the elongation of mesocotyl and coleoptile, and that, from each mesocotyl cross (L × L, L × M, L × S, M × M, M × S and S × S), there are crosses of different values for genetic improvement with important traits associated with grain production. So, the study and relation of traits in the early and adult stages could be useful to expand and strengthen plant improvement programs and for deep sowing as a result of the decreasing residual moisture and/or late start of rainfall.

Author Contributions

Conceptualization, A.V.-G., I.B.-R., M.d.C.M.-C. and A.E.-C.; methodology, A.V.-G. and I.B.-R.; validation, F.C.-G., M.d.C.M.-C. and A.E.-C.; formal analysis, F.C.-G. and A.V.-G.; investigation, A.V.-G. and I.B.-R.; resources, I.B.-R.; data curation, F.C.-G.; writing—original draft preparation, I.B.-R. and A.V.-G.; writing—review and editing, I.B.-R. and M.d.C.M.-C.; visualization, M.d.C.M.-C. and A.E.-C.; supervision, A.V.-G. and I.B.-R.; project administration, A.V.-G. All authors have read and agreed to the published version of the manuscript.

Funding

This study was financed by the National Institute for Forest, Agriculture and Livestock Research (INIFAP), with institutional resources to support researchers in training (No. 2196) and College of Postgraduates (COLPOS), with institutional resources to support students of the postgraduate course in Genetic Resources and Productivity-Genetics (No. 12011027). Antonio Villalobos González was supported by the Scholarship Program of the National Council of Humanities, Science and Technology (CONAHCYT National Doctorate 2020-2023/765690).

Institutional Review Board Statement

Not applicable.

Informed Consent Statement

Not applicable.

Data Availability Statement

The data presented in this study are available on request from the corresponding author.

Acknowledgments

The authors wish to thank Juan Virgen Vargas and Alejandro Espinosa Calderón from the National Institute for Forest, Agriculture and Livestock Research (INIFAP) and Aquiles Carballo Carballo from Colegio de Postgraduados (COLPOS) for supplying the seed for this study.

Conflicts of Interest

The authors declare no conflicts of interest.

References

  1. Jameel, A.A.; Hassan, H.B. Genetic analysis by using partial diallel crossing of maize in high plant densities (Estimation GCA, SCA and Some Genetic Parameters). Earth Environ. Sci. 2021, 910, 012135. [Google Scholar] [CrossRef]
  2. Begna, T. Combining ability and heterosis in plant improvement. Open J. Plant Sci. 2021, 6, 108–117. [Google Scholar] [CrossRef]
  3. Rodríguez, P.G.; Treviño, R.J.E.; Ojeda, Z.M.C.; Cervantes, O.F.; Ávila, P.M.A.; Gámez, V.A.J. Genetic parameters and combining ability of corn lines for grain. Rev. Mex. Agric. Sci. 2020, 11, 1867–1878. [Google Scholar] [CrossRef]
  4. Wu, X.; Liu, Y.; Zhang, Y.; Gu, R. Advances in research on the mechanism of heterosis in plants. Front. Plant Sci. 2021, 12, 745726. [Google Scholar] [CrossRef] [PubMed]
  5. Samayoa, L.F.; Olukolu, A.B.; Jian, C.Y.; Chen, Q.; Stetter, M.G.; York, A.M.; Sánchez, G.J.J.; Glaubitz, J.C.; Bradbury, P.J.; Romay, M.C.; et al. Domestication reshaped the genetic basis of inbreeding depression in a maize landrace compared to its wild relative, teosinte. PLoS Genet. 2021, 17, e1009797. [Google Scholar] [CrossRef] [PubMed]
  6. Hasan, R.S.; Husain, M.A. Estimation combining ability and some genetic parameters for maize (Zea mays L.) and its componenets using line x tester. J. Duhok Univ. 2022, 25, 229–237. [Google Scholar] [CrossRef]
  7. Yu, K.; Wang, H.; Liu, X.; Xu, C.; Li, Z.; Xu, X.; Liu, J.; Wang, Z.; Xu, Y. Large-scale analysis of combining ability and heterosis for development of hybrid maize breeding strategies using diverse germplasm resources. Front. Plant Sci. 2020, 11, 660. [Google Scholar] [CrossRef]
  8. Griffing, B. Concept of general and specific combining ability in relation to diallel crossing systems. Aust. J. Biol. Sci. 1956, 9, 463–493. Available online: https://www.publish.csiro.au/bi/pdf/bi9560463 (accessed on 28 August 2022). [CrossRef]
  9. Mohamed, M.H.R.; Mohamed, D.Z.; Rizk, A.S.H. Combining abilities and genetic parameters for grain yield and some agronomic traits in maize (Zea mays L.). Beni-Suef Univ. J. Basic Appl. Sci. 2022, 11, 108. [Google Scholar] [CrossRef]
  10. Souza, N.I.L.; Torre, S.F.A.; Santos, R.U.; Contreras, I.S.R.; Alberto, C.S.; Dutra, M.Z. Combining ability and heterotic pattern in relation to F1 performance of tropical and temperate-adapted sweet corn lines. Bragantia 2022, 81, e3422. [Google Scholar] [CrossRef]
  11. Yuan, Z.; Xiaoqiang, Z.; Wenli, L.; Dan, Z.; Wenqi, Z. Heterosis and genetic effects analysis of deep-seeding traits in maize under different sowing environments. J. Nucl. Agric. Sci. 2021, 35, 556–566. [Google Scholar] [CrossRef]
  12. Yue, H.; Gauch, G.H.; Wei, J.; Xie, J.; Chen, S.; Peng, H.; Bu, J.; Jiang, X. Genotype by environment interaction analysis for grain yield and yield components of summer maize hybrids across the huanghuaihai region in China. Agriculture 2022, 12, 602. [Google Scholar] [CrossRef]
  13. Sáenz, R.M.N.; Cassab, G.I. Primary root and mesocotyl elongation in maize seedlings: Two organs with antagonistic growth below the soil surface. Plants 2021, 10, 1274. [Google Scholar] [CrossRef] [PubMed]
  14. Benavente, E.; Giménez, E. Modern approaches for the genetic improvement of rice, wheat and maize for abiotic constraints-related traits: A comparative overview. Agriculture 2021, 11, 376. [Google Scholar] [CrossRef]
  15. Allier, A.; Teyssedre, S.; Lehermeier, C.; Moreau, L.; Charcosset, A. Optimized breeding strategies to harness genetic resources with different performance levels. BMC Genom. 2020, 21, 349. [Google Scholar] [CrossRef] [PubMed]
  16. Villalobos, G.A.; Benítez, R.I.; Castillo, G.F.; Mendoza, C.M.D.C.; Espinosa, C.A. Assessment of elongation of the mesocotyl-coleoptile and biomass in parents and crosses of corn seedlings of the high Valleys of Mexico. Seeds 2023, 2, 449–473. [Google Scholar] [CrossRef]
  17. Lu, Y.H.; Xu, Y.L.; Xiao, J.Z.; Bao, C.S.; Cheng, L.; Deng, F.Z.; Huai, J.T.; Chun, H.L.; Yong, X.L.; Yun, S.S.; et al. Genome-wide identification and comparative analysis of drought related genes in roots of two maize inbred lines with contrasting drought tolerance by RNA sequencing. J. Int. Agric. 2020, 8, 449–464. [Google Scholar] [CrossRef]
  18. Yan, W.; Frégeau, R.J. Genotype by yield*trait (GYT) biplot: A novel approach for genotype selection based on multiple traits. Sci. Rep. 2018, 8, 8242. [Google Scholar] [CrossRef]
  19. Xu, Y.; Liu, X.; Fu, J.; Wang, H.; Wang, J.; Huang, H.; Zhang, A. Enhancing genetic gain through genomic selection: From Livestock to Plants. Plant Commun. 2020, 1, 100005. [Google Scholar] [CrossRef]
  20. Miedaner, T.; Juroszek, T. Global warming and increasing maize cultivation demand comprehensive efforts in disease and insect resistance breeding in north-western Europe. Plants Pathol. 2021, 70, 1032–1046. [Google Scholar] [CrossRef]
  21. Villalobos, L.M.A.; Arroyo, B.A.; Quintero, J.A.; Iturriaga, G. Biotechnological advances to improve abiotic stress tolerance in crops. Int. J. Mol. Sci. 2022, 23, 12053. [Google Scholar] [CrossRef] [PubMed]
  22. SAS. The SAS System Release for Windows 9.0; SAS Institute Inc.: Cary, NC, USA, 2002. [Google Scholar]
  23. Yan, W. Crop variety trials: Data management and analysis. Crop Sci. 2014, 54, 2910–2911. [Google Scholar] [CrossRef]
  24. Labroo, M.R.; Studer, A.J.; Rutkoski, J.E. Heterosis and hybrid crop breeding: A multidisciplinary review. Front. Genet. 2021, 12, 643761. [Google Scholar] [CrossRef] [PubMed]
  25. López, L.C.; Tadeo, M.R.; García, J.Z.J.; Espinosa, A.C.; Mejía, A.J.C. General and specific combinatorial aptitude of varietal hybrids of low inbreeding yellow corn. Rev. Mex. Agric. Sci. 2021, 12, 699–711. [Google Scholar] [CrossRef]
  26. Baker, R.J. Issues in diallel analysis. Crop Sci. 1978, 18, 533–536. [Google Scholar] [CrossRef]
  27. Benowicz, A.; Stoehr, M.; Hamann, A.; Yanchuk, D.A. Estimation of the F2 generation segregation variance and relationships among growth, frost damage, and bud break in coastal Douglas-fir (Pseudotsuga menziesii (Mirb.) Franco) wide-crosses. Ann. For. Sci. 2020, 77, 28. [Google Scholar] [CrossRef]
  28. Nasir, M.S.M.; Nagy, J.J. Evaluation of plant characteristics related to grain yield of FAO410 and FAO340 hybrids using regression models. Cereal Res. Commun. 2021, 49, 161–169. [Google Scholar] [CrossRef]
  29. Aman, J.; Bantte, K.; Alamerew, S.; Berhe, S.D. Correlation and path coefficient analysis of yield and yield components of quality protein maize (Zea mays L.) hybrids at jimma, western Ethiopia. Int. J. Agron. 2020, 2020, 9651537. [Google Scholar] [CrossRef]
  30. Noori, R.M. Yield and yield components of maize and soil physical properties as affected by tillage practices and organic mulching. Saudi J. Biol. Sci. 2021, 28, 7152–7159. [Google Scholar] [CrossRef]
  31. Díaz, C.P.; Hidalgo, M.E.; Mendoza, P.M.; Cieza, R.I.; Jara, C.T.W.; Valdés, R.O.A. New thilinear hybrid of hard yellow corn for the Peruvian tropic. Agron. Meso. 2023, 34, 51177. [Google Scholar] [CrossRef]
  32. Gutiérrez, H.G.F.; Arellano, V.J.L.; Ceja, T.L.F.; García, R.E.; Quiroz, F.F.R. Heterosis in the germination process and seed characteristics of the maize hybrid (Zea mays L.) HAZUL 10E. Agro Product. 2023, 16, 119–125. [Google Scholar] [CrossRef]
  33. Adebiyi, O.O.; Gbemavo, G.K.; Adewole, A.K. Genetic variability for mesocotyl length in maize. Biol. Life Sci. Forum 2021, 4, 26. [Google Scholar] [CrossRef]
  34. Yi, Q.; Liu, Y.; Hou, X.; Zhang, X.; Li, H.; Zhang, J.; Liu, H.; Hu, Y.; Yu, G.; Li, Y.; et al. Genetic dissection of yield-related traits and mid-parent heterosis for those traits in maize (Zea mays L.). BMC Plant Biol. 2019, 19, 392. [Google Scholar] [CrossRef] [PubMed]
  35. Mariano, C.L.; Neves, S.P.; Valéria, C.N.; Crispim, F.A.J.; Mendes, R.M.P.; Santos, M.P.G. Inbreeding depression and genetic variability of populations for green maize production. Rev. Ceres Vicosa 2022, 69, 709–719. [Google Scholar] [CrossRef]
  36. Kashiani, P.; Saleh, G.; Abdullah, N.A.P.; Abdullah, S.N. Variation and Genetic Studies on Selected Sweet Corn Inbred Lines. Asian J. Crop Sci. 2010, 2, 78–84. [Google Scholar] [CrossRef]
  37. Kuki, M.C.; Scapim, C.A.; Barth, P.R.J.; Torre, F.A.S.; Contreras, S.R.I.; Bengosi, B.F.A. Inbreeding depression and average genetic components in green corn genotypes. Rural Sci. 2017, 47, e20160024. [Google Scholar] [CrossRef]
  38. Días, M.M.F.S.; Bart, P.R.J.; Aparecida, D.S.T.; Ary, R.D.; Akira, M.R.; Gibim, E.T.; Lago, G.G.D. Partial diallel and genetic divergence analyses in maize inbred lines. Acta Scientiarum. Agriculture 2021, 43, e53540. [Google Scholar] [CrossRef]
  39. Nardino, M.; Barros, W.; Olivato, T.; Damião, C.C.; E Silva, F.F.; DE Pelegrín, A.J.; DE Souza, V.Q.; Carvalho, I.R.; Szareski, V.J.; DE Oliveira, A.C.; et al. Multivariate diallel analysis by factor analysis for establish mega-traits. An. Acab. Bras. Sci. 2020, 92, e20180874. [Google Scholar] [CrossRef]
  40. Muthoni, J.; Shimelis, H. Mating designs commonly used in plant breeding: A review. AJCS 2020, 12, 1855–1869. [Google Scholar] [CrossRef]
  41. Matongera, N.; Ndhlela, T.; Van, B.A.; Kamutando, C.N.; Labuschagne, M. Combining ability and testcross performance of multi-nutrient maize under stress and non-stress environments. Front. Plant Sci. 2023, 14, 1070302. [Google Scholar] [CrossRef]
  42. Inocente, G.; Domingos, G.D.; Araújo, P.M.; Ruas, P.M. Heritability and combined parental information to define the number of crosses in circulant diallels. Crop Breed. Appl. Biotechnol. 2021, 2, e37472125. [Google Scholar] [CrossRef]
  43. Fan, X.M.; Zhang, Y.D.; Yao, W.H.; Bi, Y.Q.; Liu, L.; Chen, H.M.; Kang, M.S. Reciprocal diallel crosses impact combining ability, variance estimation, and heterotic group classification. Crop Sci. 2014, 54, 89–97. [Google Scholar] [CrossRef]
  44. Lessa, A.G.M.; Fonseca, R.; Damião, C.C.; Carneiro, J.J.M. Estimation of variances of the effects of incomplete diallels using a matrix approach. Genet. Mole. Biol. 2004, 27, 409–417. [Google Scholar] [CrossRef]
  45. Wang, X.; Zhang, Z.; Xu, Y.; Li, P.; Zhang, X.; Xu, C. Using genomic data to improve the estimation of general combining ability based on sparse partial diallel cross designs in maize. Crop J. 2020, 8, 819–829. [Google Scholar] [CrossRef]
  46. Xavier, S.L.F.; Pestana, J.K.; Sekiya, A.; Krause, D.M.; Moreira, P.R.M.; Ferreira, J.M. Partial diallel and potential of super sweet corn inbred lines bt2 to obtain hybrids. Hort. Bras. 2019, 37, 278–284. [Google Scholar] [CrossRef]
  47. Cervantes, O.F.; Hernández, E.J.; Rangel, L.J.A.; Andrio, E.E.; Mendoza, E.M.; Rodríguez, P.G.; Guevara, A.L.P. General and specific combinatorial aptitude in seed quality of s3 corn lines. Revest Mex. Phytotech. 2016, 39, 259–268. [Google Scholar] [CrossRef]
  48. Bhusal, T.N.; Lal, M.G. Heterosis, Combining ability and their inter-relationship for morphological and quality traits in yellow maize (Zea mays L.) single-crosses across environments. Agrivita J. Agric. Sci. 2020, 42, 174–190. [Google Scholar] [CrossRef]
  49. Ramos, G.P.H.; Pereira, A.C.; Colombari, M.F.J.; Pereira, P.T.; Nakano, H.R.P.; Santos, P.M.G. Diallel analysis: Choosing parents to introduce new variability in a recurrent selection population. Agriculture 2022, 13, 1320. [Google Scholar] [CrossRef]
  50. Barrera, G.L.A.; Legaria, P.S.J.; Ortega, R.P. Genetic diversity in populations of mexican maize races. Revest Mex. Phytotech. 2020, 43, 121–125. [Google Scholar] [CrossRef]
  51. Oliveira, S.T.; Oliveira, F.T.; Amaral, A.J.T.; Almeida, J.F.E.; Barboza, R.B.; Mendonça, F.M.S.; Teixeira, A.J.F.; Henrique, K.S.; Jário, L.V.; Nicácio, V.F.; et al. Additive and non-additive effects on the control of key agronomic traits in popcorn lines under contrasting phosphorus conditions. Plants 2022, 11, 2216. [Google Scholar] [CrossRef]
  52. Tafolla, R.M.A.; Rincón, F.S.; Ruiz, A.T.N.; Sánchez, J.R.F.; Martínez, M.R.J.; Benavides, A.M. Genetic and environmental effects of prolificacy in relation to maize yield. Agrociencia 2021, 55, 507–521. [Google Scholar] [CrossRef]
  53. Nemergut, T.K.; Thomison, R.P.; Carter, R.P.; Lindsey, J.A. Planting depth affects corn emergence, growth and development, and yield. Agron. J. 2021, 113, 3351–3360. [Google Scholar] [CrossRef]
  54. Pierre, F.; Rodríguez, Y.I.; Colbert, W.R.; Rosas, C.J. Agronomic behavior of native and improved corn varieties in a low fertility soil. Ceiba 2003, 56, 16–30. [Google Scholar] [CrossRef]
  55. Ortez, O.A.; McMechan, A.J.; Hoegemeyer, T.; Ciampitti, I.A.; Nielsen, R.L.; Thomison, P.R.; Abendroth, L.J.; Elmore, R.W. Conditions potentially affecting corn ear formation, yield, and abnormal ears: A review. Crop For. Turf. Mgmt. 2022, 8, e20173. [Google Scholar] [CrossRef]
  56. Wang, L.; Yu, X.; Gao, J.; Ma, D.; Guo, H.; Hu, S. Patterns of influence of meteorological elements on maize grain weight and nutritional quality. Agriculture 2023, 13, 424. [Google Scholar] [CrossRef]
  57. Stewart, S.; Kitchen, N.; Yost, M.; Stephen, C.L.; Carter, P. Planting depth and within-field soil variability impacts on corn stand establishment and yield. Agrosystems Geosci. Environ. 2021, 4, e20186. [Google Scholar] [CrossRef]
  58. Pérez, D.C.F.J.; Córdova, T.L.; Santacruz, V.A.; Castillo, G.F.; Cárdenas, S.E.; Delgado, A.A. Relationship between Initial Vigor, Yield and Its Components in Chalqueño Maize Populations. Tech. Agric. Mex. 2007, 33, 5–16. Available online: http://www.redalyc.org/articulo.oa?id=60833101 (accessed on 13 September 2022).
  59. Liu, H.; Zhang, L.; Wang, J.; Li, C.; Zeng, X.; Xie, S.; Zhang, Y.; Liu, S.; Hu, S.; Wang, J.; et al. Quantitative trait locus analysis for deep-sowing germination ability in the maize IBM syn10 DH population. Front. Plant Sci. 2017, 8, 813. [Google Scholar] [CrossRef]
  60. Bousselot, J.M.; Muenchrath, D.; Knapp, D.A.; Reeder, D.J. Emergence and seedling characteristics of maize native to the southwestern USA. Am. J. Llant Sci. 2017, 8, 1304–1318. [Google Scholar] [CrossRef]
  61. Santiago, L.N.; García, Z.J.G.; Santiago, L.U.; Esquivel, E.G. Yield of varieties of pozolero corn of the ‘elotes occidentales’ race evaluated in High Valleys of Mexico. Revest Mex. Agric. Sci. 2023, 14, 96–104. [Google Scholar] [CrossRef]
  62. Zhao, X.; Niu, Y.; Hossain, Z.; Zhao, B.; Bai, X.; Mao, T. New insights into light spectral quality inhibits the plasticity elongation of maize mesocotyl and coleoptile during seed germination. Front. Plant Sci. 2023, 14, 1152399. [Google Scholar] [CrossRef]
  63. Reed, R.C.; Bradford, J.F.; Khanday, I. Seed germination and vigor: Ensuring crop sustainability in a changing climate. Heredity 2022, 128, 450–459. [Google Scholar] [CrossRef]
  64. Castro, A.M.L.; Sánchez, H.S.B.; Ruelas, R.I.J.; Romero, S.F.C.; Buelna, S.T.; Almada, G.R.V. Morpho-physiological characteristics of corn (Zea mays L.) affected by drought during its vegetative stage. Agro Product. 2021, 14, 71–77. [Google Scholar] [CrossRef]
  65. Chen, C.X.; Ping, Z.; Yuan, W.Y.; Ning, L.; Bei, T.J.; Xi, L.W.; Pu, W.; Shou, H.R. Grain yield and grain moisture associations with leaf, stem and root characteristics in maize. J. Int. Agric. 2022, 21, 1941–1951. [Google Scholar] [CrossRef]
  66. Hemada, S.S.H.; Yassien, H.E.; Abd, I.N.E.L.; Haridy, M.H. Combining ability and genetic parameters of some white maize (Zea mays L.) inbred lines using diallel analysis. Arch. Agric. Sci. J. 2020, 3, 82–100. [Google Scholar] [CrossRef]
  67. Holá, D.; Kočová, M.; Rothová, O.; Wilhelmová, N.; Benešová, M. Recovery of maize (Zea mays L.) inbreds and hybrids from chilling stress of various duration: Photosynthesis and antioxidant enzymes. J. Plant Physiol. 2007, 164, 868–877. [Google Scholar] [CrossRef]
  68. Sowinski, P.; Rudzinska, L.A.; Adamczyk, J.; Kubica, I.; Fronk, J. Recovery of maize seedling growth, development and photosynthetic efficiency after initial growth at low temperature. J. Plant Physiol. 2005, 162, 67–80. [Google Scholar] [CrossRef]
  69. Markelz, H.N.; Costich, E.D.; Brutnell, P.T. Photomorphogenic responses in maize seedling development. Plant Physiol. 2003, 133, 1578–1591. [Google Scholar] [CrossRef]
  70. Cargnelutti, F.A.; Toebe, M. Sample size for principal component analysis in corn. Pesqui. Agropecuária Bras. 2021, 56, e02510. [Google Scholar] [CrossRef]
  71. Tucker, S.L.; Dohleman, F.G.; Grapov, D.; Flagel, L.; Yang, S.; Wegener, K.M.; Kosola, K.; Swarup, S.; Rapp, R.A.; Bedair, M.; et al. Evaluating maize phenotypic variance, heritability, and yield relationships at multiple biological scales across agronomically relevant environments. Plant Cell Eviron. 2019, 43, 880–902. [Google Scholar] [CrossRef]
  72. Thapa, M.B.; Acharya, S.; Gyawali, B.; Timilsena, K.; Upadhayaya, J.; Shrestha, J. Genetic variability and trait association in maize (Zea mays L.) varieties for growth and yield traits. Heliyon 2021, 7, e07939. [Google Scholar] [CrossRef]
  73. Hideyo, N.T.; Bengosi, A.B.F.; Kuki, M.C.; Scapim, A.C.; Barth, J.P.R.; Teixeira, A.; Júnior, A. Testers in supersweet corn lines. Rural Sci. 2020, 50, e20190447. [Google Scholar] [CrossRef]
  74. González, D.M.R.; Navarro, G.H.; Ortega, P.R.; Flores, S.D.; González, S.V. Peasant strategies for the use and conservation of native corn in Juchitepec, state in Mexico. Agro Product. 2022, 15, 129–143. [Google Scholar] [CrossRef]
  75. Merrick, L.; Beavis, W.; Edwards, J.; Lübberstedt, T.; Campbell, A.; Muenchrath, D.; Fei, S. Inbreeding and heterosis. In Crop Genetics, 1st ed.; Suza, W.P., Lamkey, K.R., Eds.; Iowa State University Digital Press: Ames, IA, USA, 2023; pp. 177–199. [Google Scholar] [CrossRef]
Figure 1. Experiments in greenhouse conditions. Seed deposit in sand beds (A); irrigation application (B); seedling emergence (C); plants for transplant (D); plants in polyethylene bags (E,F).
Seeds 03 00012 g001
Figure 2. Contrast of corn seeds from parents and crosses (F1 and F2) based on mesocotyl elongation in sandy soil conditions with humidity in the greenhouse. H-48 seedlings (A); corn seedling with elongation of long (B) and short (C) mesocotyl; H-40 and Promesa seedlings (D).
Seeds 03 00012 g002
Figure 3. Biplot of characteristics and their dispersions of parents based on the general combinatory aptitude (GCA) for F1 (A) and F2 (B) in the plane of the first two principal components. CL and CW = cob length and width; GL and GW = length and width of 10 grains; NRC = number of rows in the cob; NGR = number of grains per row on the cob; NGC = number of grains per cob; GYP = grain yield per plant; WHG = weight of 100 grains; DKI % = de-kernelling index; TBWA = total biomass dry weight.
Seeds 03 00012 g003
Figure 4. Mean temperature of the air during the experiments of S-S 2021 and 2022 with seeds of corn parents and crosses. SD1 and SD2 = date of sowing 2021 and 2022; FM, FF and PM = average of days to masculine and feminine flowering and physiological maturity.
Seeds 03 00012 g004
Figure 5. Mean values air temperature (A) and soil temperature (B), luminosity (LUM) (C) and soil humidity (HUM) (D) during the S-S 2021 and 2022 experiments with seeds of parents and F1 and F2 crosses in greenhouse conditions. Recording of mean values: 7:00 a.m. (sunrise); 1:00 p.m. (noon); 7:00 p.m. (sunset). Soil humidity on scale 1–10 (ESC:1-10): 1–3 = low humidity; 4–7 = moderate humidity; 8–10 = humid.
Seeds 03 00012 g005aSeeds 03 00012 g005b
Figure 6. Average effect of the specific combinatory aptitude (SCA) based on crosses of mesocotyls: long × long (L × L); long × medium (L × M); long × short (L × S); medium × medium (M × M); medium × short (M × S); and short × short (S × S) for components one (COP1) and two (COP2) of corn in F1 and F2, S-S 2021 and 2022 cycles. LM and LC = length of mesocotyl and coleoptile; COP1 = length and width of cob, length and width of grain, number of rows in the cob and number of grains per row on the cob; COP2 = number and weight of grains per cob, weight of 100 grains, de-kernelling index and total biomass of seedling and adult plant. Vertical bars show standard error.
Seeds 03 00012 g006
Figure 7. Biplot of characteristics and dispersion of parents and combinations of mesocotyl: long × long (L × L); long × medium (L × M); long × short (L × S); medium × medium (M × M); medium × short (M × S); and short × short (S × S) for F1 (A) and F2 (B) in the plane of the first two principal components. Parents with long (PML) (H-48, HS-2 and Promesa), medium (PMM) (H-44, H-52 and H-70) and short (PMS) (H-49 AE, H-32 and H-40) mesocotyls. CL and CW = cob length and width; GL and GW = length and width of 10 grains; NRC = number of rows in the cob; NGR = number of grains per row on the cob; NGC = number of grains per cob; GYP = grain yield per plant; WHG = weight of 100 grains; DKI % = de-kernelling index; TBWA = total biomass dry weight.
Seeds 03 00012 g007
Figure 8. Biplot of characteristics and dispersion of 9 parents and 36 crosses on F1 (A) and F2 (B) in the plane of the first two principal components. Parents with long (PML) (H-48, HS-2 and Promesa), medium (PMM) (H-44, H-52 and H-70) and short (PMS) (H-49 AE, H-32 and H-40) mesocotyls. CL and CW = cob length and width; GL and GW = length and width of 10 grains; NRC = number of rows in the cob; NGR = number of grains per row on the cob; NGC = number of grains per cob; GYP = grain yield per plant; WHG = weight of 100 grains; DKI % = de-kernelling index; TBWA = total biomass dry weight.
Seeds 03 00012 g008
Figure 9. Average percentage heterosis with regards to the average parent based on crosses of mesocotyl: long × long (L × L); long × medium (L × M); long × short (L × S); medium × medium (M × M); medium × short (M × S); and short × short (S × S) for components of the yield in F1 and F2 S-S 2021 and 2022 cycles. COP1 = length and width of cob, length and width of grain, number of rows in the cob, and number of grains per row on the cob; COP2 = number and weight of grains per cob, weight of 100 grains, de-kernelling index and total biomass of seedling and adult plant. Vertical bars show standard error.
Seeds 03 00012 g009
Figure 10. Average percentage inbreeding depression based on crosses of mesocotyl: long × long (L × L); long × medium (L × M); long × short (L × S); medium × medium (M × M); medium × short (M × S); and short × short (S × S) for components of the yield in F1 S-S 2021 cycle. COP1 = length and width of cob, length and width of grain, number of rows in the cob, and number of grains per row on the cob; COP2 = number and weight of grains per cob, weight of 100 grains, de-kernelling index and total biomass of seedling and adult plant. Vertical bars show standard error.
Seeds 03 00012 g010
Table 1. Mean squares of general combinatory aptitude (GCA) and specific combinatory aptitude (SCA) for traits of the seedling, adult plant and dry matter of corn, F1 and F2 generations, during the S-S 2021 and 2022 cycles.
Source of VariationDegrees of FreedomGNLMLCTBWSCLCWGLGW
Repetition3F19.83 *2.39 ns321.4 *1.58 ns0.25 ns1.3 ns0.67 ns
F20.95 ns0.07 ns151.6 **0.88 ns0.10 ns0.8 ns0.65 *
Crosses44F124.79 **3.48 **983.8 **9.79 **0.53 **4.1 **1.25 **
F212.72 **3.04 **512.4 **7.48 **0.39 **3.7 **0.95 **
GCA8F178.96 **12.11 **2292.8 **30.21 **1.86 **13.7 **2.01 **
F250.43 **9.93 **932.8 **12.13 **0.99 **10.3 **1.53 **
SCA36F112.75 **1.57 **692.9 **5.25 **0.24 ns1.9 **1.08 **
F24.34 **1.51 **419.0 **6.45 **0.25 *2.3 **0.82 **
Error132F13.100.90118.21.940.171.00.30
F20.440.0518.42.220.130.70.21
Total179
C.V.%F113.723.112.911.310.29.27.4
F26.06.06.413.09.47.96.5
GCA/SCAF10.930.940.870.920.940.940.79
F20.960.930.820.790.890.900.79
GN = generation; LM and LC = length of mesocotyl and coleoptile; CL and CW = cob length and width; GL and GW = length and width of 10 grains; TBWS = total biomass dry weight of seedlings. * and ** significant at p ≤ 0.05 and 0.01, respectively; ns = non-significant.
Table 2. Mean squares of general combinatory aptitude (GCA) and specific combinatory aptitude (SCA) for adult plant of corn, F1 and F2 generations, during the S-S 2021 and 2022 cycles.
Source of VariationDegrees of FreedomGNNRCNGRNGCGYPWHGDKITBWA
Repetition3F14.22 *23.3 ns6828.8 ns224.7 ns28.9 ns2.6 ns1074.4 ns
F20.24 ns19.8 ns6545.6 ns131.4 ns12.9 ns6.5 ns898.8 ns
Crosses44F17.57 **83.4 **28,187.3 **2548.2 **198.1 **24.2 **11,916.7 **
F25.70 **64.3 **25,586.6 **1454.6 **99.1 **30.8 **5705.7 **
GCA8F110.62 **258.1 **72,071.9 **11,163.0 **835.5 **43.6 **49,394.6 **
F22.98 ns134.7 **42,369.2 **5362.9 **393.1 **52.7 **21,562.6 **
SCA36F16.89 **44.6 **18,435.2 **633.8 **56.4 **19.9 *3588.2 **
F26.30 **48.69 **21,857.2 **586.1 **33.8 **25.9 **2181.9 **
Error132F11.7120.14916.7318.717.810.7879.5
F21.9512.43469.8143.79.811.6538.0
Total179
C.V. %F19.021.822.522.718.43.915.0
F210.019.722.720.615.64.114.7
GCA/SCAF10.760.920.890.970.870.970.81
F20.490.850.790.950.950.960.80
GN = generation; NRC = number of rows in the cob; NGR = number of grains per row on the cob; NGC = number of grains per cob; GYP = grain yield per plant; WHG = weight of 100 grains; DKI % = de-kernelling index; TBWA = total biomass dry weight for adult plant. * and ** significant at p ≤ 0.05 and 0.01, respectively; ns = non-significant.
Disclaimer/Publisher’s Note: The statements, opinions and data contained in all publications are solely those of the individual author(s) and contributor(s) and not of MDPI and/or the editor(s). MDPI and/or the editor(s) disclaim responsibility for any injury to people or property resulting from any ideas, methods, instructions or products referred to in the content.

