Article

Quantitative Study of Internal Defects in Copper Iron Alloy Materials Using Computed Tomography

1
Jiangxi Key Laboratory of Advanced Copper-Based Materials, Institute of Applied Physics, Jiangxi Academy of Sciences, Nanchang 330096, China
2
School of Mechanical Engineering, Henan University of Science and Technology, Luoyang 471000, China
*
Author to whom correspondence should be addressed.
Submission received: 25 March 2025 / Revised: 21 April 2025 / Accepted: 27 April 2025 / Published: 29 April 2025

Abstract

:
Semi-continuous casting is an important method for the large-scale production of high-strength conductive copper-iron (Cu-Fe) alloys in the future. However, serious peeling defects were found on the surface of cold-rolled strips during industrial trials. Due to the multi-step complexity of the manufacturing process (from casting to final product), identifying the root cause of defect formation remains challenging. X-ray computed tomography (X-CT) was used to quantitatively characterize the pores and defects in the horizontal continuous casting Cu-Ni-Sn slab, the semi-continuous casting Cu-Fe alloy slab, and the hot-rolled slab of Cu-Fe, and the relationship between the defect characteristics and processes was analyzed. The results showed that the internal defect sphericity distribution of the Cu-Fe alloy slab after hot rolling was similar to that of the reference Cu-Ni-Sn slab. The main difference lies in the low sphericity range (<0.4). The volume of pore defects inside the Cu-Fe alloy after hot rolling was significantly larger than in the reference sample, with a 52-fold volume difference. This phenomenon may be the source of surface-peeling defects in the subsequent cold-rolling process. The occurrence of internal defects in the Cu-Fe alloy is related to both the composition characteristics and casting processes of the Cu-Fe alloy; on the other hand, it is also related to the hot-rolling process.

1. Introduction

Copper-iron (Cu-Fe) alloys are highly favored by researchers due to their excellent physical properties (including conductivity and thermal conductivity) and mechanical properties (such as high strength and wear resistance) [1,2,3,4,5]. They have enormous development potential and broad application prospects in cutting-edge fields, including 5G/6G communication, electromagnetic shielding, automotive manufacturing, biomedicine, and high-performance electronic products [6,7]. However, it was found that there were serious peeling defects on the surface of the cold-rolled strip during the industrial pilot production of the Cu-Fe alloy with a high Fe content. The occurrence of surface-peeling defects is related to internal defects, such as pores, porosity, and processing parameters. Because of the complexity of the entire process, from casting to the final product, remains challenging, with numerous steps, it is difficult to determine the root cause of defect formation. The composition of the alloys, casting methods, and solidification conditions are the main factors affecting the formation of internal defects in materials. The defects not only reduce both the mechanical and physical properties of the material, but also promote defect expansion in subsequent processing, thereby limiting the application of Cu-Fe alloy strip products in cutting-edge fields. Therefore, it is critical to conduct research on the detection and evaluation of minor defects in Cu-Fe alloy castings to control the quality of product.
The traditional analysis of peeling defects on the surface of metal plates and strips primarily relies on macroscopic and microscopic observation methods (e.g., naked eye, metallographic microscope, and electron microscope) to study the distribution patterns and morphologies of the defects. Since the research object is the surface defects on finished strips, it is difficult to accurately classify the causes of defect formation, except for cases with significant features such as containing oxide inclusions. X-ray computed tomography (X-CT) offers advantages, including high resolution and measurement accuracy, as well as the ability to achieve three-dimensional imaging. It can detect small defects, such as pores, cracks, and inclusions, and has been applied in the porosity and defect analysis of formed alloys, such as precision casting, laser cladding printing, and composite material preparation [8,9,10]. However, its application has not yet been extended to analyzing the defect characteristics in semi-continuous castings of copper alloys. Considering that two-dimensional local observation alone cannot provide defect characteristics or their root causes, applying X-CT to acquire 3D internal defect characteristics proves essential for establishing causal relationships between defect generation, solidification processes, and processing parameters. Therefore, the study obtains three-dimensional reconstruction data of different copper alloy samples on the production line, based on X-CT, analyzes the defect characteristics in the samples, and investigates their process-related correlations.

2. Experimental Process and Methods

2.1. Materials and Processes

Figure 1 shows the schematic diagram of the factory’s production and processing. The feedstock thickness for the cold-rolling mill in the factory must be controlled below 16 mm. At present, 16 mm thick Cu-Ni-Sn alloy slabs are produced by horizontal continuous casting. The slab can be directly cold rolled after milling, achieving a final product thickness of 0.16 mm with good quality and no surface defects. The Cu-Fe alloys with high Fe content are in situ deformation composite materials, and the mechanical properties of the material mainly depend on the improvement in fibrosis of the Fe phase after deformation [11,12]. Therefore, the production of a Cu-Fe alloy strip with high Fe content requires initial casting of thick slabs through a typical metal processing route: vertical semi-continuous casting → hot rolling → cold rolling. Cast slab specification: 420 mm × 160 mm. The cast slab is first hot-rolled to a thickness of 16 mm (consistent with the thickness of the horizontal continuous casting product), and then sent to the cold-rolling process for initial rolling, intermediate rolling, and finishing rolling, ultimately reaching a product thickness of 0.20 mm. Although cold-rolling deformation parameters are comparable, surface defects exclusively emerge in Cu-Fe alloy strips during cold rolling. Therefore, using cold-rolled slab specifications as reference, we selected the Cu-Ni-Sn alloy slab produced by horizontal continuous casting as the control sample to compare and analyze the internal defect evolution in semi-continuous-cast versus hot-rolled Cu-Fe alloys. Figure 2 shows the positions of different samples and sample sizes. The sample size is 25 mm (X) × 25 mm (Y) × 15 mm (Z), where X–Z plane represents the cross-sectional and Z-axis denotes the thickness direction. Samples were extracted from the edge and center of the slab using the wire-cut electrical discharge machine according to the sampling position shown in Figure 2. The chemical composition of the alloy is shown in Table 1.

2.2. CT Testing

An X-Ray computed tomography scanner (CI6M3201, CITIC Imaging Intelligent Technology, Luoyang, China) was used to perform CT scanning on the sample. The principle of the equipment can be referred to in the literature [13]. The detector pixel size was 200 μm, the focal size was 5.0 μm, the detection voltage was 290 kV, and the detection current was 150 μA. The sample was placed in the center of the test bench, close to the radiation source, with a magnification of M20 and a projection number of 1000. The system software is used for data reconstruction, and the image quality is improved by using rotation center correction and beam-hardening correction to obtain low-noise-level 3D images.
In order to study the internal defects of the sample, the sample’s tomographic images were preprocessed to carry out the reconstructed data and statistical analysis. Firstly, the image was binarized using the interactive threshold segmentation function, and defects with fewer than 3 pixels in the binarization are closed; secondly, the 3-dimensional volumetric porosity, defect sphericity, and size of the sample were calculated to use the analysis; finally, the formation reason for the defects was analyzed in conjunction with casting processes.

2.3. Numerical Simulation of Semi-Continuous Casting Mold

A numerical simulation model for the semi-continuous casting mold of Cu-10Fe alloy slabs was developed using a continuous model during the research process. The mathematical model formulation follows methodologies described in References [14,15]. The key physical parameters of the Cu-10Fe alloy, including solid–liquid phase temperature, density, viscosity, and specific heat capacity, are calculated and listed in Table 2. The process parameters implemented in the model are summarized in Table 3.

3. Results and Analysis

3.1. Surface Defects on the Strip

Figure 3 shows the surface-peeling morphology of the finish-rolled Cu-10Fe alloy with a thickness of 0.2 mm. Figure 3a is characterized by pits and burrs in typical peeling defects, while Figure 3b reveals incipient surface peeling manifested as microcracks. Three Cu-Fe alloys with Fe contents of 5 wt%, 10 wt%, and 15 wt% (Cu-5Fe, Cu-10Fe, and Cu-15Fe) were produced on the same production line. The surface defect density measured 11, 18, and 35 defects per m2, respectively, demonstrating a positive correlation between peeling defect frequency and iron content.

3.2. Characteristics of Internal Defects

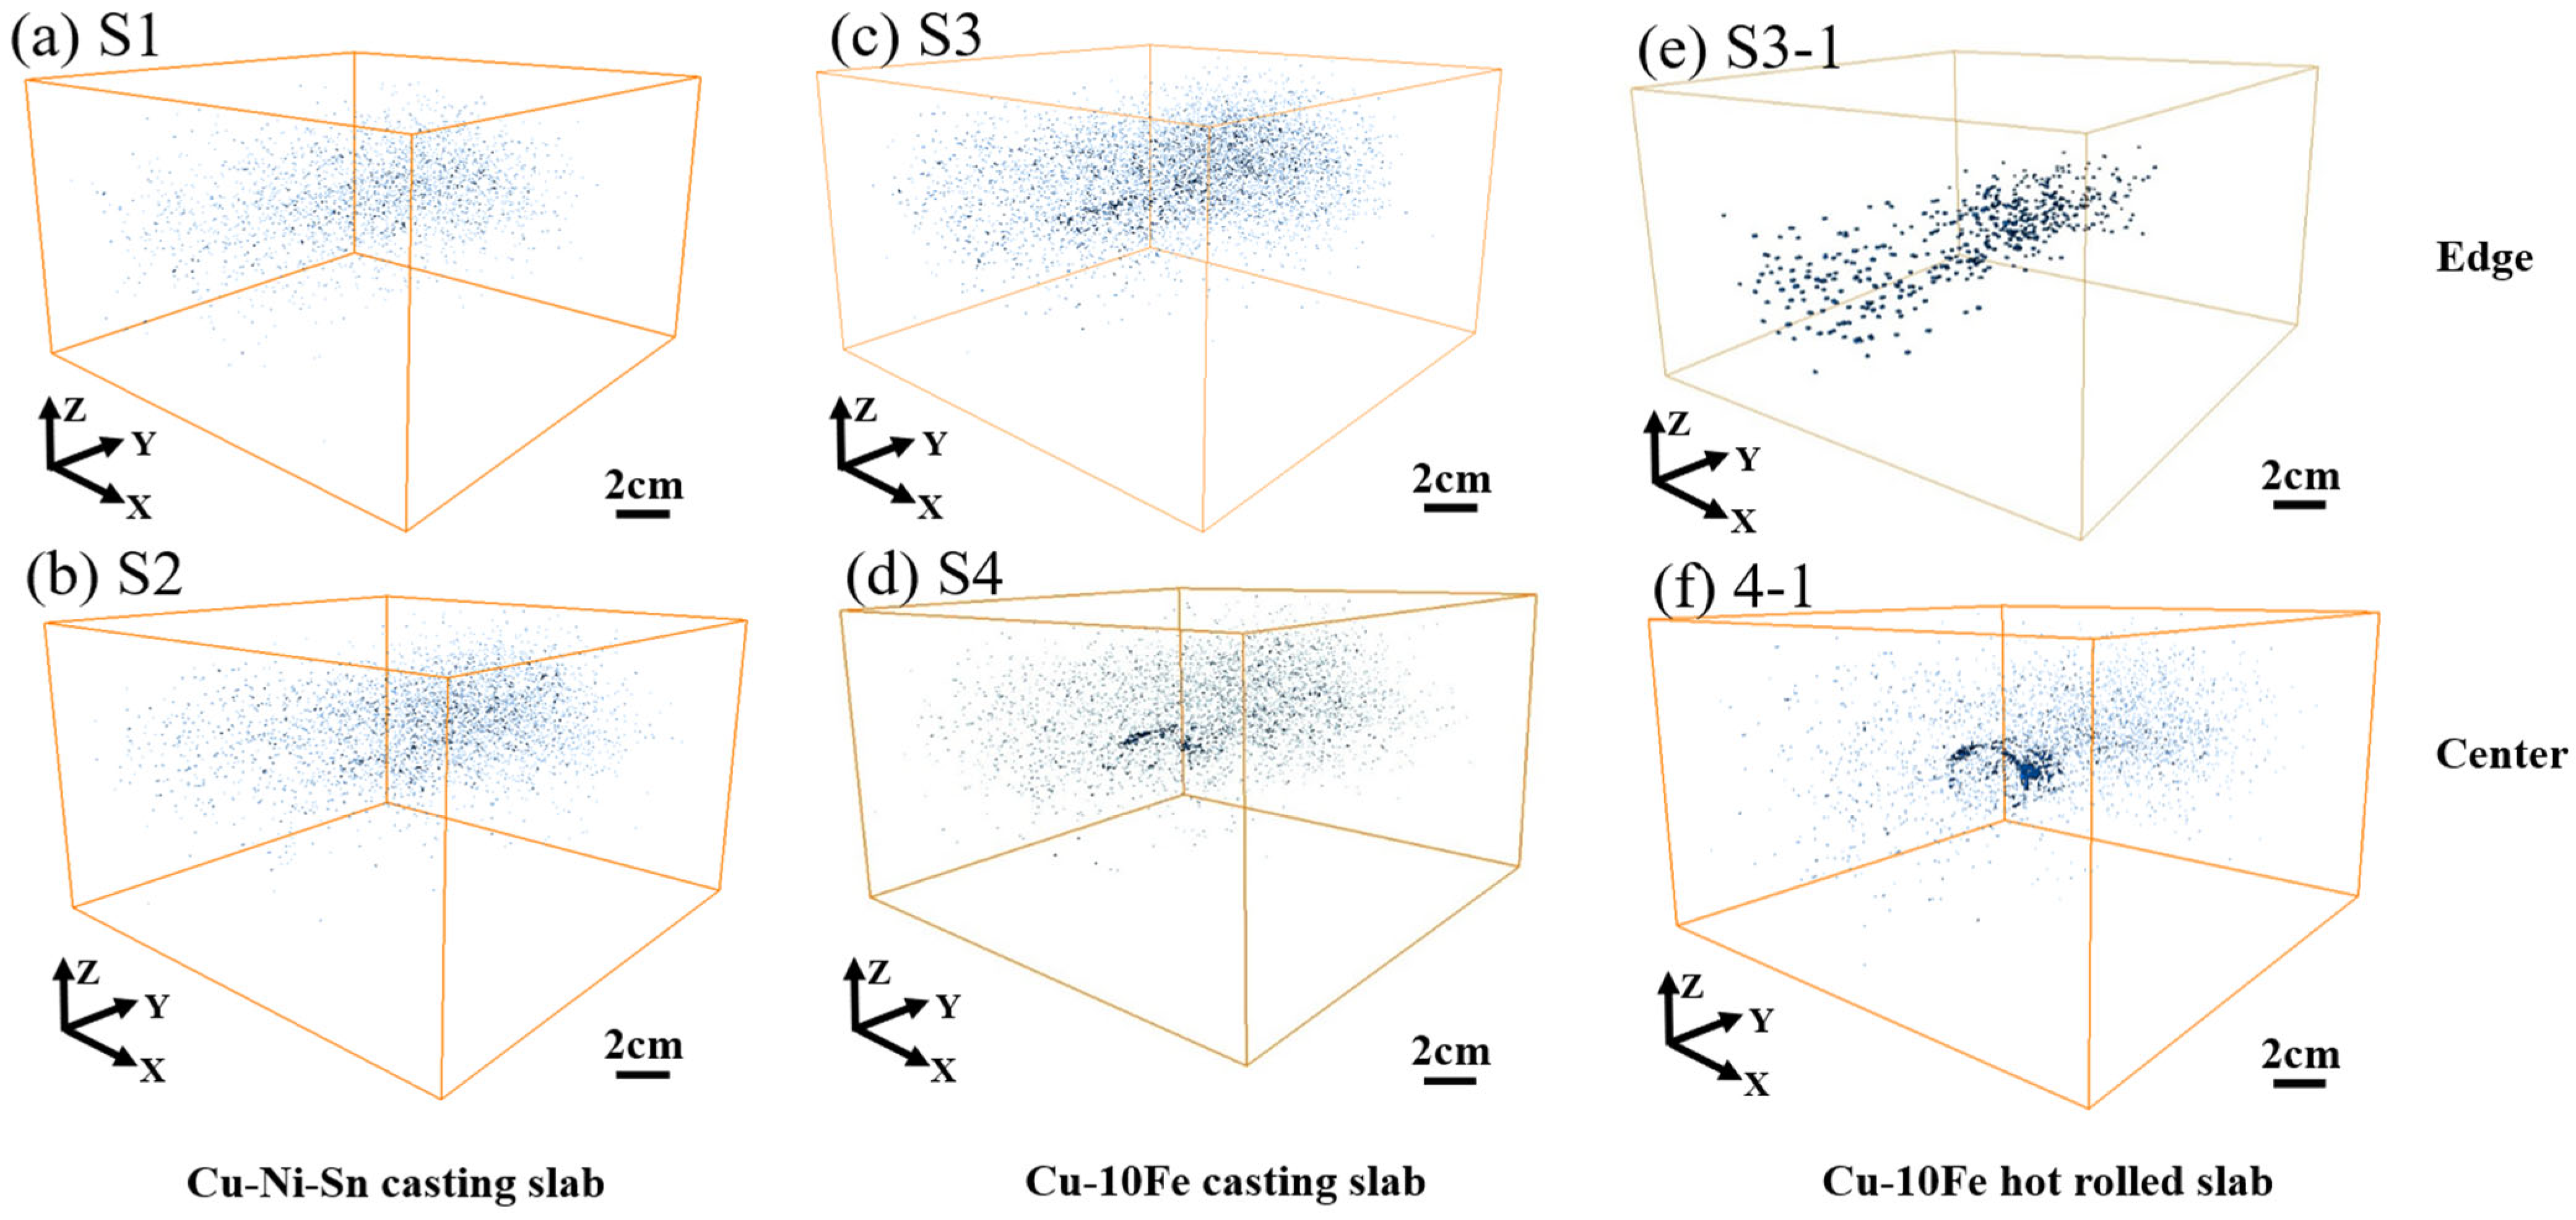
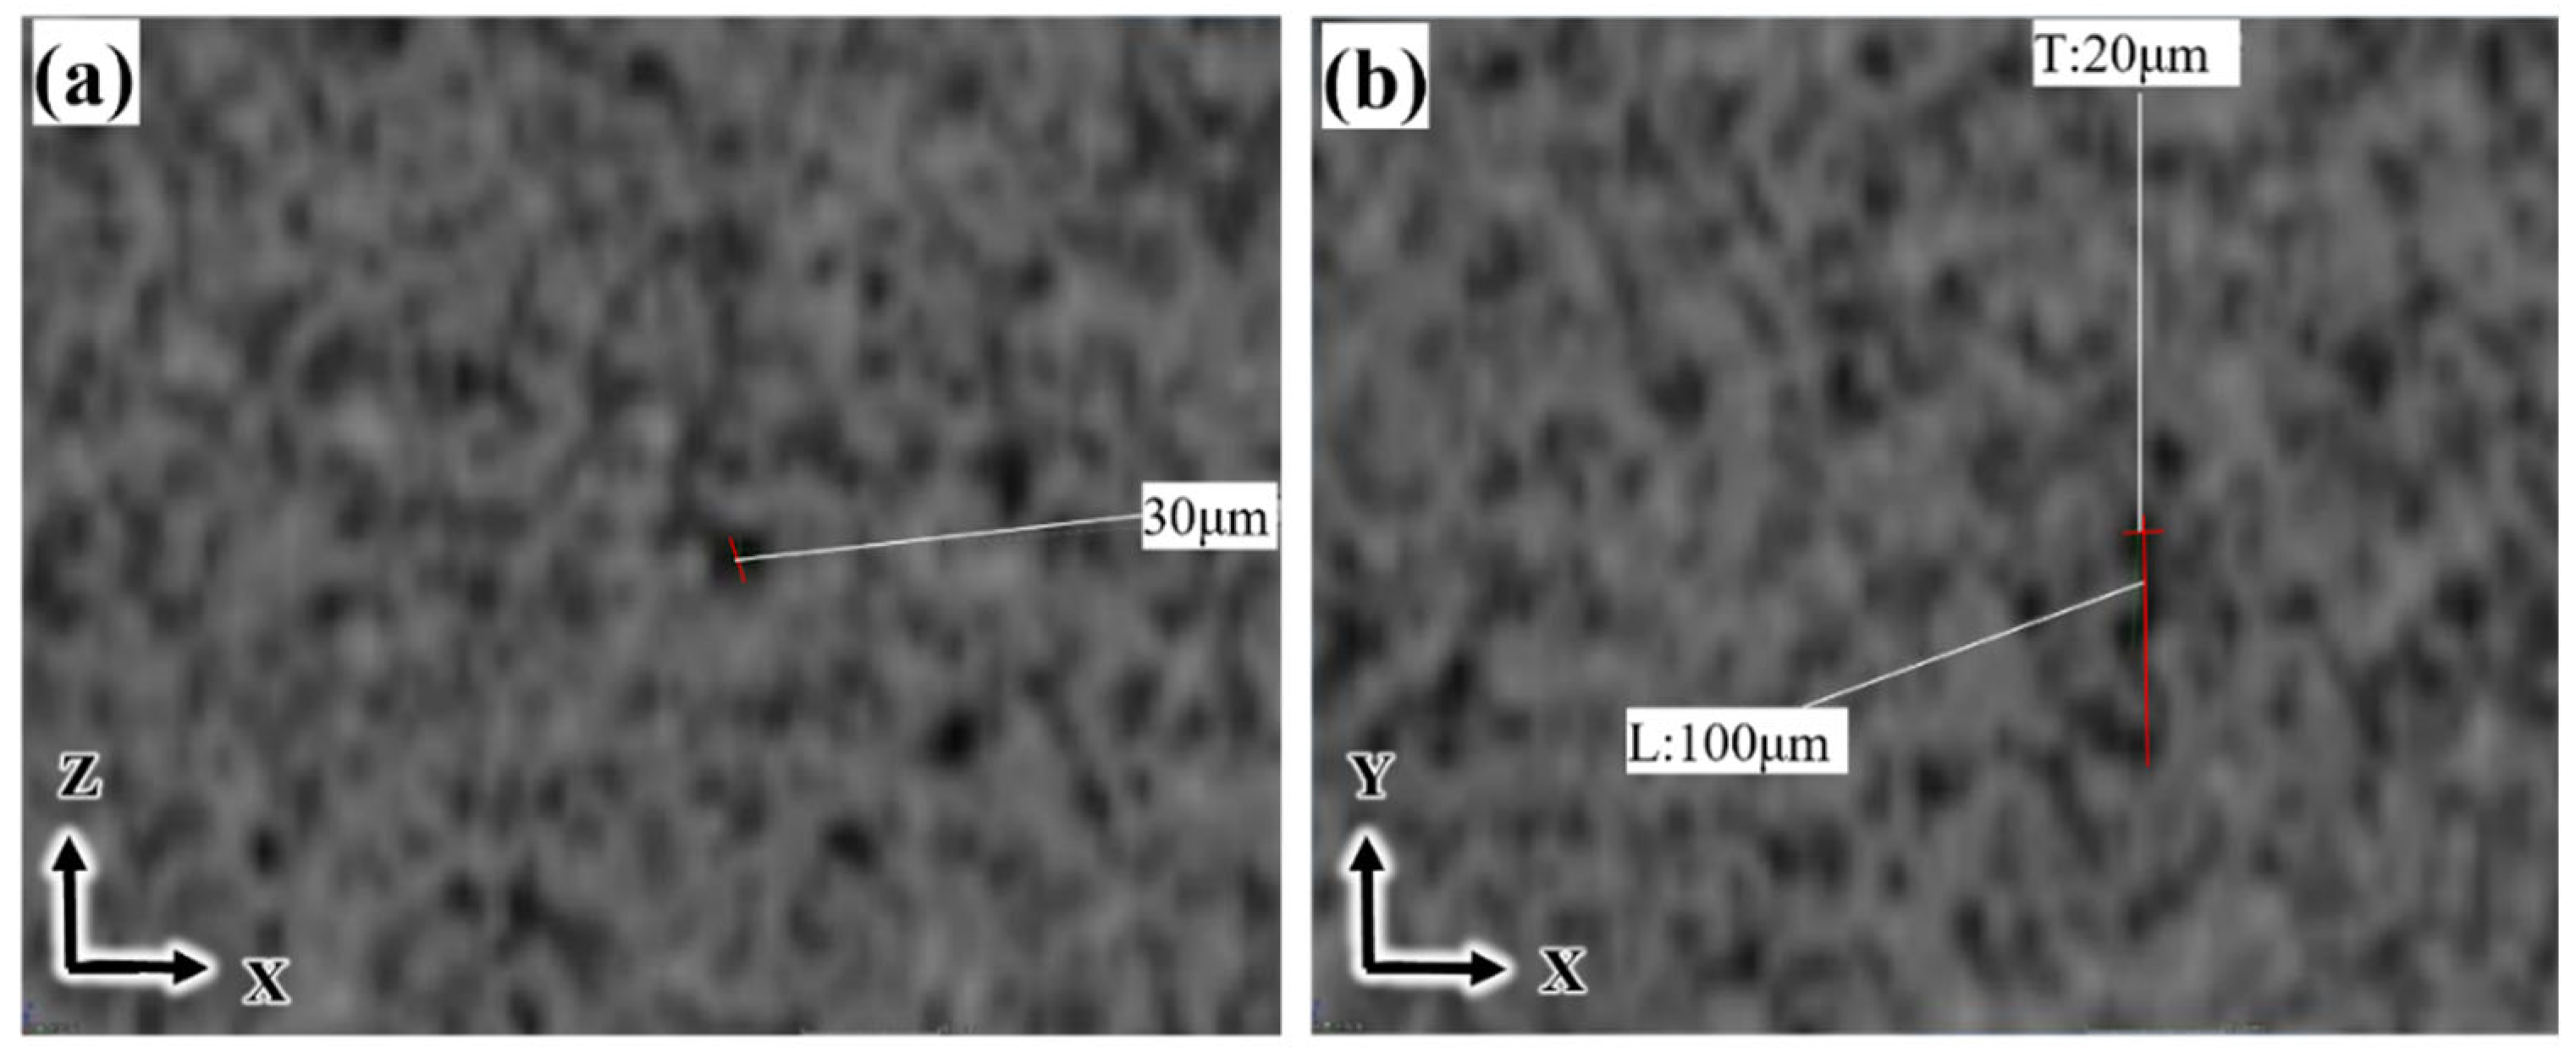
Figure 4 shows the 3-D defect distribution (color-coded) in the reconstructed data of Cu-Ni-Sn alloy castings, Cu-Fe alloy castings, and hot-rolled slab samples. Figure 5 shows a typical CT slice of some defects in the sample. As shown in the figure, all samples exhibit defects yet show significant variations in the number of defects between them. Samples S1 and S2 are Cu-Ni-Sn as-cast samples produced by the horizontal continuous casting. The internal defects are mainly millimeter point-like defects, resulting in defect-free surfaces after milling and direct cold rolling. In contrast, the number of defects in samples S3 and S4 is significantly higher than that in samples S1 and S2, with irregular and large-sized holes appearing. The number and size of internal defects in samples S3-1 and S4-1 of samples S3 and S4 have significantly increased with the hot rolling, and the size of internal irregular holes has further increased, showing linear elongation. likely due to defect propagation during unidirectional hot-rolling plastic deformation. Figure 5 shows a typical 2-D CT slice of the defect in the sample. The same curved crack defect appears in different shapes from a 2-D perspective.

3.3. Quantitative Analysis of Defects

Figure 6 shows the variation in 3-D volumetric porosity in the sample. According to Figure 4, the porosity formed in different samples varies greatly, ranging from approximately 0.0042% to 0.0298% (with a 600% increase in the maximum observed porosity). The internal defect porosity of the Cu-Ni-Sn alloy (S1 and S2) samples range from 0.0042% to 0.0058%, the internal defect porosity of Cu-Fe alloy casting samples (S3 and S4) ranges from 0.0073% to 0.0090%, and the internal defect porosity of hot-rolled samples ranges from 0.0214% to 0.0298%. The porosity of the hot-rolled sample is higher than that of the as-cast state, indicating the formation of new internal defects such as microcracks during the hot-rolling process. Usually, only the larger sized pores are prone to causing defects during deformation in the material. Therefore, statistical analysis is conducted on the first 200 pores with larger volume sizes in the sample. Figure 7 shows the volume distribution of internal defects in the alloy. According to the statistical results, the pore-size distribution of samples S1 and S2 ranges from 0 to 2.66 × 106 μm3, and the proportion of pores with a frequency within 106 μm3 is greater than 90%. The proportion of pores with a volume greater than 106 μm3 increases in samples S3 and S4 of the Cu-Fe alloy castings, and pores appear with a volume size greater than 107 μm3. After hot rolling, pores with a volume size greater than 108 μm3 appear in samples S3-1 and S4-1. It is known that the internal defects of the Cu-Fe alloy semi-continuous cast slab and the rolled sample are greater than those of the comparative Cu-Ni-Sn alloy, and the volume of large pores in the sample increases after hot rolling, indicating that the difference in porosity between the two alloy samples before cold rolling may be related to surface defects in the product. The solidification characteristics, casting methods, and processing techniques of alloys are directly related to the formation and changes in internal defects. Controlling the original internal defects of alloy castings and reducing the internal defects of materials during hot-rolling processes to make their defect levels comparable to those of horizontal continuous casting Cu-Ni-Sn alloy castings is the key to improving the surface quality of processed strip materials.
The geometric shape of the defects is an important parameter for classifying defect types and evolution. Gas pores formed during solidification typically exhibit spherical/ellipsoidal morphology due to gas evolution. The shape factor S can be used to represent the sphericity of pore geometry, according to Chuang’s definition [16] as follows:
S = π 1 / 3 ( 6 V ) 2 / 3 A
where V represents the volume of the defect and A represents the internal surface area of the defect. Therefore, the value range of S is [0,1], and when S = 1; this indicates that the defect is close to a sphere without sharp edges or corners. At this location, small spherical defects have difficulty in generating stress concentration, so they are less affected by mechanical properties during deformation processing and may not cause cracks due to the presence of sharp edges or corners [17]. Figure 8 is a histogram of the sphericity of defects in different samples. The sphericity of the defects within the control samples of S1 and S2 is displayed in a distribution range of 0.2–1.0, with nearly spherical defects (between 0.8 and 1.0) exceeding 35%. The sphericity of defects sample also falls within the distribution range of 0.2 to 1.0 in the Cu-Fe alloy. However, the cumulative frequency of nearly spherical defects (between 0.8 and 1.0) is significantly reduced compared to the as-cast state after hot rolling and is lower than that of the Cu-Ni-Sn alloy sample. During the hot-rolling process, the plastic deformation of the structure changes the shape of some pores, resulting in a reduction in the number of near-spherical defects. Figure 9 shows the relationship between sphericity and volume size. The sphericity of the spherical hole (yellow hole) in Figure 9d is 0.91, and the size is 4.15 × 106 μm3; The irregular hole (dark blue hole) has a sphericity of 0.50 and a size of 1.12 × 107 μm3. As can be seen from the figure, compared with the control sample, the main difference between the Cu-Fe alloy and the control sample is the low sphericity range (<0.4), with similar spherical size distribution of internal defects. The volume size of the pore defects in the Cu-Fe alloy is significantly larger following the hot rolling process, with a maximum volume difference of 52 times.
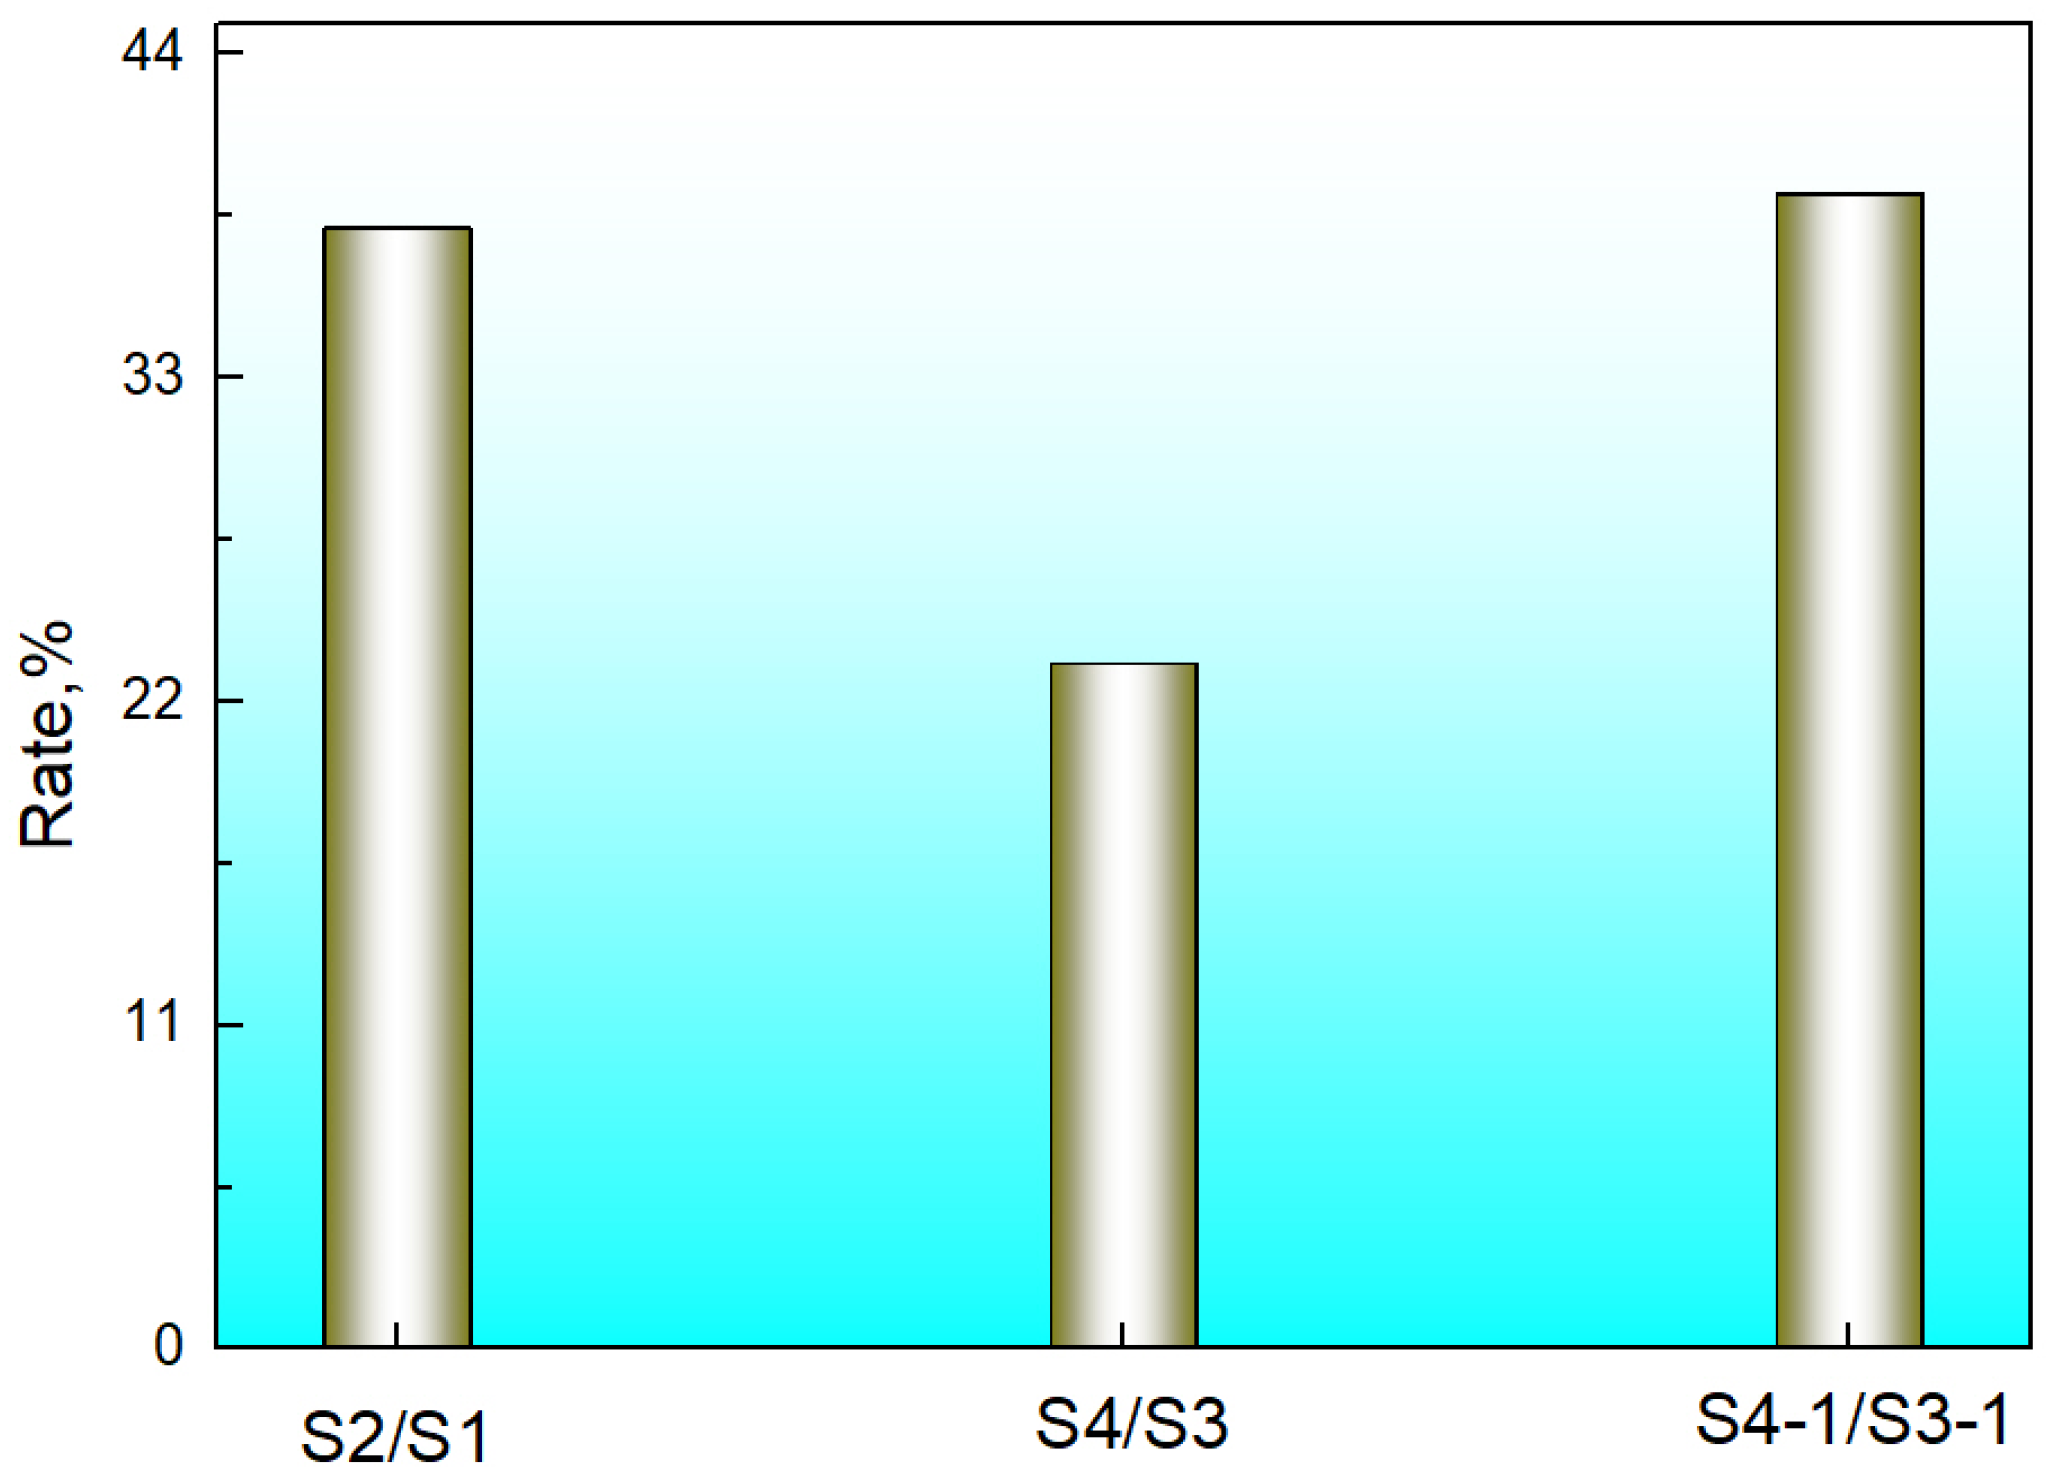
In addition, it is worth noting that when comparing both the horizontally cast Cu-Ni-Sn slabs and the Cu-Fe alloy slabs, as well as the hot-rolled slabs, the porosity in the center position of the sample is greater than that at the edges. Figure 10 shows these different variations. As shown in the figure, there is a significant variation in the number of internal defects along the vertical casting direction at the edges and center of the slab. Usually, there are more porosity defects in the center of castings than at the edges. This is related to the different solidification conditions at the edges and center during the solidification process. This also indicates that the results obtained from CT data analysis are consistent with the actual solidification phenomenon. During the solidification process, the edge region is subject to the cooling effect of the mold, resulting in a fast-cooling rate and relatively early solidification. Due to the fast cooling and solidification, the gas precipitates earlier at the edge and is relatively concentrated, making it easier to form pores; in contrast, the central region experiences a longer solidification time and a broader time span for gas precipitation. While some gases may gradually precipitate and float out during the solidification process, other gases may not escape in time and remain within the casting slab, forming pores in the central region. The solidification sequence leads to different solidification environments in the center and edges, which in turn affects the location and quantity of pore formation [18]. Furthermore, it is important to highlight that in the cast Cu-Fe alloy after hot rolling, the defect porosity in the center of the sample is significantly higher than that at the edge. This indicates a substantial increase in defect changes in the center of the sample during the hot-rolling process. These findings demonstrate that the hot-rolling process has a significant impact on defects.

3.4. Relationship Between Defect Formation and Process

As shown in Figure 7, the internal defect sizes in Cu-Fe alloy castings and samples after hot rolling are larger than those in Cu-Ni-Sn alloy castings. Table 4 presents the statistical results of the top five largest pores in different samples. The results showed that the maximum size defect inside the as-cast Cu-Fe alloy was one order of magnitude higher than that of the as-cast Cu-Ni-Sn sample. The maximum size defect inside the Cu-Fe alloy significantly increased after the hot rolling, and the volume of abnormally large non-spherical defects reached 1.4 × 108 μm3. The change is related to material deformation during the hot-rolling process.
Usually, factors such as rolling temperature, rolling force, and uneven deformation can cause an increase in internal defects in materials. Uneven heating leads to temperature gradients inside the material. In the subsequent rolling process, areas with higher temperatures have lower deformation resistance, while areas with lower temperatures have higher deformation resistance. This results in uneven material deformation and increases the internal defects. An excessively high final rolling temperature can cause the grain size of the material to grow and reduce its plasticity. At the same time, during the rolling process, the deformation resistance of the material at high temperatures decreases, which can easily lead to the expansion of internal defects. If the final rolling temperature is too low, it will increase the deformation resistance of the material, increase the rolling force, and cause significant stress concentration inside the material, thereby increasing internal defects [19,20]. When the rolling force is too high, a large stress will be generated inside the material. When the stress exceeds the yield strength of the material, it will cause microcracks to propagate inside the material, thereby increasing internal defects. Additionally, excessive rolling force may also lead to increased elastic deformation of the rolling mill rolls, resulting in an uneven distribution of contact stress and further exacerbating the uneven deformation inside the material, leading to the generation and expansion of internal defects [21].
The maximum size defect inside the Cu-Fe alloy after hot rolling is two orders of magnitude higher than that of the Cu-Ni-Sn as-cast sample, which may be the source of surface defects during subsequent cold-rolling processes. Therefore, controlling the solidification pore defect size and hot-rolling process to reduce internal defects is one of the important ways to improve product surface defects in Cu-Fe alloy.
The Cu-Ni-Sn as-cast samples are produced by horizontal continuous casting, and the pore defects may primarily originate from gas evolution in the slab [22]. Table 5 lists the H and O contents in the alloy samples. It is evident that the H and O contents in Cu-Ni-Sn alloy are low. Due to the horizontal continuous casting slab’s thinness (only 16 mm), the solidification temperature range, cooling conditions, and solidification time at the edge and center of the slab casting are similar. Consequently, the solute transfer changes during the solidification process are not significant. This results in the gas precipitation type having a small pore size and high sphericity. The difference in pore analysis results between the edge and the center of slab is small. As shown in Figure 7a,b and Figure 8a,b, the volume size distribution and sphericity distribution exhibit similarities.

3.5. Relationship Between Defect Formation and Alloy

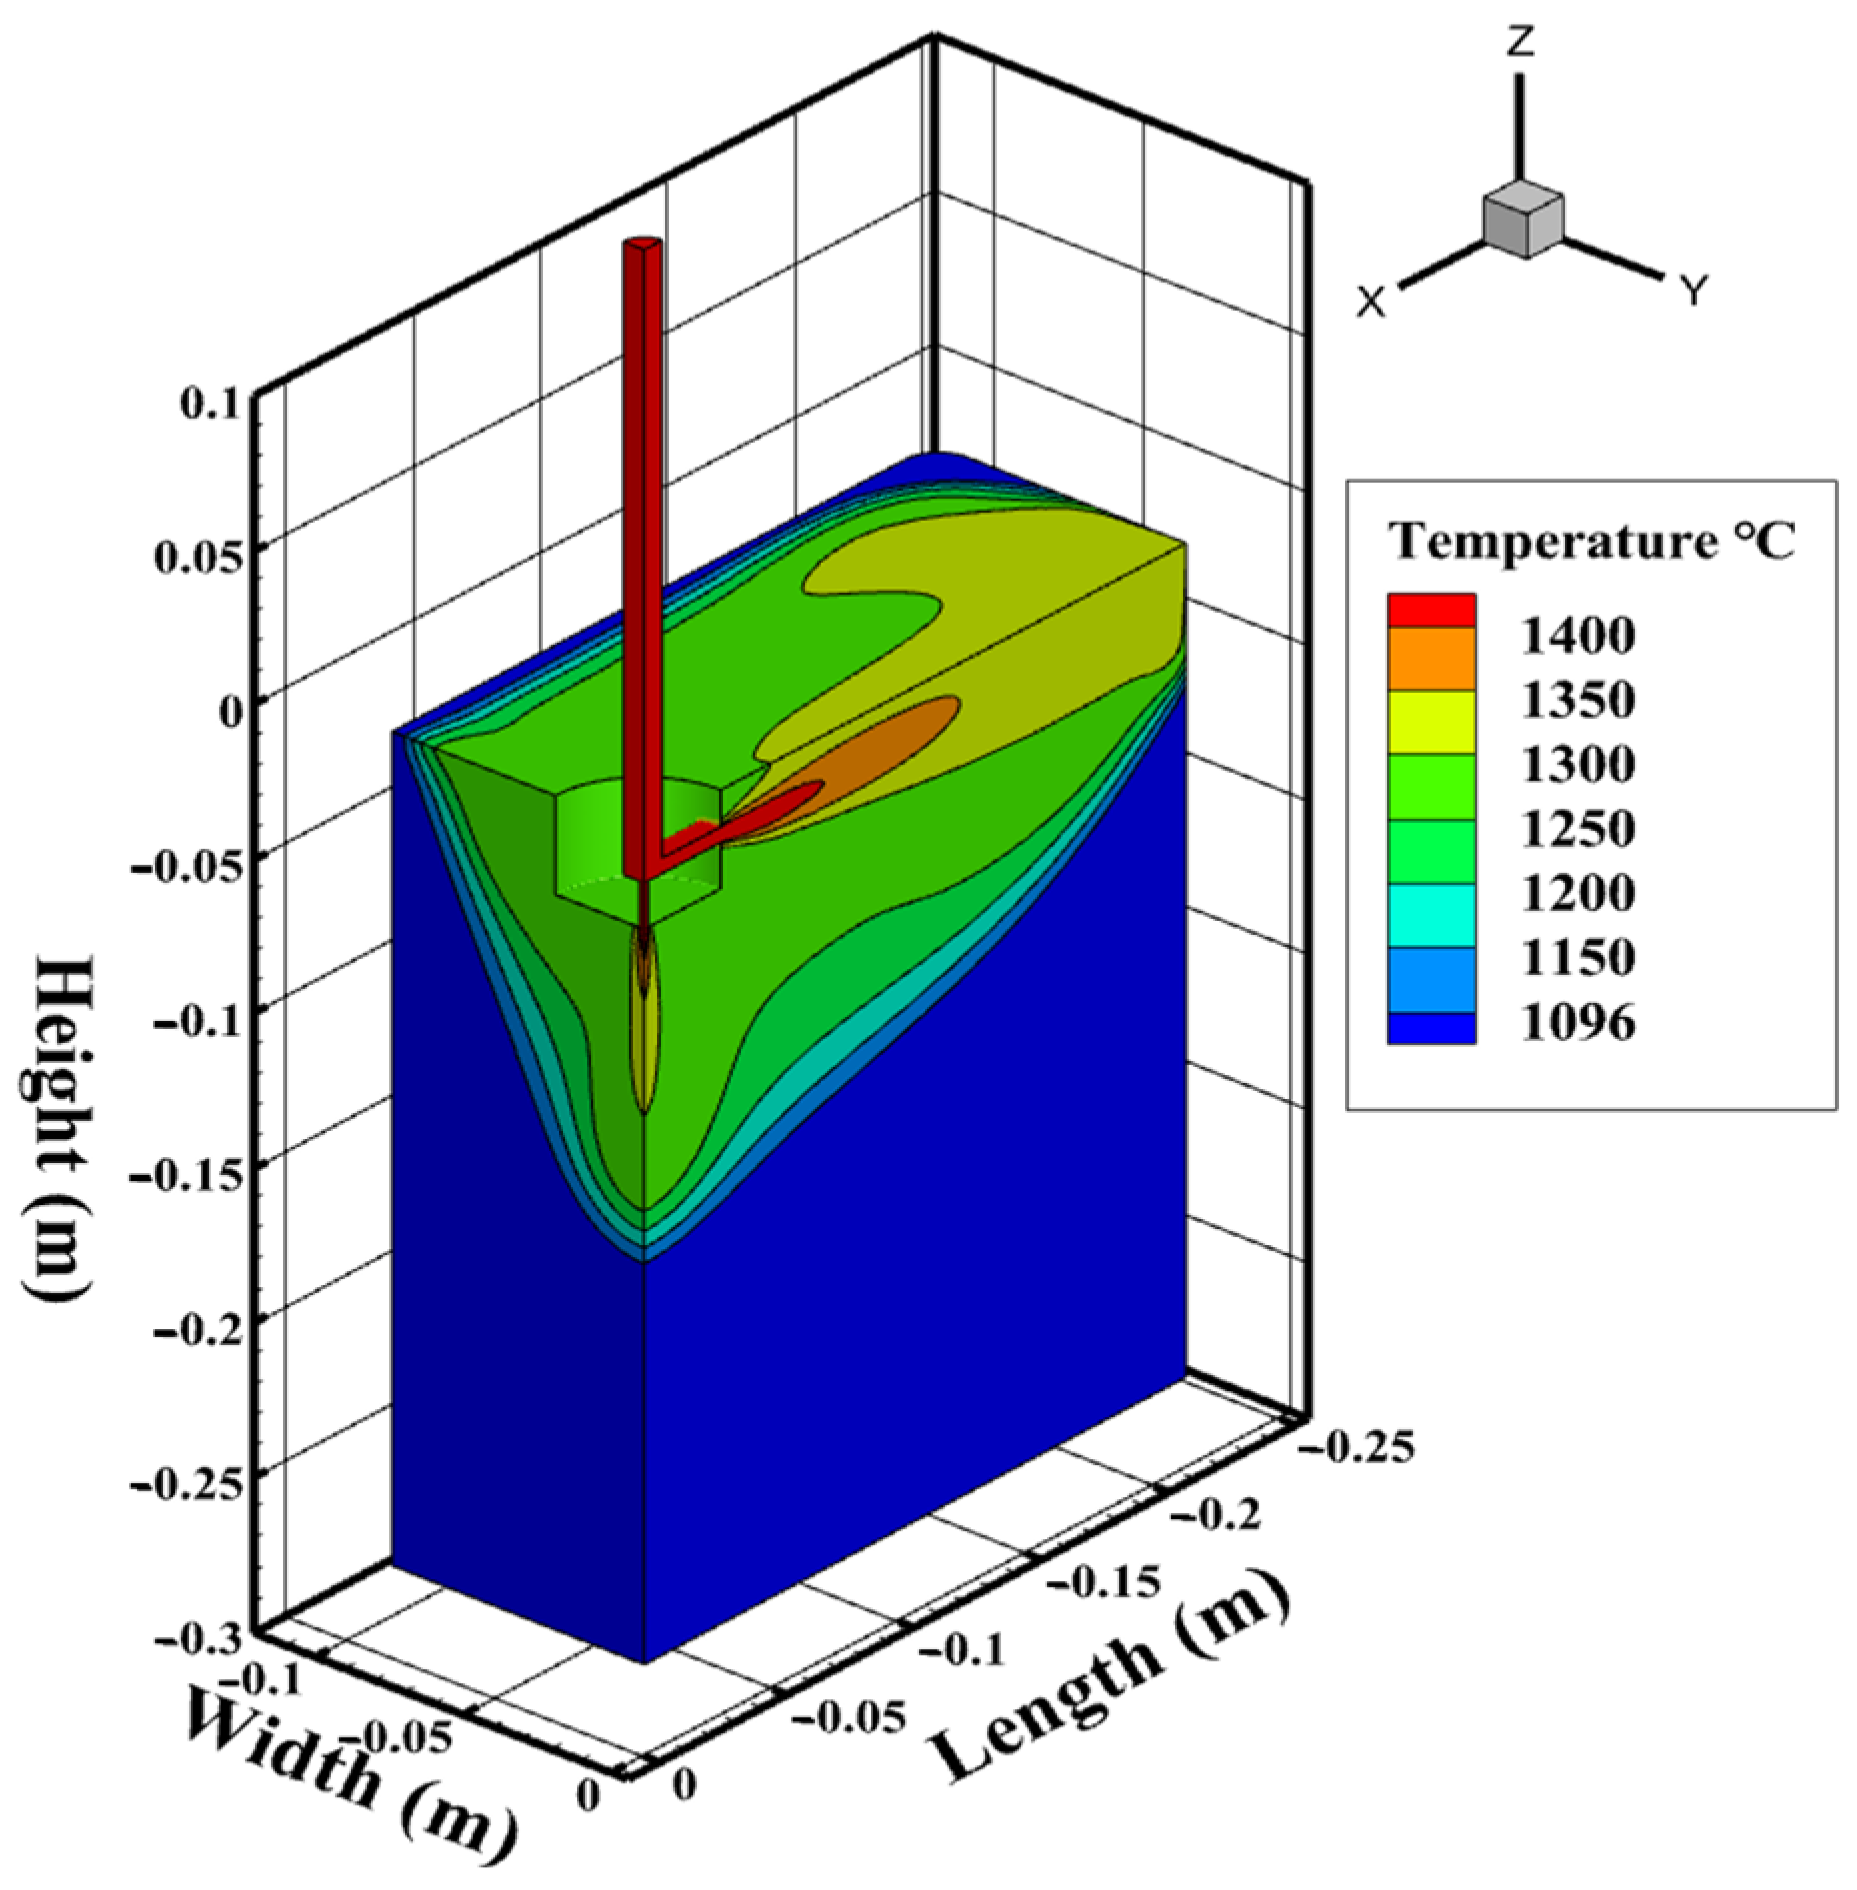
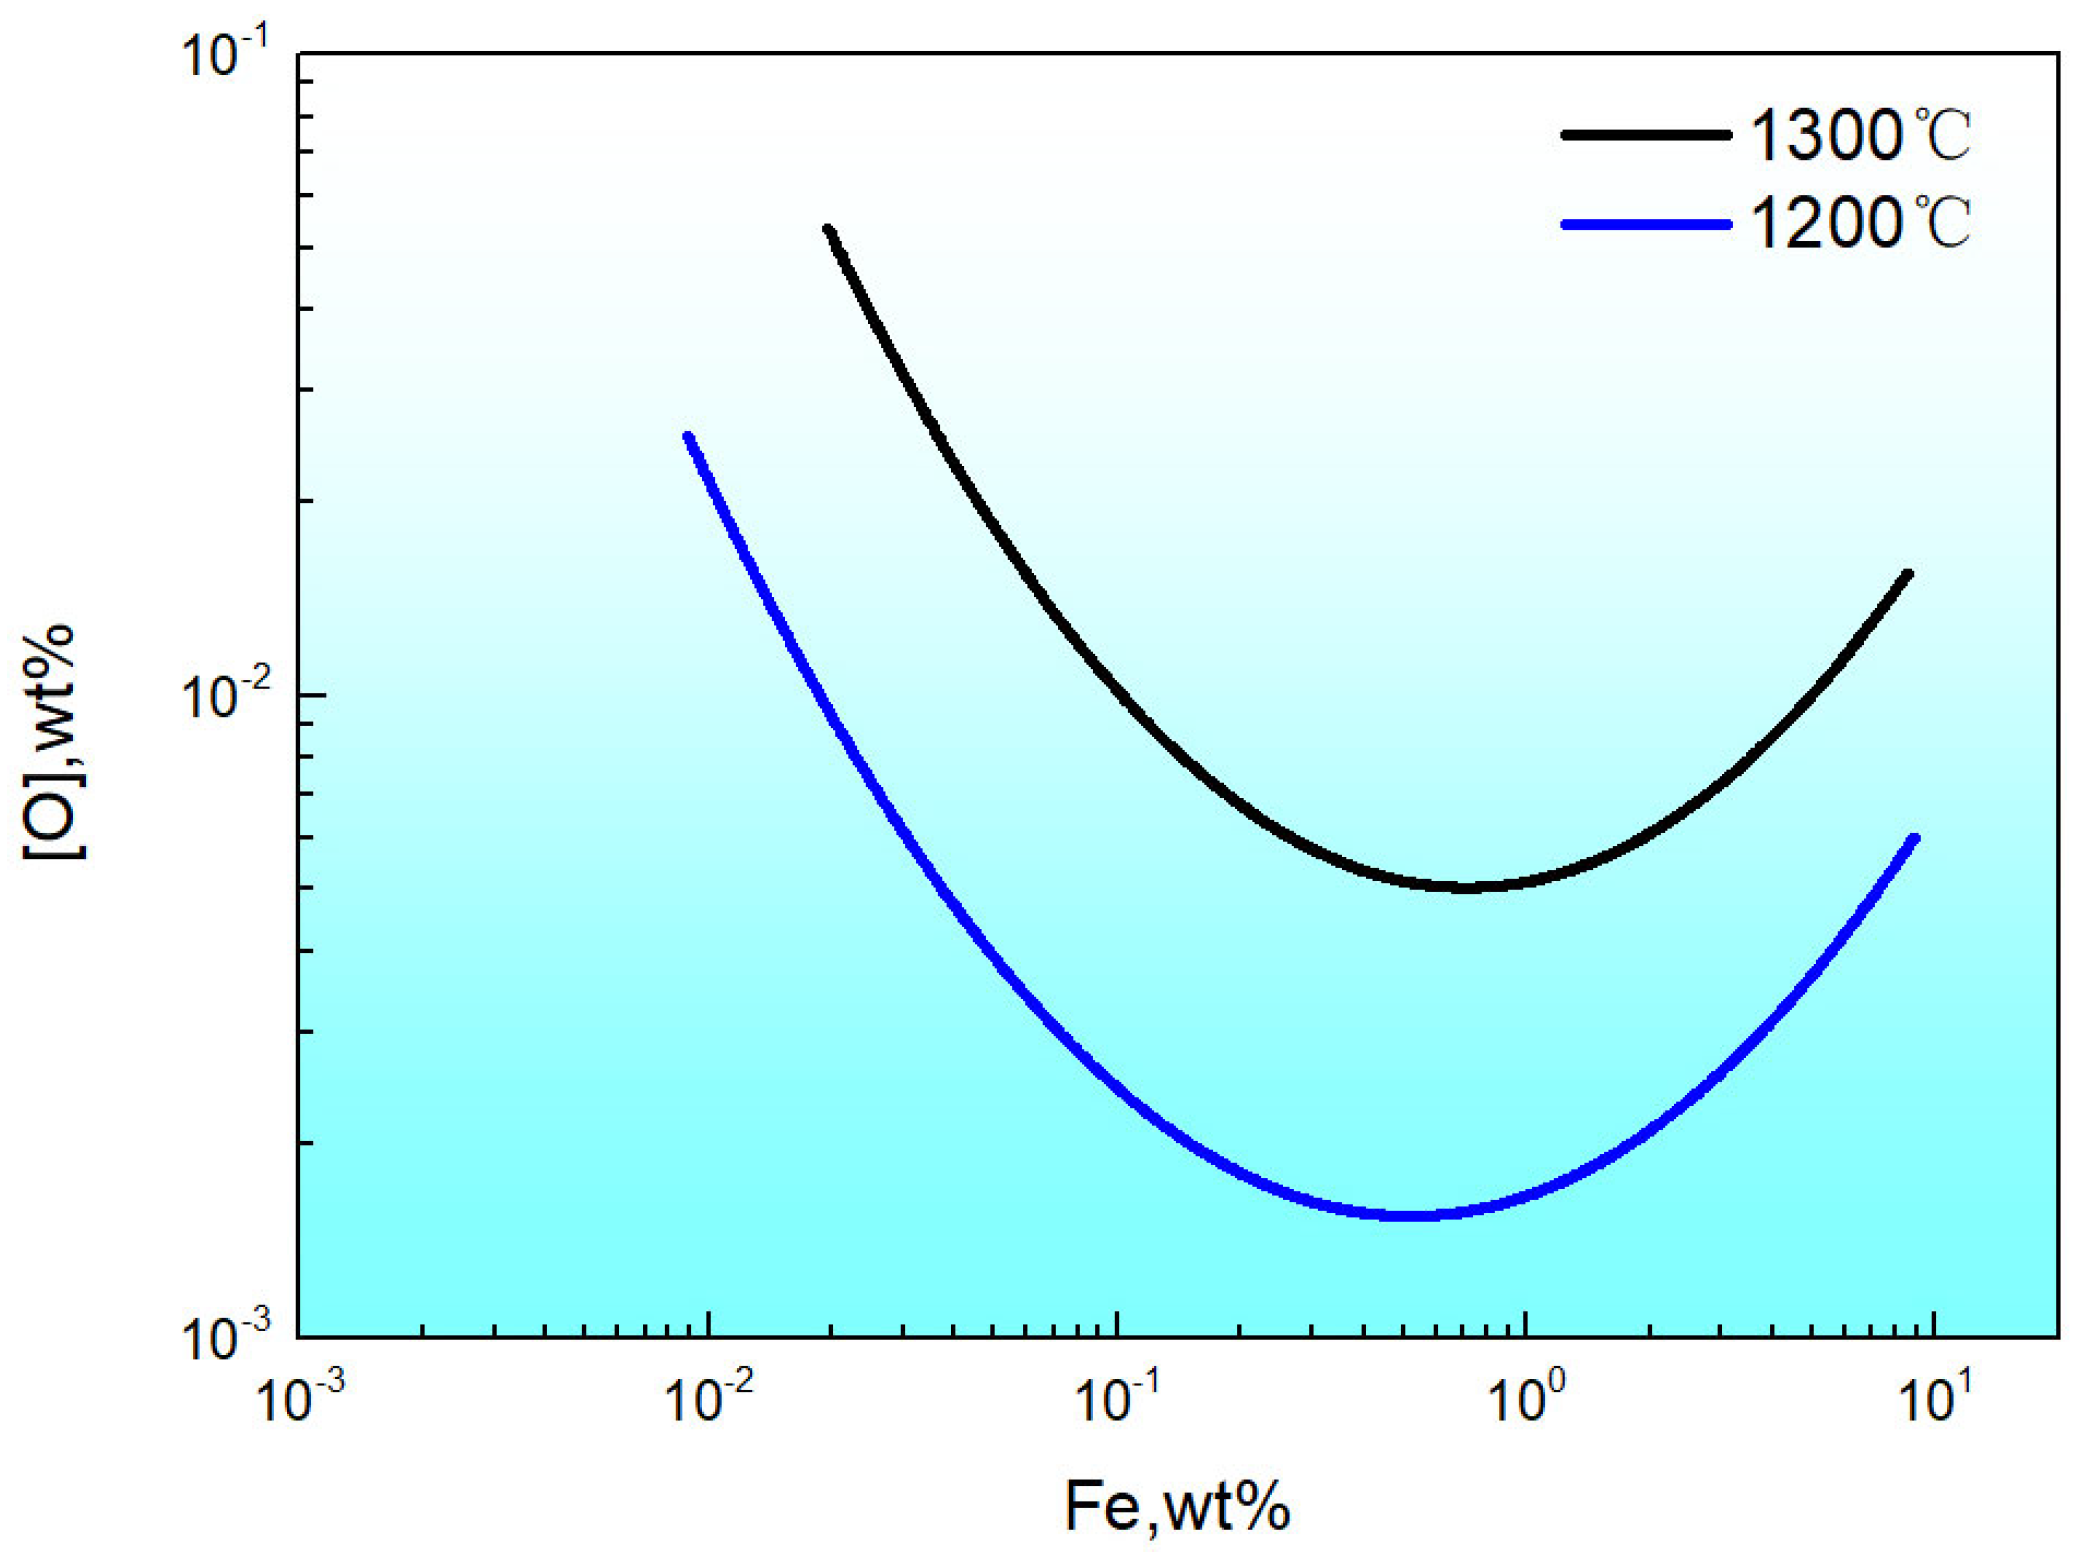
The Cu-10Fe alloy was produced through vertical semi-continuous casting. Figure 11 shows the solidification temperature field in the mold during vertical semi-continuous casting of the Cu-10Fe alloy. The temperature field of the mold exhibits non-uniformity and obvious boundary effects. The mold wall serves as the primary cooling surface for the solidification of the copper liquid; the temperature is low at the edge of the mold and a solidified shell forms first to contain the copper liquid. Since most of the heat transfer during solidification must be transmitted outward through the shell, heat transfer in thick slabs is limited by the cooling interface area, leading to slower cooling and longer solidification times. Additionally, the solidification process is influenced by the flow field in the water inlet, causing slower solidification in the central area and increasing the likelihood of gas precipitation and coalescence. As shown in Figure 8c,e and Table 4, the porosity defect volume is larger at the center of the slab, and the sphericity distribution is more dispersed. Furthermore, due to the high Fe content in the Cu-10Fe alloy and the higher solubility of O in molten iron compared to molten copper [23,24], the dissolved O content increases in the Cu-Fe alloy liquid. This explains the higher O content in the Cu-10Fe alloy. Using the minimum solubility method for oxide–metal equilibrium [25], the equilibrium curve of Fe and O in the copper melt can be calculated at corresponding temperatures. Figure 12 shows the Fe–O equilibrium relationship in the copper melt. It shows that the increase in Fe content alters the equilibrium solubility of O in the Cu-Fe alloy.

4. Conclusions

The internal defects in the horizontal continuous casting Cu-Ni-Sn slab, the semi-continuous casting Cu-Fe alloy slab, and the hot-rolled slab of Cu-Fe alloy were studied based on X-ray computed tomography. The main conclusions are as follows:
(1)
The internal defects in the horizontal continuous cast Cu-Ni-Sn slab are primarily small point-like; there are mainly point-like defects in the semi-continuous casting Cu-Fe alloy slab, with irregular and large-sized pores apparent. When the Cu-Fe alloy slab undergoes hot rolling, the size of the pore defects increases.
(2)
Compared with the as-cast Cu-Ni-Sn slab, the Cu-Fe alloy slab through hot rolling has a similar spherical distribution of internal defects, with the main difference being the low spherical degree (<0.4). The volume of internal porosity defects in the hot-rolled Cu-Fe alloy slab is significantly larger, exhibiting a 52-fold difference. This phenomenon may be a source of the surface defects during subsequent cold-rolling processes.
(3)
The solubility of O in molten iron is higher than that in molten copper, which may lead to an increase in the dissolved O content in Cu-Fe alloys with high Fe content; Compared with the horizontal continuous casting, the solidification rate is slower in the semi-continuous casting, resulting in an increase in the internal porosity volume (tissue porosity) within the slab. Controlling the size of the porosity defects in the Cu-Fe alloy slab and the hot-rolling process to reduce internal defects are crucial measures for improving product surface quality.

Author Contributions

Conceptualization, J.G.; methodology, J.G.; software, J.G.; formal analysis, Q.H. and K.H.; investigation, Q.H. and K.H.; data curation, Q.H. and K.H.; writing—original draft preparation, J.G.; writing—review and editing, Q.H. and K.H.; project administration, J.G.; funding acquisition, J.G. All authors have read and agreed to the published version of the manuscript.

Funding

This work was financially supported by the Jiangxi Provincial Natural Science Foundation (Grant No. 20242BAB25253).

Data Availability Statement

Data will be made available on reasonable request.

Acknowledgments

The authors would like to acknowledge the Luoyang CITIC Imaging Intelligent Technology, China.

Conflicts of Interest

The authors declare no conflicts of interest.

References

  1. Wang, M.; Jiang, Y.; Li, Z.; Xiao, Z.; Lei, Q. Microstructure Evolution and Deformation Behaviour of Cu-10 wt%Fe Alloy during Cold Rolling. Mater. Sci. Eng. A 2021, 801, 140379. [Google Scholar] [CrossRef]
  2. Yuan, D.; Xiao, X.; Luo, X.; Wang, H.; Han, B.; Liu, B.; Yang, B. Effect of Multi-Stage Thermomechanical Treatment on Fe Phase Evolution and Properties of Cu-6.5 Fe-0.3 Mg Alloy. Mater. Charact. 2022, 185, 111707. [Google Scholar] [CrossRef]
  3. Liu, S.; Jie, J.; Guo, Z.; Yue, S.; Li, T. A comprehensive investigation on microstructure and magnetic properties of immiscible Cu-Fe alloys with variation of Fe content. Mater. Chem. Phys. 2019, 238, 121909. [Google Scholar]
  4. Zhang, P.; Lei, Q.; Yuan, X.; Sheng, X.; Jiang, D.; Li, Y.; Li, Z. Microstructure and mechanical properties of a Cu-Fe-Nb alloy with a high product of the strength times the elongation. Mater. Today Commun. 2020, 25, 101353. [Google Scholar] [CrossRef]
  5. Guo, J.; Hu, Q.; Zou, J.; Lu, D. Effect of Cooling Rate on Morphology and Distribution of Fe Phase in Solidification Structure of Cu-20Fe Alloy. Metall. Res. Technol. 2023, 120, 312. [Google Scholar] [CrossRef]
  6. Wen, J.; Yan, C.; Wang, W.; Guo, C.; Zhou, B.; Liang, J.; Sun, J.; Wang, Q.; Li, X. Microstructure and Properties of Cu-5Fe Alloy Thin Strip and Foil. Spec. Cast. Nonferrous Alloys 2022, 42, 1012–1015. [Google Scholar]
  7. Zhang, P.; Yu, Z.; Wang, Y.; Zhou, L.; Zhang, Z. Research Progress on Strengthening Mechanism of Copper-Iron Alloys with High Iron Concentration. Chin. J. Nonferrous Met. 2023, 33, 2496–2520. [Google Scholar]
  8. Zhang, K.; Meng, Q.; Zhang, X.; Qu, Z.; He, R. Quantitative Characterization of Defects in Stereolithographic Additive Manufactured Ceramic Using X-ray Computed Tomography. J. Mater. Sci. Technol. 2022, 118, 144–157. [Google Scholar] [CrossRef]
  9. Qian, Q.; Zhang, X.; Yang, Z.; Sheng, Z.; Xiao, J. Intelligent Identification of Micro Components and Defects of 3D Braided C/C Composites Based on Deep Learning of X-ray CT Images. Acta Mater. Compos. Sin. 2024, 41, 3536–3543. [Google Scholar]
  10. Nicoletto, G.; Konečná, R.; Fintova, S. Characterization of Microshrinkage Casting Defects of Al–Si Alloys by X-ray Computed Tomography and Metallography. Int. J. Fatigue 2012, 41, 39–46. [Google Scholar] [CrossRef]
  11. Sun, I.H. Copper-Iron Filamentary Microcomposites. Adv. Eng. Mater. 2010, 3, 475–479. [Google Scholar]
  12. Sun, B.; Gao, H.; Wang, J.; Shu, D. Strength of Deformation Processed Cu-Fe-Ag In Situ Composites. Mater. Lett. 2007, 61, 1002–1006. [Google Scholar] [CrossRef]
  13. Maire, E.; Withers, P.J. Quantitative X-ray Tomography. Int. Mater. Rev. 2014, 59, 1–43. [Google Scholar] [CrossRef]
  14. Zheng, X.; Wang, Y.; Jin, J. Numerical Simulation of Temperature Field of Semi-Continuous Casting of Slab in EMC. Acta Metall. Sin. 1999, 861–864. [Google Scholar]
  15. Luo, H.J.; Jie, W.Q.; Gao, Z.M.; Zheng, Y.J. Numerical Simulation of the Influence of Casting Parameters on Macroscopic Segregation in 2024 Aluminum Alloy Semi Continuous Casting Process. Rare Met. Mater. Eng. 2018, 25, 1007–1015. [Google Scholar]
  16. Chuang, C.; Singh, D.; Kenesei, P.; Almer, J.; Hryn, J.; Huff, R. 3D Quantitative Analysis of Graphite Morphology in High Strength Cast Iron by High-Energy X-ray Tomography. Scr. Mater. 2015, 106, 5–8. [Google Scholar] [CrossRef]
  17. Diener, S.; Franchin, G.; Achilles, N.; Kuhnt, T.; Rössler, F.; Katsikis, N.; Colombo, P. X-Ray Microtomography Investigations on the Residual Pore Structure in Silicon Nitride Bars Manufactured by Direct Ink Writing Using Different Printing Patterns. Open Ceram 2021, 5, 100042. [Google Scholar] [CrossRef]
  18. Zhang, L.; Wang, S.; Liu, J.; Song, H.; Liu, Y. Research on Horizontal Continuous Casting Process of Copper Strip and Casting Slab Defects. Nonferrous Met. Mater. Eng. 2024, 45, 70–75. [Google Scholar]
  19. Liu, H.Q.; Yang, Q.; Wang, X.C.; Wang, L.S. Wear Contour Prediction Model and Application of the Work Roll in Hot Wide Strip Mill. Steel Roll 2018, 35, 45–49. [Google Scholar]
  20. Sonboli, A.; Serajzadeh, S. A Model for Evaluating Thermal Mechanical Stresses Within Work-Rolls in Hot-Strip Rolling. J. Eng. Math. 2012, 72, 73–85. [Google Scholar] [CrossRef]
  21. Ding, J.G.; Li, J.; Zhang, K.; Sun, J. Investigation on Contact Pressure of Backup Roll with Parabolic Chamfer Curve and Intelligent Modeling of Plate Crown in Plate Rolling Process. Int. J. Adv. Manuf. Technol. 2023, 127, 5633–5650. [Google Scholar] [CrossRef]
  22. Liu, Y.; Zhao, J.; Xiong, S.; Shu, L.; Sun, J. Effect of Production Process of JCC-6M-T Alloy on Microstructure and Properties. Copp. Eng. 2022, 4, 16–20. [Google Scholar]
  23. Luo, Y.; Li, H.; Yang, H.; Yang, Z.; Li, C.; Liu, S.; Chen, Q.; Xu, W.; Zhang, W.; Tan, X. Critical Role of Dissolved Oxygen and Iron–Copper Synergy in Dual-Metal/Char Catalyst Systems. Environ. Sci. Nano 2024, 11, 2091–2102. [Google Scholar] [CrossRef]
  24. Samarin, A.M.; Fedotov, V.P. On the Solubility of Oxygen in Liquid Nickel and in Iron-Nickel Alloys. Izvest. Akad. Nauk S.S.S.R. Otdel. Tekh. Nauk 1956, 222–223. [Google Scholar]
  25. Chen, Y.; Kuxman, U. A New Method of Calculation for the Solubility Minimum in Oxide-Metal Equilibria. J. Cent. South Inst. Min. Metall. 1990, 21, 479–484. [Google Scholar]
Figure 1. Schematic diagram of production and processing in the factory.
Alloys 04 00008 g001
Figure 2. Sampling location, number, and actual sample (a) Sampling location and number of the sample; (b) sample and size.
Alloys 04 00008 g002
Figure 3. Surface-peeling defect morphology of Cu-10Fe alloy strip. (a) Typical peeling defects; (b) incipient microcracks.
Alloys 04 00008 g003
Figure 4. Three-dimensional distribution of defects (Colored dots are defects): (a,b) Cu-Ni-Sn castings; (c,d) Cu-Fe castings; (e,f) hot-rolled casting samples.
Alloys 04 00008 g004
Figure 5. A typical defect in a 2-D CT slice in the sample: (a) X-Z plane; (b) X-Y plane.
Alloys 04 00008 g005
Figure 6. Three-dimensional volumetric porosity in different samples.
Alloys 04 00008 g006
Figure 7. Internal pore volume distribution: (a) S1; (b) S2; (c) S3; (d) S3-1; (e) S4; (f) S4-1.
Alloys 04 00008 g007
Figure 8. Distribution of spherical porosity in the sample: (a,b) the edges and center of Cu-Ni-Sn casting slab; (c,d) the center and edges of the Cu-10Fe casting slab; (e,f) the center and edges of the Cu-10Fe after hot-rolling the slab.
Alloys 04 00008 g008
Figure 9. Shape and pore size distribution: (a,b) the edges and center of Cu-Ni-Sn casting slab; (c,d) the center and edges of the Cu-10Fe casting slab; (e,f) the center and edges of the Cu-10Fe after hot-rolling the slab.
Alloys 04 00008 g009
Figure 10. Ratio of porosity of the central position to the edge in samples.
Alloys 04 00008 g010
Figure 11. Schematic diagram of solidification temperature in the mold.
Alloys 04 00008 g011
Figure 12. Fe–O equilibrium relationship in the copper melt.
Alloys 04 00008 g012
Table 1. Chemical composition of alloy, wt%.
ElementSnNiFePCu
Cu-Ni-Sn alloy1.650.720.00130.065Bal
Cu-Fe alloy9.850.027Bal
Table 2. Physical properties of Cu-10Fe alloy liquid.
PropertiesValue
Liquidus/°C1270
Solidus/°C1096
Latent heat/KJ/kg212.2
Density/kg/m37559.0
Liquid viscosity/Pa·s4.3 × 10−3
Table 3. Casting process parameters.
Copper Alloy CompositionCu-10Fe
Mold size/mm × mm420 × 160
Mold height/mm270
Casting speed/mm∙min−145
Casting temperature/°C1450
Table 4. Statistics of the top five largest pores in different samples, μm3.
SerialS1S2S3S4S3-1S4-1
11.5 × 1062.7 × 1066.9 × 1061.9 × 1073.8 × 1071.4 × 108
21.2 × 1061.5 × 1063.1 × 1061.2 × 1071.5 × 1072.6 × 107
39.7 × 1051.2 × 1063.1 × 1061.2 × 1073.2 × 1061.9 × 107
48.8 × 1051.2 × 1062.2 × 1061.1 × 1072.4 × 1061.0 × 107
58.4 × 1059.1 × 1051.9 × 1061.1 × 1072.2 × 1066.7 × 106
Table 5. The H and O content in the alloy samples.
AlloyH (ppm)O (ppm)
Cu-Ni-Sn<564
Cu-10Fe<1220
Disclaimer/Publisher’s Note: The statements, opinions and data contained in all publications are solely those of the individual author(s) and contributor(s) and not of MDPI and/or the editor(s). MDPI and/or the editor(s) disclaim responsibility for any injury to people or property resulting from any ideas, methods, instructions or products referred to in the content.