
On the Microstructure and Properties of Complex Concentrated bcc Solid Solution and Tetragonal D8m M5Si3 Silicide Phases in a Refractory Complex Concentrated Alloy


Abstract
1. Introduction
2. Experimental
3. Results
3.1. Microstructure
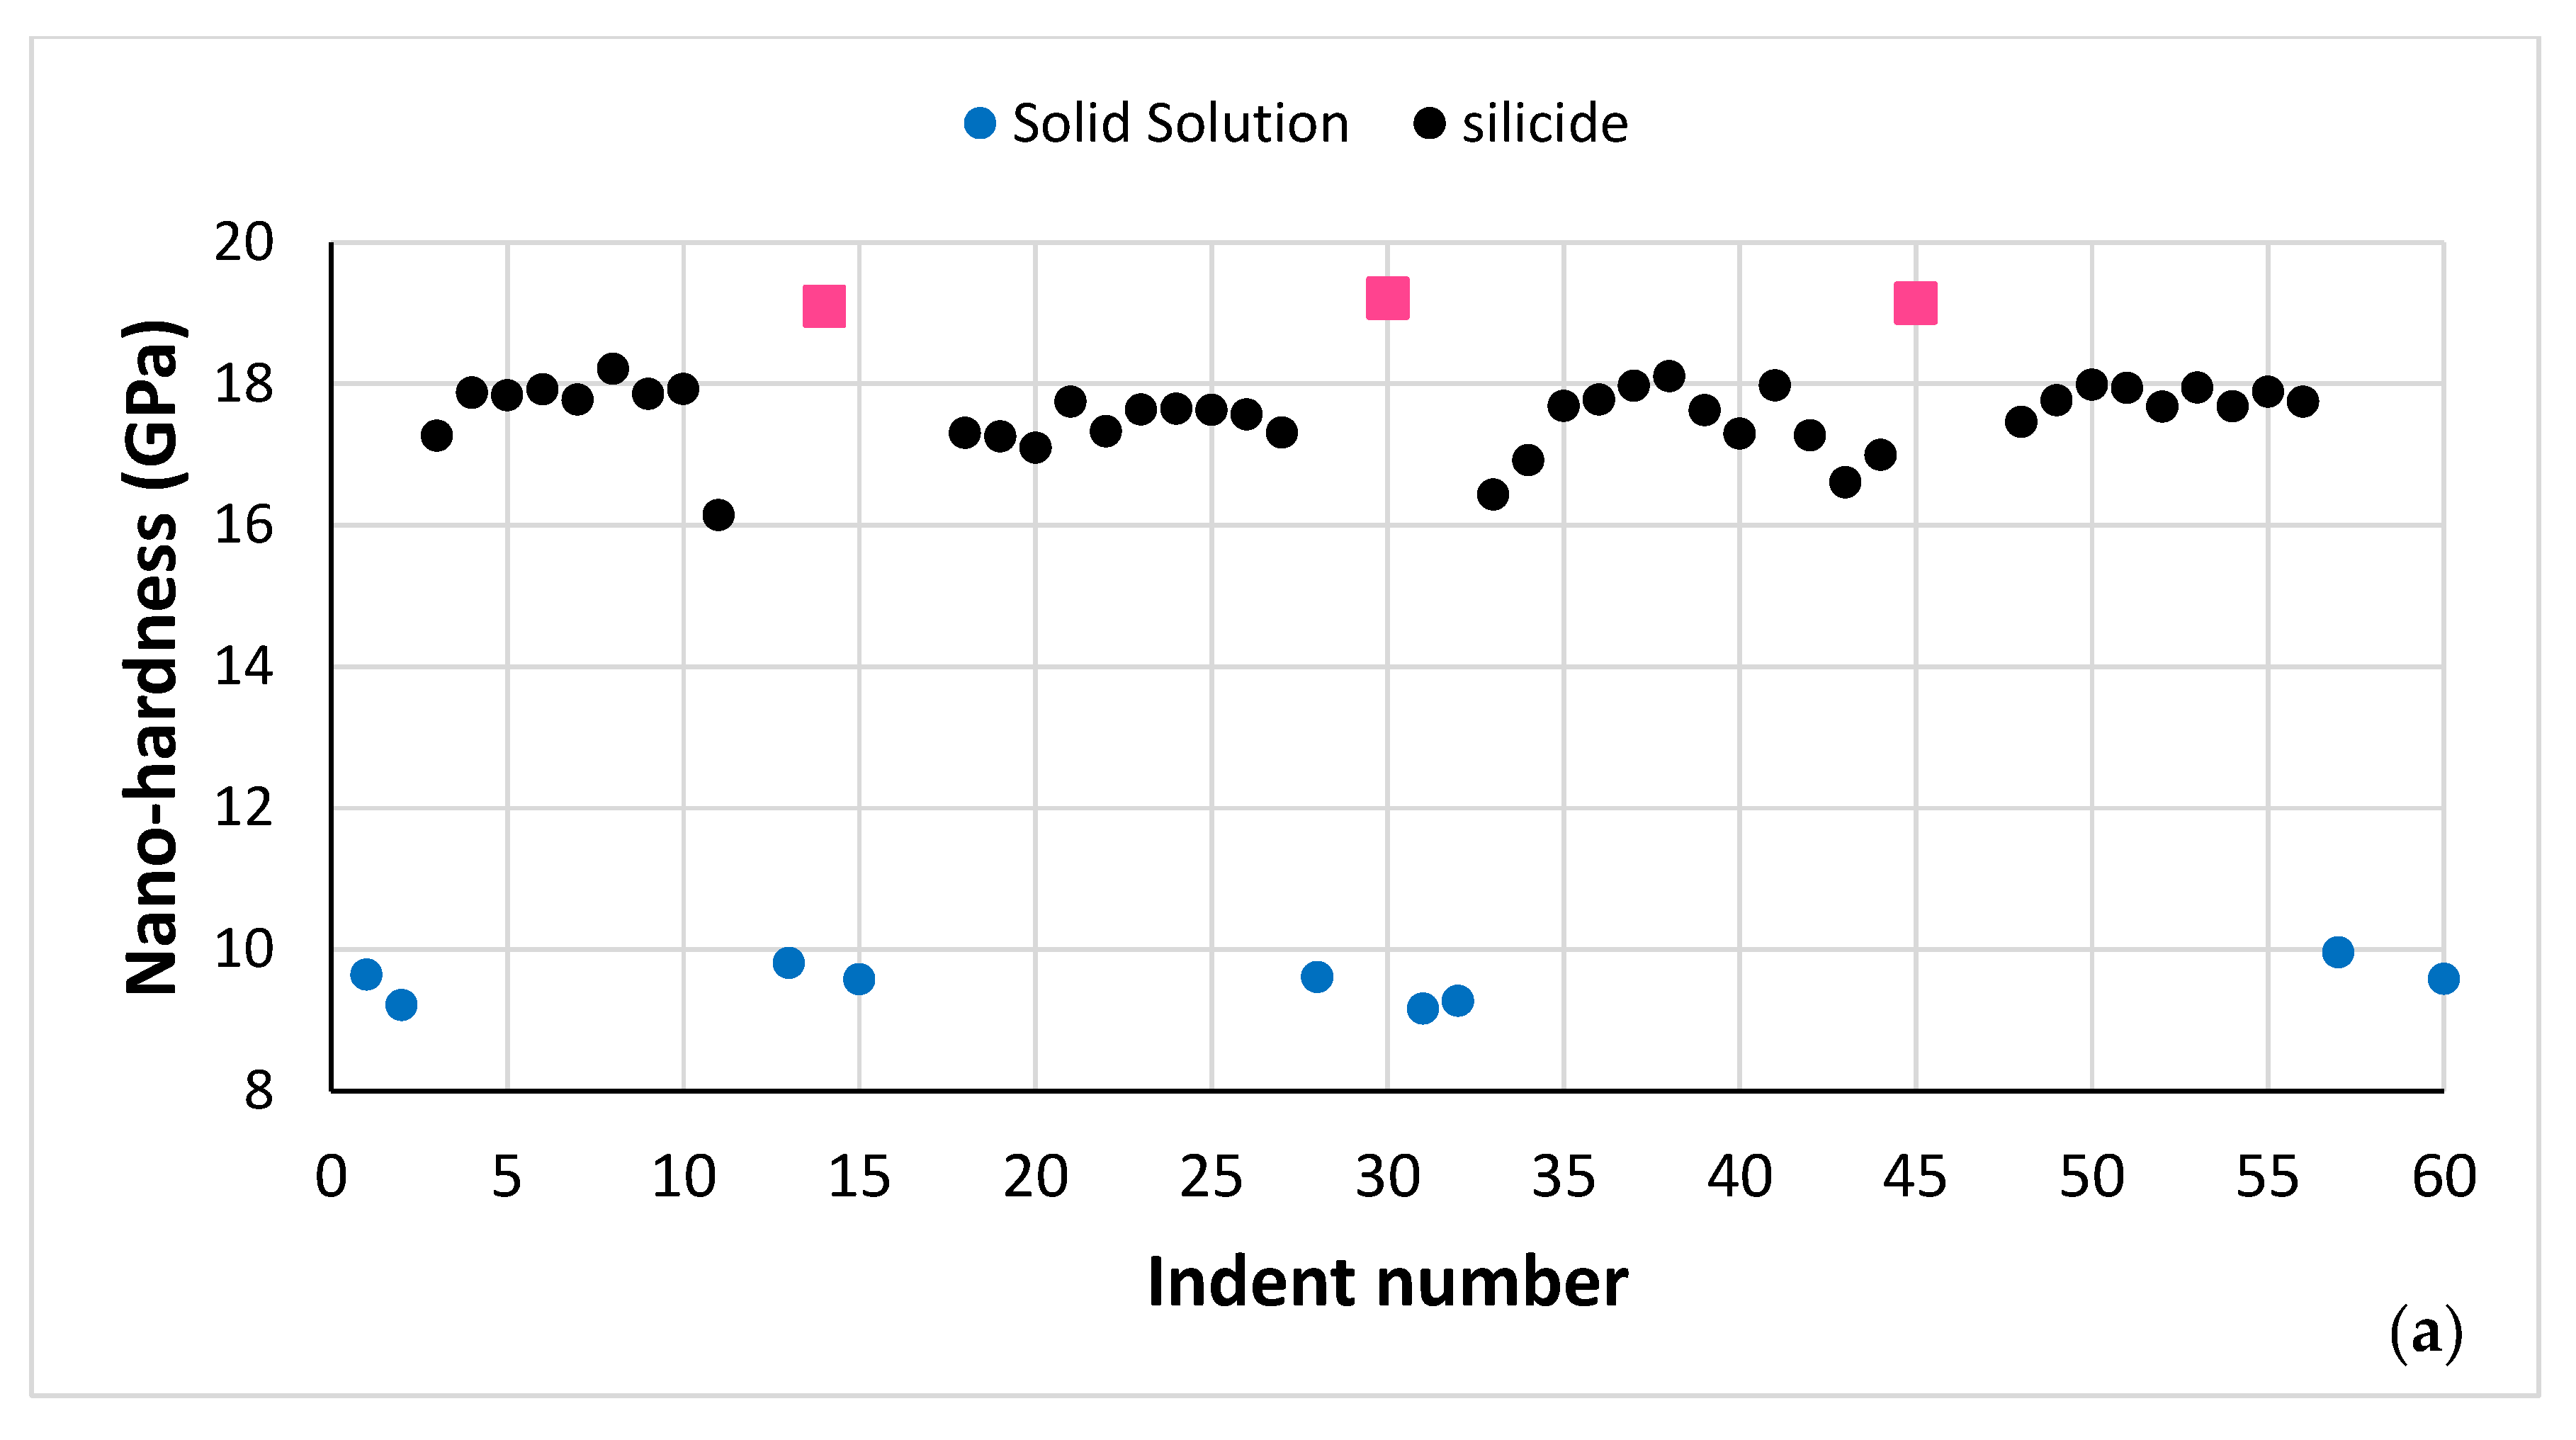
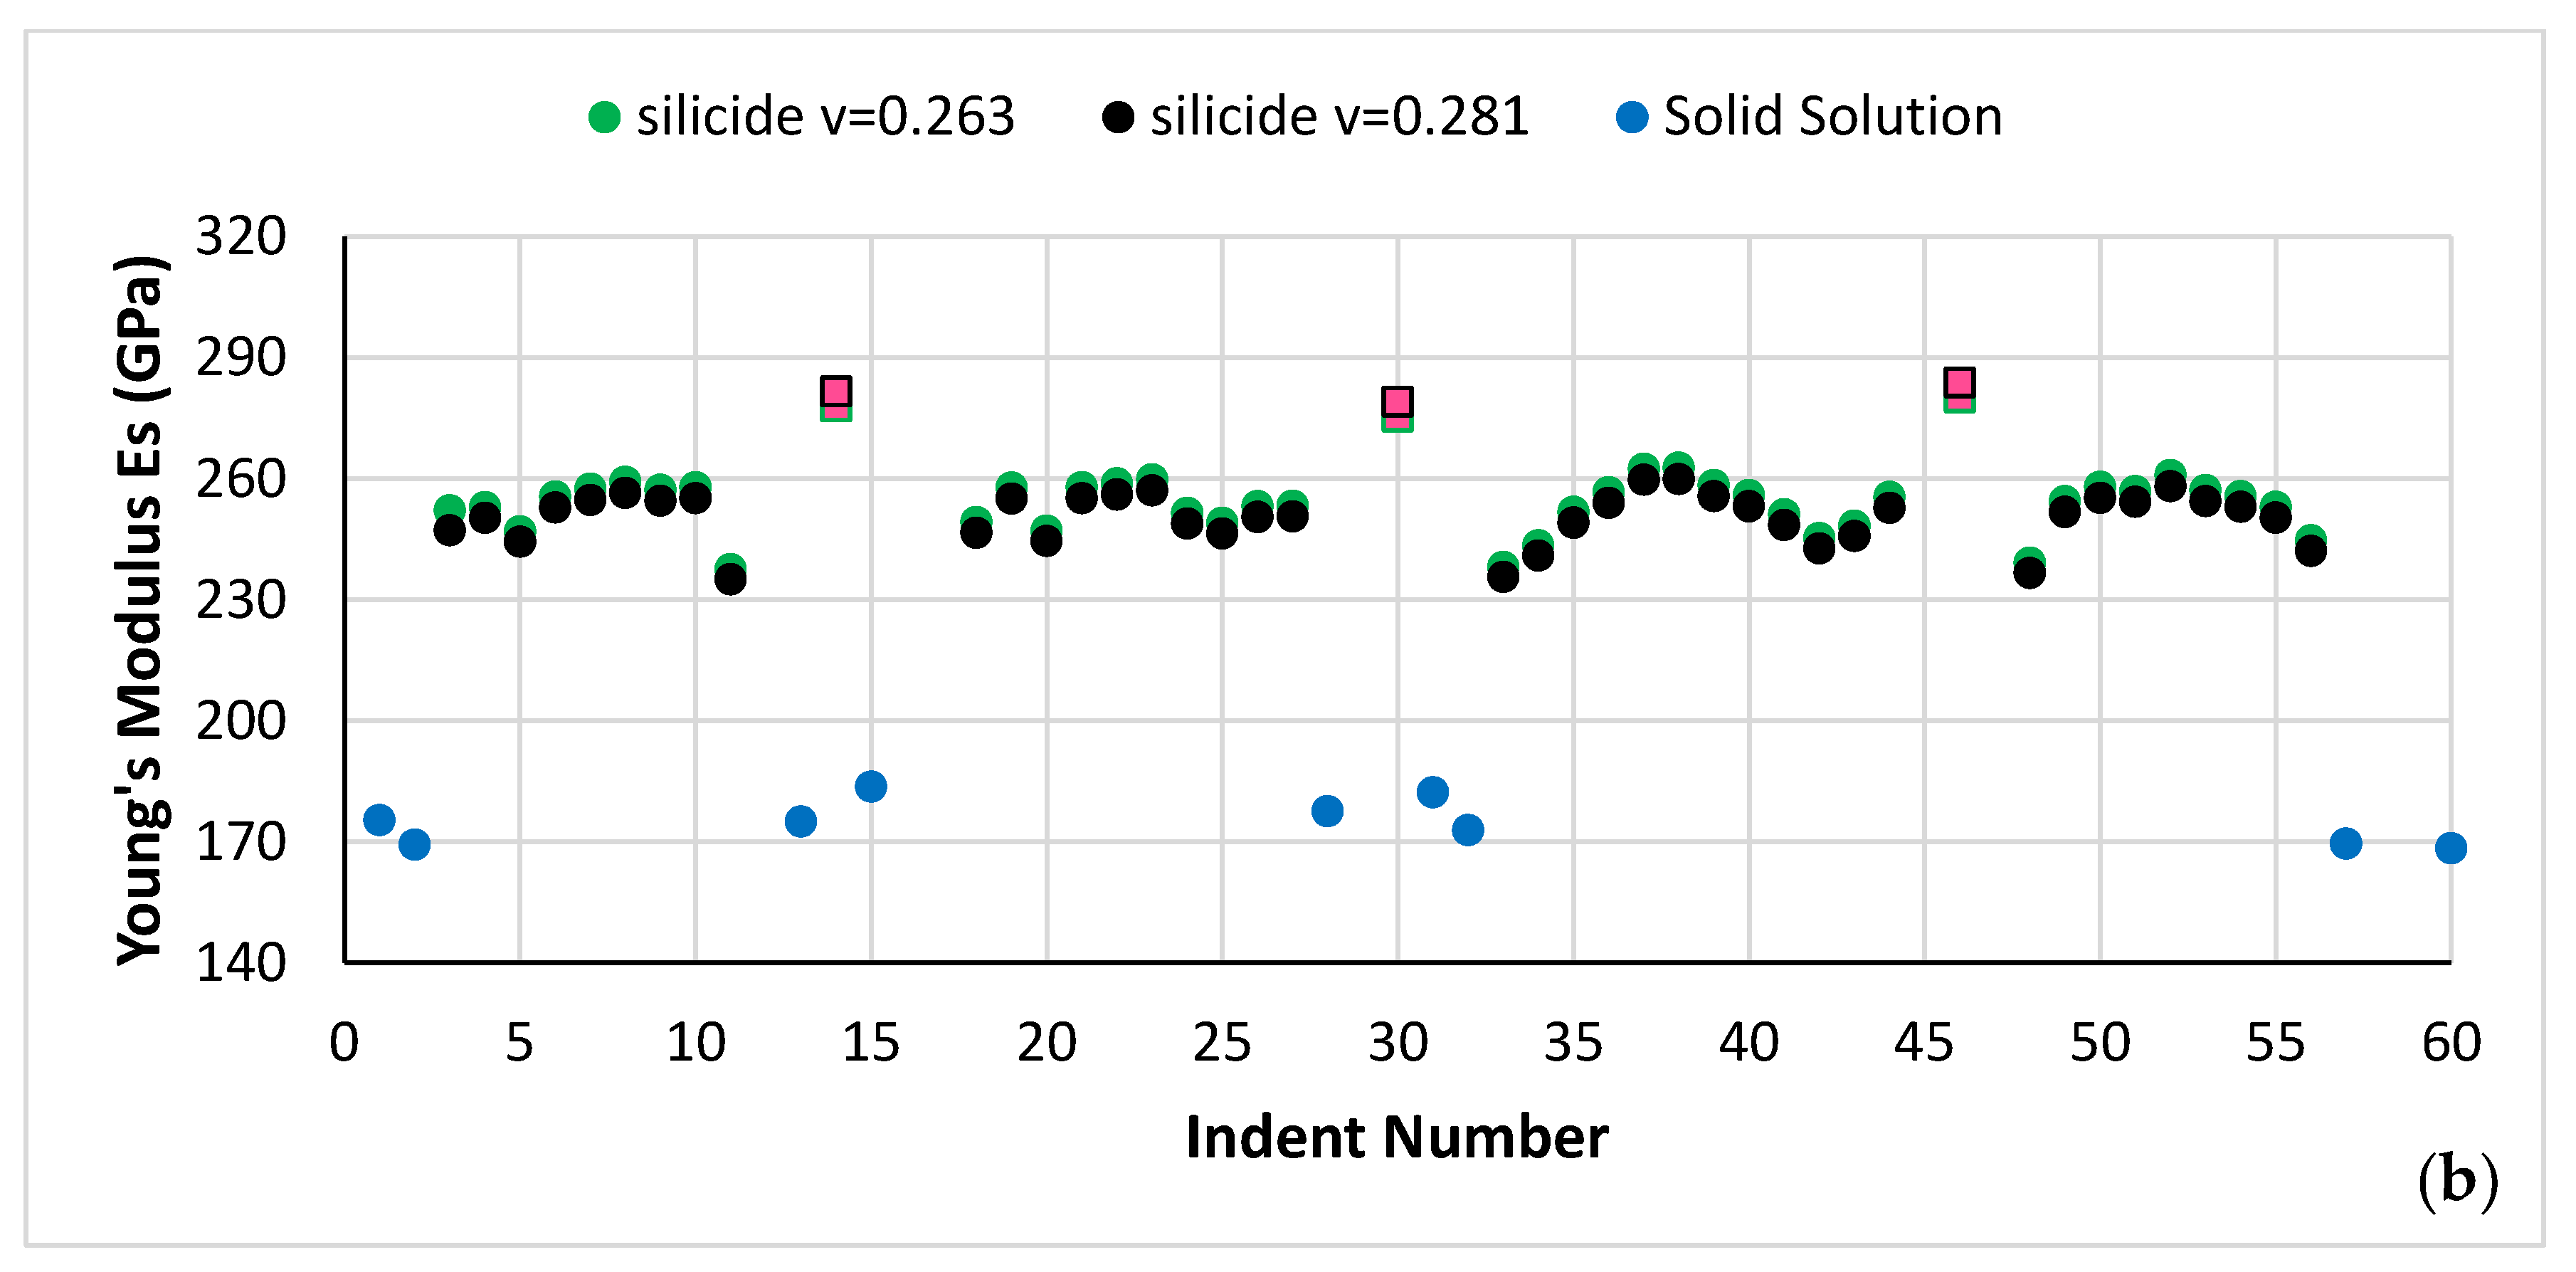
3.2. Properties
4. Discussion
4.1. Microstructure

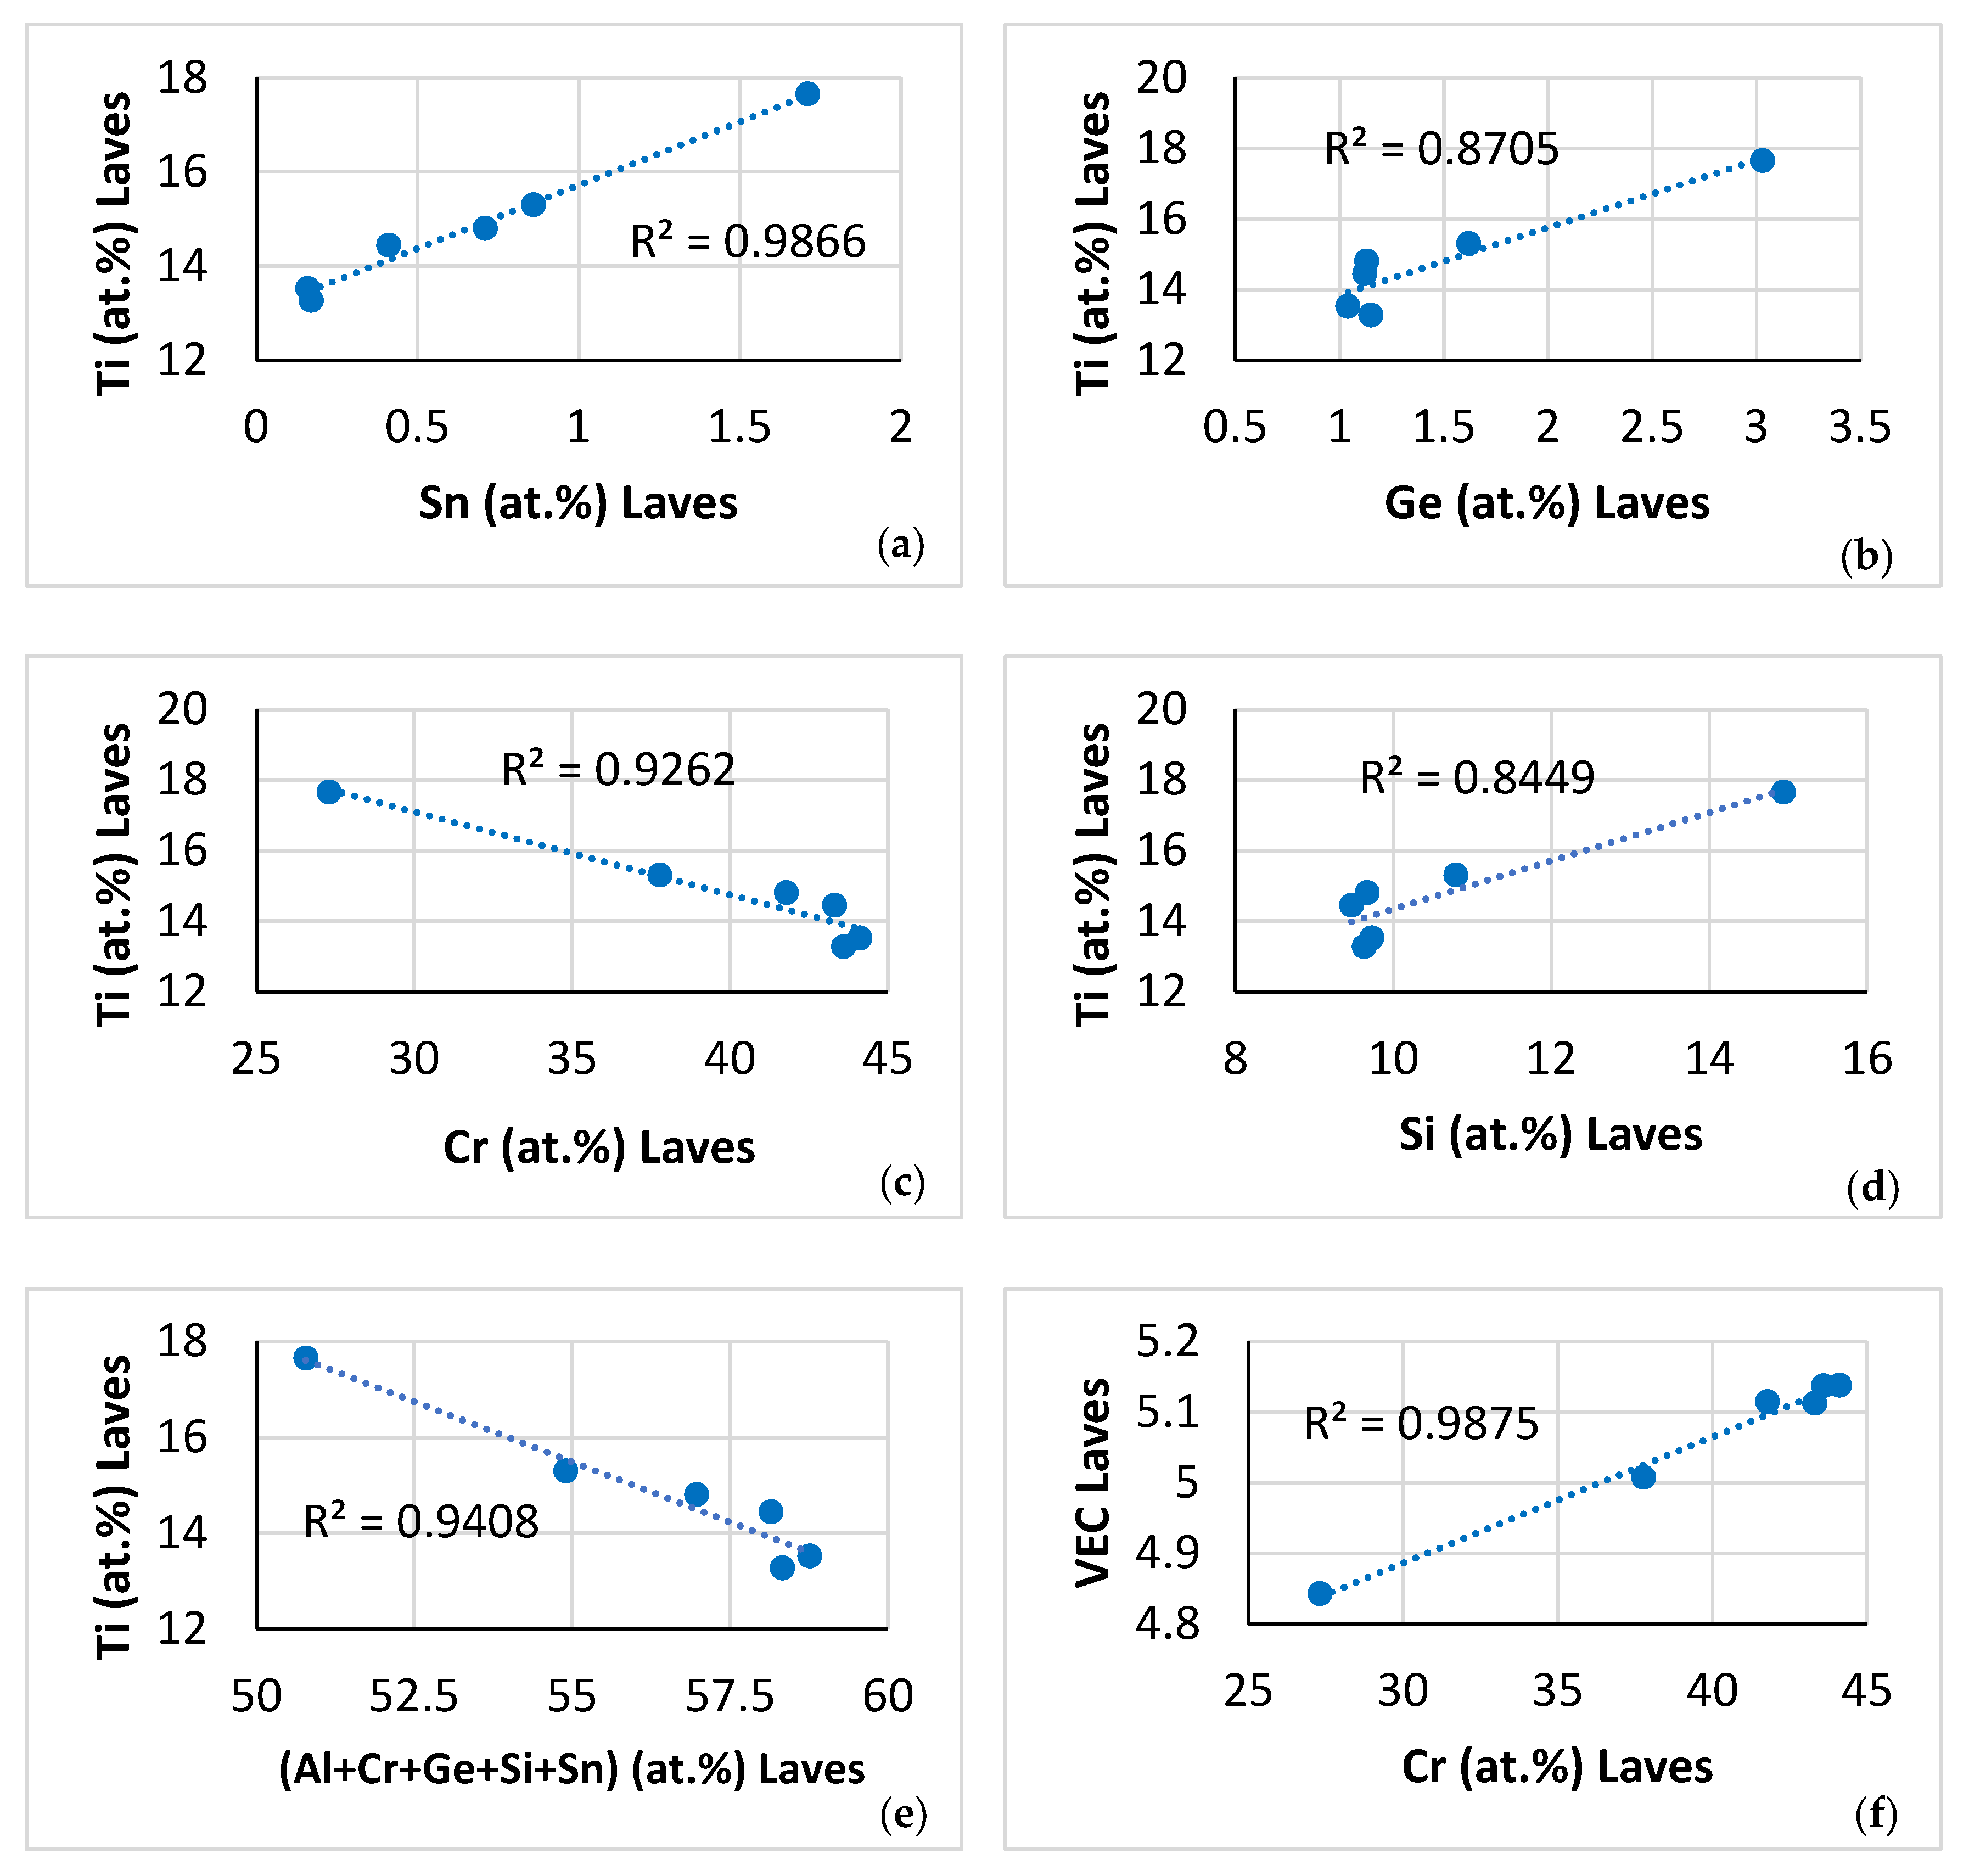
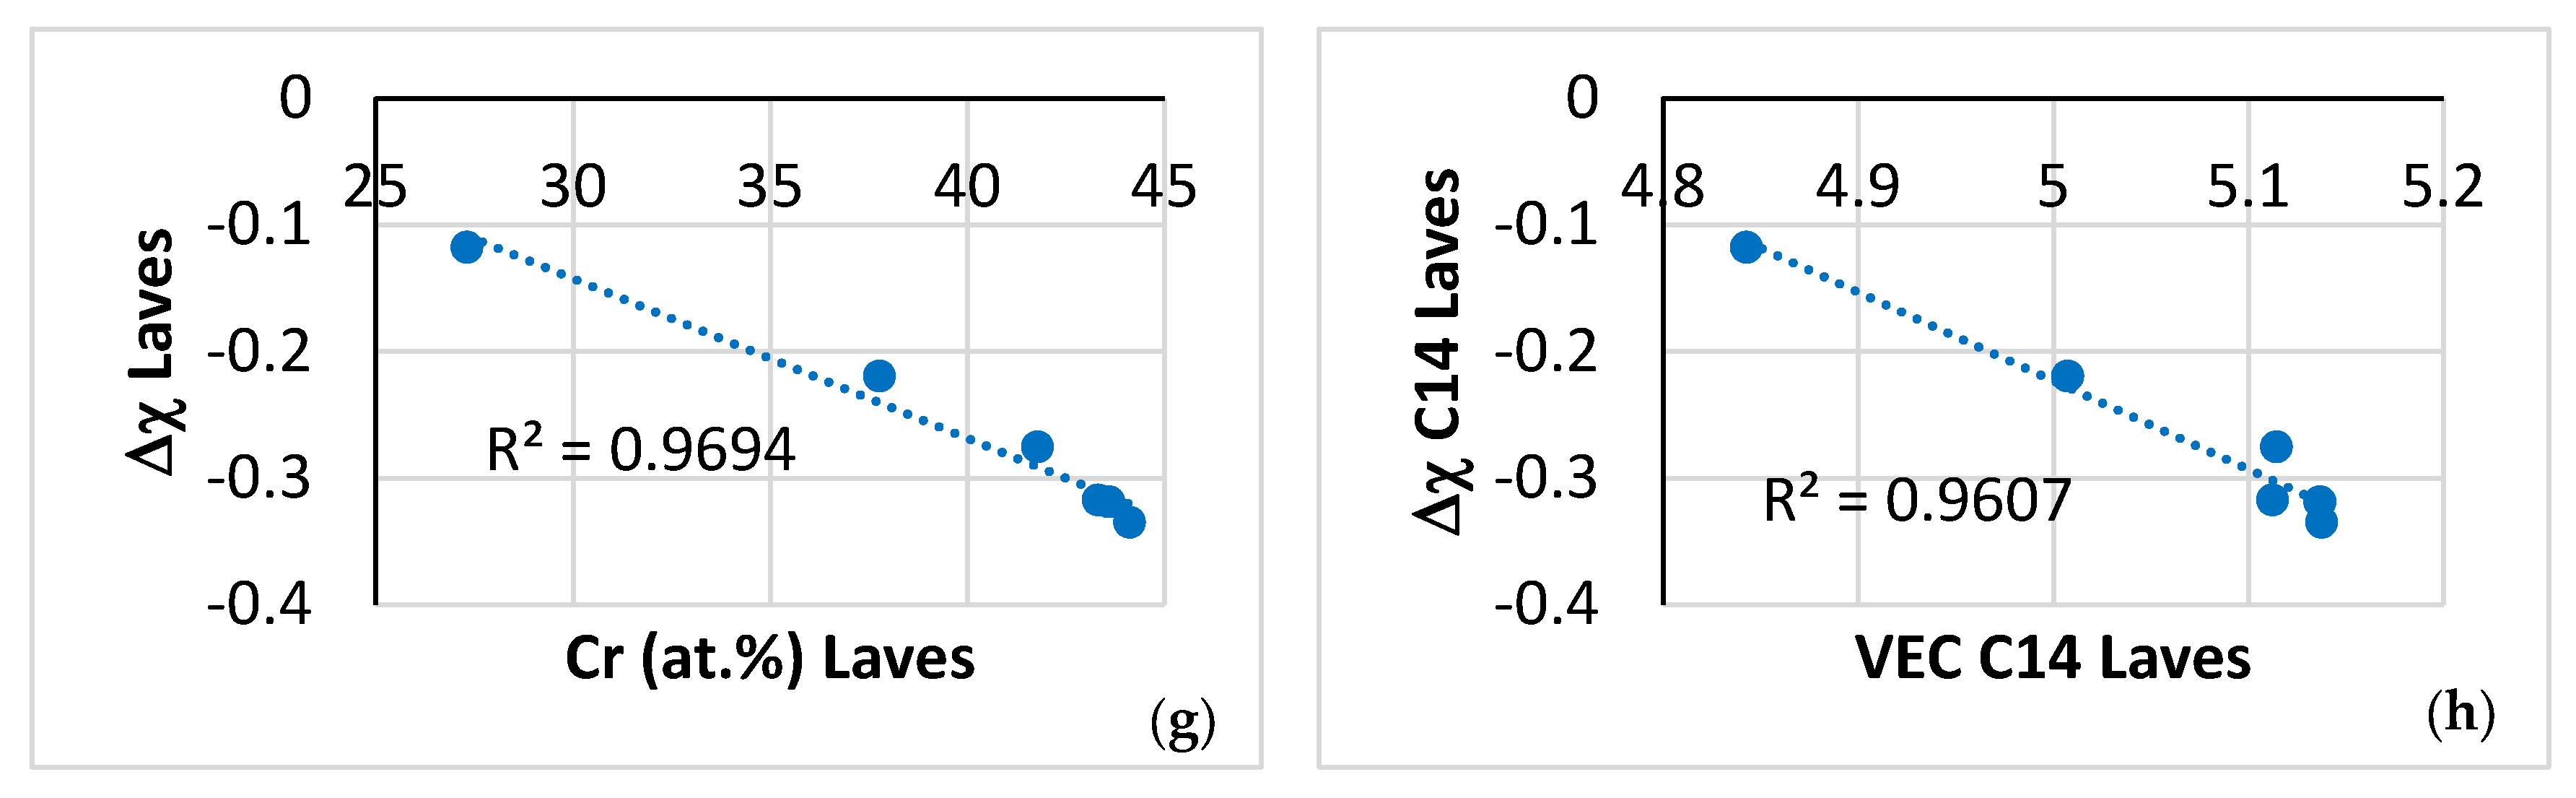
4.2. Properties
5. Conclusions
Author Contributions
Funding
Data Availability Statement
Conflicts of Interest
Abbreviations
| AC | as cast |
| CC | complex concentrated (also compositionally complex) |
| HE | high entropy |
| HT | heat treated |
| NICE | Niobium Intermetallic Composite Elaboration |
| RM | refractory metal |
| RMIC | refractory metal intermetallic composite |
| RHEA | refractory metal high entropy alloy |
| RCCA | refractory metal complex concentrated alloy |
| RMIC/RHEA | RMIC that also meets the definition of RHEA |
| RM(Nb)IC | refractory metal intermetallic composite based on Nb |
| RM(Nb)IC/RCCA | RM(Nb)IC that also meets the definition of RCCA |
| RM(Nb)IC/RHEA | RM(Nb)IC that also meets the definition of RHEA |
| TM | transition metal |
| UHTM | ultra-high temperature material |
Appendix A. Nominal Alloy Compositions (at.%)
| (Actual compositions for the alloys JZ3, JZ3+, JZ4 and JZ5) | |
| KZ5 | 48Nb–24Ti–18Si–5Al–5Cr |
| KZ7 | 53Nb–24Ti–18Si–5Al |
| JN1 | 43Nb–24Ti–18Si–5Al–5Cr–5Hf |
| JZ3 | 41.8Nb–12.4Ti–17.7Si–4.7Al–5.2Cr–1Hf–4.8Ge–6Ta–3.7Sn–2.7W |
| JZ3+ | 38.7Nb–12.4Ti–19.7Si–4.6Al–5.2Cr–0.8Hf–4.9Ge–5.7Ta–5.7Sn–2.3W |
| JZ4 | 38.9Nb–12.5Ti–17.8Si–5Al–5.2Cr–1.1Hf–5.2Ge–6.2Mo–5.8Sn–2.3W |
| JZ5 | 32Nb–20.4Ti–19.2Si–4.5Al–4.7Cr–0.9Hf–5.2Ge–6.3Mo–5.7Sn–1.1W |
| NV1 | 53Nb–23Ti–5Si–5Al–2Cr–5Hf–5V–2Sn |
| OHS1 | 38Nb–24Ti–18Si–5Al–5Cr5–Ge–5Sn |
| ZF5 | 48Nb–24Ti–18Si–5Al–5Ge |
| ZF6 | 43Nb–24Ti–18Si–5Al–5Cr–5Ge |
| ZF9 | 38Nb–24Ti–18Si–5Al–5Cr–5Ge–5Hf |
| ZX7 | 46Nb–24Ti–18Si–5Al–5Cr–2Sn |
References
- Bewlay, B.P.; Jackson, M.R.; Gigliotti, M.F.X. Chapter 6: Niobium silicide high temperature in situ composites. In Intermetallic Compounds: Principles and Practice; John Wiley & Sons, Ltd.: Hoboken, NJ, USA, 2002; Volume 3, pp. 541–560. [Google Scholar]
- Aeronautical Materials for Today and Tomorrow; Forum organised by the Air and Space Academy (AAE), French Aerospace Society (3AF) and Academy of Technologies; SAGEM: Paris, France, 2012; ISBN 978-2-913331-56-3/979-10-92518-09-2.
- Senkov, O.N.; Tsakiropoulos, P.; Couzinié, J.-P. Special Issue “Advanced Refractory Alloys”: Metals, MDPI. Metals 2022, 12, 333. [Google Scholar] [CrossRef]
- Sabol, S.M.; Randall, B.T.; Edington, J.D.; Larkin, C.J.; Close, B.J. Barrier Coatings for Refractory Metals and Superalloys; Bechtel: Reston, VA, USA, 2006. [Google Scholar] [CrossRef]
- Liu, C.T. Environmental embrittlement and grain-boundary fracture in Ni3Al. Scr. Metall. Mater. 1992, 27, 25. [Google Scholar] [CrossRef]
- Miller, C.F.; Simmons, G.W.; Wei, R.P. Evidence for internal oxidation during oxygen enhanced crack growth in P/M Ni-based superalloys. Scr. Mater. 2003, 48, 103–108. [Google Scholar] [CrossRef]
- Akhtar, A.; Hegde, S.; Reed, R.C. The oxidation of single-crystal nickel-based superalloys. JOM 2006, 58, 37–42. [Google Scholar] [CrossRef]
- Woodford, D.A. Gas phase embrittlement and time dependent cracking of nickel based superalloys. Energy Mater. 2006, 1, 59. [Google Scholar] [CrossRef]
- Tsakiropoulos, P. A Perspective of the Design and Development of Metallic Ultra-High Temperature Materials: Refractory Metal Intermetallic Composites, Refractory Complex Concentrated Alloys and Refractory High Entropy Alloys. Alloys 2023, 2, 184–212. [Google Scholar] [CrossRef]
- Bewlay, B.P.; Jackson, M.R.; Subramanian, P.R.; Zhao, J.-C. A review of very-high-temperature Nb-silicide-based composites. Metall. Mater. Trans. A 2003, 34, 2043–2052. [Google Scholar] [CrossRef]
- Tsakiropoulos, P. Refractory Metal Intermetallic Composites, High-Entropy Alloys, and Complex Concentrated Alloys: A Route to Selecting Substrate Alloys and Bond Coat Alloys for Environmental Coatings. Materials 2022, 15, 2832. [Google Scholar] [CrossRef]
- Jackson, M.R. Protective Alloy Coatings Comprising Cr-Al-Ru Containing One or More or Y, Fe, Ni and Co. U.S. Patent 4,980,244, 25 December 1990. [Google Scholar]
- Zhao, J.-C.; Jackson, M.R. Diffusion Barrier Coatings and Related Articles and Processes. U.S. Patent 6,746,782 B2, 8 June 2004. [Google Scholar]
- Bewlay, B.A.; Darolia, R.; Dheeradhada, S.; DiDomizio, R.; Gigliotti, M.F.X.; Rigney, J.D.; Subramanian, P.R. Nb-Si Based Alloy Having Al-Containing Coating: Articles and Processes. U.S. Patent 8,039,116 B2, 18 October 2011. [Google Scholar]
- Shen, F.; Zhang, Y.; Yu, L.; Fu, T.; Wang, J.; Wang, H.; Cui, K. Microstructure and Oxidation Behavior of Nb-Si-Based Alloys for Ultrahigh Temperature Applications: A Comprehensive Review. Coatings 2021, 11, 1373. [Google Scholar] [CrossRef]
- Sun, G.; Jia, L.; Hong, Z.; Liu, G.; Zhang, H. Improvement of oxidation resistance of Nb–Ti–Si based alloys with additions of Al, Cr and B at different temperatures. Prog. Nat. Sci. Mater. Int. 2012, 31, 442–453. [Google Scholar] [CrossRef]
- Su, L.; Jia, L.; Weng, J.; Hong, Z.; Zhou, C.; Zhang, H. Improvement in the oxidation resistance of Nb–Ti–Si–Cr–Al–Hf alloys containing alloyed Ge and B. Corros. Sci. 2014, 88, 460–465. [Google Scholar] [CrossRef]
- Ma, R.; Guo, X. Influence of molybdenum contents on the microstructure, mechanical properties and oxidation behaviour of multi-elemental Nb–Si based ultrahigh temperature alloys. Intermetallics 2021, 129, 107053. [Google Scholar] [CrossRef]
- Tsakiropoulos, P. Alloys for application at ultra-high temperatures: Nb-silicide in situ composites. Challenges, breakthroughs and opportunities. Prog. Mater. Sci. 2022, 123, 100714. [Google Scholar] [CrossRef]
- Tsakiropoulos, P. On the Stability of Complex Concentrated (CC)/High Entropy (HE) Solid Solutions and the Contamination with Oxygen of Solid Solutions in Refractory Metal Intermetallic Composites (RM(Nb)ICs) and Refractory Complex Concentrated Alloys (RCCAs). Materials 2022, 15, 8479. [Google Scholar] [CrossRef]
- Mitrica, D.; Badea, I.C.; Serban, B.A.; Olaru, M.T.; Vonica, D.; Burada, M.; Piticescu, R.-R.; Popov, V.V. Complex Concentrated Alloys for Substitution of Critical Raw Materials in Applications for Extreme Conditions. Materials 2021, 14, 1197. [Google Scholar] [CrossRef] [PubMed]
- Tian, Y.-S.; Zhou, W.-Z.; Tan, Q.-B.; Wu, M.-X.; Qiao, S.; Zhu, G.-L.; Dong, A.-P.; Shu, D.; Sun, B.-D. A review of refractory high-entropy alloys. Trans. Nonferrous Met. Soc. China 2022, 32, 3487–3515. [Google Scholar] [CrossRef]
- Huang, W.; Hou, J.; Wang, X.; Qiao, J.; Wu, Y. Excellent room-temperature tensile ductility in as-cast Ti37V15Nb22Hf23W3 refractory high entropy alloys. Intermetallics 2022, 151, 107735. [Google Scholar] [CrossRef]
- Lin, C.-M.; Juan, C.-C.; Chang, C.-H.; Tsai, C.-W.; Yeh, J.-W. Effect of Al addition on mechanical properties and microstructure of refractory AlxHfNbTaTiZr alloys. J. Alloys Compd. 2015, 624, 100. [Google Scholar] [CrossRef]
- Guo, N.N.; Wang, L.; Luo, L.S.; Li, X.Z.; Su, Y.Q.; Guo, J.J.; Fu, H.Z. Microstructure and mechanical properties of refractory MoNbHfZrTi high-entropy alloy. Mater. Des. 2015, 81, 87. [Google Scholar] [CrossRef]
- Guo, N.N.; Wang, L.; Luo, L.S.; Li, X.Z.; Chen, R.R.; Su, Y.Q.; Guo, J.J.; Fu, H.Z. Microstructure and mechanical properties of in-situ MC-carbide particulates-reinforced refractory high entropy Mo0.5NbHf0.5ZrTi matrix alloy composite. Intermetallics 2016, 69, 74. [Google Scholar] [CrossRef]
- Stepanov, N.D.; Yurchenko, N.Y.; Skibin, D.V.; Tikhonovsky, M.A.; Salishchev, G.A. Structure and mechanical properties of the AlCrxNbTiV (x = 0, 0.5, 1, 1.5) high entropy alloys. J. Alloys Compd. 2015, 652, 266. [Google Scholar] [CrossRef]
- Zhang, B.; Gao, M.C.; Zhang, Y.; Yang, S.; Guo, S.M. Senary refractory high entropy alloy MoNbTaTiVW. Mater. Sci. Technol. 2015, 31, 1207. [Google Scholar] [CrossRef]
- Laube, S.; Kauffmann, A.; Schellert, S.; Seils, S.; Tirunilai, A.S.; Greiner, C.; Eggeler, Y.M.; Gorr, B.; Christ, H.-J.; Heilmaier, M. Formation and thermal stability of two-phase microstructures in Al-containing refractory compositionally complex alloys. Sci. Technol. Adv. Mater. 2022, 23, 692–706. [Google Scholar] [CrossRef]
- Dasari, S.; Soni, V.; Sharma, A.; Senkov, O.N.; Miracle, D.B.; Fraser, H.L.; Wang, Y.; Banerjee, R. Concomitant Clustering and Ordering Leading to B2 + BCC Microstructures in Refractory High Entropy Alloys. Trans. Indian Inst. Met. 2022, 75, 907–916. [Google Scholar] [CrossRef]
- Heilmaier, M.; Krüger, M.; Saage, H.; Rösler, J.; Mukherji, D.; Glatzel, U.; Völkl, R.; Hüttner, R.; Eggeler, G.; Somsen, C.; et al. Metallic materials for structural applications beyond nickel-based superalloys. JOM 2009, 61, 61–67. [Google Scholar] [CrossRef]
- Senkov, O.N.; Miracle, D.B.; Chaput, K.J. Development and exploration of refractory High entropy alloys—A review. J. Mater. Res. 2018, 33, 3092–3128. [Google Scholar] [CrossRef]
- Yurchenko, N.; Panina, E.; Tikhonovsky, M.; Salishchev, G.; Zherebtsov, S.; Stepanov, N. Structure and mechanical properties of an in situ refractory Al20Cr10Nb15Ti20V25Zr10 high entropy alloy composite. Mater. Lett. 2020, 264, 127372. [Google Scholar] [CrossRef]
- Guo, N.N.; Wang, L.; Luo, L.S.; Li, X.Z.; Chen, R.R.; Su, Y.Q.; Guo, J.J.; Fu, H.Z. Microstructure and mechanical properties of refractory high entropy (Mo0.5NbHf0.5ZrTi)BCC/M5Si3 in-situ compound. J. Alloys Compd. 2016, 660, 197–203. [Google Scholar] [CrossRef]
- Guo, Y.; Peng, J.; Peng, S.; An, F.; Lu, W.; Li, Z. Improving oxidation resistance of TaMoZrTiAl refractory high entropy alloys via Nb and Si alloying. Corros. Sci. 2023, 223, 111455. [Google Scholar] [CrossRef]
- Liu, B.; Li, J.; Peterlechner, M.; Zhang, H.; Wu, Y.; Wilde, G.; Ye, F. Microstructure and mechanical properties of Si micro-alloyed (Ti28Zr40Al20Nb12)100-xSix (x = 0, 0.1, 0.2, 0.5) high entropy alloys. Intermetallics 2023, 161, 107959. [Google Scholar] [CrossRef]
- Chen, Y.; Gao, X.; Qin, G.; Chen, R.; Guo, J. Achieving excellent specific yield strength in non-equiatomic TiNbZrVMo high entropy alloy via metalloid Si doping. Mater. Lett. 2023, 335, 133832. [Google Scholar] [CrossRef]
- Xu, Z.Q.; Ma, Z.L.; Tan, Y.; Cheng, X.W. Designing TiVNbTaSi refractory high-entropy alloys with ambient tensile ductility. Scr. Mater. 2022, 206, 114230. [Google Scholar] [CrossRef]
- Liu, F.; Liaw, P.K.; Zhang, Y. Recent Progress with BCC-Structured High-Entropy Alloys. Metals 2022, 12, 501. [Google Scholar] [CrossRef]
- Tsakiropoulos, P. On the Nb5Si3 Silicide in Metallic Ultra-High Temperature Materials. Metals 2023, 13, 1023. [Google Scholar] [CrossRef]
- Han, Z.D.; Luan, H.W.; Liu, X.; Chen, N.; Li, X.Y.; Shao, Y.; Yao, K.F. Microstructures and mechanical properties of TixNbMoTaW refractory high-entropy alloys. Mater. Sci. Eng. A 2018, 712, 380. [Google Scholar] [CrossRef]
- Kang, B.; Lee, J.; Ryu, H.J.; Hong, S.H. Ultra-high strength WNbMoTaV high-entropy alloys with fine grain structure fabricated by powder metallurgical process. Mater. Sci. Eng. A 2018, 712, 616. [Google Scholar] [CrossRef]
- Wu, Y.D.; Cai, Y.H.; Chen, X.H.; Wang, T.; Si, J.J.; Wang, L.; Wang, Y.D.; Hui, X.D. Phase composition and solid solution strengthening effect in TiZrNbMoV high-entropy alloys. Mater. Des. 2015, 83, 651. [Google Scholar] [CrossRef]
- Liu, Y.; Zhang, Y.; Zhang, H.; Wang, N.; Chen, X.; Zhang, H.; Li, Y. Microstructure and mechanical properties of refractory HfMo0.5NbTiV0.5Six high-entropy composites. J. Alloys Compd. 2017, 694, 869. [Google Scholar] [CrossRef]
- Vellios, N.; Keating, P.; Tsakiropoulos, P. On the Microstructure and Properties of the Nb-23Ti-5Si-5Al-5Hf-5V-2Cr-2Sn (at.%) Silicide-Based Alloy—RM(Nb)IC. Metals 2021, 11, 1868. [Google Scholar] [CrossRef]
- Nelson, J.; Ghadyani, M.; Utton, C.; Tsakiropoulos, P. A Study of the Effects of Al, Cr, Hf, and Ti Additions on the Microstructure and Oxidation of Nb-24Ti-18Si Silicide Based Alloys. Materials 2018, 11, 1579. [Google Scholar] [CrossRef]
- Li, Z.; Luo, L.; Wang, B.; Su, B.; Luo, L.; Wang, L.; Su, Y.; Guo, J.; Fu, H. Effect of Ge addition on microstructural evolution and mechanical properties of quinary Nb-16Si-22Ti-2Al-2Cr alloy. Int. J. Refract. Met. Hard Mat. 2023, 116, 106327. [Google Scholar] [CrossRef]
- Papadimitriou, I.; Utton, C.; Scott, A.; Tsakiropoulos, P. Ab initio study of the intermetallics in Nb–Si binary system. Intermetallics 2014, 54, 125–132. [Google Scholar] [CrossRef]
- Papadimitriou, I.; Utton, C.; Tsakiropoulos, P. The impact of Ti and temperature on the stability of Nb5Si3 phases: A first-principles study. Sci. Technol. Adv. Mater. 2017, 18, 467–479. [Google Scholar] [CrossRef]
- Chen, Y.; Hammerschmidt, T.; Pettifor, D.G.; Shang, J.; Zhang, Y. Influence of vibrational entropy on structural stability of Nb-Si and Mo-Si systems at elevated temperatures. Acta Mater. 2009, 57, 2657–2664. [Google Scholar] [CrossRef]
- Shi, S.; Zhu, L.; Jia, L.; Zhang, H.; Sun, Z. Ab initio study of alloying effects on structure stability and mechanical properties of Nb5Si3. Comput. Mater. Sci. 2015, 108, 121–127. [Google Scholar] [CrossRef]
- Li, Z.; Tsakiropoulos, P. On the microstructure and hardness of the Nb-24Ti-18Si-5Al-5Cr-5Ge and Nb-24Ti-18Si-5Al-5Cr-5Ge-5Hf (at.%) silicide based alloys. Materials 2019, 12, 2655. [Google Scholar] [CrossRef] [PubMed]
- Xu, Z.; Utton, C.; Tsakiropoulos, P. A study of the effect of 2 at.% Sn on the microstructure and isothermal oxidation at 800 and 1200 °C of Nb-24Ti-18Si based alloys with Al and/or Cr additions. Materials 2018, 11, 1826. [Google Scholar] [CrossRef] [PubMed]
- Hernandez-Negrete, O.; Tsakiropoulos, P. On the microstructure and isothermal oxidation at 800 and 1200 °C of the Nb-24Ti-18Si5Al-5Cr-5Ge-5Sn (at.%) silicide based alloy. Materials 2020, 13, 722. [Google Scholar] [CrossRef] [PubMed]
- Zhao, J.; Utton, C.; Tsakiropoulos, P. On the Microstructure and Properties of Nb-12Ti-18Si-6Ta-5Al-5Cr-2.5W-1Hf (at.%) Silicide-Based Alloys with Ge and Sn Additions. Materials 2020, 13, 3719. [Google Scholar] [CrossRef] [PubMed]
- Zhao, J.; Utton, C.; Tsakiropoulos, P. On the Microstructure and Properties of Nb-18Si-6Mo-5Al-5Cr-2.5W-1Hf Nb-Silicide Based Alloys with Ge, Sn and Ti Additions (at.%). Materials 2020, 13, 4548. [Google Scholar] [CrossRef] [PubMed]
- Oliver, W.C.; Pharr, G.M. An improved technique for determining hardness and elastic modulus Using load and displacement sensing indentation experiments. J. Mater. Res. 1992, 7, 1564–1583. [Google Scholar] [CrossRef]
- Triboscope User Manual; Hysitron Ltd.: Eden Prairie, MN, USA, 2005.
- Tsakiropoulos, P. On Nb Silicide Based Alloys: Alloy Design and Selection. Materials 2018, 11, 844. [Google Scholar] [CrossRef] [PubMed]
- Tsakiropoulos, P. Alloying and Properties of C14–NbCr2 and A15–Nb3X (X = Al, Ge, Si, Sn) in Nb–Silicide-Based Alloys. Materials 2018, 11, 395. [Google Scholar] [CrossRef] [PubMed]
- Tsakiropoulos, P. On the Alloying and Properties of Tetragonal Nb5Si3 in Nb-Silicide Based Alloys. Materials 2018, 11, 69. [Google Scholar] [CrossRef] [PubMed]
- Bewlay, B.P.; Sitzman, S.D.; Brewer, L.N.; Jackson, M.R. Analyses of eutectoid phase transformations in Nb-silicide in-situ composites. Microsc. Microanal. 2004, 10, 470–480. [Google Scholar] [CrossRef] [PubMed]
- Tsakiropoulos, P. Alloying and Hardness of Eutectics with Nbss and Nb5Si3 in Nb-silicide Based Alloys. Materials 2018, 11, 592. [Google Scholar] [CrossRef]
- Schlesinger, M.E.; Okamoto, H.; Gokhale, A.B.; Abbaschian, R. The Nb-Si (Niobium-Silicon) System. J. Phase Equilib. 1993, 14, 502–509. [Google Scholar] [CrossRef]
- Kuzmina, N.A.; Eremin, N.N.; Marchenko, E.I.; Svetlov, I.L.; Muromtsev, N.A.; Neuman, A.V.; Yakushev, D.A. Diffusion Paths for Interstitial Impurities in Different Polymorphic Modifications of Niobium Silicide Nb5Si3. Crystallogr. Rep. 2018, 63, 319–326, Original Russian Text published in Kristallografiya 2018, 63, 366–373. [Google Scholar] [CrossRef]
- Williams, J.J.; Ye, Y.Y.; Kramer, M.J.; Ho, K.M.; Hong, L.; Fu, C.L.; Malik, S.K. Theoretical calculations and experimental measurements of the structure of Ti5Si3 with interstitial additions. Intermetallics 2000, 8, 937–943. [Google Scholar] [CrossRef]
- Juan, C.-C.; Tsai, M.-H.; Tsai, C.-W.; Lin, C.-M.; Wang, W.-R.; Yang, C.-C.; Chen, S.-K.; Lin, S.-J.; Yeh, J.-W. Enhanced mechanical properties of HfMoTaTiZr and HfMoNbTaTiZr refractory high-entropy alloys. Intermetallics 2015, 62, 76. [Google Scholar] [CrossRef]
- Zhang, B.; Gao, M.C.; Zhang, Y.; Guo, S.M. Senary refractory high-entropy alloy CrxMoNbTaVW. CALPHAD Comput. Coupling Phase Diagr. Thermochem. 2015, 51, 193. [Google Scholar] [CrossRef]
- Gao, M.C.; Zhang, B.; Yang, S.; Guo, S.M. Senary refractory high-entropy alloy HfNbTaTiVZr. Metall. Mater. Trans. A 2016, 47, 3333. [Google Scholar] [CrossRef]
- Yao, H.W.; Qiao, J.W.; Hawk, J.A.; Zhou, H.F.; Chen, M.W.; Gao, M.C. Mechanical properties of refractory high-entropy alloys: Experiments and modelling. J. Alloys Compd. 2017, 696, 1139. [Google Scholar] [CrossRef]
- Yao, H.W.; Qiao, J.W.; Gao, M.C.; Hawk, J.A.; Ma, S.G.; Zhou, H.F. MoNbTaV medium-entropy alloy. Entropy 2016, 18, 189. [Google Scholar] [CrossRef]
- Yao, H.W.; Qiao, J.W.; Gao, M.C.; Hawk, J.A.; Ma, S.G.; Zhou, H.F.; Zhang, Y. NbTaV–(Ti,W) refractory high entropy alloys: Experiments and modelling. Mater. Sci. Eng. A 2016, 674, 203. [Google Scholar] [CrossRef]
- Feng, T. Study of the Effect of Interstitial Element Contamination on the Properties of Nbss and Nb5Si3 in Nb Silicide Based Alloys; Final Year Project; University of Sheffield: Sheffield, UK, 2013. [Google Scholar]


| Phase | Nb | Ti | Si | Al | Cr | Hf | Mo | W | Sn | Ge |
|---|---|---|---|---|---|---|---|---|---|---|
| A2–Nbss | 39.7 | 20.9 | 0.5 | 4.9 | 8.1 | 0.6 | 17.5 | 4.7 | 2 | 1.1 |
| ±2.6 | ±2.3 | ±0.3 | ±2 | ±1.5 | ±0.9 | ±0.4 | ±0.2 | |||
| Ti–rich Nbss | 30.6 | 30.2 | 2.3 | 6.5 | 14.7 | 1.3 | 8.4 | 0.4 | 4.4 | 1.2 |
| ±1.6 | ±2 | ±0.7 | ±0.4 | ±0.4 | ±0.5 | ±1.1 | ±0.3 | ±0.6 | ||
| βNb5Si3 | 39.1 | 17.5 | 27.8 | 1.6 | 1.1 | 1 | 4.3 | 0.6 | 0.6 | 6.4 |
| ±0.6 | ±0.7 | ±0.7 | ±0.3 | ±0.2 | ±0.1 | ±0.2 | ±0.3 | |||
| Ti–rich Nb5Si3 | 32.3 | 21.8 | 23.2 | 5.8 | 2.5 | 1.8 | 2.5 | 0.2 | 2.6 | 7.3 |
| ±0.5 | ±0.6 | ±0.5 | ±0.3 | ±0.4 | ±0.3 | ±0.6 | ±0.8 | ±0.4 | ||
| C14– NbCr2 | 22.1 | 14.4 | 9.9 | 3.8 | 42.1 | 2.2 | 3.6 | 0.2 | 0.5 | 1.2 |
| ±0.8 | ±1.7 | ±0.5 | ±0.1 | ±0.6 | ±0.3 | ±0.2 | ±0.2 | |||
| Tiss | 19.5 | 55.7 | 4 | 3.2 | 6.3 | 4.1 | 4.4 | - | 2.2 | 0.6 |
| ±4.6 | ±11.4 | ±1.8 | ±1.7 | ±4.6 | ±2 | ±1.7 | ±0.9 | ±0.4 |
| Area or Phase | O | Nb | Ti | Si | Al | Cr | Hf | Mo | W | Sn | Ge |
|---|---|---|---|---|---|---|---|---|---|---|---|
| NT1.2 near surface | 8.4 | 34.6 | 18 | 21.7 | 2.4 | 2.9 | 0.8 | 4.9 | 0.5 | 0.7 | 5.1 |
| ±3.5 | ±1.3 | ±0.9 | 0.8 | ±0.4 | ±0.2 | ±0.1 | ±0.2 | ±0.2 | ±0.1 | ±0.3 | |
| NT1.2 bulk | 37.6 | 19.6 | 23.7 | 2.7 | 3.2 | 0.9 | 5.4 | 0.6 | 0.8 | 5.5 | |
| ±0.4 | ±0.5 | ±0.9 | ±0.3 | ±0.2 | ±0.1 | ±0.2 | ±0.2 | ±0.1 | ±0.2 | ||
| A2–Nbss near surface | 13 | 36.8 | 16.1 | - | 3.4 | 7.8 | 0.2 | 16.8 | 3.5 | 1.5 | 0.9 |
| ±5.1 | ±3.2 | ±1.7 | ±1 | ±1 | ±1.8 | ±0.6 | ±0.2 | ±0.5 | |||
| A2–Nbss bulk | 42.2 | 18.7 | - | 4 | 9 | 0.2 | 19.2 | 4 | 1.7 | 1 | |
| ±2 | ±1.7 | ±1.1 | ±1.1 | ±1.2 | ±0.5 | ±0.2 | ±0.6 | ||||
| Silicide near surface | 7.6 | 34.9 | 17 | 26.9 | 1.7 | 1.9 | 1.1 | 3.1 | - | 0.3 | 5.5 |
| ±4.7 | ±5.3 | ±3.7 | ±2.1 | ±0.8 | ±0.3 | ±0.5 | ±0.7 | ±0.8 | |||
| “normal” silicide bulk | 37.3 | 19.1 | 28.9 | 2 | 1.7 | 1.2 | 3.2 | 0.2 | 0.3 | 6.1 | |
| ±4.9 | ±4.6 | ±1.1 | ±0.9 | ±0.3 | ±0.5 | ±0.8 | ±1 | ||||
| Silicide very rich in Ti, bulk | 31.8 | 26.2 | 26.7 | 3 | 1.8 | 0.8 | 2.6 | - | 0.5 | 6.6 | |
| ±0.8 | ±0.5 | ±0.8 | ±0.9 | ±0.2 | ±0.5 | ±0.3 | ±0.1 | ||||
| HfO2 | 65.3 | - | - | - | - | - | 34.7 | - | - | - | - |
| ±4.3 | ±1.2 |
| Phase | Nb | Ti | Si | Al | Cr | Hf | Mo | W | Sn | Ge |
|---|---|---|---|---|---|---|---|---|---|---|
| A2–Nbss | 41.8 | 18.5 | - | 4.6 | 9.4 | 0.4 | 19.3 | 3.9 | 1.3 | 0.8 |
| ±0.5 | ±0.4 | ±0.3 | ±0.1 | ±0.1 | ±0.3 | ±0.1 | ±0.2 | ±0.3 | ||
| Silicide very rich in Ti | 31.2 | 24.1 | 27.5 | 3.1 | 1.6 | 2.7 | 2.5 | - | 0.5 | 6.8 |
| ±3.1 | ±1.9 | ±1 | ±0.1 | ±0.3 | ±1 | ±0.4 | ±0.3 | ±0.3 | ||
| “Core” Nb5Si3 | 40.3 | 16.4 | 29.1 | 1.7 | 1.9 | 0.9 | 3.7 | 0.2 | 0.2 | 5.6 |
| ±0.8 | ±1.2 | ±0.7 | ±0.6 | ±0.3 | ±0.1 | ±0.6 | ±0.1 | ±0.1 | ±0.1 | |
| “Boundary” Nb5Si3 | 36.3 | 20.6 | 26.5 | 3 | 2.1 | 1.1 | 3.2 | - | 0.8 | 6.4 |
| ±0.4 | ±0.3 | ±0.2 | ±0.1 | ±0.1 | ±0.1 | ±0.1 | ±0.2 | ±0.1 |
| Phase | Nb | Ti | Si | Al | Cr | Hf | Mo | W | Sn | Ge |
|---|---|---|---|---|---|---|---|---|---|---|
| A2–Nbss | 41.5 | 17.8 | - | 4.7 | 9.8 | 0.2 | 19.1 | 3.9 | 2.1 | 0.9 |
| ±0.8 | ±0.3 | ±0.3 | ±0.2 | ±0.3 | ±0.1 | ±0.2 | ±0.2 | |||
| Silicide very rich in Ti | 30.5 | 26.6 | 26.8 | 3.5 | 1.8 | 1.2 | 2.4 | - | 0.4 | 6.8 |
| ±0.6 | ±0.6 | ±0.4 | ±0.2 | ±0.1 | ±0.9 | ±0.1 | ±0.1 | |||
| “Core” Nb5Si3 | 40.3 | 16.1 | 29.1 | 1.4 | 2.1 | 0.9 | 3.9 | 0.2 | 0.3 | 5.7 |
| ±0.4 | ±0.4 | ±0.4 | ±0.1 | ±0.1 | ±0.1 | ±0.2 | ±0.1 | |||
| “Boundary” Nb5Si3 | 36.8 | 20.5 | 25.7 | 3.2 | 2.3 | 0.6 | 3.3 | - | 1.3 | 6.3 |
| ±0.4 | ±0.2 | ±0.3 | ±0.2 | ±0.1 | ±0.2 | ±0.3 | ±0.1 | ±0.1 |
| Phase | Nb | Ti | Si | Al | Cr | Hf | Mo | W | Sn | Ge |
|---|---|---|---|---|---|---|---|---|---|---|
| A2 solid solution | 38.2 | 19.6 | 1 | 5.6 | 10.1 | 0.5 | 17.3 | 3.9 | 2.6 | 1.2 |
| ±2.1 | ±1.8 | ±0.7 | ±0.3 | ±2.2 | ±0.1 | ±1.8 | ±1 | ±0.3 | ±0.2 | |
| βNb5Si3 silicide | 36 | 20.1 | 24.4 | 3.5 | 2.4 | 1.1 | 4.1 | 0.4 | 1.9 | 6.1 |
| ±1.2 | ±1.3 | ±1.3 | ±0.3 | ±1.1 | ±0.1 | ±0.5 | ±0.4 | ±0.3 |
| Phase | Nb | Ti | Si | Al | Cr | Hf | Mo | W | Sn | Ge |
|---|---|---|---|---|---|---|---|---|---|---|
| A2 solid solution | 42.1 | 17.1 | 0.4 | 4.4 | 9.5 | 0.2 | 19.2 | 4 | 1.9 | 1.2 |
| ±0.1 | ±0.2 | ±0.3 | ±0.1 | ±0.1 | ±0.1 | ±0.1 | ±0.2 | ±0.1 | ±0.1 | |
| βNb5Si3 silicide | 38.3 | 19.2 | 26.5 | 2.6 | 2.3 | 0.7 | 3.6 | - | 0.8 | 6 |
| ±1.1 | ±1.4 | ±1.6 | ±0.5 | ±0.3 | ±0.2 | ±0.7 | ±0.4 | ±0.3 | ||
| Silicide very rich in Ti | 31.2 | 26.5 | 26.5 | 3.2 | 1.8 | 1.1 | 2.8 | - | 0.4 | 6.5 |
| ±0.3 | ±0.1 | ±0.5 | ±0.1 | ±0.1 | ±0.1 | ±0.3 | ±0.1 |
| Phase | As Cast | Heat Treated | ||||
|---|---|---|---|---|---|---|
| 100 h | 200 h | |||||
| nanoH (GPa) | Es (GPa) | nanoH (GPa) | Es (GPa) | nanoH (GPa) | Es (GPa) | |
| (Nb,Ti,Al,Si,Cr,Ge,Hf,Mo,Sn,W)ss | 8.2 | 160.4 | 10.1 | 187.1 | 9.5 | 177.4 |
| βNb5Si3 | 13.5 | 231.7 | 19.5 | 240.3 | 17.6 | 250.3 |
| Silicide very rich in Ti | 19.2 | 281.5 | ||||
| Alloy * | Solid Solution | NanoH (GPa) | Es (GPa) | Reference |
|---|---|---|---|---|
| KZ7-HT | (Nb,Ti,Al,Si)ss | 4.95 | 138 | [46] |
| KZ5-HT | (Nb,Ti,Al,Si,Cr)ss | 6.5 | 131 | [46] |
| JN1-HT | (Nb,Ti,Al,Si,Cr,Hf)ss | 5.85 | 137.6 | [46] |
| ZF5-HT | (Nb,Ti,Al,Si,Ge)ss | 7.1 | 142.2 | [73] |
| ZF6-HT | (Nb,Ti,Al,Si,Cr,Ge)ss | 8.1 | 154 | [73] |
| ZF9-HT | (Nb,Ti,Al,Si,Cr,Ge,Hf)ss | 6 | 120 | [73] |
| Ti Addition in Silicide (at.%) | ||||
|---|---|---|---|---|
| Silicide polymorph | 3.125 | 6.25 | 9.375 | 12.5 |
| ΔEs/Ti (GPa/at.%) | ||||
| αNb5Si3 | +6.112 | +3.376 | +2.315 | +1.824 |
| βNb5Si3 | −1.92 | −2.684 | −2.677 | −2.432 |
| Ti Addition in Silicide (at.%) | ||||
|---|---|---|---|---|
| Silicide polymorph | 3.125 | 6.25 | 9.375 | 12.5 |
| ΔEs/Ti (GPa/at.%) | ||||
| αNb5Si3 | +6.112 | +0.64 | +0.192 | +0.352 |
| βNb5Si3 | −1.92 | −3.808 | −2.304 | −1.696 |
| Solute X | ΔES/X (GPa/at.%) | Δ[nano−H]/X (GPa/at.%) | Δ[VEC]/X (at/%)−1 | Δ[Δχ]/X (at/%)−1 | Δ[δ]/X (at/%)−1 |
|---|---|---|---|---|---|
| Ti | −3.13 | −0.077 | −0.0168 | −0.0071 | +0.1809 |
| Al | −16.86 | −0.413 | −0.0906 | −0.0380 | +0.9732 |
| Cr | −2.32 | −0.076 | −0.0137 | −0.0057 | +0.1468 |
| Mo | +3.37 | +0.083 | +0.0181 | +0.0076 | −0.1946 |
| W | +1.21 | +0.26 | +0.0354 | +0.0002 | −0.3418 |
| Si | +5.64 | −1.085 | −0.0924 | +0.0085 | +0.4068 |
| Ge | +0.56 | −1.206 | −0.3214 | −0.0260 | +1.4935 |
| Sn | −19.83 | −0.413 | −0.0666 | −0.0447 | +1.1449 |
| Hf | +4.79 | −0.118 | −0.2663 | +0.0659 | +1.4275 |
| Nb | +2.69 | +0.066 | +0.0145 | +0.0061 | −0.1555 |
| Solute X | ΔES/X (GPa/at.%) | Δ[nano−H]/X (GPa/at.%) | Δ[VEC]/X (at/%)−1 | Δ[Δχ]/X (at/%)−1 |
|---|---|---|---|---|
| Ti | +6.28 | −0.058 | +0.0098 | +0.0345 |
| Al | −1.24 | −0.609 | +0.0529 | +0.1555 |
| Cr | +0.57 | −0.064 | +0.0076 | +0.0286 |
| Mo | −1.02 | +0.029 | +0.0355 | +0.0594 |
| W | +6.53 | +0.76 | +0.0953 | −0.0075 |
| Si | +0.28 | +0.031 | −0.0076 | −0.0269 |
| Ge | −1.92 | +0.216 | −0.0278 | −0.0959 |
| Sn | −1.25 | +0.039 | −0.0347 | +0.0032 |
| Hf | −8.89 | −1.361 | −0.1172 | +0.0332 |
| Nb | −0.65 | +0.073 | −0.0095 | −0.0328 |
| ΔEs1 to 6/μm = 1.11 GPa/μm | ΔEs6 to 11/μm = −0.64 GPa/μm | ΔnH1 to 6/μm = +0.08 GPa/μm | ΔnH6 to 11/μm = −0.07 GPa/μm | |
|---|---|---|---|---|
| Solute X | ΔEs1 to 6/X1 to 6 (GPa/at.% X) | ΔEs6 to 11/X6 to 11 (GPa/at.% X) | ΔnH1 to 6/X1 to 6 (GPa/at.% X) | ΔnH6 to 11/X6 to 11 (GPa/at.% X) |
| Al | −48.6 | −17.6 | −3.4 | −1.9 |
| Ti | −24.3 | −5.4 | −1.7 | −0.6 |
| Nb | +17.4 | +5.9 | +1.2 | +0.6 |
| Mo | −30.4 | +70.5 | −2.1 | +7.5 |
| Si | +10.6 | +10.8 | +0.7 | +1.2 |
| Sn | −60.8 | −28.2 | −4.3 | −15 |
Disclaimer/Publisher’s Note: The statements, opinions and data contained in all publications are solely those of the individual author(s) and contributor(s) and not of MDPI and/or the editor(s). MDPI and/or the editor(s) disclaim responsibility for any injury to people or property resulting from any ideas, methods, instructions or products referred to in the content. |
© 2024 by the authors. Licensee MDPI, Basel, Switzerland. This article is an open access article distributed under the terms and conditions of the Creative Commons Attribution (CC BY) license (https://creativecommons.org/licenses/by/4.0/).
Share and Cite
Tankov, N.; Utton, C.; Tsakiropoulos, P. On the Microstructure and Properties of Complex Concentrated bcc Solid Solution and Tetragonal D8m M5Si3 Silicide Phases in a Refractory Complex Concentrated Alloy. Alloys 2024, 3, 59-95. https://doi.org/10.3390/alloys3010005
Tankov N, Utton C, Tsakiropoulos P. On the Microstructure and Properties of Complex Concentrated bcc Solid Solution and Tetragonal D8m M5Si3 Silicide Phases in a Refractory Complex Concentrated Alloy. Alloys. 2024; 3(1):59-95. https://doi.org/10.3390/alloys3010005
Chicago/Turabian StyleTankov, Nik, Claire Utton, and Panos Tsakiropoulos. 2024. "On the Microstructure and Properties of Complex Concentrated bcc Solid Solution and Tetragonal D8m M5Si3 Silicide Phases in a Refractory Complex Concentrated Alloy" Alloys 3, no. 1: 59-95. https://doi.org/10.3390/alloys3010005
APA StyleTankov, N., Utton, C., & Tsakiropoulos, P. (2024). On the Microstructure and Properties of Complex Concentrated bcc Solid Solution and Tetragonal D8m M5Si3 Silicide Phases in a Refractory Complex Concentrated Alloy. Alloys, 3(1), 59-95. https://doi.org/10.3390/alloys3010005