Abstract
Objectives: This study aimed to compare hip abductor muscle composition and its age-related alterations between female patients with unilateral and bilateral osteoarthritis (OA) of the hip. Methods: This study enrolled 57 and 43 female patients with unilateral and bilateral advanced OA, respectively. Muscle composition of the glutei medius and minimus and the upper portion of the gluteus maximus was evaluated by computed tomography for planning unilateral total hip arthroplasty. The cross-sectional area ratio of the individual composition to the total muscle was calculated. Correlation coefficients were calculated to determine associations between age and muscle composition variables. Results: Comparison of hip abductor muscle composition between the affected and the contralateral sides in unilateral OA patients showed increased fatty infiltration in the muscles around the affected joint. Comparison of the composition around bilateral OA between the joint scheduled for operation and the contralateral joint demonstrated enhanced fatty infiltration in the glutei medius and minimus but no increase in the gluteus maximus around the operation-scheduled joint. Comparison of muscle composition between unilateral and bilateral OA demonstrated similar fatty infiltration around the operation-scheduled joint whereas there was increased fatty infiltration around the contralateral joint of bilateral OA. Significant association was found between age and hip abductor muscle composition around both sides of unilateral OA. However, there was no association between age and hip abductor muscle composition around both sides of bilateral OA. Conclusions: There were significant differences in hip abductor muscle composition and its age-related alterations between female patients with unilateral and bilateral OA.
1. Introduction
In addition to sarcopenia, infiltration of adipose tissue in the skeletal muscles is now recognized as a common feature of aging and a cause of decline in muscle strength, muscle architecture, muscle contraction, and muscle capacity [1]. Recently, fatty infiltration in the hip abductor muscles has been found to be associated with hip osteoarthritis (OA) [2,3]. The hip abductor muscles are essential for hip function [4]. The hip abductors work to stabilize the hip joint and control pelvic posture during standing and walking [4]. Thus, hip abductor dysfunction causes hip instability and postural imbalance of the pelvis in walking.
Computed tomography (CT) is commonly employed for the evaluation of fatty infiltration in skeletal muscles. Of the hip abductors, the superficial muscles that exert their effect via insertion into the iliotibial band include the upper portion of the gluteus maximus and the tensor fascia lata. The deep abductors that act through insertion into the greater trochanter consist of the gluteus medius, the gluteus minimus, and the piriformis [5]. Each muscle of the hip abductors can be assessed by CT. In addition to the cross-sectional area measurement, CT has been used for detailed quantifications of structural muscle composition. High-density lean tissue or lean muscle mass (LMM), low-density lean tissue (LDL), and intramuscular fat (mFAT) are evaluated as the components of muscle composition [6,7]. Furthermore, intramuscular adipose tissue (IMAT), the adipose tissue beneath the deep fascia of a muscle, is generally evaluated.
Total hip arthroplasty (THA) is an effective treatment for patients with hip OA to improve physical function. Postoperative improvement in gait speed is associated with improvement in clinical outcomes [8,9]. Specific preoperative components of ipsilateral hip abductor muscle composition evaluated by CT may be associated with gait function after THA for patients with unilateral OA [7,10]. This suggests the importance of detailed evaluation of hip abductor muscle composition by CT before THA. Fatty infiltration in the skeletal muscles exacerbates during aging [11,12]. Fatty infiltration in the hip abductors is found in about 20% of the hips in people in their fifties, and 80% at age 70 and more [11]. In previous studies using CT density to compare adiposity between the hip joint with unilateral OA and its contralateral joint, fatty infiltration in the gluteus maximus [13] and the gluteus medius [14] increased around the affected joint. A recent study that enrolled patients with both unilateral and bilateral hip OA also demonstrated that fatty infiltration in the gluteus minimus expands with aging and hip OA progression [3]. However, those studies provided no CT-evaluated data on hip abductor muscle composition variables. At present, age-related alterations in the composition remain to be investigated.
There are potential differences in ipsilateral hip abductor muscle composition between female and male patients with unilateral hip OA [10]. Thus, the muscle composition should be evaluated separately in males and females. Actually, female OA patients exhibit greater functional impairment compared with males [15,16]. In addition, it is still uncertain whether age is associated with the hip abductor muscle composition in female patients with unilateral or bilateral OA. Thus, this cross-sectional study aimed to compare hip abductor muscle composition and its age-related alterations between female patients with unilateral and bilateral hip OA.
2. Materials and Methods
2.1. Ethics
After approval by the ethics committee of our hospital (Number zn240813 on 9 August 2024), this retrospective cross-sectional study was conducted using anonymized data with a general opt-out procedure. The present study followed the Guidelines for Good Clinical Practice and the Declaration of Helsinki.
2.2. Study Design and Patients
The inclusion criteria were female patients who underwent primary unilateral THA for hip OA and were able to walk independently with or without a cane before the operation, and age at operation of 20 years or more. After screening, we found 220 patients (ages at operation, 49 to 88 years) between January 2020 and February 2024. The exclusion criteria were a history of total knee arthroplasty (21 patients) or contralateral THA (61 patients), a history of hip surgical procedure (5 patients), and pain with knee OA (9 patients), which may affect hip abductor muscle composition. Hip deformity with Crowe types 2, 3, and 4 [17] (17 patients) was also excluded because alterations in the place of the muscle section caused by hip deformity could affect cross-sectional CT analysis. Furthermore, 7 patients with insufficient clinical data were excluded. As a result, 100 of the 220 female patients were enrolled in this study. Of the 100 patients, there were 57 and 43 patients with unilateral and bilateral OA, respectively. The severity of hip OA was evaluated based on the Kellgren–Lawrence grading system [18]. Grade 0 signifies no presence of OA. Grade 1 shows doubtful narrowing of the joint space with possible osteophyte formation. Grade 2 demonstrates possible narrowing of the joint space with definite osteophyte formation. Grade 3 shows definite narrowing of joint space, moderate osteophyte formation, some sclerosis, and possible deformity of bony ends. Grade 4 demonstrates large osteophyte formation, severe narrowing of the joint space with marked sclerosis, and definite deformity of bone ends. Accordingly, the hip joints with unilateral and bilateral OA showed grade 3 or 4 while the contralateral joints in the patients with unilateral OA exhibited grade 0 or 1.
2.3. Assessment of Preoperative Disease Status
The Japanese Orthopaedic Association (JOA) hip score [19] at the time of CT examination for preoperative planning was used to evaluate preoperative disease status. The JOA hip score consists of four subcategories—pain (score range, 0 to 40), range of motion (ROM) (score range, 0 to 20), gait ability (score range, 0 to 20), and activities of daily living (ADL) (score range, 0 to 20)—giving a total score range of 0 to 100. The details of the JOA score are shown in Appendix A.
2.4. Hip Abductor Muscle Composition Assessment by CT
Using CT taken for preoperative planning within three weeks before THA, the muscle composition of the glutei medius and minimus (Gmed+min) and the gluteus maximus (Gmax) on both right and left sides was evaluated on a single axial CT slice at the lower end of the sacroiliac joint [7,10]. The inferior point of the sacroiliac joint is the appropriate site for the measurement of the cross-sectional area of the gluteus medius in hip OA patients because the area at this level is associated with muscle volume and muscle strength [20]. The upper portion of Gmax was evaluated almost exclusively at this level because the upper portion arises from the posterior iliac crest whereas the lower portion originates from the inferior sacrum and upper lateral coccyx [5]. Standardization of the pelvic position during imaging ensured that the line connecting the anterior superior iliac crest on both sides was vertical to the bed [20].
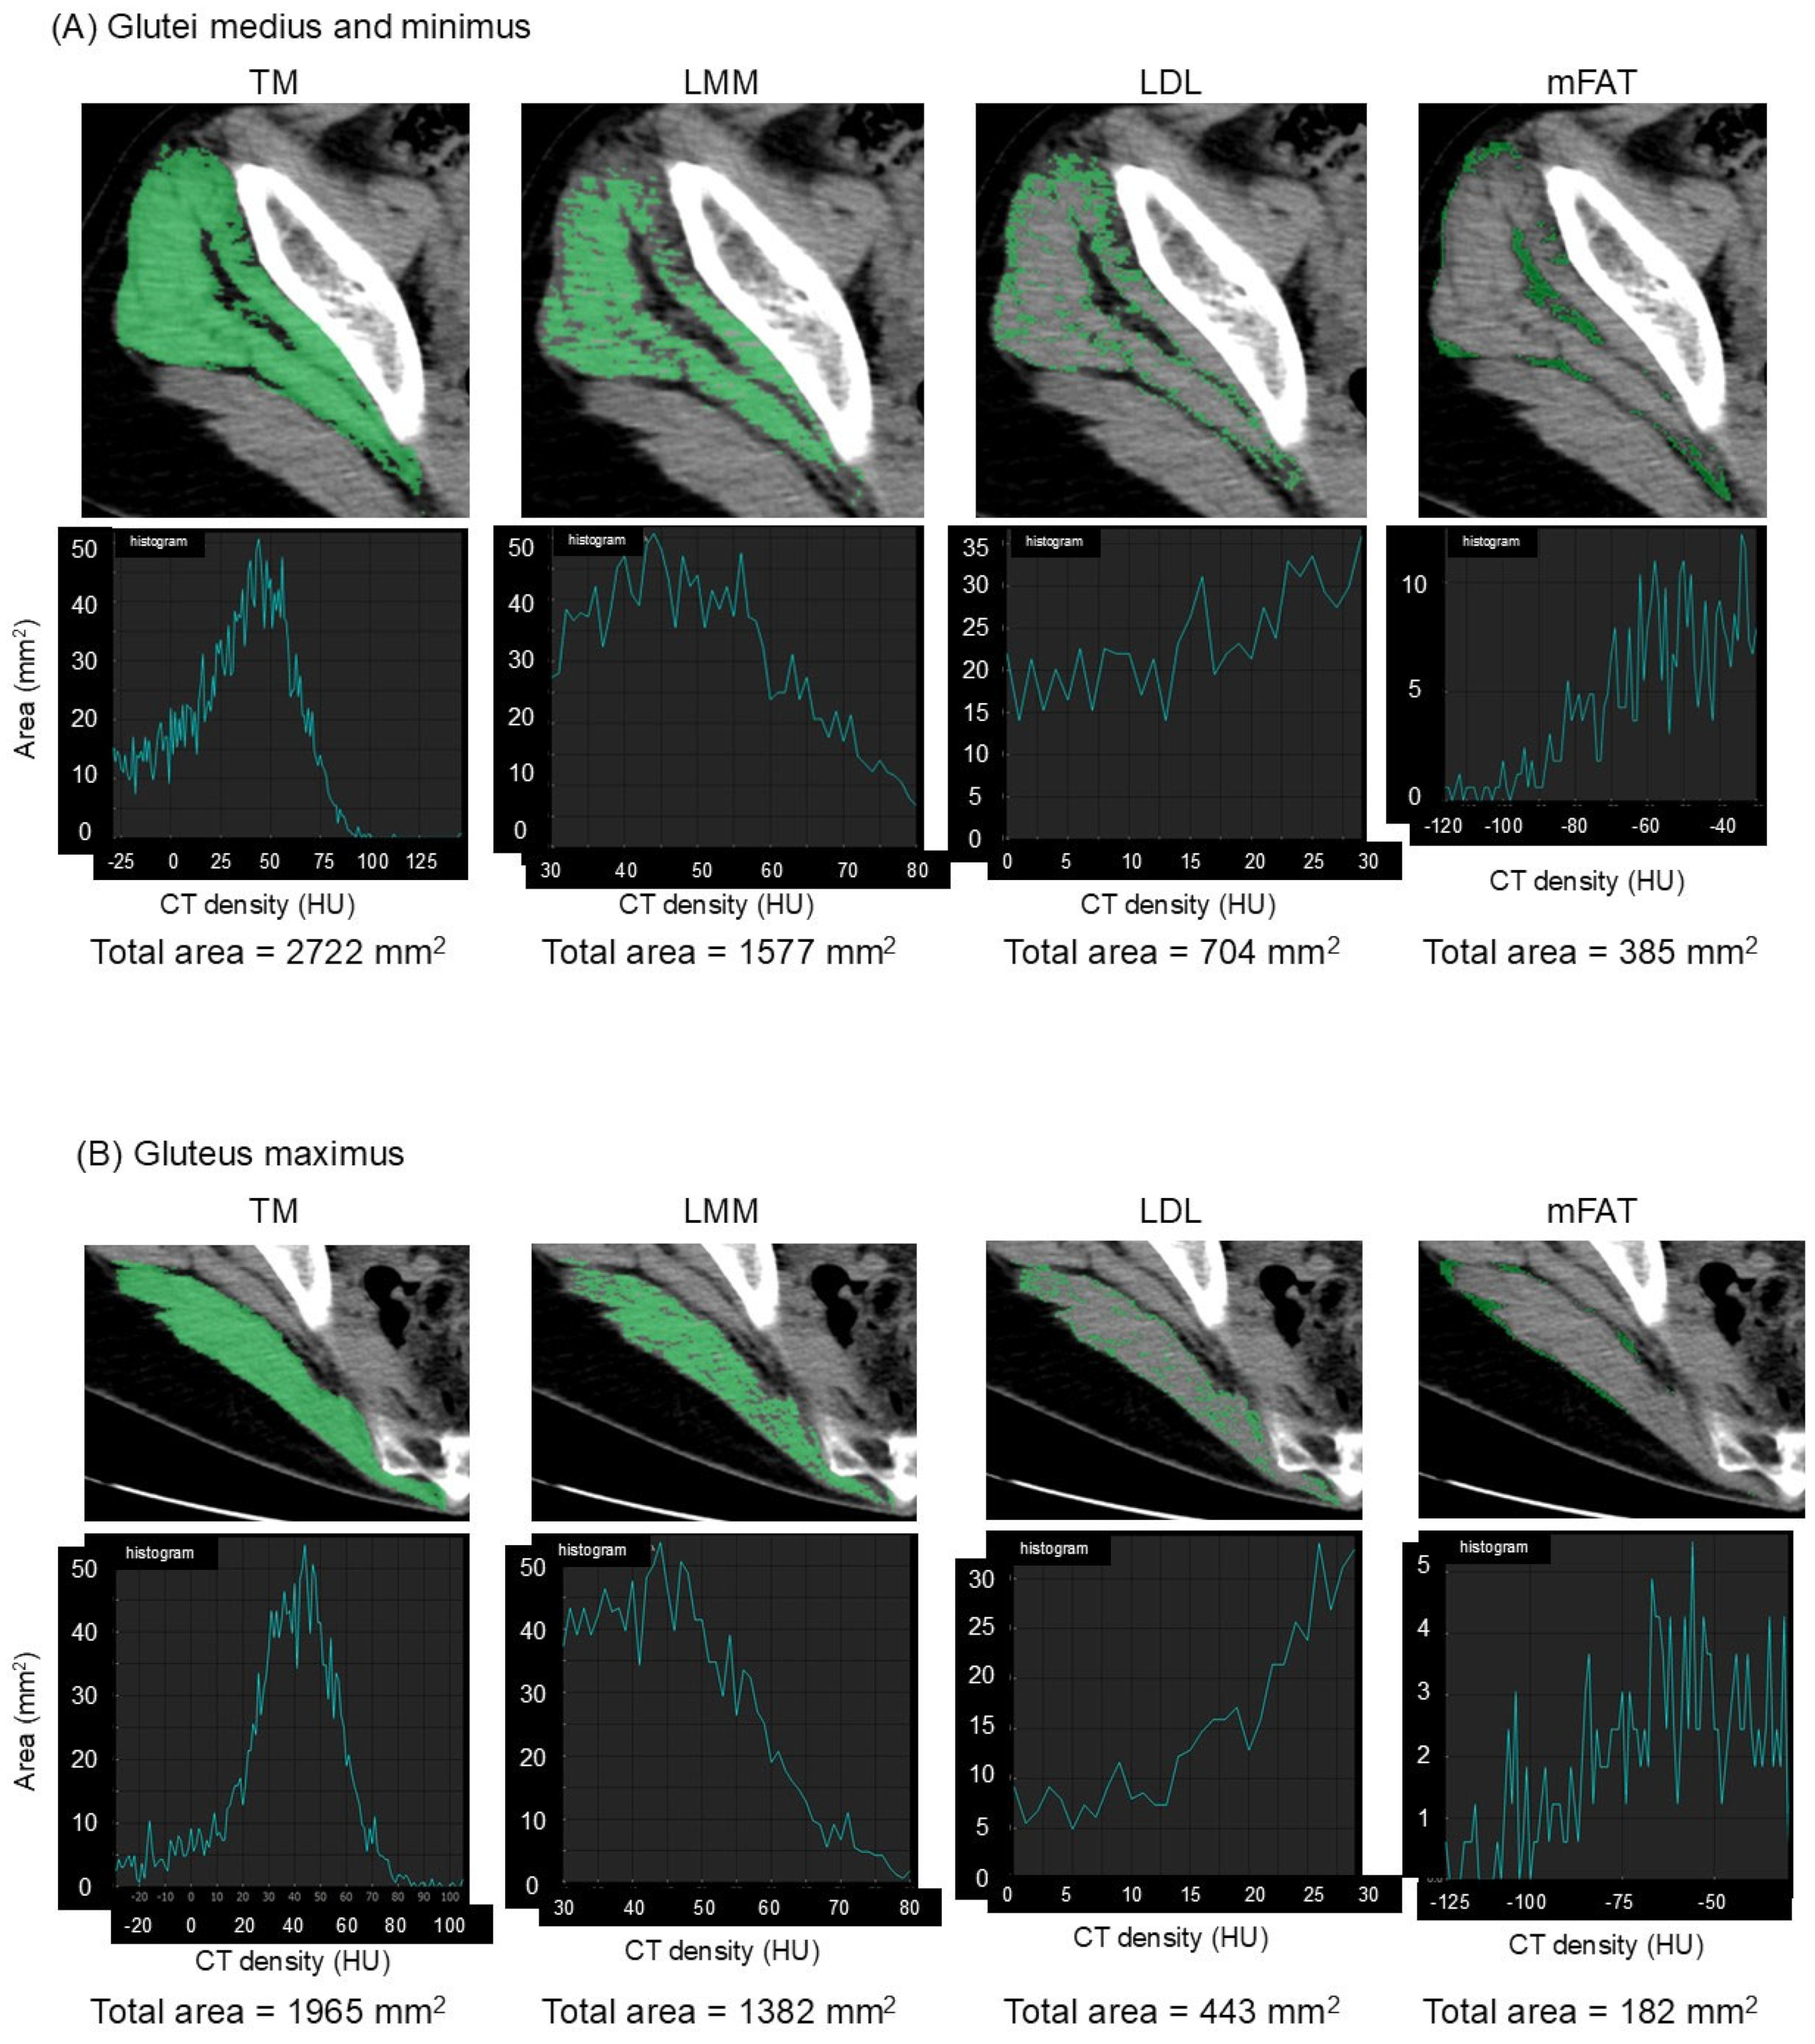
The muscles of interest were manually outlined and then automatically segmented according to attenuation values (−29 to 150 Hounsfield units (HU)) using SYNAPSE VINCENT software version 5.0 (Fujifilm Co., Tokyo, Japan) [7]. The software electronically calculated the cross-sectional area in mm2 of the segmented total muscle group (TM). High-density lean tissue that contains little fatty infiltration is a measure of LMM. Elevated levels of adipocytes between and within muscle fibers in LDL lead to decreased CT density compared with LMM. mFAT demonstrates the lowest CT density. Cross-sectional areas in mm2 of LMM, LDL, and mFAT within each TM were calculated electronically using the software as the areas of pixels based on the definition by attenuation values: 30 to 80 HU for LMM, 0 to 29 HU for LDL, and −190 to −30 HU for mFAT [6,7,10]. Representative CT images and histograms of the areas of pixels for muscle composition measurement are demonstrated in Figure 1. IMAT was defined as the summation of the areas of LDL and mFAT [6,7,10]. As already described in a previous study [7], the intra-class correlation coefficient was 0.98–0.99 for muscle composition measurement. The area of TM or each component was normalized for the square of the patient′s height (cm2/m2). Alternatively, LMM, LDL, mFAT, and IMAT were normalized for the respective muscle′s size by calculating a percentage of each measure relative to TM [6,7,10], designated as LMM/TM, LDL/TM, mFAT/TM, and IMAT/TM.

Figure 1.
Measurement of muscle composition on an axial image of computed tomography. Total muscle cross-sectional area (TM) of the glutei medius and minimus (A) and the upper portion of the gluteus maximus (B) is segmented using the threshold of −29 to 150 Hounsfield units (HU). Lean muscle mass (LMM), low-density lean tissue (LDL), and intramuscular fat (mFAT) are colored as pixels with density of 30 to 80 HU, 0 to 29 HU, and −190 to −30 HU, respectively, within each segmented TM, as shown in the upper panels. Histograms of the areas of pixels with their summations (total area) for each muscle composition are shown in the lower panels.
2.5. Statistical Analysis
The normality of the data was assessed by Shapiro–Wilk test. Pairwise comparisons were made between muscle composition variables on the operation-scheduled and the contralateral sides by paired t-test or 2-sample Wilcoxon′s rank sum test according to the data distribution. Comparisons were made between muscle composition variables in patients with unilateral and bilateral OA by t-test or Mann–Whitney U test depending on the data distribution. Pearson (r) or Spearman (ρ) correlation coefficients were calculated to determine associations between muscle composition variables and ages at the time of CT examination before THA based on the data distribution. Differences were considered to be statistically significant at p < 0.05. All analyses were performed using SPSS version 26 (IBM Corporation, Armonk, NY, USA). Our preliminary estimate of 10 patients with unilateral hip OA found potential association between age and preoperative variables of the contralateral hip abductors with Pearson′s correlation of r = 0.43. Based on this preliminary correlation, a priori power analysis by the two-sided bivariate normal model of correlation with G*power software 3.1 revealed that at least 40 patients would be necessary to detect significant differences, assuming a two-tailed type I error rate of 0.05 and a power of 80%.
3. Results
3.1. Demographic Data
The demographic data of the 57 patients with unilateral OA, the 43 with bilateral OA, and all the patients are shown individually in Table 1. There was no difference in ages, heights, weights, or body mass indexes at the time of CT examination for preoperative planning between the patients with unilateral and bilateral OA.

Table 1.
Demographic data.
3.2. Preoperative Disease Status
The disease status of the female OA patients at the time of CT examination for preoperative planning was assessed using the JOA hip score (Table 2). In the patients with unilateral or bilateral OA, pain, ROM, and total scores were significantly exacerbated in the hip joints scheduled for THA compared with the contralateral joints. When the disease status of the hip joint scheduled for operation was compared between unilateral and bilateral OA, ROM and total scores were lower in the patients with bilateral OA. There was no difference in pain on the operation-scheduled side between unilateral and bilateral OA. When the contralateral joint status was compared between unilateral and bilateral OA, pain, ROM, and total scores were worse in the patients with bilateral OA. No difference was found in gait ability or ADL between the patients with unilateral and bilateral OA.
Table 2.
The Japanese Orthopaedic Association hip score of the operation-scheduled and the contralateral hip joints in the female patients with unilateral and bilateral osteoarthritis.
3.3. Hip Abductor Muscle Composition
Hip abductor muscle composition variables on the operation-scheduled and the contralateral sides of unilateral and bilateral OA patients are demonstrated separately in Table 3. Of the composition variables of Gmed+min in unilateral OA, TM, LMM, and LMM/TM decreased on the operation-scheduled side compared with the contralateral side. LDL, mFAT, IMAT, LDL/TM, mFAT/TM, and IMAT/TM increased on the operation-scheduled side compared with the contralateral side. The muscle composition of Gmed+min in bilateral OA exhibited similar results with the exception of TM and LDL. Of the composition variables of Gmax in unilateral OA, TM, LMM, and LMM/TM reduced on the operation-scheduled side compared with the contralateral side. mFAT, IMAT, LDL/TM, mFAT/TM, and IMAT/TM elevated on the operation-scheduled side compared with the contralateral side. There was no difference in Gmax LDL between the two sides. When Gmax composition variables were compared between the operation-scheduled and the contralateral sides in bilateral OA, TM, LMM, and LMM/TM were lower on the operation-scheduled side. No difference was found in other variables of Gmax between the two sides. Comparison of hip abductor muscle composition variables on the operation-scheduled side between unilateral and bilateral OA demonstrated no difference in any variables. When muscle composition variables of Gmed+min on the contralateral side were compared between unilateral and bilateral OA, LMM and LMM/TM were lower in bilateral OA while LDL, mFAT, IMAT, LDL/TM, mFAT/TM, and IMAT/TM were higher in bilateral OA. There was no difference in TM of Gmed+min on the contralateral side. When Gmax composition variables on the contralateral side were compared between unilateral and bilateral OA, TM, LMM, and LMM/TM were smaller in bilateral OA while mFAT, LDL/TM, mFAT/TM, and IMAT/TM were larger in bilateral OA. No difference was found in LDL or IMAT of Gmax on the contralateral side.
Table 3.
Hip abductor muscle composition on the operation-scheduled and the contralateral sides in the female patients with unilateral and bilateral osteoarthritis.
3.4. Association Between Age and Hip Abductor Muscle Composition
3.4.1. Unilateral Osteoarthritis of the Hip
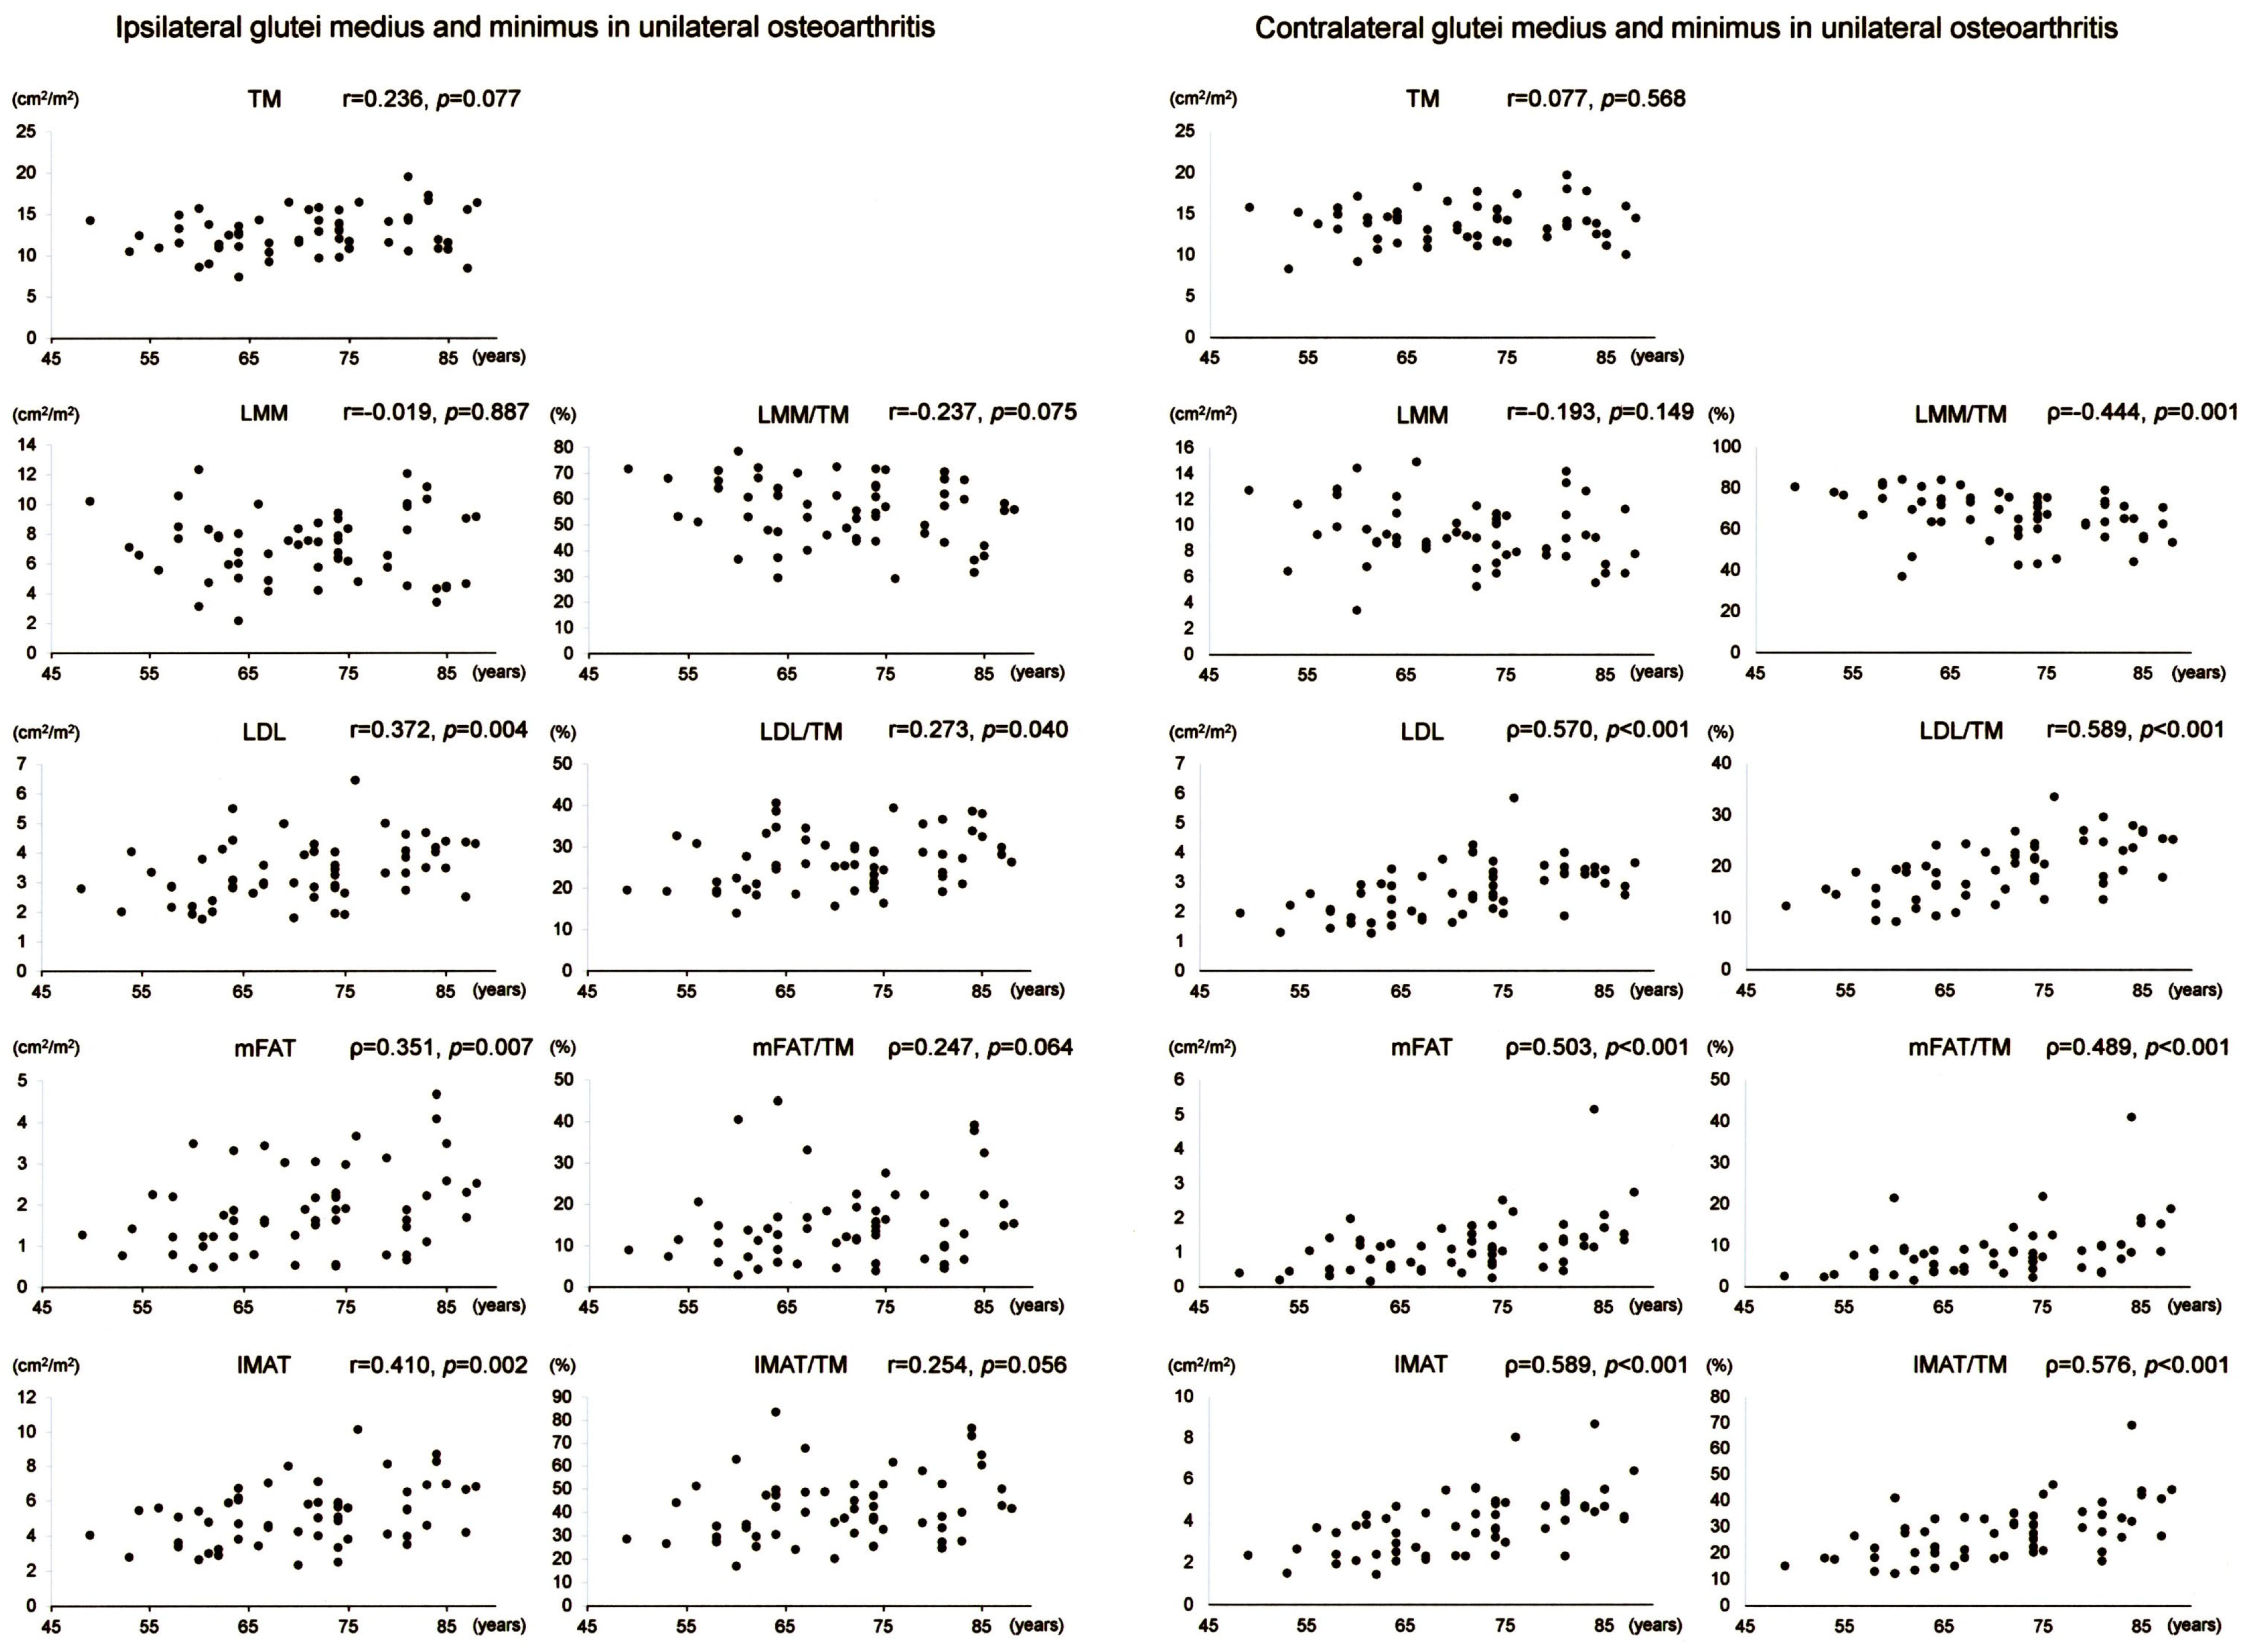
Scatter plots with correlation coefficients and p-values are shown for each muscle composition variable of Gmed+min in Figure 2. Of the Gmed+min variables on the operation-scheduled side in unilateral OA, LDL, mFAT, IMAT, LDL/TM, and IMAT/TM demonstrated positive correlations with age. Of the Gmed+min variables on the contralateral side in unilateral OA, LDL, mFAT, IMAT, LDL/TM, mFAT/TM, and IMAT/TM exhibited positive correlations with age while LMM/TM showed a negative association with age.
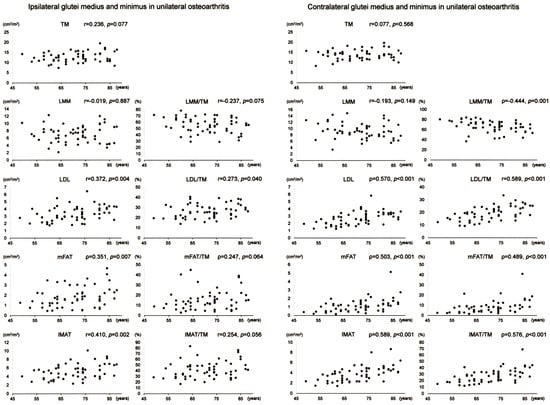
Figure 2.
Association between age and muscle composition of the glutei medius and minimus in female patients with unilateral osteoarthritis of the hip. Scatter plots with correlation coefficients and p-values are shown for each muscle composition variable on the operation-scheduled (ipsilateral) and the contralateral sides. TM, segmented total muscle cross-sectional area; LMM, lean muscle mass area; LDL, low-density lean tissue area; mFAT, intramuscular fat area; IMAT, intramuscular adipose tissue area.
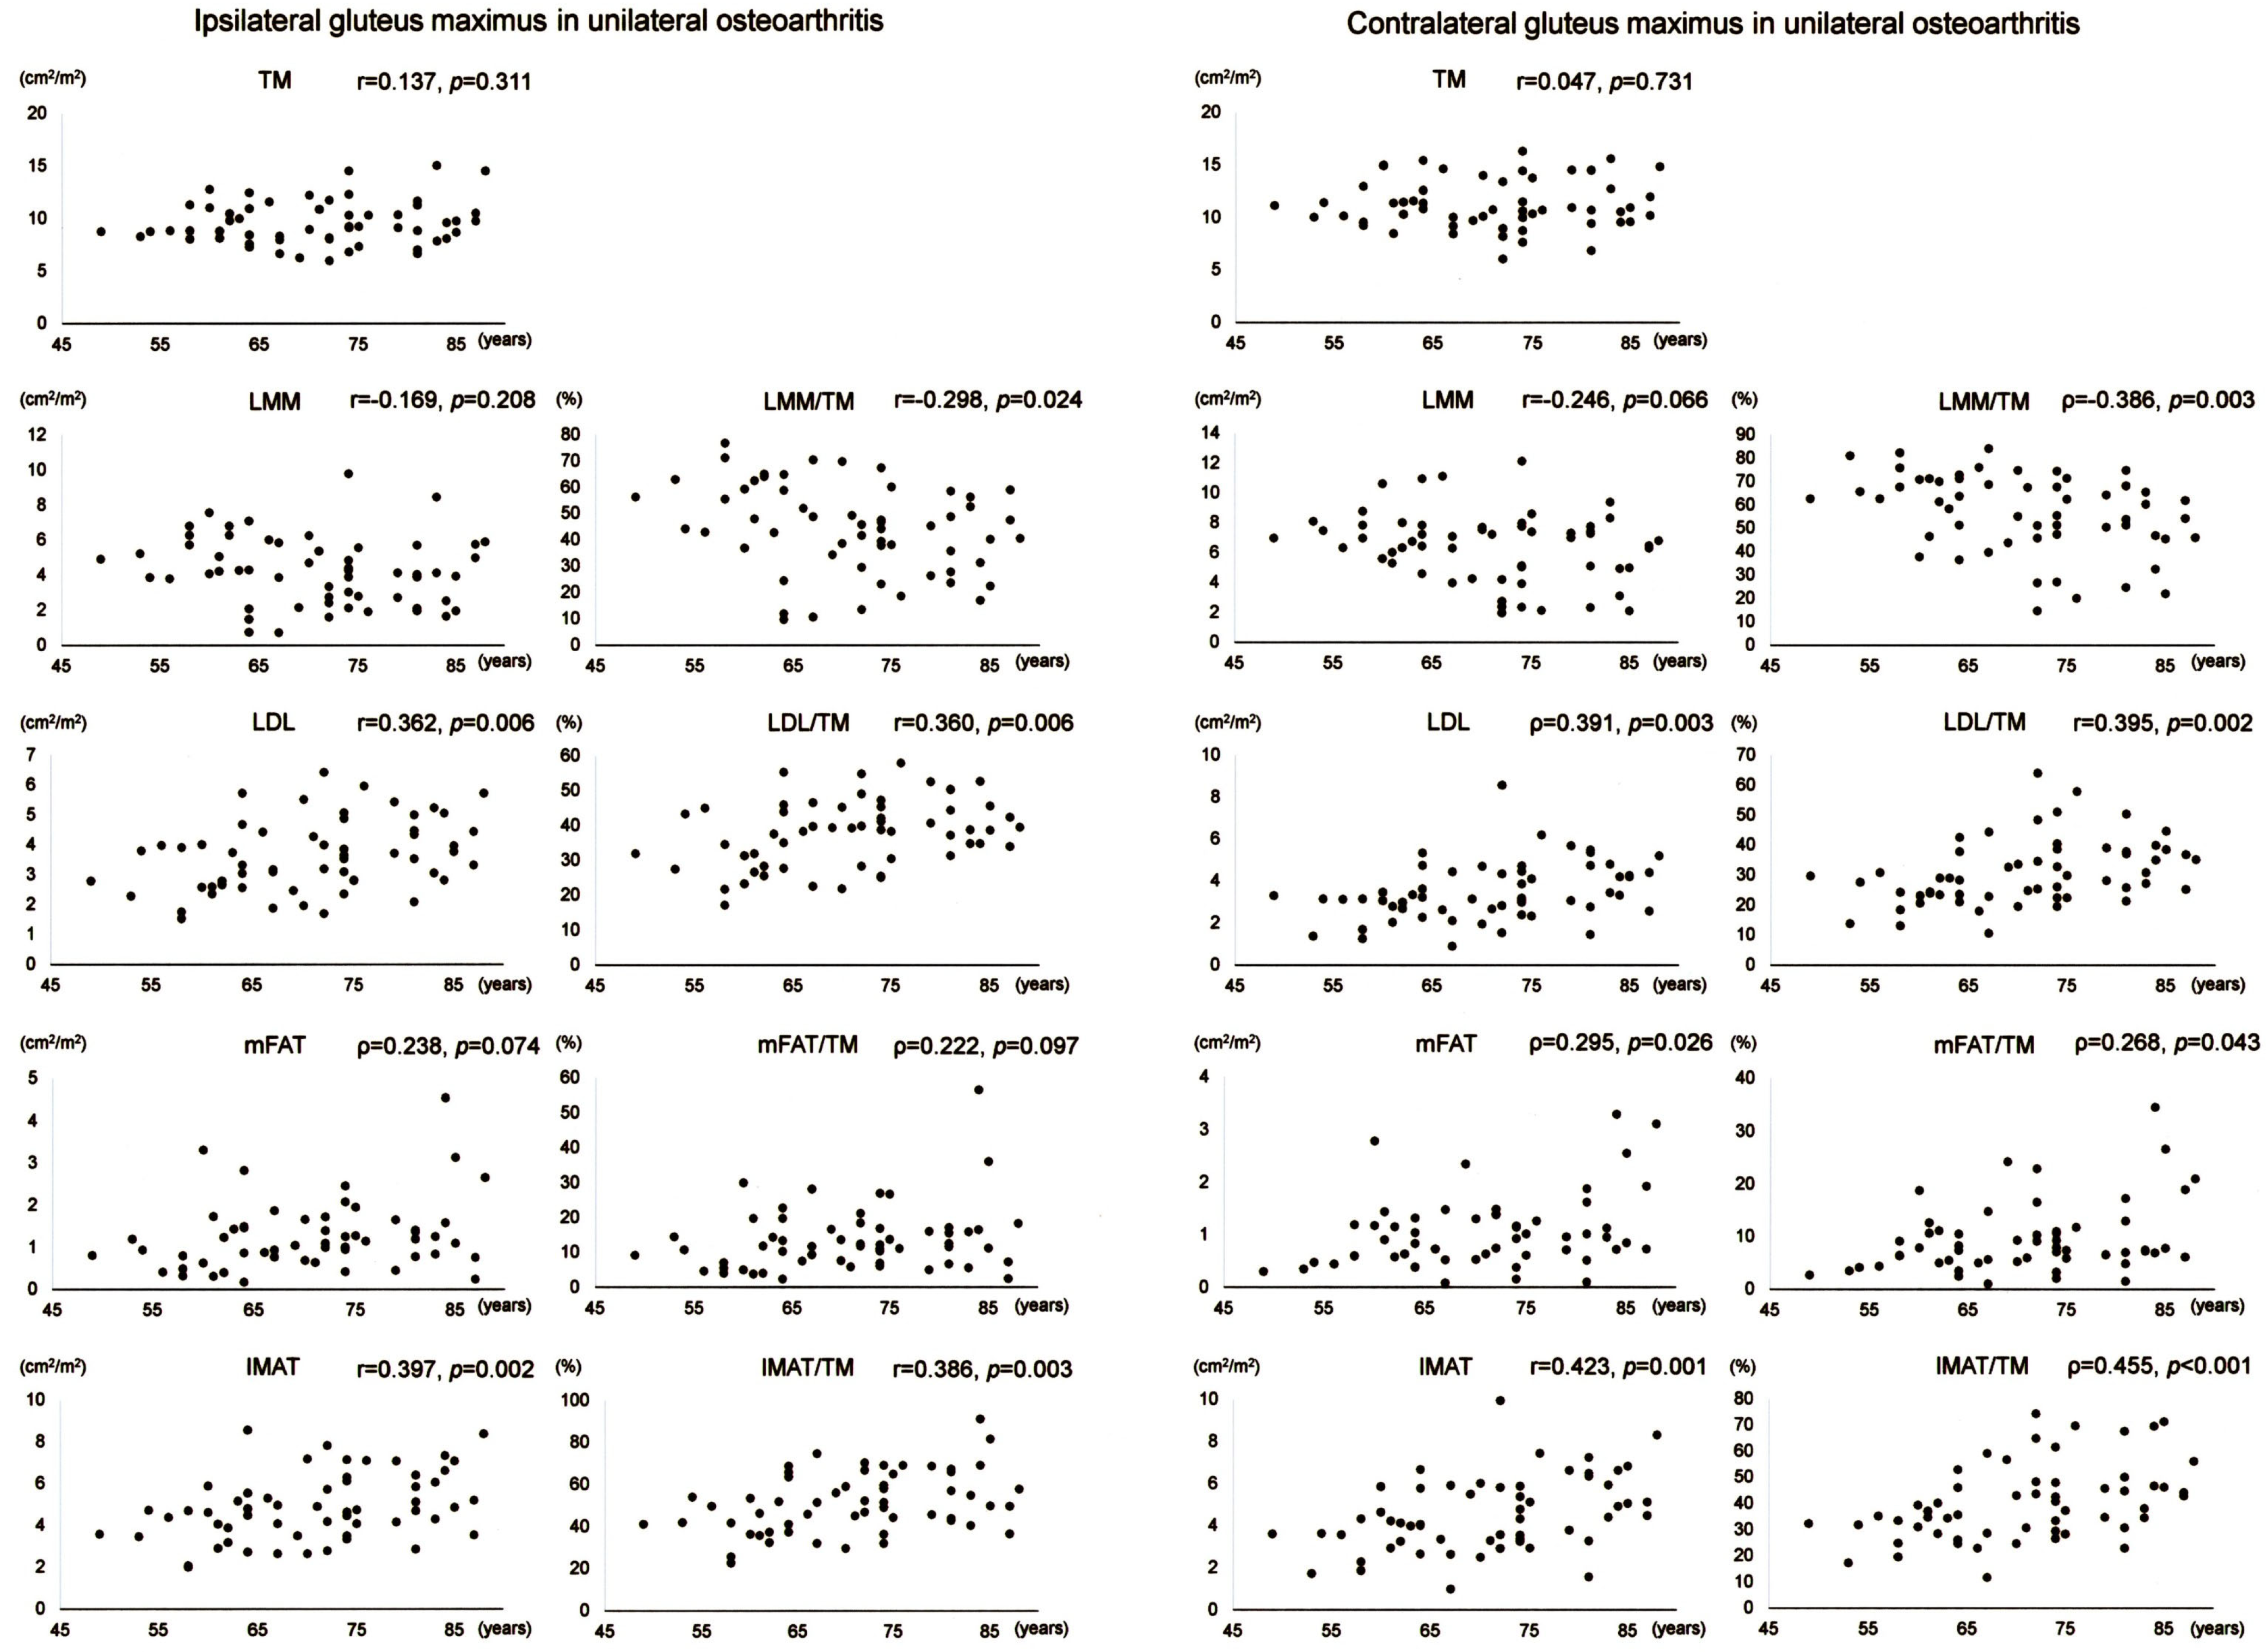
Scatter plots with correlation coefficients and p-values are shown for each muscle composition variable of Gmax in Figure 3. Of the Gmax variables on the operation-scheduled side in unilateral OA, LDL, IMAT, LDL/TM, and IMAT/TM showed positive correlations with age while LMM/TM demonstrated a negative association with age. Of the Gmax variables on the contralateral side in unilateral OA, LMM and LMM/TM demonstrated negative associations with age while LDL, mFAT, IMAT, LDL/TM, mFAT/TM, and IMAT/TM showed positive correlations with age.
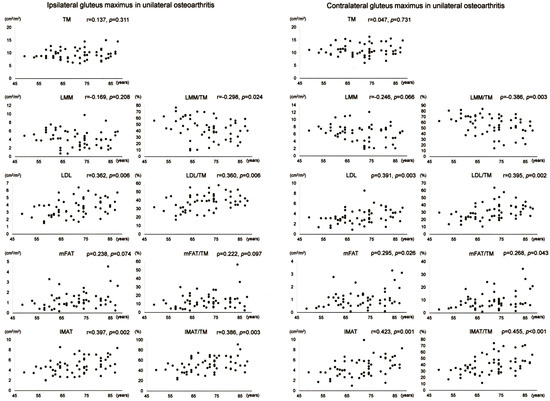
Figure 3.
Association between age and muscle composition of the gluteus maximus in female patients with unilateral osteoarthritis of the hip. Scatter plots with correlation coefficients and p-values are shown for each muscle composition variable on the operation-scheduled (ipsilateral) and the contralateral sides. TM, segmented total muscle cross-sectional area; LMM, lean muscle mass area; LDL, low-density lean tissue area; mFAT, intramuscular fat area; IMAT, intramuscular adipose tissue area.
3.4.2. Bilateral Osteoarthritis of the Hip
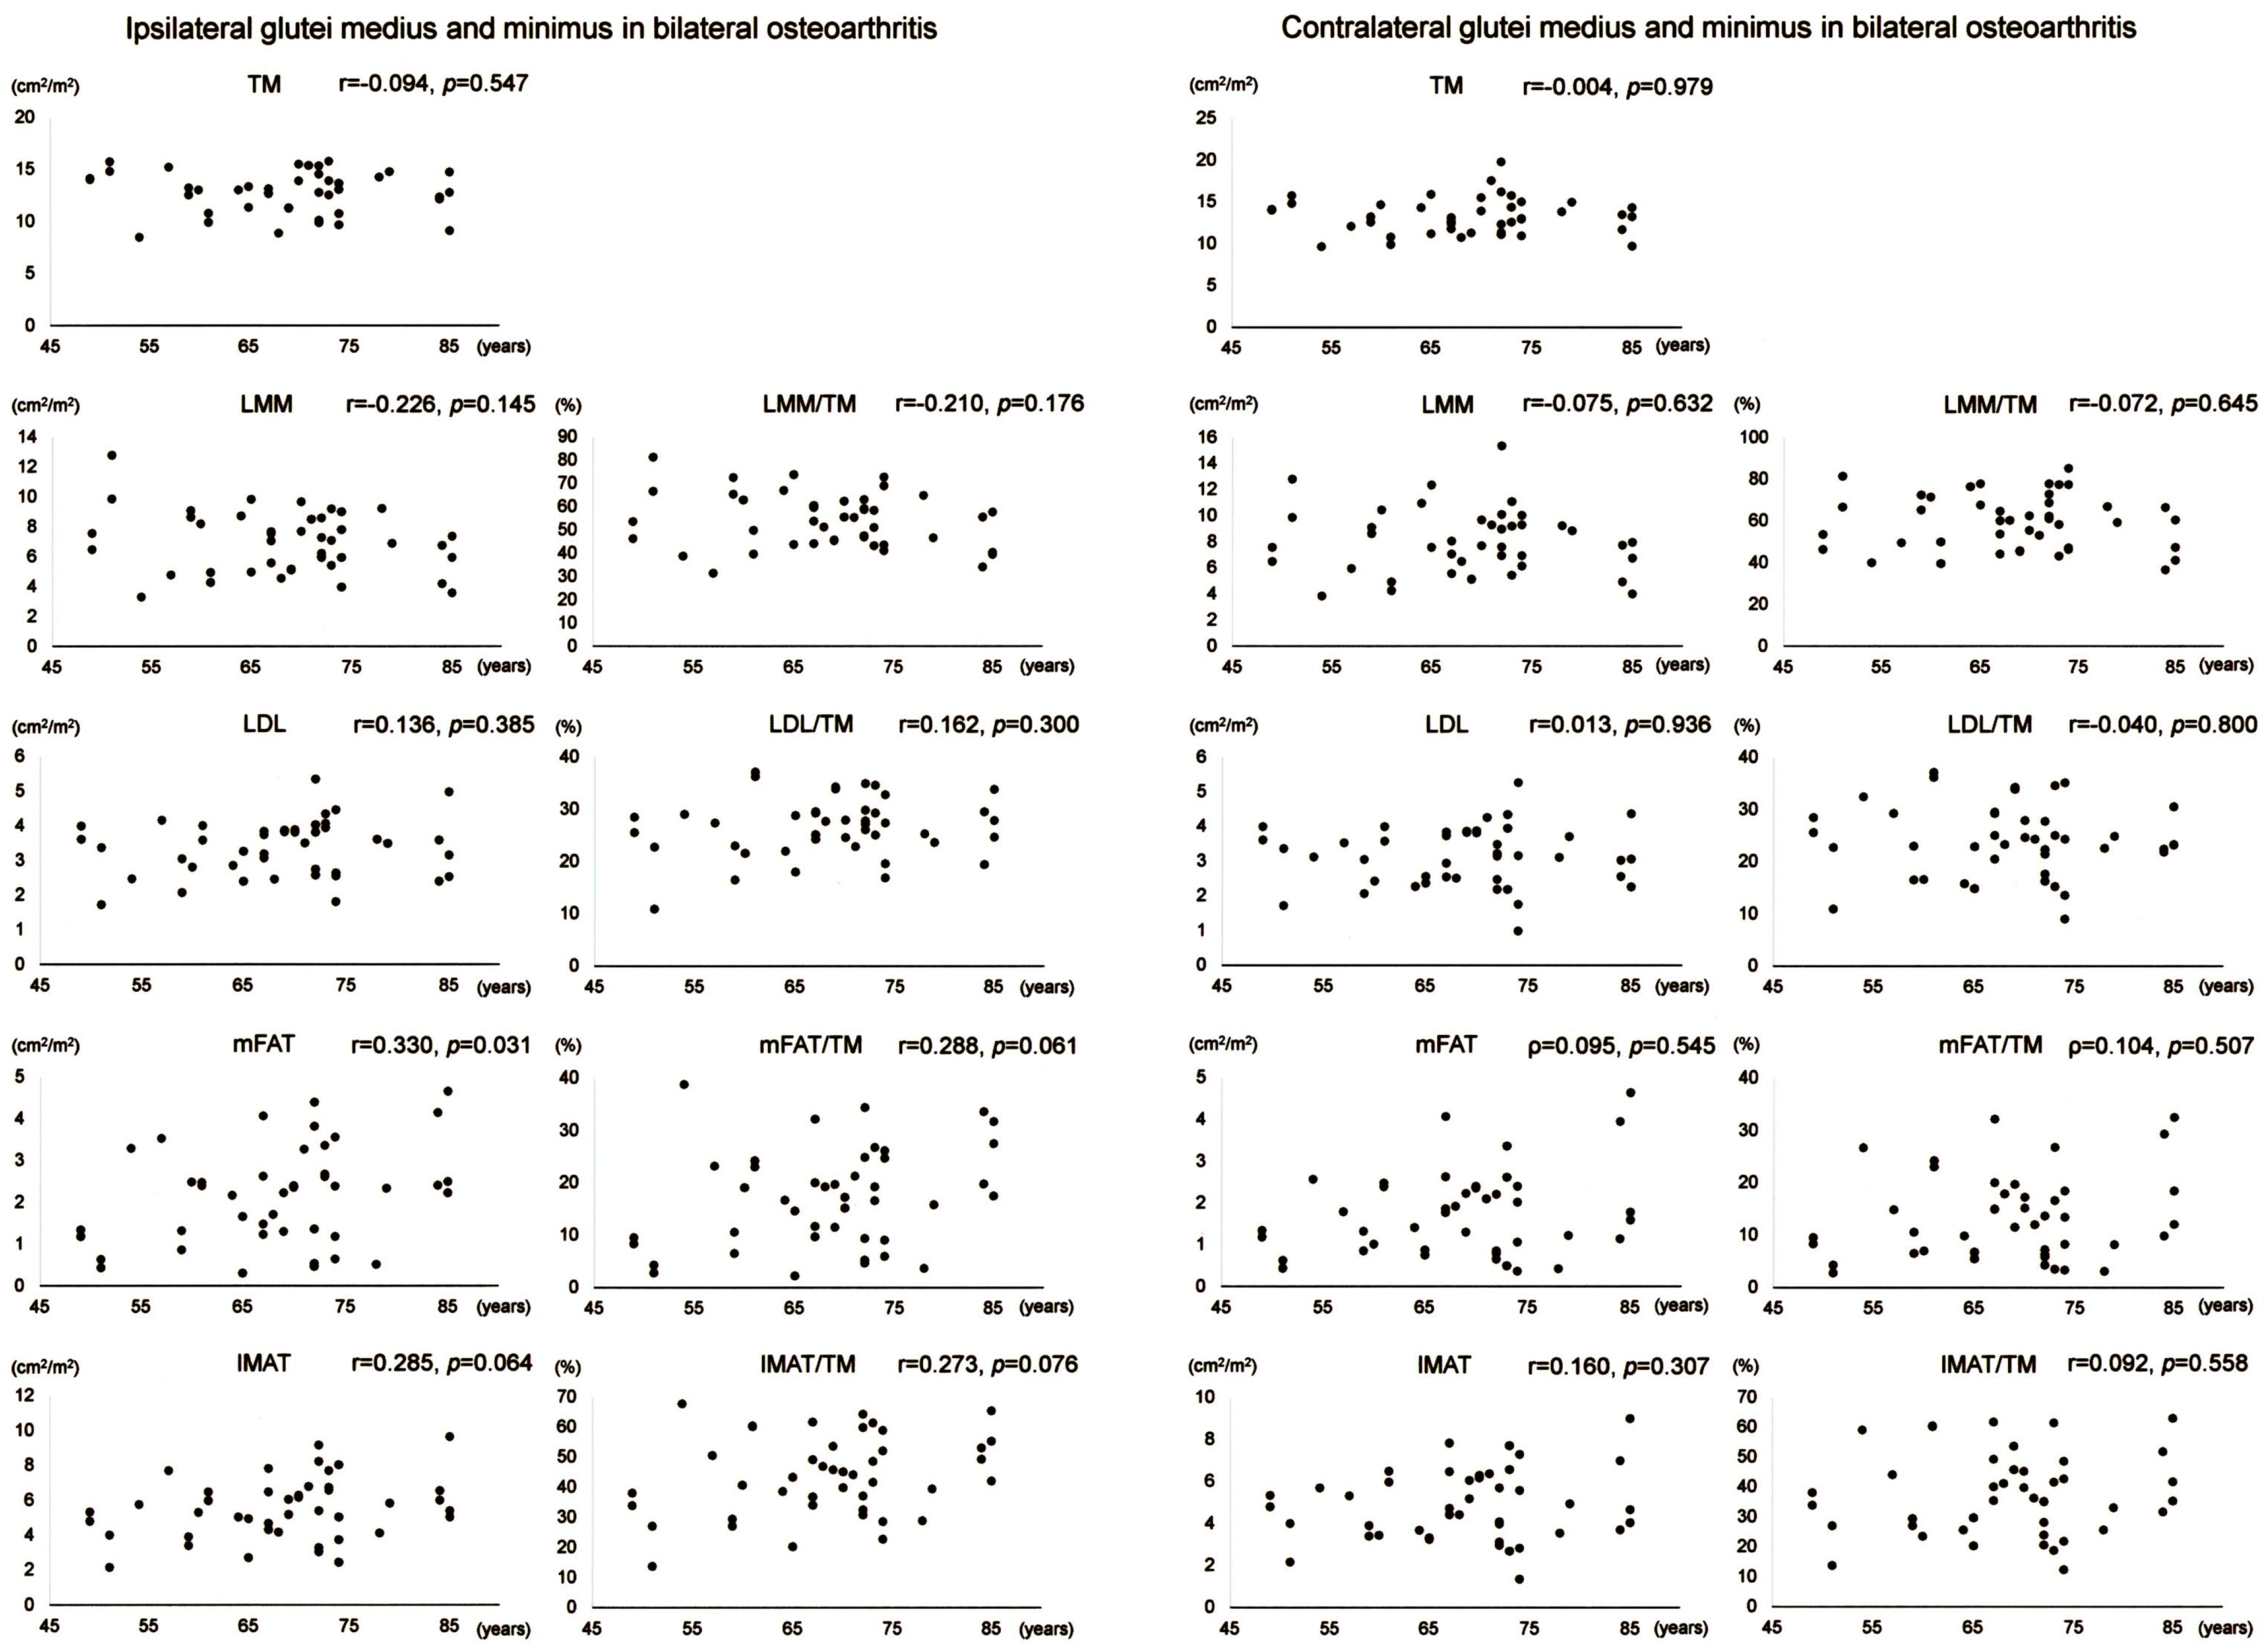
Scatter plots with correlation coefficients and p-values are shown for each muscle composition variable of Gmed+min in Figure 4. Gmed+min mFAT on the operation-scheduled side in bilateral OA showed a positive correlation with age. All variables of Gmed+min on the contralateral side in bilateral OA demonstrated no significant correlation with age.
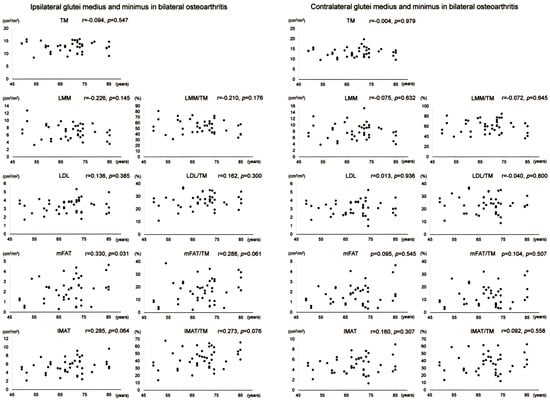
Figure 4.
Association between age and muscle composition of the glutei medius and minimus in female patients with bilateral osteoarthritis of the hip. Scatter plots with correlation coefficients and p-values are shown for each muscle composition variable on the operation-scheduled (ipsilateral) and the contralateral sides. TM, segmented total muscle cross-sectional area; LMM, lean muscle mass area; LDL, low-density lean tissue area; mFAT, intramuscular fat area; IMAT, intramuscular adipose tissue area.
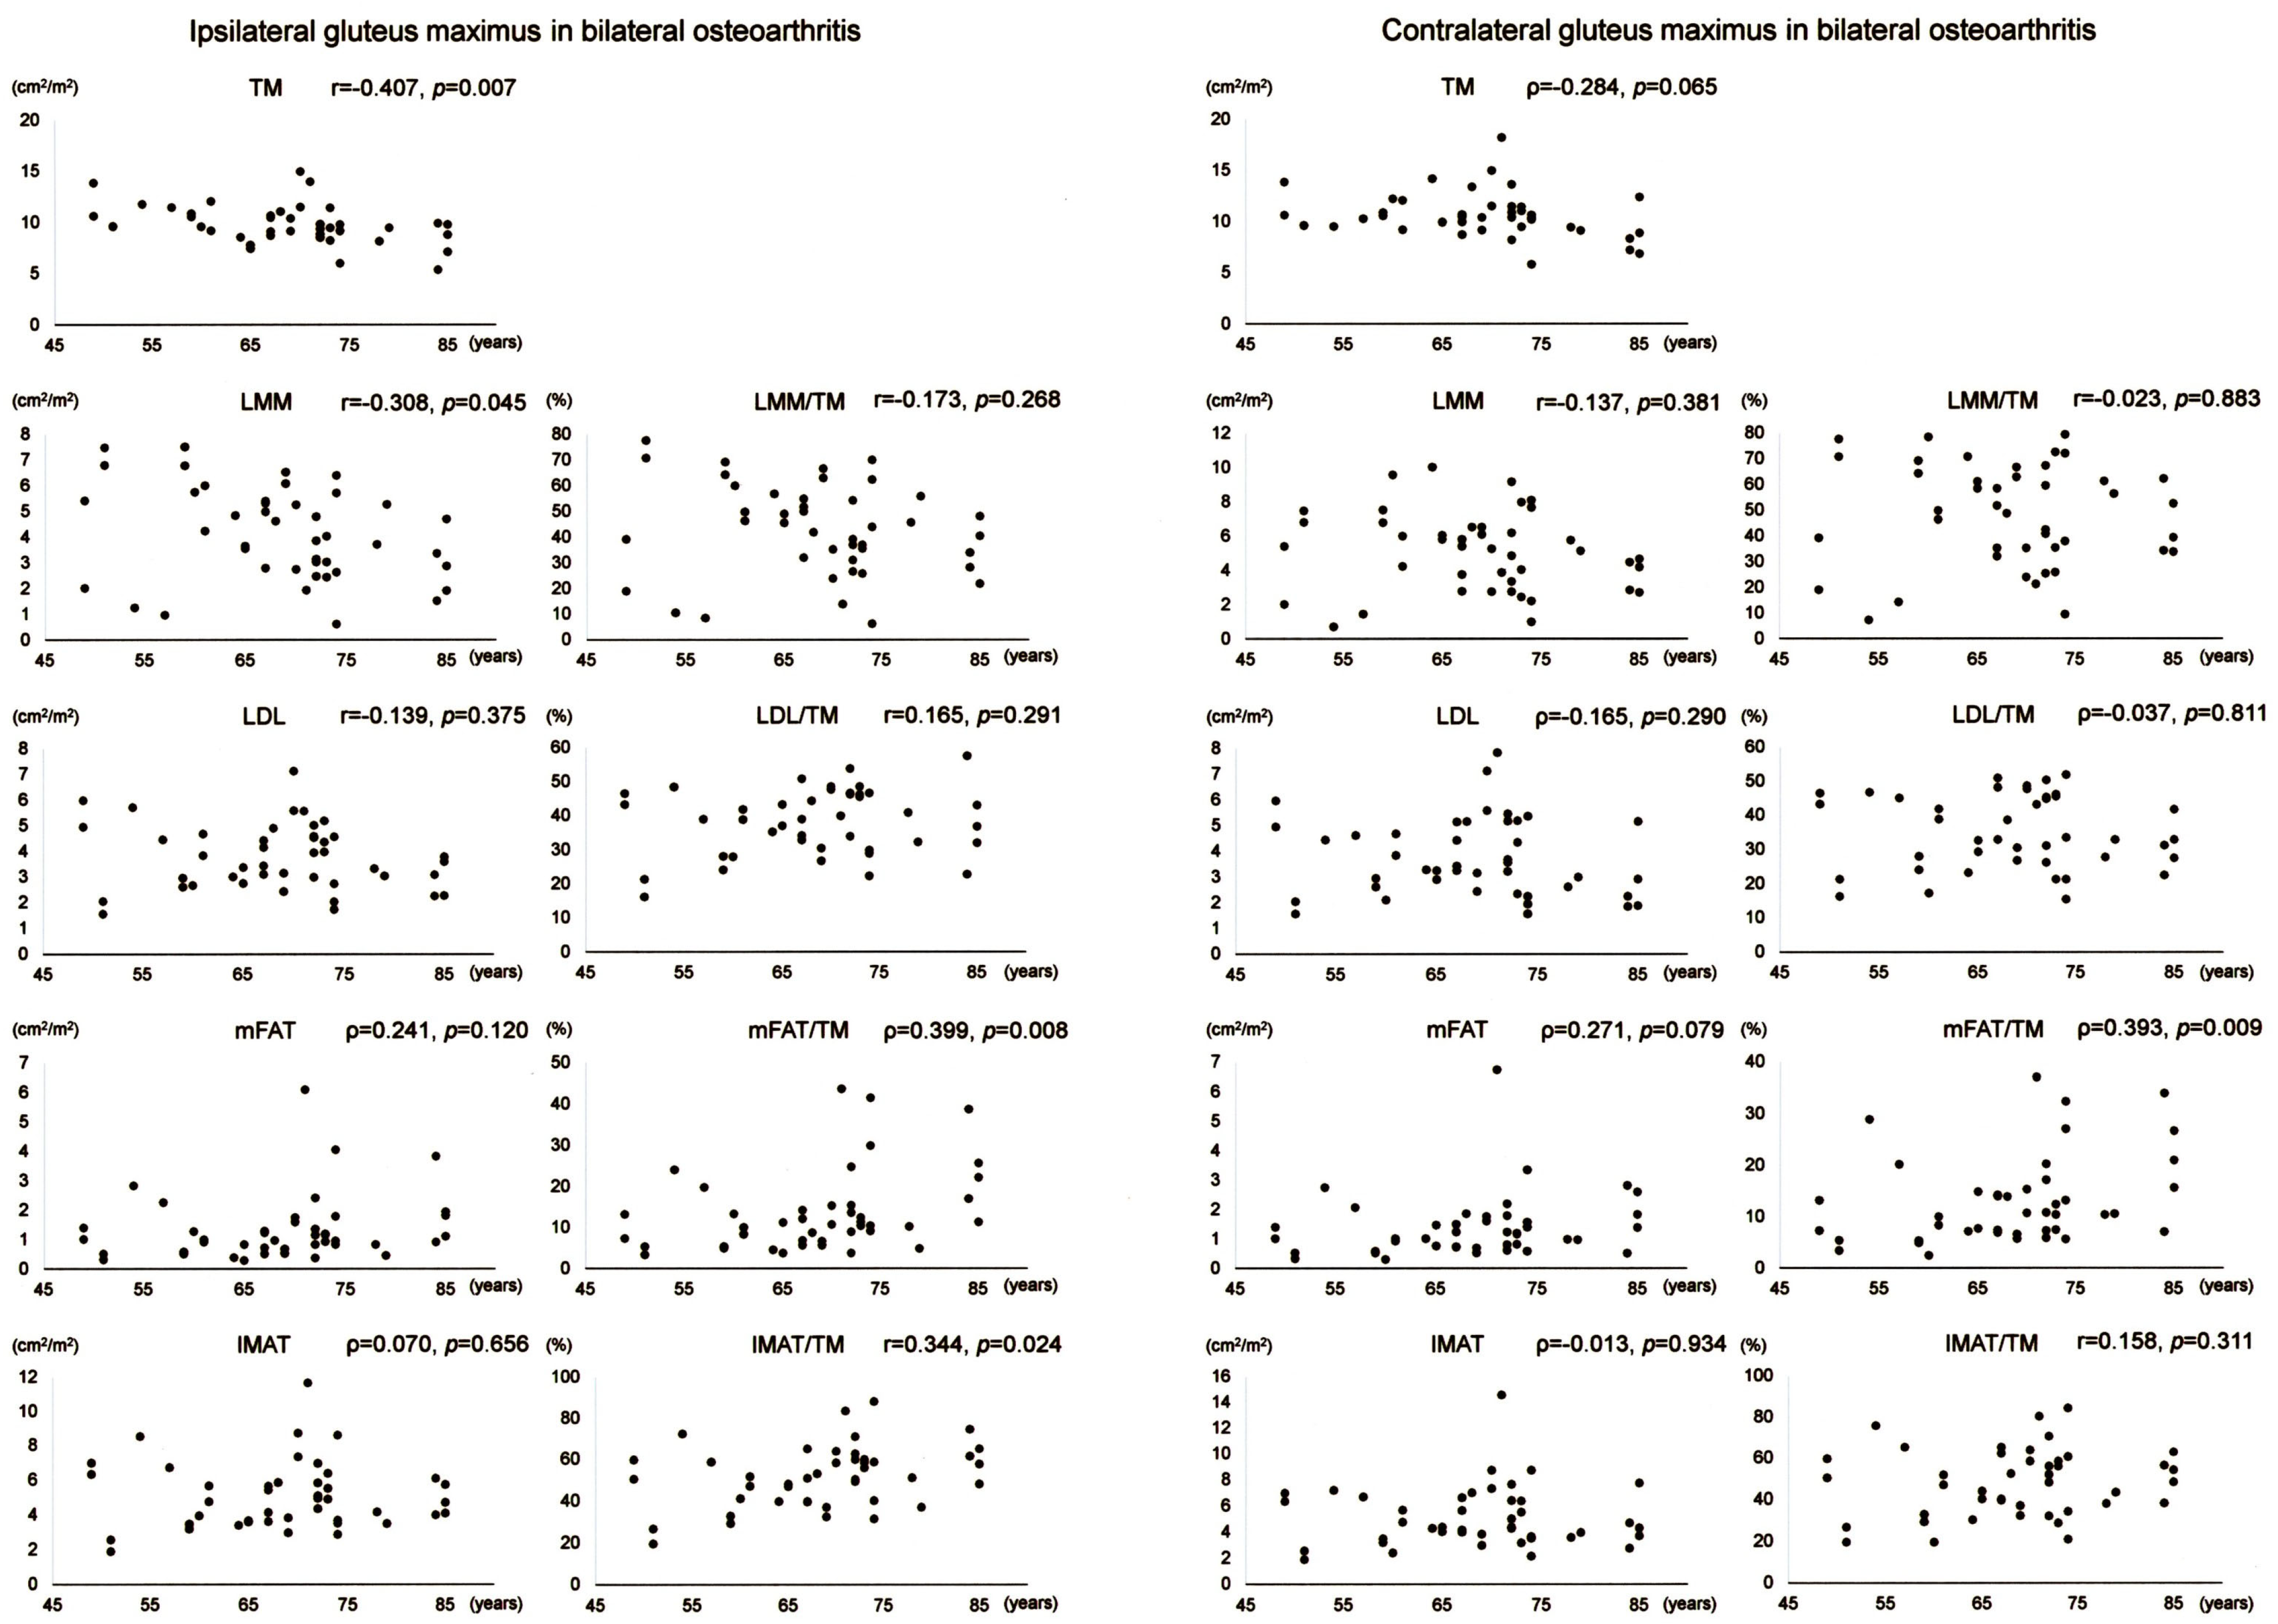
Scatter plots with correlation coefficients and p-values are shown for each muscle composition variable of Gmax in Figure 5. Of the Gmax variables on the operation-scheduled side in bilateral OA, TM showed a negative correlation with age while mFAT/TM and IMAT/TM exhibited positive correlations with age. Gmax mFAT/TM on the contralateral side in bilateral OA exhibited a positive correlation with age.
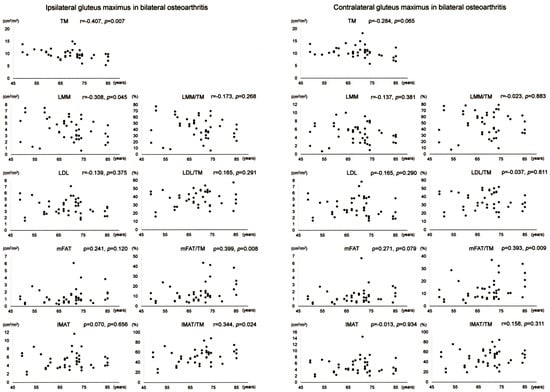
Figure 5.
Association between age and muscle composition of the gluteus maximus in female patients with bilateral osteoarthritis of the hip. Scatter plots with correlation coefficients and p-values are shown for each muscle composition variable on the operation-scheduled (ipsilateral) and the contralateral sides. TM, segmented total muscle cross-sectional area; LMM, lean muscle mass area; LDL, low-density lean tissue area; mFAT, intramuscular fat area; IMAT, intramuscular adipose tissue area.
4. Discussion
In the present study, the comparison of hip abductor muscle composition variables between the affected and the contralateral sides in the female patients with unilateral hip OA revealed decreases in the cross-sectional area and lean muscle mass and increases in fatty infiltration in the hip abductor muscles on the affected side. Severe pain and decreased ROM in the affected hip joints of the female patients with unilateral OA (Table 2) likely cause disuse of hip abductor muscles [2,14], leading to the alterations in hip abductor muscle composition on the affected side.
This study further compared hip abductor muscle composition between the operation-scheduled and the contralateral sides in the female patients with bilateral hip OA. The upper portion of Gmax showed smaller cross-sectional area and lean muscle mass on the operation-scheduled side compared with the contralateral side. In addition to smaller lean muscle mass, Gmed+min demonstrated increased fatty infiltration on the operation-scheduled side. The female patients with bilateral hip OA in the present study showed more severe pain and more limited ROM in the hip joint scheduled for THA compared with the contralateral joint (Table 2). The clinical severity of hip OA may affect muscle composition [13,21] and individual muscles are not uniformly affected by hip OA [22]. Thus, the differences in fatty infiltration in individual muscles could result from the differential clinical status of OA joints between the operation-scheduled and the contralateral sides.
When hip abductor muscle composition on the operation-scheduled side was compared between unilateral and bilateral OA, there was no difference in the hip abductor muscle composition. This finding may be due to similar clinical status of pain, gait ability, and ADL of the hip joint scheduled for operation in the patients with unilateral and bilateral OA (Table 2). When the composition on the contralateral side was compared between unilateral and bilateral OA, however, there were decreases in lean muscle mass and increases in fatty infiltration in bilateral hip OA. Disuse resulting from pain and limited ROM in the hip joint with end-stage OA potentially induces fatty infiltration in the hip abductors [23]. Because there was no difference in age between unilateral and bilateral OA patients (Table 1), pain and limited ROM on the contralateral side of bilateral OA of Kellgren–Lawrence grades 3 or 4 (Table 2) could enhance fatty infiltration in the hip abductor muscles in accordance with the previous findings [2,14].
Fatty infiltration into skeletal muscles is inevitable during normal aging [12]. Accordingly, the present study showed positive correlations between age and the fatty infiltration-related muscle components (LDL, mFAT, IMAT, LDL/TM, mFAT/TM, and IMAT/TM) of Gmed+min (Figure 2) and Gmax (Figure 3) on the contralateral side. In the hip abductor on the operation-scheduled side, significant but weaker associations were found between age and the fatty infiltration-related muscle components compared to the associations on the contralateral side. Fatty infiltration in the muscles around hip OA joint could also be induced by functional disuse resulting from OA [23], which is consistent with the lower ADL levels in the patients in this study (Table 2). Thus, functional disuse may cause some alterations in fatty infiltration in the hip abductor muscles on the affected side of unilateral OA. This is supported by the present finding that there was no clear association between age and the fatty infiltration-related muscle components in the hip abductors on both sides in the female patients with bilateral OA. In advanced bilateral OA of Kellgren–Lawrence grades 3 or 4, severe pain and decreased ROM likely cause disuse of bilateral hip abductor muscles [2,14], which could add significantly increased levels of fatty infiltration in the muscles [24]. A combination of age- and OA-related changes of fatty infiltration in the hip abductor muscles may also affect the correlations of age to the muscle composition in bilateral OA. When fatty infiltration in the hip abductors is evaluated by CT, therefore, both age- and OA-related alterations should be considered in the muscle composition around hip joints with Kellgren–Lawrence grade 3 or 4 OA.
There is a possibility that preoperative LMM/TM of Gmed+min on the affected side could predict gait speed improvement after THA for female patients with unilateral OA [10]. In addition, preoperative TM of Gmax on the affected side might differentiate unilateral OA female patients with clinically important improvement in gait speed after THA from those without the improvement [10]. No association of age with the two components of ipsilateral hip abductors around unilateral hip OA joints (Figure 2 and Figure 3) may enable the components to serve as a predictor of gait speed improvement after THA for female patients at various ages. Future studies are required to investigate whether the age-unrelated components may work similarly for bilateral OA. Overall, it is important to understand potential differences in hip abductor muscle composition and its age-related alterations between female patients with unilateral and bilateral OA to develop effective intervention programs that target the hip abductors to improve postoperative outcomes. Because aerobic exercise training may be helpful to decrease low-density muscle [25], one of the subjects of future investigation should be the effects of preoperative aerobic exercise intervention on hip abductor muscle composition.
This study has several limitations. First, this was a monocentric retrospective study with a cross-sectional design. Age-related changes in hip abductor muscle composition should be investigated in future longitudinal studies. Second, the pelvic alignment and other confounding factors were not assessed in this study. Alterations in the place of muscle sections caused by pelvic alignment could affect cross-sectional CT analysis. Third, it remains uncertain whether male patients with hip OA or patients with severe hip deformity may demonstrate similar results. Fourth, muscle composition was assessed on a single axial CT slice. Although the cross-sectional area of the gluteus medius measured at the inferior point of the sacroiliac joint correlates with both the muscle volume and peak isometric strength [14], measurements in axial CT images are potentially variable and may depend on the place of section. Normalization of each muscle component for the respective muscle′s size by calculating a percentage of each measure relative to the total cross-sectional area adopted in the present study might eliminate the potential variations of axial CT sections. Fifth, this study provides no data on association between muscle composition and functional assessment. Significant association has already been shown between hip abductor muscle composition evaluated preoperatively by CT and preoperative gait function such as gait speed in female patients with hip OA [10]. However, further studies are required to validate correlation of hip abductor muscle composition measured by the CT software (SYNAPSE VINCENT version 5.0) with muscle function such as strength related to fatty infiltration by aging and/or hip OA.
5. Conclusions
This monocentric cross-sectional study clarified differences in fatty infiltration in hip abductor muscles and its age-related alterations between female patients with unilateral and bilateral hip OA of Kellgren–Lawrence grades 3 or 4. CT evaluation of muscle composition can offer accurate information on fatty infiltration, which may be helpful to develop intervention programs for preventing hip abductor dysfunction caused by OA.
Author Contributions
Conceptualization, T.Y.; methodology, T.Y.; software, T.Y.; validation, S.O., H.T. and E.O.; formal analysis, T.Y.; investigation, T.Y., S.M., S.Y. and Y.T.; resources, T.Y.; data curation, T.Y., S.O. and E.O.; writing—original draft preparation, T.Y.; writing—review and editing, T.Y., S.M., S.Y. and Y.T.; visualization, T.Y.; supervision, T.Y., S.O. and E.O.; project administration, T.Y. All authors have read and agreed to the published version of the manuscript.
Funding
This research received no external funding.
Institutional Review Board Statement
This study was approved by the ethics committee of Kobe City Medical Center General Hospital (Number zn240813 on 9 August 2024).
Informed Consent Statement
As this was a retrospective observational study, in which data were collected from medical records, an opt-out approach was used. Information regarding the study was provided on our homepage, and each participant′s consent to take part in the study was considered to be obtained unless they expressed their desire to be excluded. Any research article describing a study involving humans should contain this statement.
Data Availability Statement
The data that support the findings of this study are available from the corresponding author upon reasonable request.
Acknowledgments
The authors thank the radiological technologists at our hospital for their valuable support.
Conflicts of Interest
The authors declare no conflicts of interest.
Abbreviations
The following abbreviations are used in this manuscript:
| OA | Osteoarthritis |
| CT | Computed tomography |
| LMM | Lean muscle mass |
| LDL | Low-density lean tissue |
| mFAT | Intramuscular fat |
| IMAT | Intramuscular adipose tissue |
| THA | Total hip arthroplasty |
| JOA | Japanese Orthopaedic Association |
| ROM | Range of motion |
| ADL | Activities of daily living |
| Gmed+min | Glutei medius and minimus |
| Gmax | Gluteus maximus |
| HU | Hounsfield units |
| TM | Segmented total muscle group |
Appendix A. Japan Orthopaedic Association Hip Score
| Full Mark = 40 Points | ||
| A. Pain | Right | Left |
| A. None a | 40 | 40 |
| B. Ignores b | 35 | 35 |
| C. Slight c | 30 | 30 |
| D. Moderate d | 20 | 20 |
| E. Severe e | 10 | 10 |
| F. Unbearable f | 0 | 0 |
| a No pain and/or no complaints relating to hip joint. b No pain. Inconstant symptoms including weary feeling or dullness. c No spontaneous pain. Some pain when walking (including slight pain when starting to walk or after walking for long distance). d No spontaneous pain. Some pain when walking but which disappears quickly after a short rest. e Spontaneous pain. Pain is severe when attempting to walk; it decreases after a rest. f Continuous pain during rest and/or at night. | ||
| Full Mark = 20 Points | ||
| B. Range of Motion | Right | Left |
| Flexion arc | 0–12 | 0–12 |
| Abduction arc | 0–8 | 0–8 |
| Scores are determined by multiplying 10° of motion in each arc by 1 point in flexion and 2 points in abduction. The range of contracture should be subtracted. A flexion more than 120° is determined as 12 points and an abduction more than 30° as 8 points. Either flexion or abduction is measured in a neutral position on rotation and described by its arc by passive motion. | ||
| C. Ability to Walk | Full Mark = 20 Points |
| A. Normal a | 20 |
| B. Slight limp b | 18 |
| C. Mild limp c | 15 |
| D. Severe limp d | 10 |
| E. Difficult to walk e | 5 |
| F. Impossible f | 0 |
| a Able to walk long distance without limp. Able to walk fast. b Able to walk long distance including walking with a slight limp. Able to walk fast. c Able to walk 30 min or 2 km without support. Mild limp. d Able to walk 10–15 min or 50 m without support. e Able to do household activities. Difficult to do outdoor activities. Difficult to walk outdoors without bilateral supports. f Impossible or almost impossible to walk. | |
| Full Mark = 20 Points | |||
| D. Activities of Daily Life | Normal | Difficult | Impossible |
| A. Sitting on chair | 4 | 2 | 0 |
| B. Standing work (including housework) a | 4 | 2 | 0 |
| C. Squatting, standing up from sitting on the floor b | 4 | 2 | 0 |
| D. Going up and down stairs c | 4 | 2 | 0 |
| E. Getting into car or entering public transport | 4 | 2 | 0 |
| a Able to continue longer than 30 min. Needs to take a rest—score as “difficult”. Unable to continue longer than 5 min—score as “impossible”. b Support needed—score as “difficult”. c Handrail needed—score as “difficult”. | |||
References
- Ahn, H.; Kim, D.W.; Ko, Y.; Ha, J.; Shin, Y.B.; Lee, J.; Sung, Y.S.; Kim, K.W. Updated systematic review and meta-analysis on diagnostic issues and the prognostic impact of myosteatosis: A new paradigm beyond sarcopenia. Ageing Res. Rev. 2021, 70, 101398. [Google Scholar] [CrossRef]
- Zacharias, A.; Pizzari, T.; English, D.J.; Kapakoulakis, T.; Green, R.A. Hip abductor muscle volume in hip osteoarthritis and matched controls. Osteoarthr. Cartil. 2016, 24, 1727–1735. [Google Scholar] [CrossRef] [PubMed]
- Ishikura, H.; Nakamura, M.; Oka, H.; Yonezawa, K.; Hidaka, R.; Tanaka, T.; Kawano, H.; Tanaka, S. A new classification system for evaluating fatty infiltration of the gluteus minimus in hip osteoarthritis using plain computed tomography. J. Orthop. Sci. 2022, 27, 792–797. [Google Scholar] [CrossRef] [PubMed]
- Flack, N.A.M.S.; Nicholson, H.D.; Woodley, S.J. A review of the anatomy of the hip abductor muscles, gluteus medius, gluteus minimus, and tensor fascia lata. Clin. Anat. 2012, 25, 697–708. [Google Scholar] [CrossRef] [PubMed]
- Grimaldi, A.; Richardson, C.; Durbridge, G.; Donnelly, W.; Darnell, R.; Hides, J. The association between degenerative hip joint pathology and size of the gluteus maximus and tensor fascia lata muscles. Man. Ther. 2009, 14, 611–617. [Google Scholar] [CrossRef]
- Addison, O.; Young, P.; Inacio, M.; Bair, W.-N.; Prettyman, M.G.; Beamer, B.A.; Ryan, A.S.; Rogers, M.W. Hip but not thigh intramuscular adipose Tissue is associated with poor balance and increased temporal gait variability in older adults. Curr. Aging Sci. 2014, 7, 137–143. [Google Scholar] [CrossRef]
- Yasuda, T.; Ota, S.; Yamashita, S.; Tsukamoto, Y.; Onishi, E. Association of preoperative variables of ipsilateral hip abductor muscles with gait function after total hip arthroplasty: A retrospective study. Arthroplasty 2022, 4, 23. [Google Scholar] [CrossRef]
- Unnanuntana, A.; Mait, J.E.; Shaffer, A.D.; Lane, J.M.; Mancuso, C.A. Performance-based tests and self-reported questionnaires provide distinct information for the preoperative evaluation of total hip arthroplasty patients. J. Arthroplast. 2012, 27, 770–775. [Google Scholar] [CrossRef]
- Behery, O.A.; Foucher, K.C. Are Harris hip scores and gait mechanics related before and after THA? Clin. Orthop. Relat. Res. 2014, 472, 3452–3461. [Google Scholar] [CrossRef]
- Yasuda, T.; Ota, S.; Mitsuzawa, S.; Yamashita, S.; Tsukamoto, Y.; Takeuchi, H.; Onishi, E. Preoperative lower-limb muscle predictors for gait speed improvement after total hip arthroplasty for patients with osteoarthritis. J. Pers. Med. 2023, 13, 1279. [Google Scholar] [CrossRef]
- Chi, A.S.; Long, S.S.; Zoga, A.C.; Read, P.J.; Deely, D.M.; Parker, L.; Morrison, W.B. Prevalence and pattern of gluteus medius and minimus tendon pathology and muscle atrophy in older individuals using MRI. Skelet. Radiol. 2015, 44, 1727–1733. [Google Scholar] [CrossRef] [PubMed]
- Delmonico, M.J.; Harris, T.B.; Visser, M.; Park, S.W.; Conroy, M.B.; Velasquez-Mieyer, P.; Boudreau, R.; Manini, T.M.; Nevitt, M.; Newman, A.B.; et al. Longitudinal study of muscle strength, quality, and adipose tissue infiltration. Am. J. Clin. Nutr. 2009, 90, 1579–1585. [Google Scholar] [CrossRef]
- Rasch, A.; Byström, A.H.; Dalen, N.; Berg, H.E. Reduced muscle radiological density, cross-sectional area, and strength of major hip and knee muscles in 22 patients with hip osteoarthritis. Acta Orthop. 2007, 78, 505–510. [Google Scholar] [CrossRef]
- Momose, T.; Inaba, Y.; Choe, H.; Kobayashi, N.; Tezuka, T.; Saito, T. CT-based analysis of muscle volume and degeneration of gluteus medius in patients with unilateral hip osteoarthritis. BMC Musculoskelet. Disord. 2017, 18, 457. [Google Scholar] [CrossRef]
- Kennedy, D.; Stratford, P.W.; Pagura, S.M.; Walsh, M.; Woodhouse, L.J. Comparison of gender and group differences in self-report and physical performance measures in total hip and knee arthroplasty candidates. J. Arthroplast. 2002, 17, 70–77. [Google Scholar] [CrossRef]
- Petterson, S.C.; Raisis, L.; Bodenstab, A.; Snyder-Mackler, L. Disease-specific gender differences among total knee arthroplasty candidates. J. Bone Jt. Surg. Am. 2007, 89, 2327–2333. [Google Scholar] [CrossRef]
- Crowe, J.F.; Mani, V.J.; Ranawat, C.S. Total hip replacement in congenital dislocation and dysplasia of the hip. J. Bone Jt. Surg. Am. 1979, 61, 15–23. [Google Scholar] [CrossRef]
- Kellgren, J.H.; Lawrence, J.S. Radiological assessment of osteo-arthrosis. Ann. Rheum. Dis. 1957, 16, 494–502. [Google Scholar] [CrossRef]
- Kuribayashi, M.; Takahashi, K.A.; Fujioka, M.; Ueshima, K.; Inoue, S.; Kubo, T. Reliability and validity of the Japanese Orthopaedic Association hip score. J. Orthop. Sci. 2010, 15, 452–458. [Google Scholar] [CrossRef]
- Homma, D.; Minato, I.; Imai, N.; Miyasaka, D.; Sakai, Y.; Horigome, Y.; Suzuki, H.; Shimada, H.; Dohmae, Y.; Endo, N. Appropriate sites for the measurement of the cross-sectional area of the gluteus maximus and the gluteus medius muscles in patients with hip osteoarthritis. Surg. Radiol. Anat. 2021, 43, 45–52. [Google Scholar] [CrossRef]
- Zacharias, A.; Green, R.A.; Semciw, A.; English, D.J.; Kapakoulakis, T.; Pizzari, T. Atrophy of hip abductor muscles is related to clinical severity in a hip osteoarthritis population. Clin. Anat. 2018, 31, 507–513. [Google Scholar] [CrossRef] [PubMed]
- Lawrenson, P.R.; Crossley, K.M.; Vicenzino, B.T.; Hodges, P.W.; James, G.; Croft, K.J.; King, M.G.; Semciw, A.I. Muscle size and composition in people with articular hip pathology: A systematic review with meta-analysis. Osteoarthr. Cartil. 2019, 27, 181–195. [Google Scholar] [CrossRef]
- Kivle, K.; Lindland, E.S.; Mjaaland, K.E.; Svenningsen, S.; Nordsletten, L. Gluteal atrophy and fatty infiltration in end-stage osteoarthritis of the hip: A case-control study. Bone Jt. Open 2021, 2, 40–47. [Google Scholar] [CrossRef] [PubMed]
- Hides, J.A.; Stokes, M.J.; Saide, M.; Jull, G.A.; Cooper, D.H. Evidence of lumbar multifidus muscle wasting ipsilateral to symptoms in patients with acute/subacute low back pain. Spine 1994, 19, 165–177. [Google Scholar] [CrossRef] [PubMed]
- Prior, S.J.; Joseph, L.J.; Brandauer, J.; Katzel, L.I.; Hagberg, J.M.; Ryan, A.S. Reduction in midthigh low-density muscle with aerobic exercise training and weight loss impacts glucose tolerance in older men. J. Clin. Endocrinol. Metab. 2007, 92, 880–886. [Google Scholar] [CrossRef]
Disclaimer/Publisher’s Note: The statements, opinions and data contained in all publications are solely those of the individual author(s) and contributor(s) and not of MDPI and/or the editor(s). MDPI and/or the editor(s) disclaim responsibility for any injury to people or property resulting from any ideas, methods, instructions or products referred to in the content. |
© 2025 by the authors. Licensee MDPI, Basel, Switzerland. This article is an open access article distributed under the terms and conditions of the Creative Commons Attribution (CC BY) license (https://creativecommons.org/licenses/by/4.0/).