Article

Enhanced Nanoparticle Collection Using an Electrostatic Precipitator Integrated with a Wire Screen

by
Raíssa Gabrielle Silva Araújo Andrade
and
Vádila Giovana Guerra
*
Department of Chemical Engineering, Federal University of São Carlos, Rodovia Washington Luís, km 235, C.P. 676, São Carlos 13565-905, SP, Brazil
*
Author to whom correspondence should be addressed.
Powders 2025, 4(3), 23; https://doi.org/10.3390/powders4030023 (registering DOI)
Submission received: 27 May 2025 / Revised: 27 June 2025 / Accepted: 30 July 2025 / Published: 6 August 2025

Abstract

Electrostatic precipitators (ESPs) are widely applied to reduce particle concentrations. However, the performance of ESPs is impaired in the nanosized diameter range due to the difficulty in electrically charging these particles. The present work evaluated the inclusion of a wire screen, perpendicular to the airflow, as an additional collecting electrode of a single-stage wire-plate ESP containing two collecting plates and a single discharge wire. ESP performance was evaluated in terms of voltage, air velocity and electrode positioning in relation to the beginning of the collecting plate (inlet spacings of 1.5, 10 and 23 cm). When compared to theoretical prediction, the penetration results presented a decay for larger particles not predicted by the diffusion battery model. It was observed that the inclusion of the wire screen increased the removal of ultrafine particles and that the overall collection efficiencies increased up to 70% in the operating conditions evaluated. Moreover, the central positioning of the electrodes (inlet spacing of 10 cm) achieved the highest collection efficiencies at high voltages, but the final positioning (inlet spacing of 23 cm) presented a better performance at higher air velocities. Therefore, the wire screen can be an alternative to enhance nanoparticle collection.

1. Introduction

Reducing particle emissions to improve air quality is imperative because constant exposure to particulate matter can cause health problems [1,2], such as respiratory and cardiovascular diseases [3,4]. The World Health Organization (WHO, 2021) [5] determines that the PM10 and PM2.5 levels should be 15 and 5 μg/m3 for short-term exposure and 45 and 15 μg/m3 for long-term exposure, respectively [5].
Achieving the WHO limits is a challenge because the particulate matter size and characteristics impact directly on their collection and on the performance of the equipment used. Among the most common environmental control equipment, the electrostatic precipitator (ESP) is a good alternative due to its versatility, high collection efficiency and low energy costs [6].
The ESP operates with discharge electrodes, which are either negatively or positively charged, and grounded collecting electrodes that create an electric field inside the equipment, promoting particle charging and collection [7,8]. Particle charging occurs by the electrical and diffusion mechanisms, depending on the particle diameter range. For particles larger than 1 μm, field charging is dominant [8]. With the decrease in particle size below 0.1 μm, diffusion takes place [8], and it becomes difficult to charge particles with a nanometric size, due to the dependence on Brownian motion and lower collision probability between the ions and the particles [9]. Therefore, the ESP presents high particle removal for particles larger than 2.5 μm [10] that decreases for particles between 0.1 and 1 μm [4,11,12,13].
Since the electrostatic precipitation process is affected by the ESP geometry and its operating conditions [12,14], these parameters can be adjusted to improve collection efficiency for the desired application. Several studies have explored the ESP possibilities. The wet [15,16] or dry [17,18] operation, the wire-tube or wire-plate [19] configuration and the number of stages, single-stage [20] or two-stage [3,21], enables the separation of the charging and collecting processes. Other studies also explored the application of techniques such as agglomeration [22,23] to improve particle collection.
Regarding the electrodes, their geometry was largely explored in the literature. For the discharge electrodes, different shapes [14,24], number [25] and spacing [26] were tested. The geometry of the collecting electrodes was also analyzed, such as flat plates [13,27], corrugated plates [28], wavy plates [29,30] and perforated plates [31,32]. Other studies also investigated the replacement of the collecting plates by wire screens. Alonso and Alguacil (2002) [33] evaluated the nanoparticle collection efficiency (in a size range between 3 and 100 nm) and diffusion mechanism in a double-stage ESP using 10 aluminum screens as collecting electrodes, placed perpendicular to the airflow. The collection efficiency of the screen was evaluated by conducting a comparative analysis of two parallel electrostatic precipitators: one equipped with screens and the other without screens. The results showed that the particles were collected for particles size up to 100 nm and the collection efficiency was superior for the ESP configuration with the wire screens. Particles of a few nanometers, that are usually difficult to charge and collect, were efficiently deposed on the screens by the diffusion mechanism and larger particles were collected by electrostatic deposition.
Han and Mainelis (2017) [34] developed a prototype of an Electrostatic Screen Battery for Emission Control, tested on particles of 0.2 and 1.2 μm. This equipment was a two-stage electrostatic precipitator, with a collecting stage composed of five pairs of copper wire screens, alternating between high voltage and grounded. The open area fraction of the wire screens varied from 0.30 to 0.70 with mesh sizes of 22, 24 and 100. The mesh increase did not significantly increase particle collection when used similar open fractions ( d p = 1.2 μm), that may be explained by the dominance of the electrostatic collection mechanism. Collection efficiencies were close to 90%, and most particles (approximately 58.5%) were deposited on the first pair of wire screens, when the same type was used for all pairs. Furthermore, no significant pressure drop was identified.
Although wire screens have been used as collecting electrodes in some electrostatic precipitator studies, their application has been more extensively investigated in diffusion batteries for aerosol particle sizing [35]. This equipment consists of a series of parallel channels, either circular or rectangular, through which the aerosol flows and particles move by Brownian movement [35,36]. This methodology has proved to be useful for ultrafine particles ( d p   100 nm), since particle penetration depends on their diffusivity and size [36]. These studies provided important discussions and equations referent to particle diffusion through wire screens.
Cheng and Yeh (1980) [36] developed a theoretical analysis of the penetration of ultrafine particles and proposed a penetration equation derived from the theory of diffusional deposition through a fan model filter and applied it for the screen-type diffusion batteries. This equation is adequate do describe aerosol penetration in a size range from 0.01 to 1 μm [37] and it was later expanded to include the contribution of direct interception and a correction term for diffusion and direct interception [38]. In a later work, Yeh et al. (1982) [39] applied this theory for four types of stainless-steel wire screens, for NaCl monodispersed particles in a diameter range from 10 to 220 nm, and found a good agreement between theoretical and experimental data. Other works were developed by Alonso et al. [40,41] to determine the penetration and propose an experimental equation to calculate the single fiber efficiency for particles with a diameter lower than 10 nm.
Tu et al. (2017) [32] investigated the influence of different opening areas (0.19–0.60) and types of perforated plates on particle collection efficiency. This study used fly ash particles, with mean diameters of 1.26 and 3.71 μm, at an air velocity of 2 m/min (~3.3 cm/s). The authors concluded that the size, shape and arrangement of the openings exhibited minimal influence on particle collection and recommended an opening area between 0.4 and 0.45, because it provides a high collection efficiency with less material cost. The numerical study showed that the opening has small effects on the electric field distribution in most regions but has a significant influence on the wire-plate spacing adjacent to the plate. Also, the increase in the opening area decreases air velocity, which contributes to collection efficiency. Shi et al. (2024) [42] obtained higher collection efficiencies when used perforated plates in comparison with other types of collecting plates analyzed, due to the high electric field observed between the plate and the discharge electrode. Even though the studies of Tu et al. (2017) [32] and Shi et al. (2024) [42] did not use wire screens, these evaluations are relevant contributions to the present investigation.
Based on those studies, the present work investigates the influence of a wire screen as an additional collecting electrode on the nanoparticle collection efficiency of a single-stage wire-plate ESP with two collecting plates. The innovation of this work lies in the simultaneous use of two different types of collecting electrodes, wire screen and plates, as no previous studies were found, during the preparation of this manuscript, that employed both types together. The collecting plates were placed parallel to the airflow on the ESP and the collecting wire screen were placed perpendicular to the airflow. This configuration aims to evaluate the effect on nanoparticle collection efficiency when the collecting area is increased, with the aerosol passing directly through a colleting electrode, and to evaluate how the inclusion of this screen impacts the diffusion of particles, since the diffusion charging mechanism is the main one in this size range. In addition, the wire screen and the discharge electrodes were placed on the initial, central and final region of the ESP to continue a previous investigation about the electrode positioning at different air velocities and voltages.

2. Materials and Methods

2.1. The Experimental Unit

The experimental setup (Figure 1a) included a compressor (model MSV 12/175, Schulz, Joinville, SC, Brazil) that supplied air, which was then passed through a purification filter (model 3074B, TSI, Shoreview, MN, USA) and an aerosol generator (model 3079, TSI, Shoreview, MN, USA) containing a 0.10 g/L NaCl solution. The resulting aerosol, diluted in air, was directed through a diffusion dryer (model 3062, TSI, Shoreview, MN, USA) to remove excess moisture before passing through an aerosol neutralizer (Kr-85) (model 3054, TSI, Shoreview, MN, USA) to eliminate any charges acquired in the pipeline. Next, the aerosol entered the electrostatic precipitator, which was connected to a high-voltage power source (model SL30PN300, Spellman, Hauppauge, NY, USA) and a three-way valve controlling the analyzed region, either before or after the ESP. This valve was linked to another aerosol neutralizer (Am-242) to remove any additional charges before the aerosol proceeded to an electrical mobility particle analysis system (SMPS), consisting of an electrostatic classifier (model 3080, TSI, Shoreview, MN, USA) and a particle counter (model 3776, TSI, Shoreview, MN, USA).
The electrostatic precipitator used was a single-stage wire plate, with one stainless-steel wire measuring 0.4 mm of diameter as the discharge electrode (Figure 1b). As collecting electrodes, two copper plates 30 cm long and 10 cm high were used and a copper wire screen, with a wire diameter of 0.23 mm and an opening of 0.425 mm. The goal of including this wire screen was to evaluate whether the expansion of the collection area and the passage of the aerosol through a collecting electrode alter the diffusive characteristics of the flow and the efficiency of nanoparticle collection. In addition, this configuration was designed to increase the equipment’s collection area near the discharge electrodes. Further information about the wire screen will be presented in Section 2.2.
For the screen to remain fixed inside the equipment, two 0.4 mm thick acrylic frames were used, which were glued with polyurethane on both sides of the screen. The screen was inserted inside the equipment, perpendicularly to the aerosol flow, maintaining contact with both collector plates of the electrostatic precipitator to ensure that it would be grounded (Figure 1c).
Only one discharge electrode was added to avoid shielding effect [9,25] and to facilitate a more precise evaluation of each parameter’s influence, while the collection wire screen was positioned 3 cm downstream from the discharge electrode. This spacing between the screen and the wire was chosen because it is almost equivalent to the spacing between the wire and the collector plates. Furthermore, the discharge electrode and the wire screen were inserted in different positions along the electrostatic precipitator to assess the influence of the location of these components on the performance of the equipment. The spacing selected refers to the distance from the start of the collecting plate to the discharge electrode, i.e., inlet spacing. Experiments were therefore carried out with inlet spacings of 1.5, 10 and 23 cm.

2.2. Wire Screen Characteristics

The wire screen was produced by TEGAPE and had a wire diameter of 0.23 mm, an opening of 0.425 mm and a thickness of 0.45 mm. The open area is calculated by Equation (1) [44].
A 0 = w w + d f 2 × 100 %
where A 0 is the open area, w is the width of the opening (mm) and d f is the diameter of the wire fiber (mm).
For the wire screen used, the open area opening is 42.10% that can be rounded to an open area fraction ( Ɛ ) of 0.42. This value is in the range recommended by Tu et al. (2017) [32].
The solid volume fraction ( α ) of the wire screen is calculated by Equation (2) [41].
α = ρ s s h ρ v s
where ρ s s is the wire mesh surface density (kg/m2), h is the wire thickness (m) and ρ v s is the material density (kg/m3), which in this case is copper (8900 kg/m3 [45]).
The surface density is calculated by Equation (3) [45], with d f and w in mm, and ρ v s in kg/m3. For the present work, ρ s s is 1.163 kg/m2.
ρ s s = d f 2 ρ v s 618.1 ( w + d f )
Finally, the screen parameter ( S ) can be calculated using Equation (4) [40].
S = 4 α h π d f 1 α
The wire screen characteristics are presented in Table 1.
Previous works indicated [36,40] that the Brownian diffusion controls the collision of nanoparticles with the wire. With this consideration, it can be calculated the penetration, i.e., the ratio of particles number concentration passing through the screen in relation to the initial number concentration.
This parameter is calculated using Equation (5) [36,40].
P = exp ( S η D )
where P is the penetration (dimensionless) and η D is the single fiber efficiency of the wire screen, obtained through Equation (6), that is the sum of diffusion, interception and a correction term for diffusion and interception [37,38].
η D = 2.7 P e 2 / 3 + 2 2 κ 1 R 2 + 1.24 κ 1 / 2 P e 1 / 2 R 2 / 3
κ = 1 2 l n 2 α π 0.75 + 2 α π 1 4 2 α π 2
where R is the interception parameter ( a p / a ), a p is the particle radius and a is the wire radius of the screen.
The Peclet number ( P e ) is calculated using Equation (8) [33].
P e = v d f D
where v is the air velocity (m/s) and D is the diffusion coefficient (Equation (9) [33]).
D = k T C u 3 π μ d p
with k is the Boltzmann’s constant (J/K), T is the absolute temperature (K), C u is the Cunningham correction factor (dimensionless), μ is the air viscosity (kg/ms) and d p is the particle diameter (m).
The calculation of the Cunningham factor uses the dimensionless Knudsen number K n (Equations (10) and (11)) [8].
C u d p = 1 + K n 1.246 + 0.42 e x p 0.87 K n
K n = 2 λ d p
where λ is the mean free path between collisions.

2.3. The Experimental Procedure

For each configuration of the 1-wire with the collector screen, experiments were carried out at velocities of 1, 2, 4 and 5 cm/s. Due to the impact of the electrodes positioning on the strength of the electric field generated, a different range of voltages was applied for each configuration: 10–12 kV, 8.5–11 kV and 8–10 kV, for the discharge electrode spacings of 1.5, 10 and 23 cm, respectively.
For the experiments with the highest velocities, 4 and 5 cm/s, it was necessary to evaluate the collection efficiency with higher voltages, so that the electrostatic precipitator could perform well when operated under these conditions. Therefore, in some cases it was not necessary to carry out experiments with the entire voltage range selected, since high collection efficiencies were achieved with lower voltages values. Table 2 summarizes the experiments that were carried out in this study.
To facilitate the discussion, from this point onward, the different positions evaluated will primarily refer to the wire inlet spacings rather than the screen position to improve clarity and enable comparison with other studies.
The particle collection efficiency was calculated using Equation (12).
η = C i C o C i × 100 %
where η is the electrostatic precipitator efficiency (%), C i is the inlet particle concentration (µg/m3), and C o is the outlet particle concentration (µg/m3).

3. Results and Discussion

3.1. Penetration

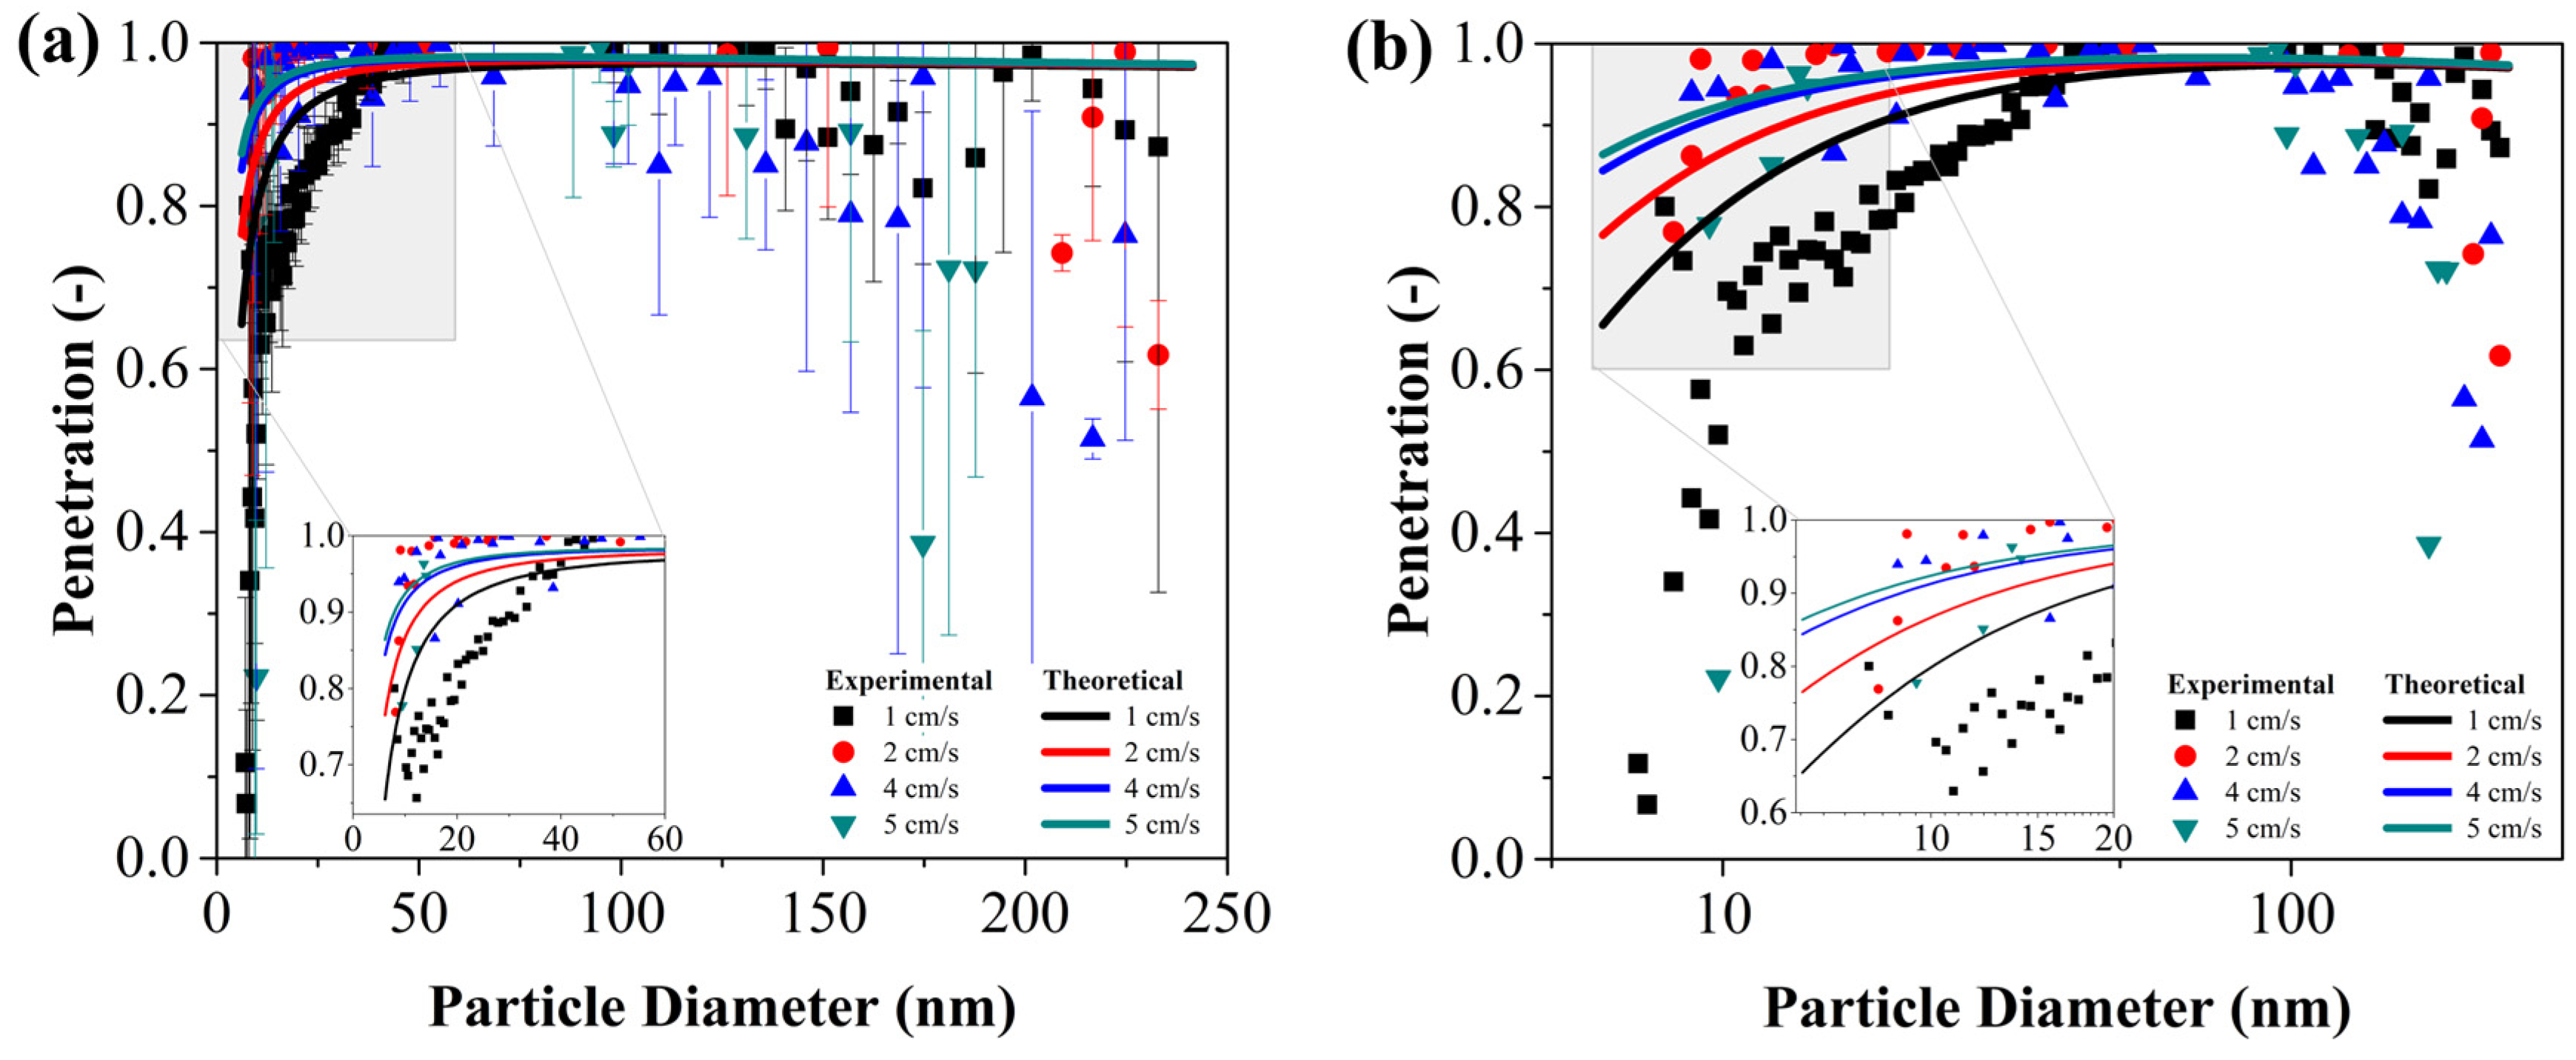
The penetration of particles through the wire screen was obtained to evaluate its diffusion properties. The experimental values were obtained from 1 η , where η is the experimental collection efficiency (Equation (12)) of the ESP at 0 kV with the inlet spacing of 1.5 cm. On the other hand, the theoretical values were calculated by the equation proposed by Cheng and Yeh (1980) [36] (Equation (5)). The comparison between both methods is presented in Figure 2, in both linear (Figure 2a) and logarithmic scales (Figure 2b) to provide a better visualization of the penetration across the entire diameter range and its standard deviation.
Particle penetration increased with the increase in the air velocity for the theoretical results and also for fine aerosol particles, smaller than 40 nm (Figure 2b) [46]. The penetration values were overestimated by the theoretical calculation, especially for particles larger than 60 nm (Figure 2a), that presented a decrease in experimental penetration not predicted by the model. Differences between predicted and experimental results are likely due to differences in the geometry of the equipment used and other operating conditions. Also, penetration reduction indicates that particles smaller than this size were not effectively collected by the ESP with the wire screen, while larger particles were collected more efficiently. However, experimental penetration results were very scattered for larger particles, which can be confirmed by the standard deviation values (Figure 2a). When the ESP operates at 0 kV, particle collection occurs by diffusion mechanism [33], dependent on Brownian motion, which can explain why the curves did not present well-defined behavior. Furthermore, the use of only one wire screen did not contribute to particle collection without the application of high voltage. Alonso and Alguacil (2002) [33] reported that the operation of the ESP with 10 wire screens as the collection electrode was highly efficient for particles lower than 10 nm, but was low (15–30%) for particles larger than 30 nm.
Yeh et al. (1982) [39] and Cheng et al. (1985) [37] measured the penetration with diffusion batteries containing 10 stages and 55 and 50 screens, respectively. In those studies, the screen named SS400 was the most similar to the one used in the present study. In their case, the solid volume fraction was 0.292 and a screen parameter of 1.180, compared to 0.29 and 1.019 in this work. However, the screen diameter used by them was approximately 10 times thicker.
Their results showed that the estimated penetration for a single screen was very close to 1 under all evaluated conditions and increased with the increase in the particle diameter from 22 to 217 nm of monodispersed aerosols, as observed in the initial size range of the present work. Moreover, the authors reported that penetration decreased with the increase in the number of screens.
The single fiber efficiency was calculated by Equation (6) for all air velocities used and is presented in Figure 3. The values decreased with the increase in air velocity, as observed in previous works [37,41]. In this size range, diffusion and interception are the main mechanisms. In addition, for all air velocities the curves were concave, as reported by Cheng et al. (1985) [37], but while the authors identified a minimum point between 400 and 700 nm (for oleic acid aerosol) they occurred between 70 and 122 nm in the present work. This range difference can be attributed to aerosols, flowrates and wire screen differences. On the other hand, the behavior of the single fiber curves is coherent with the penetration results (Figure 2), because the regions of decrease and increase in single fiber efficiency (Figure 3) are correspondent to the regions of increase and decrease in penetration.

3.2. Current–Voltage Curves

The effect of the inclusion of the wire screen was then analyzed by providing a high negative voltage to the discharge electrode of the ESP.
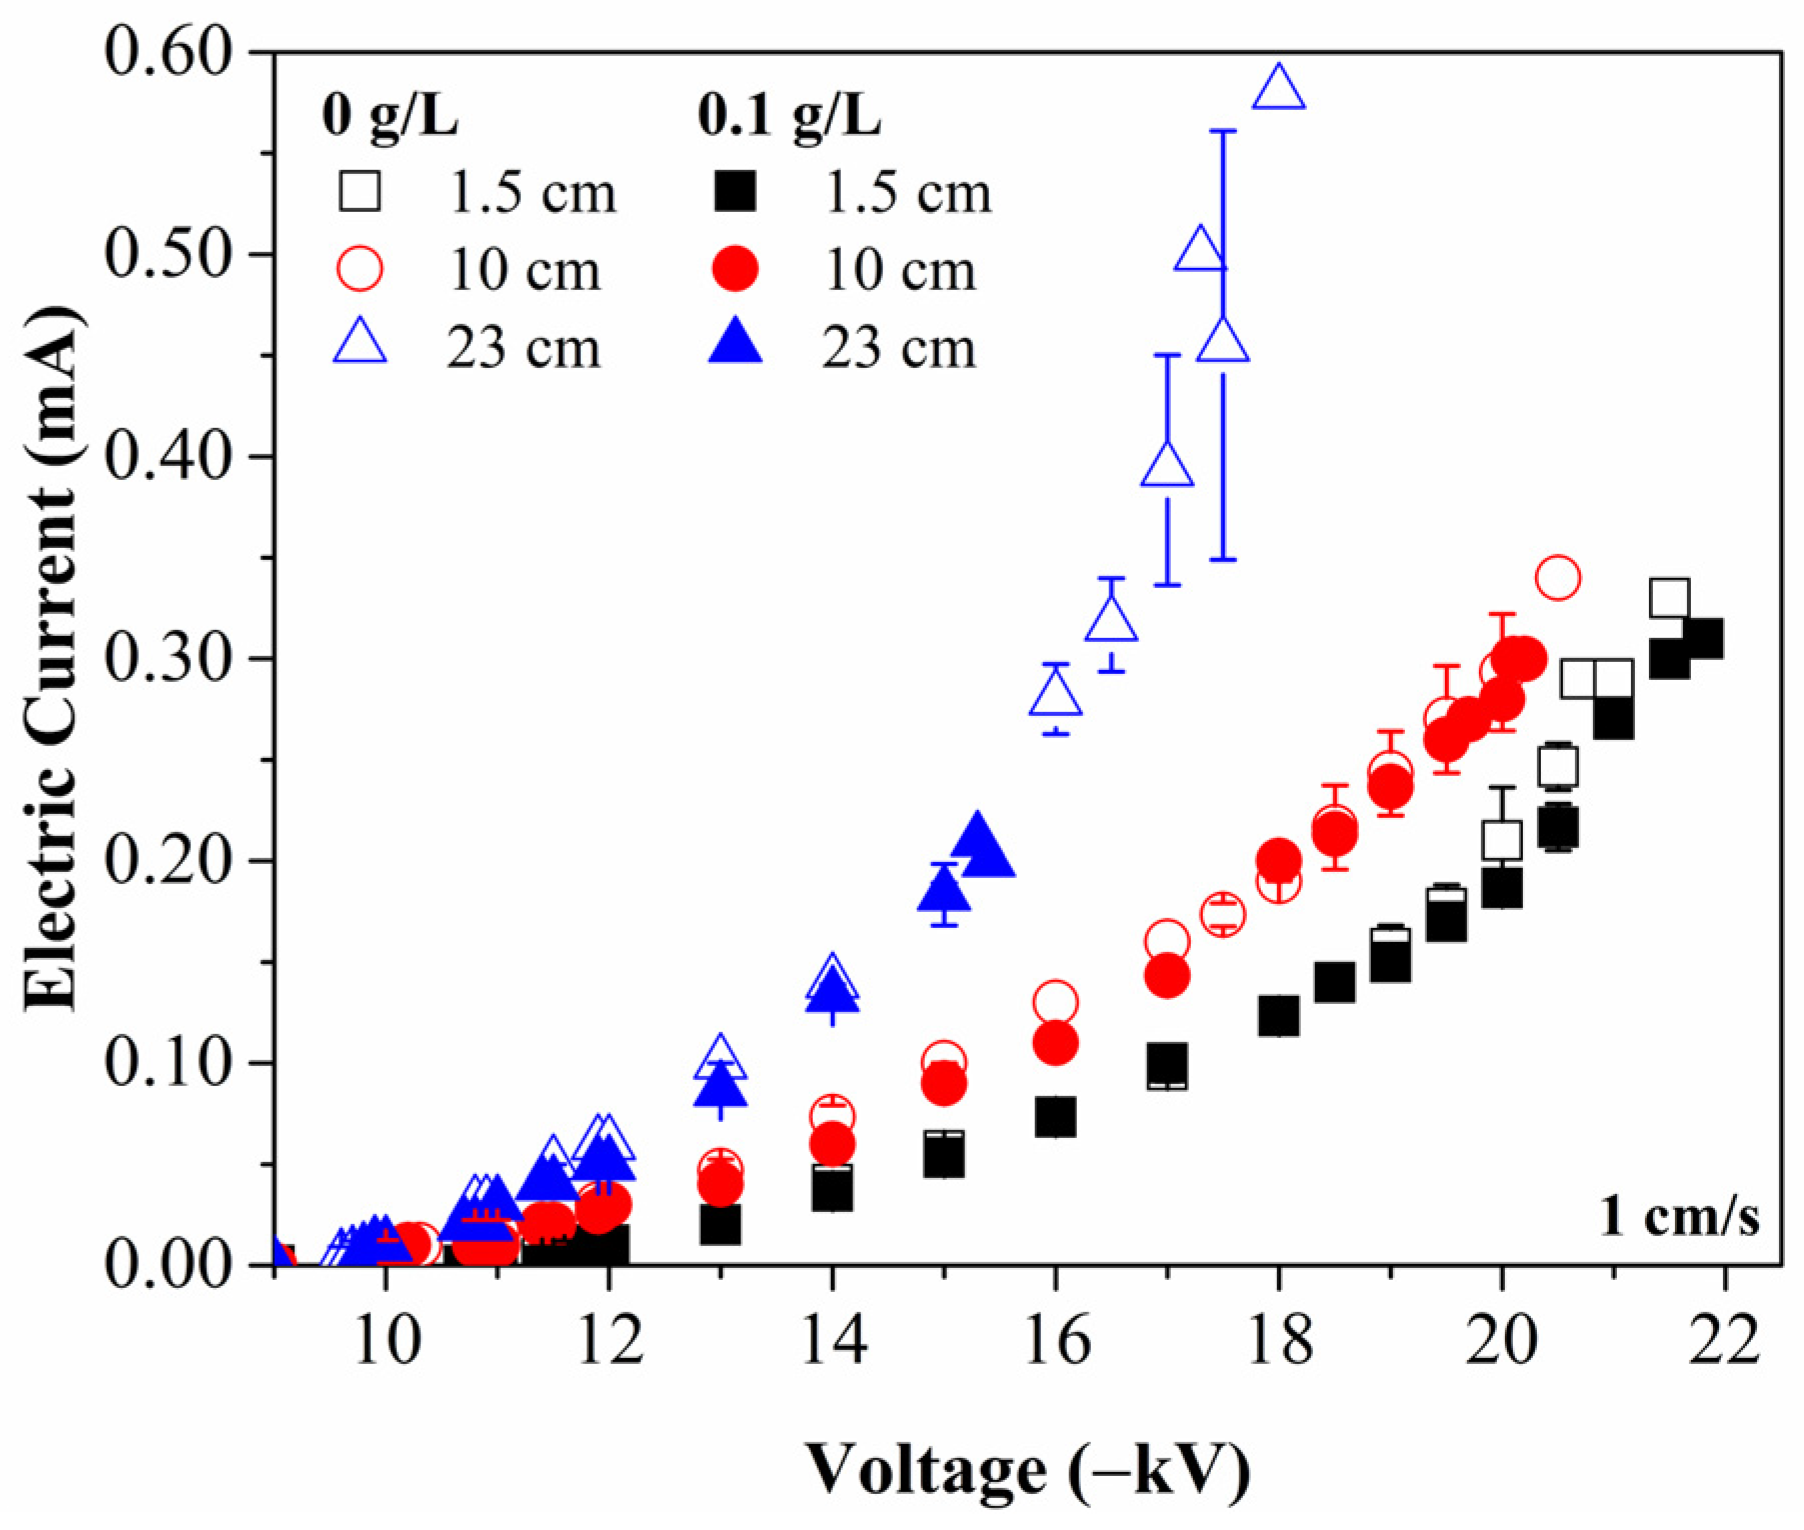
The current–voltage curves with the presence of the wire screen for all inlet spacings at an air velocity of 1 cm/s, are shown on Figure 4.
The curves showed lower values in the presence of NaCl particles [47]. In addition, an increasing profile was obtained for all three positions and the electrical currents reached were much higher for the 23 cm inlet spacing (with differences of up to 0.4 mA) compared to the other positions. The 1.5 and 10 cm inlet spacings showed closer results, with a difference of approximately 0.1 mA. It is therefore expected that positioning the set of discharge electrode plus wire screen in the final region of the ESP may present the most efficient results for particle collection, and that the positioning in the initial and central regions will present a similar performance.

3.3. Effect of the Inclusion of the Wire Screen on the Fractional Collection Efficiency

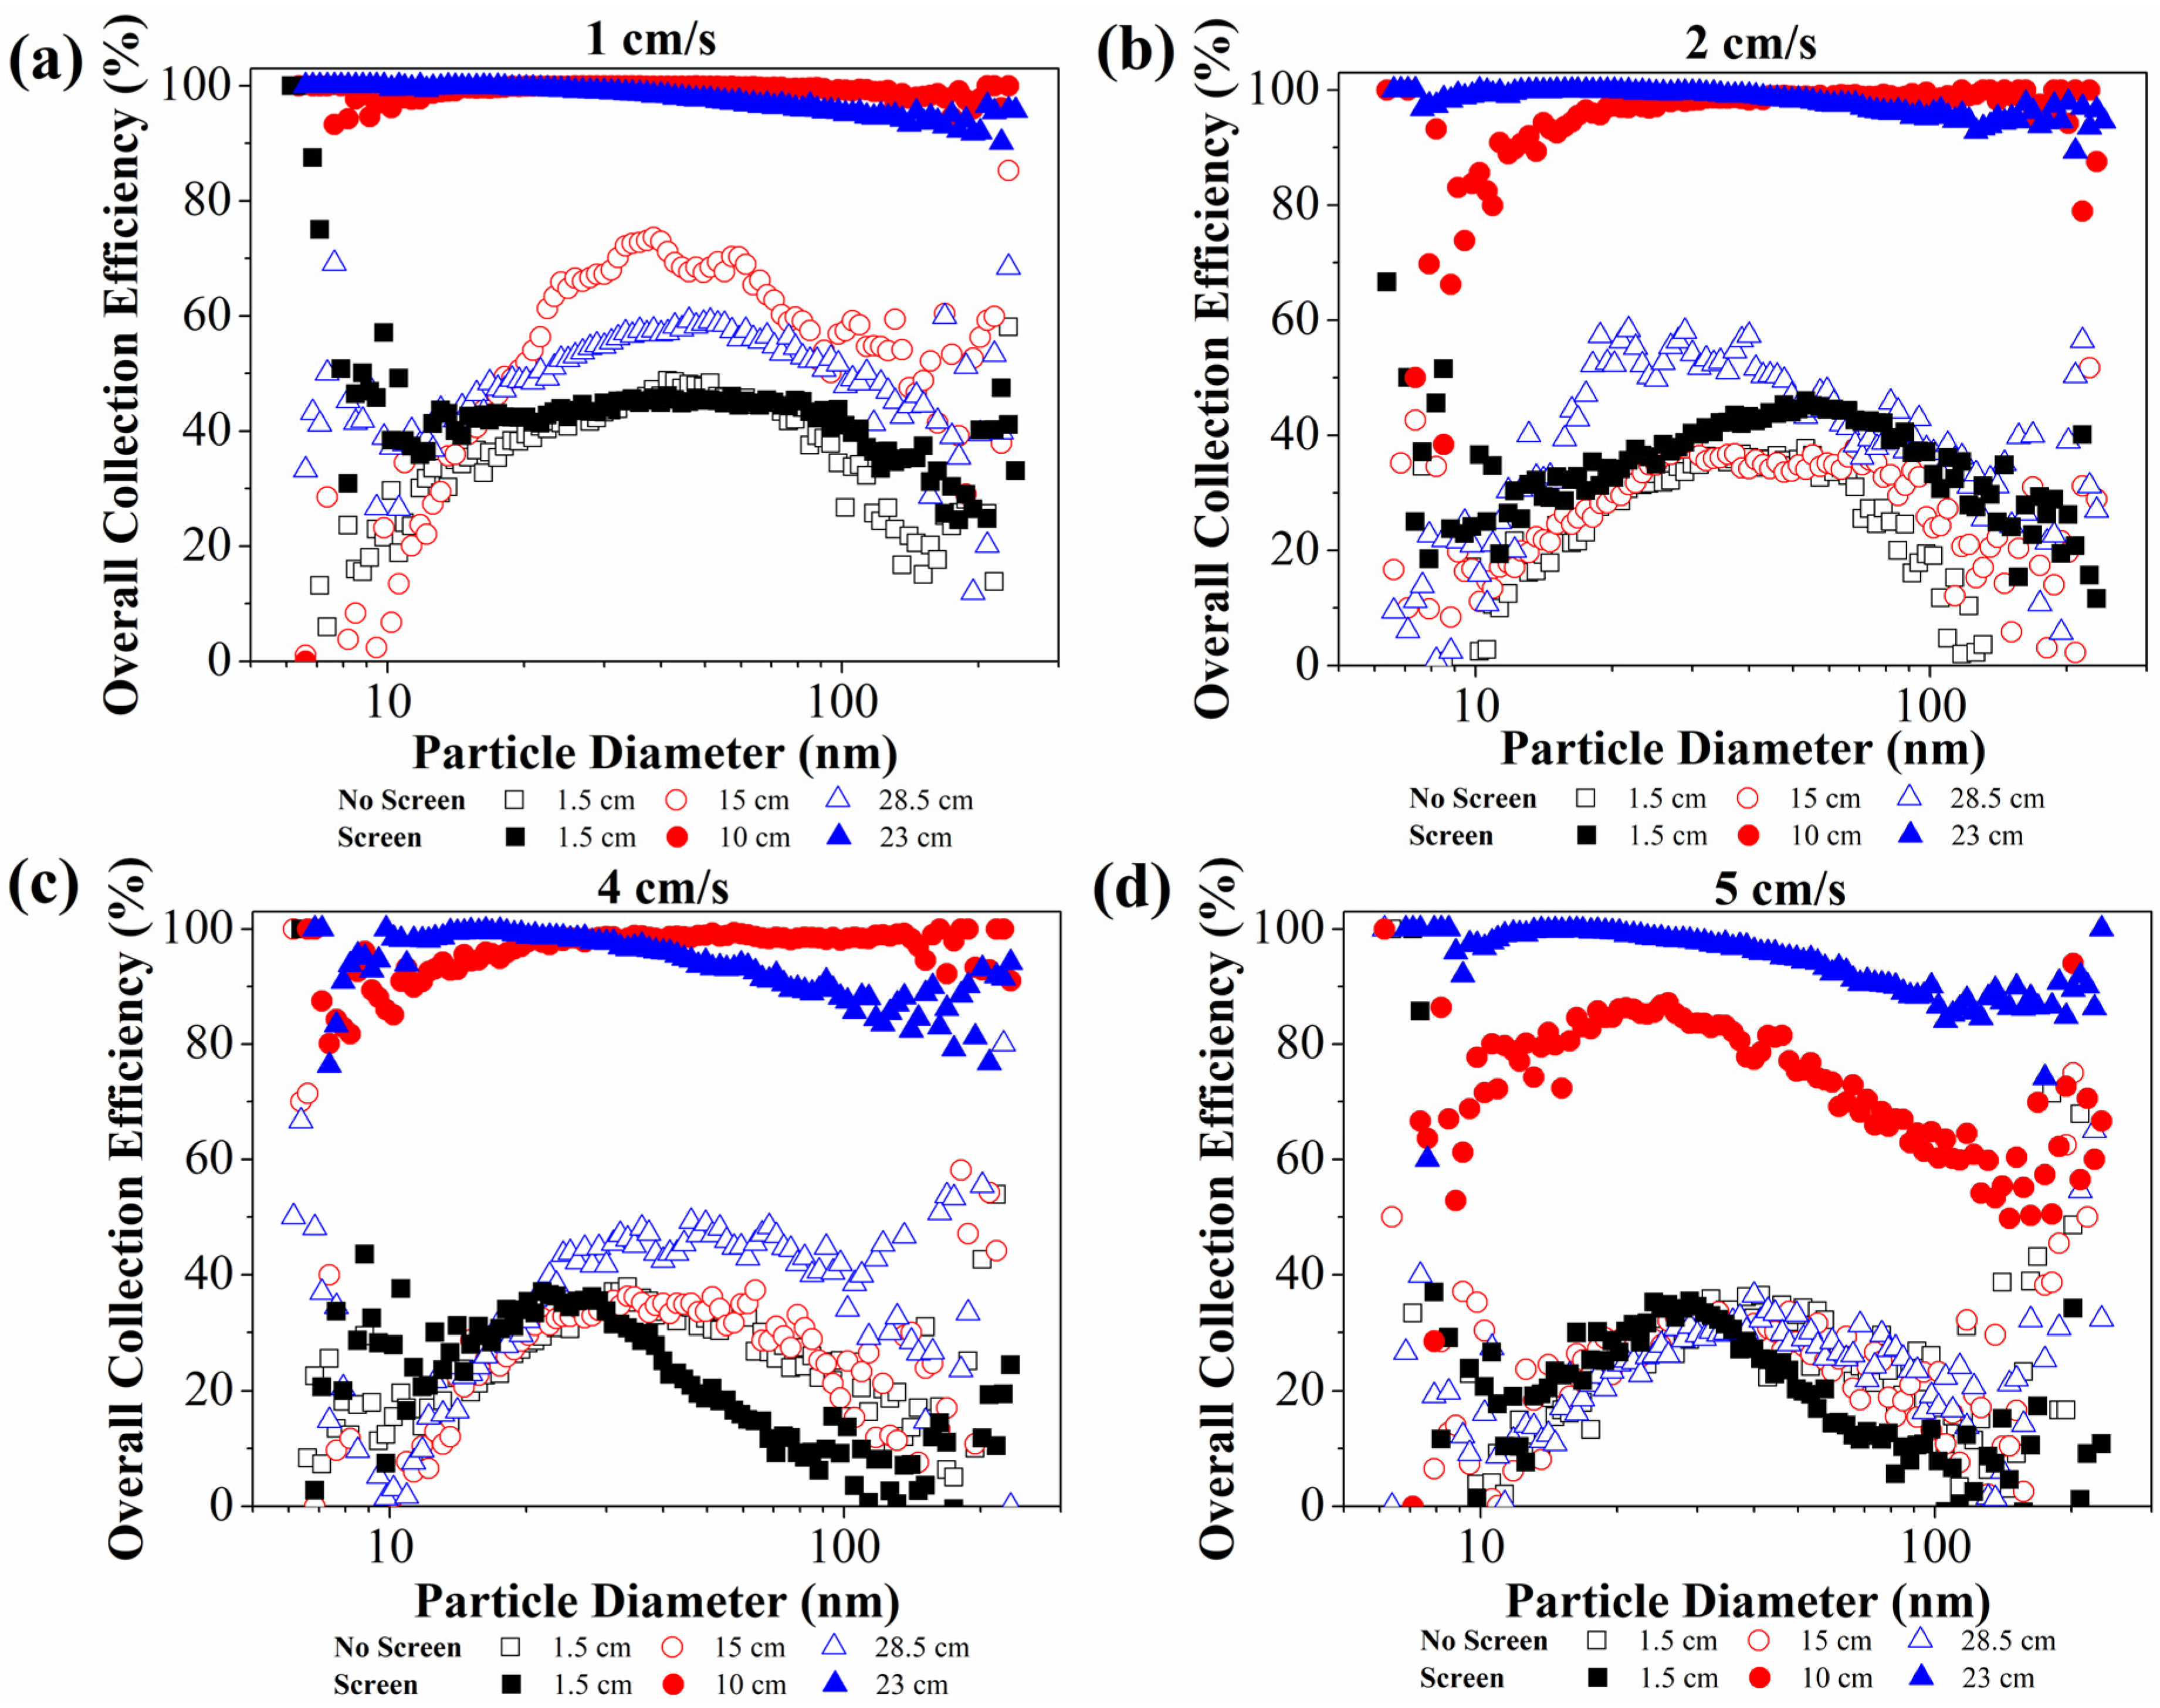
To better assess the effect of the collector screen on the performance of the electrostatic precipitator, the fractional efficiency at the voltage of 10 kV was compared for the configurations with and without the wire screen at all the air velocities and inlet spacings evaluated (Figure 5). The inlet spacings without the wire screens show some differences in values due to equipment limitations but are sufficiently close to serve as a reference for evaluating the effect of the wire screen inclusion. For most of the air velocities tested, the ESP containing the wire screen was able to capture more than 90% of the particles larger than 100 nm, as previously reported [33].
With an inlet spacing of 1.5 cm the performance of the ESP was not so efficient, and both configurations (with and without the wire screen) presented similar results. At 1 and 2 cm/s (Figure 5a,b), the inclusion of the wire screen contributed to the collection of larger particles. Nonetheless, at higher velocities (Figure 5c,d) the configuration without the wire screen was more efficient to capture particles larger than approximately 30 nm, as can be seen by the decrease in the curves with the wire screen and a peak of maximum efficiency more delimited.
When the discharge electrode and the wire screen were placed in the central region of the ESP, inlet spacing of 10 cm, it is clear the enhancement on the equipment performance in all particle size range and air velocities evaluated compared to the configuration without the wire screen. From 1 to 4 cm/s (Figure 5a–c), particle collection was higher than 90% for most particle diameters. At 5 cm/s (Figure 5d), particle collection was affected by the reduction in the residence time of the particles but still achieved a better performance than without the wire screen. These results show the potential of the wire screen to improve particle collection of ultrafine particles with diameters up to 30 nm.
For the inlet spacing of 23 cm, the wire screen configuration was more efficient than without it at all air velocities, with collection efficiencies higher than 90% at 1 and 2 cm/s (Figure 5a,b). At all air velocities, the curves with the wire screen showed a decreasing behavior, more evident at higher air velocities (Figure 5c,d), similar to the one observed by Alonso and Alguacil (2002) [33]. This can probably be explained by the fact that with this inlet spacing both discharge wire and screen wire are placed in the final region of the ESP, reducing the time for the particles being in contact with the region of strong electric field and properly charged. Therefore, this may indicate that the most favored particles are those that require less charges to being collected.
Zhu et al. (2025) [11] evaluated the re-entrainment of submicron particles (0.25–1 μm) in a two-stage ESP. They proposed that there are three stages during the stage of particle collection: acceleration, linear motion and re-entrainment stage. The first one occurs near the collector’s entrance and results in the gradual decline of the number concentration of particles, due to the acceleration of particles by the electric field force once they enter the collecting stage. The authors stated that only a few particles can be deposited at the beginning of the collecting plates, especially those whose initial position was close to the plates. At high air velocities, particles drift further downstream, extending the acceleration stage. Although the present study used a single-stage ESP, this can help explain the low collection efficiencies when the electrodes were placed in the initial region of the ESP and its further reduction at higher air velocities.
The next stage is the linear motion, characterized by an increase in particle velocity due to the electric field, which in turn increases the airflow drag force acting on the particles in that direction. At a certain point, the velocity of the particle reaches a critical limit where the drag force and the electric force in that direction equalizes, which stabilize the velocity of the particle, and it moves in a straight line until reaching the collecting plates or escaping the ESP. It was observed that most particles initially distant from the collector achieved their maximum velocity and were deflected towards the collecting plates and captured. In this stage the number concentration of particles presented a linear decrease. That is why it was difficult to collect particles at 10 kV when the electrodes were placed in the final region of the ESP, especially in the configuration without the wire screen.
Finally, after passing a limit deposition distance, the number concentration presents a non-zero value associated with the re-entrainment of particles already collected by the drag force. The authors concluded that the re-entrainment is negligible for particles of 0.25 μm at 1 m/s. Since in the present study the air velocities used were much lower, it can also be neglected.

3.4. Effect of the Wire Screen Inclusion on ESP Performance in a Wider Voltage Range

Since the high voltage enhanced particle collection for the ESP with the wire screen, the overall collection efficiency was analyzed at a wide voltage range and compared with the results obtained with the ESP without the wire screen, with a single discharge electrode. The results without the wire screen are part of previous work on the study of inlet spacing as a geometric parameter [43]. The results without the wire screen present the same small differences mentioned in Section 3.3.
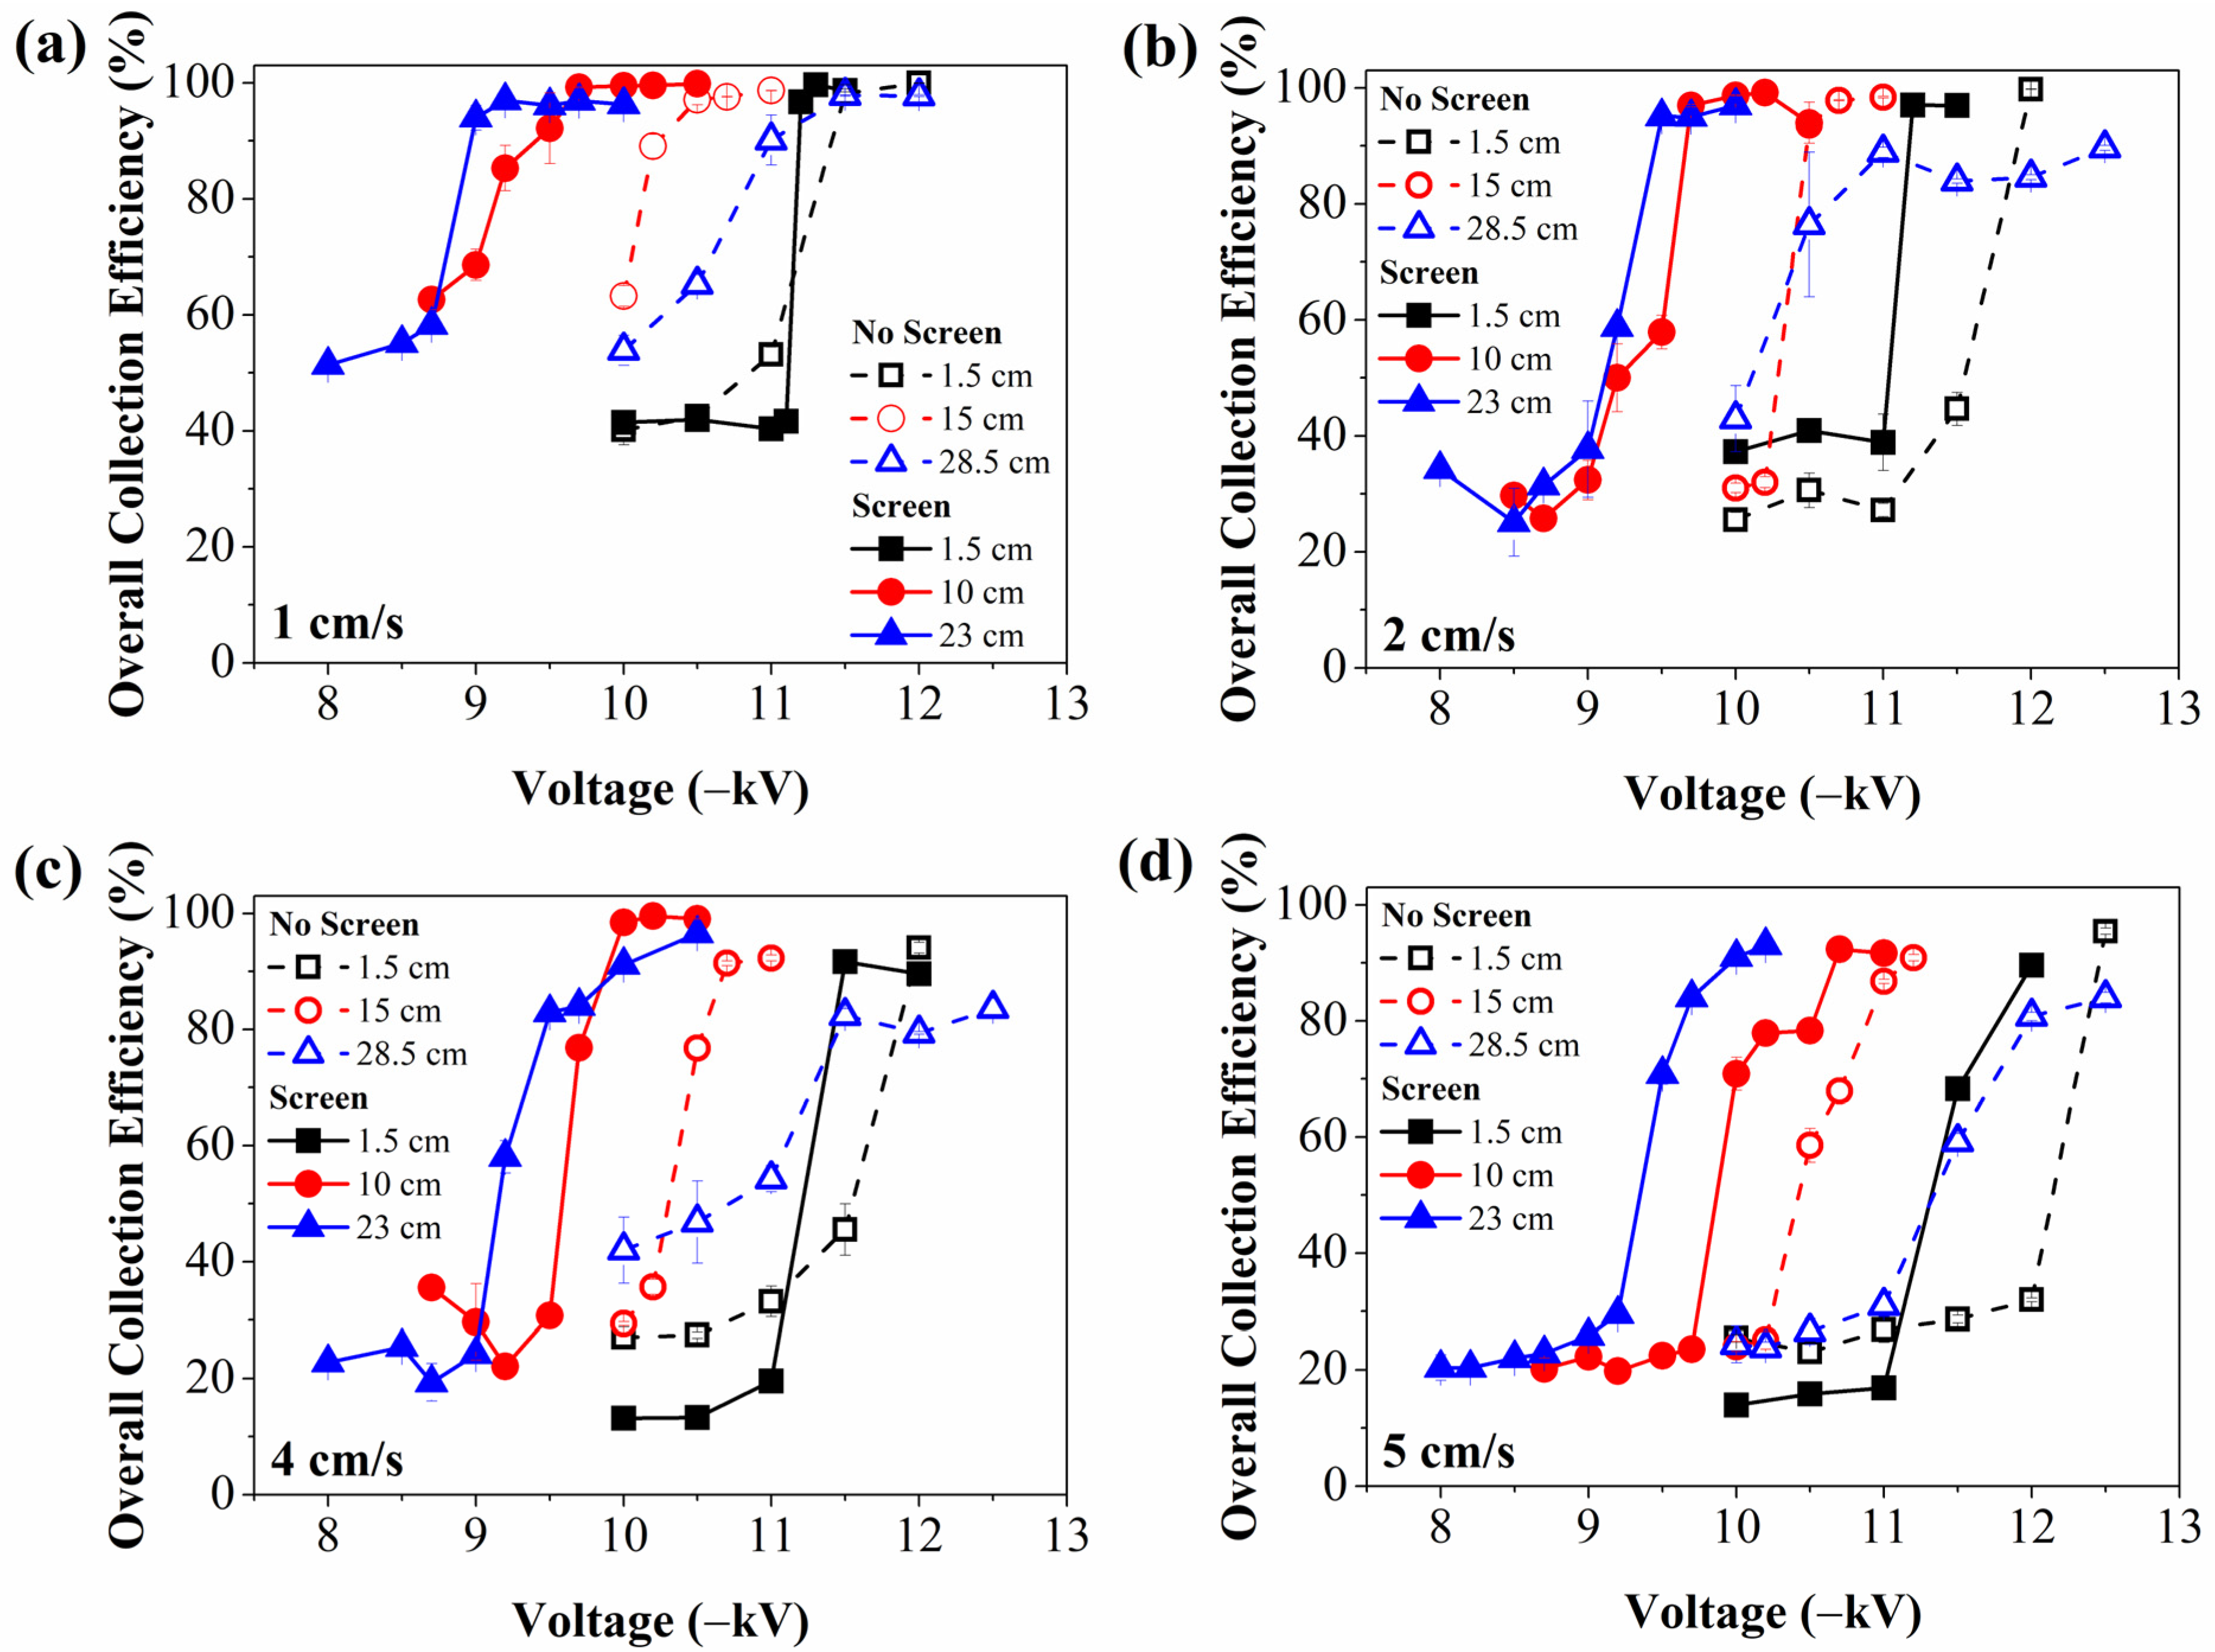
The overall efficiencies comparison with and without the wire screen for all positions evaluated at different air velocities are shown in Figure 6.
An initial general analysis of the results with the wire screen shows that at all air velocities applied, the inlet spacing of 1.5 cm was the least efficient, while the spacings of 10 and 23 cm showed close values, due to the highest electric currents (Figure 4) and better electrical charging of the particles. This is clearly seen in the voltage range applied: to obtain high efficiency values, the 1.5 cm inlet spacing had to use voltages between 10 and 12 kV, while for the 10 and 23 cm inlet spacings, voltages between 8 and 11 kV were used. In addition, the shortest inlet spacing had a very sudden increase in efficiency when the voltage was increased from 11.1 to 11.2 kV (1 and 2 cm/s) or from 11.3 to 11.5 kV (4 and 5 cm/s).
At 1 cm/s (Figure 6a), the profile of the wire screen curves was very similar and the greatest differences in efficiency values occurred in the initial voltage range, between 10 and 13%. The curves with and without the wire screen showed the same profile with 1.5 cm, with very similar values and some overlapping points. However, with the presence of the wire screen, the increase in efficiency was more abrupt between 11 and 11.5 kV. At higher voltages, it was possible to achieve high particle collection efficiency with both configurations, because it increases the charge density and the electric field inside the ESP [48]. With this inlet spacing, the collection efficiency was up to 50% lower than with the other configurations at 10 and 10.5 kV. With 10 cm the collection efficiency of the electrostatic precipitator was up to 36% higher when using the wire screen. At 23 cm, the values obtained with the wire screen were relatively close to those without it, but they required a lower voltage range. Comparing the collection efficiencies obtained at the voltage of 10 kV, the collection efficiency was 43% higher with the presence of the wire screen. Also, at 9.2 kV, the 23 cm distance was 27% more efficient than the 10 cm distance, but above this voltage, the efficiencies were practically the same.
At 2 cm/s (Figure 6b), the performance improvement of the ESP with the inclusion of the wire screen became more evident. With 1.5 cm, at voltages up to 11 kV, the efficiency with the presence of the wire screen was approximately 11% higher than the configuration without the screen in the initial voltage range, but this difference increased to 43% at 11.5 kV. This indicates better performance of the electrostatic precipitator with the wire screen, especially at high voltages. On the other hand, the 1.5 cm configuration with the wire screen did not present a significant change in value with the air velocity increase, but the efficiency at 10 kV was approximately 50% lower than the other configurations. With the inlet spacing of 10 cm, the collection efficiency due to the wire screen inclusion increased up to 57% at 10 and 10.2 kV. However, when applied a sufficiently high voltage, 10.5 kV, the difference with the collecting screen was only 0.37%. Increasing the inlet spacing to 23 cm, the curves also showed similar behavior and at 10 kV, the efficiency was 54% higher with the wire screen. The collection efficiencies for 10 and 23 cm with the wire screen were practically overlapped and suffered a drop in efficiency of up to 36% in comparison with 1 cm/s (Figure 6a) due to the reduction in particle residence time inside the ESP.
Increasing the air velocity to 4 cm/s (Figure 6c), the collection efficiency with the inlet spacing of 1.5 cm was approximately 15% lower with the wire screen than without it, up to a voltage of 11 kV. However, when the voltage was increased to 11.5 kV, the collection efficiency with the wire screen was 46% higher. Thus, these results indicate that the configuration with the screen can be more efficient than without the screen, at higher velocities, when a sufficiently high voltage is used. Increasing the inlet spacing to 10 cm, similar collection efficiencies were achieved, but in a different voltage range. In this configuration, particle collection was higher than 90%, achieving a maximum value of 99%, above the voltage of 10.7 kV with the wire screen, Without the wire screen, collection efficiency was approximately 91% above 10 kV. For both inlet spacings of 1.5 and 10 cm, the air velocity increase to 4 cm/s resulted in an oscillation in the particle collection efficiency in the initial voltage range. This behavior is probably associated with the reduction in particle residence time inside the equipment, along with the low voltage values applied. With the inlet spacing of 23 cm, the curve behavior was different when comparing both configurations and a wider voltage range was required to achieve high collection efficiency, for the configuration without the wire screen. The collection efficiency with the wire screen was up to 50% higher. In addition, the positioning of the discharge wires and wire screen at 10 and 23 cm were up to 86% more efficient in comparison with 1.5 cm, from 10 to 10.5 kV.
At 5 cm/s (Figure 6d), with 1.5 cm, the curves showed the same behavior as 4 cm/s (Figure 6c), with the wire screen configuration being less efficient at lowest voltages. Nonetheless, an increase on the voltage to 11.5 and 12 kV resulted in an ESP performance 40% and 56% higher, respectively, with the wire screen than without it. This confirms better performance with the presence of the wire screen at higher velocities and voltages. This behavior may be associated with the shorter residence time of the higher velocities, and consequently, the shorter time for electrical charging and subsequent collection of particles. Therefore, the increase in the collecting area with the presence of the wire screen favors the performance of the equipment under certain conditions. Conversely, with the inlet spacing of 10 cm, the collection efficiencies were similar at lower voltages, with a maximum difference of 46% at 10 kV. Increasing the voltage, the difference in efficiencies obtained with both configurations was between 5 and 10%, and the maximum efficiency obtained was practically the same, for the voltage range evaluated. At the final region of the ESP, inlet spacing of 23 cm, the behavior of the curves was very similar, but at 10 and 10.2 kV, it was 67% and 70% higher with the wire screen. Although the curves with the wire screen showed a very similar profile, the inlet spacing of 23 cm distance was the one that achieved the highest collection efficiency at lower voltage values than the other distances and removed approximately 70–77% more particles, depending on the applied voltage.
The analysis of these results indicates that the position of the collection electrode in the final region of the electrostatic precipitator was the one that benefited the most from the insertion of the wire screen, since it presented high collection efficiencies, and the greatest increase compared to the configuration without the wire screen. It is important to highlight that the distances analyzed present a difference of approximately 5 cm, which contributes to better charging in the configuration with the collecting screen. Even so, such a significant increase in efficiency is probably linked to other factors, that is, the increase in the collection area with the addition of the screen.
Kherbouche et al. (2016) [49] simulated particle trajectories on an wire-to-cylinder ESP, with the cylinder placed 3 cm after the wire. This distance is equivalent to the one between the wire and the wire screen in the present work. The authors observed that all particles were around the discharge wire, and a region without particles was observed between the discharge and collecting electrodes. Then, the particles were moved by strong electric forces in the direction of the collecting cylinder. The increase in the applied voltage reduced the depositions area of the particles and increased particle velocity, which resulted in a higher number of collected particles. In their work, the collecting electrode presented a cylindric shape and did not occupy all the width of the ESP, so particles travelled to the sides and back of the cylinder, where they were mainly collected even under a low electric field.
In the present work, in addition to the wire screen place after the discharge wire, there were also the collecting plates on the sides of the ESP. Hu et al. (2022) [50] simulated the trajectory of particles in a wire-plate ESP and also identified a free-particles region and the particles are deflected to the sides, towards the collecting plates. It is difficult to predict the exact behavior for the wire-plate ESP with wire screen used in this work, but it can be assumed that probably it was a combination of both simulated scenarios with an additional interaction between the electric field around the wire screen and the collecting plates.
Tu et al. (2017) [32] reported that the particle collection on the back and flank side of perforated plates placed parallel to the airflow increases when the open area fraction increases from 0.19 to 0.45. The authors also concluded that the opening structure of the perforated plate affects the electric field strength in the region of approximately one-tenth the distance between the plate and the wire. Although they worked under different conditions, such as perforated plate with a larger dimension, larger particle diameters, and other differences in the plate positioning, this analysis can be extended to our discussion. It is not possible to affirm the extension of the region where the electric field was affected in the present work, but the effects are observed in the efficiency results with and without the wire screen presented in Figure 6.
To broaden this evaluation and analyze the application of the ESP with the wire screen over a wider range, its performance was assessed in comparison to regulatory limits. Therefore, the outlet concentrations obtained with this configuration were compared to the PM2.5 exposure limits (short and long) established by the WHO (2021) [5]. The results are presented in Figure 7. For the voltage range evaluated, the configuration with the inlet spacing of 10 cm was the one more able to reduce particle concentration below the regulation limits for almost all conditions tested. At the voltage from 8.5 to 10 kV, the outlet concentrations were below the long exposure limit and above 10 kV they were below the short exposure limit. It is important to highlight that these outlet concentrations were obtained with the ESP operating during 30 min and it would be necessary to evaluate its performance after a longer period, but it is a preliminary indication of its applicability.
The addition of a wire screen offered the advantage of enhancing ESP performance without encountering the screen clogging issue, reported by Alonso and Alguacil (2002) [33]. This problem was not observed in the present work, probably because the wire screen was used as an additional collecting electrode alongside the collecting plates, which ensured the main particle collection.

4. Conclusions

The performance of the electrostatic precipitator containing a wire screen as an additional collecting electrode was evaluated in a wide range of voltages and different air velocities. The conclusions are as follows:
  • The experimental results of penetration agreed with the theoretical estimation for particles up to 60 nm, and then presented a decay not predicted by the equation used. On the other hand, the single fiber efficiency presented the expected behavior but with its minimum peak at a lower diameter range (70–122 nm) than previously reported in the literature.
  • The enhancement of nanoparticle collection with the inclusion of the wire screen was confirmed for most of the operating conditions tested, with increases up to 70%, and achieving collection efficiencies higher than 90%.
  • It was observed that the central positioning of the single discharge electrode and the wire screen (inlet spacing of 10 cm) achieved the lowest outlet concentrations (below 20 μg/m3) at voltages above 9 kV. However, the final positioning (inlet spacing of 23 cm) presented the best performance at the air velocities of 4 and 5 cm/s, with maximum collection efficiencies of 99% and 93%, respectively. The initial positioning (inlet spacing of 1.5 cm) presented the worst performance for most operating conditions.
  • Furthermore, the wire screen improved the collection efficiency of ultrafine particles with diameters up to 30 nm.
These results indicate the potential of the addition of a wire screen on the ESP and it is expected to achieve better performance when increasing the number of wire screens.

Author Contributions

Conceptualization, R.G.S.A.A. and V.G.G.; methodology, R.G.S.A.A. and V.G.G.; software, R.G.S.A.A.; validation, R.G.S.A.A. and V.G.G.; formal analysis, R.G.S.A.A.; investigation, R.G.S.A.A.; resources, V.G.G.; data curation, R.G.S.A.A.; writing—original draft preparation, R.G.S.A.A.; writing—review and editing, R.G.S.A.A. and V.G.G.; visualization, R.G.S.A.A. and V.G.G.; supervision, V.G.G.; project administration, V.G.G.; funding acquisition, V.G.G. All authors have read and agreed to the published version of the manuscript.

Funding

This research was funded by Conselho Nacional de Desenvolvimento Científico e Tecnológico (CNPq) and Coordenação de Aperfeiçoamento de Pessoal de Nível Superior—Brasil (CAPES, Finance Code 001).

Institutional Review Board Statement

Not applicable.

Informed Consent Statement

Not applicable.

Data Availability Statement

The original contributions presented in this study are included in the article. Further inquiries can be directed to the corresponding author.

Conflicts of Interest

The authors declare no conflicts of interest.

References

  1. Yan, X.; Lu, J. Numerical investigation of the sensible heat storage in novel electrostatic precipitators with liquid-filled collection electrodes. Appl. Therm. Eng. 2024, 255, 123993. [Google Scholar] [CrossRef]
  2. Buckley, A.; Guo, C.; Laycock, A.; Cui, X.; Belinga-Desaunay-Nault, M.-F.; Valsami-Jones, E.; Leonard, M.; Smith, R. Aerosol exposure at air-liquid-interface (AE-ALI) in vitro toxicity system characterisation: Particle deposition and the importance of air control responses. Toxicol. Vitr. 2024, 100, 105889. [Google Scholar] [CrossRef]
  3. Zhu, Y.; Wei, Z.; Yang, X.; Tao, S.; Zhang, Y.; Shangguan, W. Comprehensive control of PM 2.5 capture and ozone emission in two-stage electrostatic precipitators. Sci. Total Environ. 2023, 858, 159900. [Google Scholar] [CrossRef] [PubMed]
  4. Hwang, S.-J.; Lee, G.-H.; Kim, H.-J.; Yook, S.-J. Discharge electrode shape optimization for the performance improvement of electrostatic precipitator with six-branched spike discharge electrode and hexagonal collecting plate. Powder Technol. 2025, 453, 120662. [Google Scholar] [CrossRef]
  5. WHO. Global Air Quality Guidelines Particulate Matter (PM2.5 and PM10), Ozone, Nitrogen Dioxide, Sulfur Dioxide and Carbon Monoxide; World Health Organization: Geneva, Switzerland, 2021; ISBN 978-92-003422-8. Available online: https://www.who.int/publications/i/item/9789240034228 (accessed on 29 July 2025).
  6. Andrews, A.J.; Hogan, C.J. Evaluation of particle mass transfer rates in electrostatic precipitators. Chem. Eng. Sci. 2025, 307, 121338. [Google Scholar] [CrossRef]
  7. Popa, G.N.; Diniș, C.M.; Iagăr, A. Investigations on Three-Section Plate-Type Electrostatic Precipitators Used in Thermoelectric Power Plants. Energies 2023, 16, 1186. [Google Scholar] [CrossRef]
  8. Applied Electrostatic Precipitation; Parker, K.R., Ed.; Springer: Dordrecht, The Netherlands, 1997; ISBN 978-94-009-1553-4. [Google Scholar]
  9. Kumar, A.; Nawale, P.; Sahu, M. Design, development and performance evaluation of a miniature electrostatic precipitator in an indoor environment. J. Electrost. 2025, 134, 104038. [Google Scholar] [CrossRef]
  10. Jaworek, A.; Marchewicz, A.; Sobczyk, A.T.; Krupa, A.; Czech, T. Two-stage electrostatic precipitators for the reduction of PM2.5 particle emission. Prog. Energy Combust. Sci. 2018, 67, 206–233. [Google Scholar] [CrossRef]
  11. Zhu, Y.; Huang, Z.; Tao, S.; Chen, J.; Yang, X.; Yin, W.; Shangguan, W.; Bai, Z. Re-entrainment mechanism of submicron particles during electrostatic capture process. Chem. Eng. Sci. 2025, 308, 121417. [Google Scholar] [CrossRef]
  12. Zhou, L.; Zhang, J.; Liu, X.; Wu, H.; Guan, Q.; Zeng, G.; Yang, L. Improving the electrostatic precipitation removal efficiency on fine particles by adding wetting agent during the chemical agglomeration process. Fuel Process. Technol. 2022, 230, 107202. [Google Scholar] [CrossRef]
  13. Wang, Y.; Zhang, H.; Gao, W.; Shao, L.; Wu, Z.; Zhao, Z.; Ge, C.; Hu, D.; Zheng, C.; Gao, X. Improving the removal of particles via electrostatic precipitator by optimizing the corona wire arrangement. Powder Technol. 2021, 388, 201–211. [Google Scholar] [CrossRef]
  14. Wang, Y.; Yang, M.; Shao, L.; Wu, Z.; Liu, W.; Chen, Y.; Zheng, C.; Gao, X. Enhancing fine particle removal by electrostatic precipitation from flue gas with a high PM concentration: Effect of various electrode configurations. Sep. Purif. Technol. 2025, 353, 128459. [Google Scholar] [CrossRef]
  15. Järvinen, A.; Lehtoranta, K.; Aakko-Saksa, P.; Karppanen, M.; Murtonen, T.; Martikainen, J.; Kuusisto, J.; Nyyssönen, S.; Koponen, P.; Piimäkorpi, P.; et al. Performance of a Wet Electrostatic Precipitator in Marine Applications. JMSE 2023, 11, 393. [Google Scholar] [CrossRef]
  16. Badami, M.M.; Tohidi, R.; Aldekheel, M.; Farahani, V.J.; Verma, V.; Sioutas, C. Design, optimization, and evaluation of a wet electrostatic precipitator (ESP) for aerosol collection. Atmos. Environ. 2023, 308, 119858. [Google Scholar] [CrossRef]
  17. Jaworek, A.; Sobczyk, A.T.; Marchewicz, A.; Czech, T.; Krupa, A. Performances of two-stage electrostatic precipitator with different types of discharge electrodes of unipolar electrostatic agglomerator. Powder Technol. 2024, 448, 120269. [Google Scholar] [CrossRef]
  18. De Aquino Lima, F.; Guerra, V.G. Collection of nanoparticles by electrostatic precipitation operating over a wide range of electric fields. Sep. Sci. Technol. 2024, 59, 848–865. [Google Scholar] [CrossRef]
  19. Morán, J.; Li, L.; Ouyang, H.; Qiao, Y.; Olson, B.A.; Hogan, C.J. Characterization of the bidimensional size and charge distribution of sub- and supermicrometer particles in an electrostatic precipitator. Powder Technol. 2023, 425, 118578. [Google Scholar] [CrossRef]
  20. De Oliveira, A.E.; Guerra, V.G. Effect of low gas velocity on the nanoparticle collection performance of an electrostatic precipitator. Sep. Sci. Technol. 2019, 54, 1211–1220. [Google Scholar] [CrossRef]
  21. Zhou, Y.; Liu, Y.; Shi, Z.; Li, X.; Yu, M. Enhanced size-dependent efficiency of removal of ultrafine particles: New solution of two-stage electrostatic precipitator with thermophoresis. Sep. Purif. Technol. 2024, 346, 127479. [Google Scholar] [CrossRef]
  22. Krupa, A.; Sobczyk, A.T.; Marchewicz, A.; Jaworek, A. Fly ash and sorbent particles agglomeration and removal in system of electrostatic agglomerator and electrostatic precipitator. Powder Technol. 2024, 431, 119075. [Google Scholar] [CrossRef]
  23. Chen, H.; Li, H.; Wang, S.; Han, Y.; Zhai, X.; Xiao, L. Synergistic Humidification and Chemical Agglomeration to Improve Capturing the Fine Particulate Matter by Electrostatic Precipitator. Coatings 2024, 14, 420. [Google Scholar] [CrossRef]
  24. Tian, Y.; Li, M.; Fu, Y.; Liu, L.; Li, S.; Zhu, W.; Ke, Y.; Yan, K. Development and experimental investigation of the narrow-gap coated electrostatic precipitator with a shield pre-charger for indoor air cleaning. Sep. Purif. Technol. 2023, 309, 123114. [Google Scholar] [CrossRef]
  25. Andrade, R.G.S.A.; Guerra, V.G. Discharge electrode influence on electrostatic precipitation of nanoparticles. Powder Technol. 2021, 379, 417–427. [Google Scholar] [CrossRef]
  26. De Aquino Lima, F.; Guerra, V.G. Influence of wire spacing and plate spacing on electrostatic precipitation of nanoparticles: An approach involving electrostatic shielding and diffusion charging. Particuology 2023, 80, 127–139. [Google Scholar] [CrossRef]
  27. Liu, L.; Gu, X.; Zhang, L.; Sun, T.; Cao, Z.; Yu, B.; Li, J.; Zhang, L.; Xu, W.; Bu, S.; et al. Experiment and numerical simulation investigation on wire-plate electrostatic precipitator with expanded-shrunk spoilers. Powder Technol. 2022, 395, 60–70. [Google Scholar] [CrossRef]
  28. Varshney, A.; Mishra, N.K.; Das, R. Enhancement of collection efficiency for capturing submicron particles emitted from biomass burning: A novel design of semi-circular corrugated plate electrostatic precipitator. Biomass Conv. Bioref. 2023, 13, 17059–17074. [Google Scholar] [CrossRef]
  29. Park, J.H.; Ha, M.Y.; Lee, D. A numerical study on particle collection for wavy dielectric plate in 2-stage wire-plate electrostatic precipitator. J. Mech. Sci. Technol 2023, 37, 5147–5157. [Google Scholar] [CrossRef]
  30. Fayyad, M.B.; Asipuela, A.; Iváncsy, T. The effect of the corona wire distribution with W-type of collecting plates on the characteristics of electrostatic precipitators. J. Electrost. 2023, 125, 103841. [Google Scholar] [CrossRef]
  31. Duan, L.; Wang, J.; Huang, Q.; Xia, S. Experimental investigation on the performance of hybrid electrostatic-fabric precipitators with different structures. Powder Technol. 2023, 421, 118404. [Google Scholar] [CrossRef]
  32. Tu, G.; Song, Q.; Yao, Q. Experimental and numerical study of particle deposition on perforated plates in a hybrid electrostatic filter precipitator. Powder Technol. 2017, 321, 143–153. [Google Scholar] [CrossRef]
  33. Alonso, M.; Alguacil, F.J. Electrostatic Precipitation of Ultrafine Particles Enhanced by Simultaneous Diffusional Deposition on Wire Screens. J. Air Waste Manag. Assoc. 2002, 52, 1342–1347. [Google Scholar] [CrossRef] [PubMed]
  34. Han, T.; Mainelis, G. Design and development of an Electrostatic Screen Battery for Emission Control (ESBEC). J. Aerosol Sci. 2017, 107, 74–83. [Google Scholar] [CrossRef] [PubMed]
  35. Thomas, J.W. The diffusion battery method for aerosol particle size Determination. J. Colloid Sci. 1955, 10, 246–255. [Google Scholar] [CrossRef]
  36. Cheng, Y.S.; Yeh, H.C. Theory of a screen-type diffusion battery. J. Aerosol Sci. 1980, 11, 313–320. [Google Scholar] [CrossRef]
  37. Cheng, Y.S.; Yeh, H.C.; Brinsko, K.J. Use of Wire Screens as a Fan Model Filter. Aerosol Sci. Technol. 1985, 4, 165–174. [Google Scholar] [CrossRef]
  38. Cheng, Y.S.; Keating, J.A.; Kanapilly, G.M. Theory and calibration of a screen-type diffusion battery. J. Aerosol Sci. 1980, 11, 549–556. [Google Scholar] [CrossRef]
  39. Yeh, H.C.; Cheng, Y.S.; Orman, M.M. Evaluation of various types of wire screens as diffusion battery cells. J. Colloid Interface Sci. 1982, 86, 12–16. [Google Scholar] [CrossRef]
  40. Alonso, M.; Kousaka, Y.; Hashimoto, T.; Hashimoto, N. Penetration of Nanometer-Sized Aerosol Particles Through Wire Screen and Laminar Flow Tube. Aerosol Sci. Technol. 1997, 27, 471–480. [Google Scholar] [CrossRef]
  41. Alonso, M.; Alguacil, F.J.; Nomura, T. Turbulent deposition of aerosol nanoparticles on a wire screen. J. Aerosol Sci. 2001, 32, 1359–1367. [Google Scholar] [CrossRef]
  42. Shi, Y.; Li, C.; Fang, M.; Cen, J.; Wang, Q.; Yan, K. Numerical investigation of particle re-entrainment mechanism and its suppression strategy in the high-temperature electrostatic precipitator. Powder Technol. 2024, 437, 119538. [Google Scholar] [CrossRef]
  43. Andrade, R.G.S.A.; Guerra, V.G. Impact of Discharge Electrode Positioning on Nanoparticle Collection in a Single-Stage Wire-Plate Electrostatic Precipitator. ACS Omega 2025, 10, 25467–25478. [Google Scholar] [CrossRef]
  44. ISO 4783-1:1989; Industrial Wire Screens and Woven Wire Cloth—Guide to the Choice of Aperture Size and Wire Diameter Combinations—Part 1: Generalities. International Organization for Standardization: Geneva, Switzerland, 1989.
  45. ISO 4783-2:1989; Industrial Wire Screens and Woven Wire Cloth—Guide to the Choice of Aperture Size and Wire Diameter Combinations—Part 2: Preferred Combinations Fow Woven Wire Cloth. International Organization for Standardization: Geneva, Switzerland, 1989.
  46. Mermelstein, J.; Kim, S.; Sioutas, C. Electrostatically Enhanced Stainless Steel Filters: Effect of Filter Structure and Pore Size on Particle Removal. Aerosol Sci. Technol. 2002, 36, 62–75. [Google Scholar] [CrossRef]
  47. Hebbar, N.; Aitsaid, H.; Aissou, M.; Nouri, H.; Zeghloul, T. Experimental study of the collection efficiency of three configurations of blades-plates-type electrostatic precipitators. Part. Sci. Technol. 2024, 42, 1020–1030. [Google Scholar] [CrossRef]
  48. Song, Y.; Zhang, Y.; Liu, Y.; Long, W.; Tao, K.; Vafai, K. Numerical simulation of the collection efficiency of welding fume particles in electrostatic precipitator. Powder Technol. 2023, 415, 118173. [Google Scholar] [CrossRef]
  49. Kherbouche, F.; Benmimoun, Y.; Tilmatine, A.; Zouaghi, A.; Zouzou, N. Study of a new electrostatic precipitator with asymmetrical wire-to-cylinder configuration for cement particles collection. J. Electrost. 2016, 83, 7–15. [Google Scholar] [CrossRef]
  50. Hu, J.; Wen, J.; Li, H.; Duan, W.; Fan, S.; Xiao, H.; Chen, S. Experiment and numerical simulation on the fine particle migration behaviors for the collection efficiency enhancement of a wire-plate electrostatic precipitator in pig house. Comput. Electron. Agric. 2022, 199, 107145. [Google Scholar] [CrossRef]
Figure 1. Representation of (a) the experimental unit (adapted from Andrade and Guerra [43]), (b) the electrostatic precipitator (front view), (c) the wire screen and (d) the electrostatic precipitator duct with the wire screen (transversal view).
Powders 04 00023 g001
Figure 2. Experimental (at 0 kV, inlet spacing of 1.5 cm) and theoretical penetration values as a function of the particle diameter at different air velocities: (a) linear scale and (b) logarithmic scale.
Powders 04 00023 g002
Figure 3. Single fiber efficiency as a function of the particle diameter at different air velocities.
Powders 04 00023 g003
Figure 4. Current–voltage curves with the wire screen for all inlet spacings with the NaCl solution concentration of 0 and 0.1 g/L at the air velocity of 1 cm/s.
Powders 04 00023 g004
Figure 5. Comparison of the fractional collection efficiencies with and without the wire screen with different inlet spacing as a function of the particle diameter at the voltage 10 kV and at the air velocities of (a) 1 cm/s, (b) 2 cm/s, (c) 4 cm/s and (d) 5 cm/s.
Powders 04 00023 g005
Figure 6. Comparison of the overall collection efficiencies with and without [43] the wire screen (with 1 discharge electrode) for different inlet spacings at the air velocities of: (a) 1 cm/s, (b) 2 cm/s, (c) 4 cm/s and (d) 5 cm/s.
Powders 04 00023 g006
Figure 7. Analysis of the outlet aerosol concentration in relation to the PM2.5 exposure limits established by the WHO (2021) [5] at all operating conditions with the inlet spacings of: (a) 1.5 cm, (b) 10 cm and (c) 23 cm.
Powders 04 00023 g007
Table 1. Wire screen characteristics.
SymbolCharacteristicValue
w Opening (mm)0.425
d f Diameter of the wire fiber (mm)0.23
h Thickness (mm)0.45
Ɛ Open area fraction (-)0.42
α Solid volume fraction (-)0.29
S Screen parameter (-)1.019
Table 2. Experiments performed.
Wire Inlet Spacing (cm)Screen Position (cm)Velocity (cm/s)Voltage (kV)
1.54.51/2/4/510–12
10.013.08.5–11
23.026.08–10
Disclaimer/Publisher’s Note: The statements, opinions and data contained in all publications are solely those of the individual author(s) and contributor(s) and not of MDPI and/or the editor(s). MDPI and/or the editor(s) disclaim responsibility for any injury to people or property resulting from any ideas, methods, instructions or products referred to in the content.