Article

Numerical Simulation and Experimental Study of the Thermal Wick-Debinding Used in Low-Pressure Powder Injection Molding

by
Mohamed Amine Turki
,
Dorian Delbergue
,
Gabriel Marcil-St-Onge
and
Vincent Demers
*
École de Technologie Supérieure, Department of Mechanical Engineering, 1100 Notre-Dame West, Montreal, QC H3C 1K3, Canada
*
Author to whom correspondence should be addressed.
Powders 2025, 4(3), 22; https://doi.org/10.3390/powders4030022
Submission received: 24 May 2025 / Revised: 1 July 2025 / Accepted: 21 July 2025 / Published: 1 August 2025

Abstract

Thermal wick-debinding, commonly used in low-pressure injection molding, remains challenging due to complex interactions between binder transport, capillary forces, and thermal effects. This study presents a numerical simulation of binder removal kinetics by coupling Darcy’s law with the Phase Transport in Porous Media interface in COMSOL Multiphysics. The model was validated and subsequently used to study the influence of key debinding parameters. Contrary to the Level Set method, which predicts isolated binder clusters, the Multiphase Flow in Porous Media method proposed in this work more accurately reflects the physical behavior of the process, capturing a continuous binder extraction throughout the green part and a uniform binder distribution within the wicking medium. The model successfully predicted the experimentally observed decrease in binder saturation with increasing debinding temperature or time, with deviation limited 3–10 vol. % (attributed to a mandatory brushing operation, which may underestimate the residual binder mass). The model was then used to optimize the debinding process: for a temperature of 100 °C and an inter-part gap distance of 5 mm, the debinding time was minimized to 7 h. These findings highlight the model’s practical utility for process design, offering a valuable tool for determining optimal debinding parameters and improving productivity.

Graphical Abstract

1. Introduction

Powder injection molding (PIM) is a manufacturing process consisting of four main steps: (i) formulation of a powder-binder feedstock that is (ii) injected into a mold cavity to form the desired green part, which is then (iii) debound to extract the binder, and (iv) sintered at high temperature to densify the material and achieve the required in-service properties. PIM offers several advantages, including low production costs, high shape design complexity, and acceptable dimensional tolerances for metal components with high mechanical properties, making it suitable for applications in aerospace, medical, military, and automotive sectors [1,2]. Two primary PIM routes exist, with the choice largely dependent on the binder system. The first, known as high-pressure powder injection molding (HPIM), employs a high-viscosity backbone polymer, requiring injection pressures up to 200 MPa and processing temperatures typically above 150 °C [3,4,5]. The second route, low-pressure powder injection molding (LPIM), omits the backbone polymer enabling a substantial reduction in the injection pressure (to around 1 MPa) and temperatures (to approximately 80 °C) [6,7,8]. This lower injection pressure allows for smaller press capacity and mold dimensions, making the process more cost-effective. Furthermore, the absence of a high-viscosity backbone in LPIM also influences the debinding stage. Instead of solvent [9,10,11], catalytic [12,13,14], or supercritical [15,16,17] debinding commonly used in HPIM, thermal wick-debinding (TWD) is typically employed prior to sintering [18,19]. However, debinding remains one of the most sensitive steps in the PIM process, as binder removal must occur within a wicking medium while avoiding geometric distortions or undesirable chemical reactions.
The TWD approach has received limited attention in the literature, and its optimal parameters remain to be clearly defined. As a pioneer in this field, German [20] proposed in the 1980s a model to better understand the mechanisms governing binder transport during the debinding of ceramic-based HPIM parts. Based on Darcy’s law, the model predicted, though without quantifying uncertainty, that debinding occurs significantly faster for water-based feedstocks compared to organic-based feedstocks. Later, Patterson et al. [21] investigated a TWD approach using similar green parts embedded in various types of wicking media (e.g., alumina, carbon black, graphite, or other inert powders), which were subjected to different heating cycles and atmospheres (e.g., vacuum, argon, hydrogen). They confirmed that several critical parameters, including the pore size of the wicking media, heating rate, debinding temperature, and processing atmosphere, must be carefully controlled and optimized to ensure complete binder removal and the production of high-quality brown parts within an optimal timeframe. Five years later, Vetter et al. [22,23] proposed a modified model that incorporated the permeability of the wicking agent, enabling a balance between the capillary forces acting against the airflow entering the compact. They found that German’s original model underestimated the debinding time by 2 to 3 orders of magnitude. In the early 2000s, Chen et al. [24,25] experimentally investigated TWD using feedstocks composed of stainless steel powder and a glycerin-based binder. Their results validated German’s model in terms of debinding time predictions and further demonstrated that permeability and capillary pressure of the porous network are key parameters in accurately describing binder extraction in PIM parts. They also recommended using powders with uniform surface characteristics, size, and distribution to reduce surface roughness variability that could hinder capillary suction. More recently, Gorjan et al. [26,27] developed an experimental model to better understand binder removal mechanisms during TWD of ceramic-based LPIM parts. They confirmed that, during the transition from solid to liquid phase, binder thermal expansion facilitates its absorption by the wicking media at the onset of debinding. In contrast to German’s earlier observations, they also confirmed that non-uniform binder distribution can be explained by the binder’s mobility, which is governed by the porosity network within the molded part.
Building on the original model using Darcy’s law proposed by German [20], Shih and Hourng [28] developed a Monte-Carlo-type random walk model to simulate TWD, capturing the probabilistic movement of the molten binder front. The authors concluded that optimal capillary extraction occurs when using a finer wicking medium, owing to its lower permeability compared to the injected parts. Expanding on this work, Lin and Hourng [29] combined the foundational assumptions from German in 1987 [20] and Vetter et al. in 1994 [22,23] in a 2D finite element approach to simulate the binder front propagation during TWD. The predicted binder front position showed good agreement with experimental observations derived from binder penetration within the wicking medium. A few years later, Somasundram et al. [30] investigated TWD using a zirconia-based LPIM feedstock in a simple cylindrical part, employing a 1D isothermal numerical model. The binder extraction was experimentally constrained to a single direction by embedding the green part inside a borosilicate glass tube (i.e., Øexternal,part = Øinternal,tube), and placing the wicking agent at both ends. Based on porous media transport equations, their model successfully predicted the mass loss and binder distribution over time, and both simulation and experimental results confirmed a uniform binder removal driven by pore size, independently of its position within the part. One year later, the same research team enhanced their 1D numerical model to account for non-isothermal heating [31]. They observed that a high and constant debinding rate could be sustained when binder extraction is performed with both capillary action and evaporation. In 2010, Somasundram et al. [32] extended their approach to a 2D model by integrating transport equations in porous media with the Level Set method in the COMSOL Multiphysics version 6.2 commercial package. Their study employed a ceramic-based LPIM feedstock (zirconia powder, D50 = 47 µm) and a fine alumina powder as the wicking bed (particle size distribution not specified). They studied the influence of inter-part spacing on debinding kinetics and binder front evolution. While the model accurately predicted binder saturation and mass loss measured experimentally over time, discrepancies were reported between simulated and experimental binder distributions. Nonetheless, their results reinforced the conclusion that the distance between adjacent parts has a significant impact on the debinding rate.
Although numerical tools have proven effective for predicting the TWD process in LPIM mixtures, extending these predictions to metallic-based feedstocks remains largely unexplored. Notwithstanding the extensive research on binder removal in LPIM, most existing studies rely on empirical approaches or simplified numerical models that inadequately capture the complex interactions between capillary forces, permeability variations, and binder saturation dynamics. While previous works have explored thermal debinding kinetics, a comprehensive numerical framework that integrates experimentally derived permeability and capillary pressure data is still lacking.
To address this gap, the present study aims to develop and validate a numerical model capable of predicting the evolution of binder removal during thermal wick-debinding in metallic-based green parts manufactured via LPIM. Such a validated numerical model has the potential to reduce the dependence on trial-and-error approaches historically used in the TWD process, enabling the optimization of temperature, time and part spacing. Ultimately, this could lead to reduced energy consumption, lower production costs and increased productivity for the fabrication of high-added-value metallic components.

2. Methodology

2.1. Feedstock Preparation and Molding

In this study, a 17-4PH stainless steel powder was used for feedstock formulation (i.e., medium used to form green parts), and a 99.9% alpha-phase alumina powder served as the wicking medium during the debinding process. Scanning electron microscopy (Hitachi SU70, Toronto, ON, Canada) and particle size distribution measurements (LS 13320 XR Beckman Coulter, Mississauga, ON, Canada) are presented in Figure 1. The water-atomized 17-4PH stainless steel powder (Epson Atmix Corporation, Hachinohe Aomori, Japan) exhibits a near-spherical morphology (Figure 1a) with D10, D50, and D90 of 3, 12, and 31 µm, respectively (Figure 1b). This precipitation-hardening stainless steel is widely used in aerospace, chemical, petrochemical, and many other sectors for its high strength and good corrosion resistance (Cr: 15.0–17.5 wt. %, Ni: 3.0–5.0 wt. %, Cu: 3.0–5.0 wt. %, C ≤ 0.07 wt. %, Mn ≤ 1.0 wt. %, Si ≤ 1.0 wt. %, p ≤ 0.04 %, S ≤ 0.03 wt. %, Nb: 0.15–0.45 wt. %, Ta: 0.15–0.45 wt. %, Fe: Balance). The alumina powder (Alfa Aesar, Thermo Fisher Scientific, stock # 42572, St-Laurent, QC, Canada) also presents a near-spherical shape (Figure 1c), but with significantly finer particles, approximately 10 to 30 times smaller than the stainless steel powder, with D10, D50 and D90 of 0.3, 0.5, and 1.2 µm, respectively (Figure 1d). Since alumina is known to remain inert with stainless steel powder, this very fine powder was selected for its suction and compaction capabilities to effectively wick the binder and maintain the shape of the metallic parts during the debinding operation.
The binder system was formulated using paraffin wax, Carnauba wax, stearic acid, and ethylene-vinyl acetate in the proportions reported in Table 1. The density and melting point of each feedstock constituent were assessed by differential scanning calorimetry (TA Instrument Discovery DSC2500, New Castle, DE, USA) and gas pycnometry (AccuPyc II 1340, Norcross, GA, USA) in accordance with the ASTM B923-16 [33] and ASTM D3418-15 [34] standards. These four binder components have been selected for their current use in low-pressure injection molding (LPIM) [35]. Each component served a specific function. Paraffin wax was employed as the primary constituent due to its low viscosity, stable rheological behavior and cost-effectiveness [36,37]. Carnauba wax was included to enhance the green strength of molded parts and to control post-injection shrinkage, thus facilitating demolding and handling [38]. Stearic acid, a widely used surfactant, was added to promote chemical adsorption at the powder-binder interface, improving feedstock homogeneity and reducing viscosity [39]. Lastly, ethylene-vinyl acetate was incorporated in small quantities as a thickening agent to fine-tune the viscosity and prevent powder segregation before and during molding [40].
The binder density, ρ b i n d e r = 0.92 g/cm3, was calculated with a rule of mixtures based on the data reported in Table 1. To produce the feedstock, the stainless steel powder was combined with molten binder (at 100 °C) in a planetary mixer operating at 10 rpm for 15 min under vacuum, yielding a solid loading of 60 vol. % of powder. The resulting two molten feedstocks, maintained at 90 °C, were successively loaded into the molding press illustrated in Figure 2a (detailed information on the molding press is provided in [41]) and then injected into the mold cavity presented in Figure 2b. During the injection, the mixture flowed through the mold gate and runner, filling six Ø16 mm cylindrical cavities simultaneously. Specimens of varying thicknesses (5 to 16 mm) were produced by changing the side plate. A mold temperature of 35 °C and a constant injection flow rate of 60 cm3/s were used, resulting in injection pressures below 2 MPa. Following the injection, the mold was cooled down to solidify the green parts. Once removed from the mold, the green parts were separated to be individually weighed.

2.2. Thermal Wick-Debinding Treatment

Figure 3a,b illustrates the top and side views of the experimental setup, where two green parts (in black) are embedded in the alumina powder bed (in white) prior to the debinding process. To provide an experimental 2D model, each green part was sandwiched between two quartz plates (in blue), creating a controlled 2D debinding environment in the radial direction of the parts. This configuration is schematized in Figure 3c,d by light and dark gray areas within the wicking zone. To prepare the setup, the alumina powder was first sieved (mesh size no. 18, opening 1 mm) to break agglomerates. The powder was then deposited in a metallic container and manually compacted to produce a uniform bottom layer approximately 10 mm thick. A first series of quartz plates was positioned on this alumina bed, upon which the green parts were deposited, as illustrated in Figure 3e. The specimens were then surrounded by additional alumina powder, which was slightly compacted. A second series of quartz plates was placed on top, and the entire assembly was buried with a final layer of alumina powder, as shown in Figure 3f.
The metallic boats containing the green parts, quartz plates, and alumina powder were placed inside a sealed metallic retort, which was purged five times using alternating cycles of vacuum and argon. After purging, the retort was filled with argon at a constant 15 L/min and inserted into a Nabertherm N 41/H debinding furnace (Nabertherm, New Castle, DE, USA) to perform the seven different thermal wick-debinding cycles reported in Figure 3g. Four interrupted debinding cycles were performed to assess residual binder content in partially debound parts. Each cycle comprised three segments (heating, holding, and cooling) with heating and cooling rates fixed at 0.5 and 1.5 °C/min, respectively. The holding temperatures were varied at 75, 90, 105, and 250 °C for 2 h (cycles #1 to #4 plotted in blue in Figure 3g). Based on a previous study using a similar binder formulation [42], holding temperatures were selected to lie between the binder’s melting point (determined by DSC) and its initial decomposition temperature (identified by TGA). Specifically, the minimum debinding temperature was set 15 °C above the melting point to ensure the binder remained in a fully liquid state, while the upper limit of 250 °C was chosen to prevent binder thermal degradation. Two intermediate temperatures within this range were finally selected to investigate the impact of debinding temperature on the residual binder content in the green parts. To investigate the evolution of binder removal over time, three additional time-dependent cycles were conducted at a constant holding temperature of 100 °C for durations of 1, 5, and 10 h (cycles #5 to #7 shown in red in Figure 3g), as a previous study [42] confirmed that a debinding time of approximately 10 h is sufficient to minimize temperature gradients and avoid defects. These cycles, along with cycle #3, were designed to study the debinding pattern over time. Following the debinding treatment, the brown parts were removed from the alumina bed, cleaned with compressed air, and weighed again. One specimen per debinding condition was fractured to examine the internal binder distribution and bonding networks at different locations using SEM imaging (Hitachi 3600, Secondary Electron Detector, Toronto, ON, Canada). Binder removal was quantified via both thermogravimetric analysis (TGA) (PerkinElmer STA 8000, Shelton, CT, USA) and direct mass loss measurement by weighing the debound samples. TGA was conducted under a nitrogen atmosphere with a flow rate of 50 mL/min, starting with a hold at 20 °C for 1 min, followed by heating to 450 °C at 10 °C/min, and an isothermal hold at 450 °C for 60 min.

2.3. Numerical Modeling of Thermal Wick-Debinding Process

2.3.1. Problem Formulation and Governing Equations

The thermal wick-debinding process is driven by capillary forces that govern the transport of the binder through porous media. Unlike traditional solvent or thermal debinding processes, this approach relies on the migration of the liquid-phase binder from the green part into a wicking medium. Specifically, the binder is extracted from a coarse, interconnected pore network (i.e., the green part) into a finer interconnected pore network (i.e., the wicking medium) under the influence of capillary action. Therefore, the formulation of this problem boils down to capturing the interaction of several phases across a porous network to predict the evolution of binder saturation and capillary pressure over time. Thus, the present work considers the interaction between two (2) fluids, liquid binder (i.e., the wetting phase) and argon gas (the non-wetting phase), going through two (2) different computational domains: the pore network within the green part (domain #1) and the surrounding wicking medium (domain #2). At the beginning of the numerical simulation, 100% of the binder is located within the green part while the wicking medium contains none. As the debinding progresses, binder is transferred into the wicking medium due to the capillary pressure difference between the two domains. This difference arises because the wicking medium possesses a much finer pore structure than the green part, resulting in a higher capillary force. Thermal wick-debinding occurs when the injected cylindrical parts (schematized in Figure 2b) are buried within a bed of wicking agent (shown in Figure 3e,f) and heated above the melting point of the binder. At the debinding temperature, the molten binder is gradually drawn out from the stainless steel green parts into the wicking medium. Therefore, large pores in the green part are gradually emptied of their liquid binder and absorbed by the wicking medium. This transfer of the liquid-state binder by the wicking agent continues until an equilibrium between the capillary forces in the two domains is reached. That is, when the pores retaining the binder in the part are similar in size to those of the wicking medium. At this point, the mass transport of the binder ceases.
The two simulation approaches compared in this project, the Level Set method and the Multiphase Flow in Porous Media method, are used to compute the spatial distribution and the remaining volume fraction of binder, also referred to as binder saturation, during the debinding process. The saturation ( S ) of the binder in the green part is defined as the ratio of the volume of the binder ( V b i n d e r ) to the total pore volume of the part ( V p o r e s ), as described by Equation (1):
S = S b i n d e r = V b i n d e r V p o r e s
In other words, the saturation represents the fraction of a pore network that is filled with fluid. When all pores are filled with binder, V b i n d e r = V p o r e s , and thus, the saturation is S b i n d e r = 1 . Conversely, when all pores are emptied of binder, V b i n d e r = 0 , and the saturation becomes S b i n d e r = 0 . In this equation, V p o r e s remains constant while V b i n d e r evolves over time according to Darcy’s law, capillary effects, and permeability of the domains. This saturation is used in the numerical model via a capillarity model (e.g., Brooks-Corey equations described below), and implemented in COMSOL as a time- and space-dependent field variable. For conciseness, the binder saturation ( S b i n d e r ) will be denoted S throughout the rest of this work. The temporal and spatial evolution of binder saturation ( S ) during debinding is described by the following continuity equation (Equation (2)), which incorporates the fluid velocity to describe fluid migration and provide a physically consistent representation of the extraction process:
ε S t = · u
where ε is the porosity (i.e., the volume fraction of voids) within the computational domains, t is the time, and u is the fluid velocity within the computational domains. The transport of the liquid binder from the green part into the wicking agent is governed by Darcy’s law (Equation (3)). This law relates the fluid velocity ( u ) to the intrinsic permeability of the porous medium ( K ), the fluid viscosity ( μ ), and the capillary pressure ( P ), or more specifically, the capillary pressure gradient ( P ), and is described as:
u = K μ P
The intrinsic permeability K of a porous medium represents its ability to allow a saturating fluid to flow through its structure. This parameter is related to the size, shape, and connectivity of the pores, and is, by definition, independent of the fluid’s properties. A fluid may flow more easily through a porous medium exhibiting a high permeability than through one with a low permeability. The evolution of the interface between the two immiscible phases (i.e., the liquid binder and the debinding gas infiltrating the wicking pores) was tracked using a fixed mesh strategy. By solving Darcy’s equation, the Multiphase Flow in Porous Media method was able to capture the mass transport of the binder driven by capillary forces generated by such a network of interconnected pores.
However, in the presence of two fluids, such as the liquid binder and argon gas, the intrinsic permeability alone is no longer sufficient to describe the effective permeability since the latter assumes that only one fluid occupies the entire pore network. When two fluids occupy the same pore network, the velocity of each fluid can be calculated by introducing the relative permeability. This relative permeability is a dimensionless factor ranging from 0 to 1, which accounts for both the intrinsic permeability and the fluid saturation of the porous medium. It effectively represents the fraction of K available to a given fluid, depending on how much of the pore network it occupies. To describe this relationship, Brooks and Corey [43] proposed a model initially developed for soil-water systems, which links the parameters S ,   K , and P (as introduced in Equations (2) and (3)). This model defines the effective saturation  S e , a normalized form of saturation, and uses it to calculate the relative permeability, K r , as:
S e = S S r 1 S r = P d P λ
And
K r = K e K
where S r is the irreducible (or residual) saturation,  P d is the entry capillary pressure (i.e., the minimum pressure required to initiate binder flow within the pore network), P is the local capillary pressure, λ is the pore size distribution index, and K e is the effective permeability of the part experienced by the binder, described as:
K e = K P d P 2 + 3 λ
By combining Equations (4) and (5), the relative permeability of the part experienced by the binder can be expressed as:
K r = K e K = S e ( 2 + 3 λ ) λ = S S r 1 S r ( 2 + 3 λ ) λ = P d P ( 2 + 3 λ )
During the debinding process, the effective saturation ( S e ) varies spatially within the green part (i.e., the porous medium) as binder is progressively extracted. This evolution continues until the mass transport ceases, leaving behind a portion of the binder that becomes immobile within the pore network. At this stage, the remaining volume fraction of the binder is called the irreducible saturation ( S r ), i.e., the amount of binder trapped in the green part because the effective permeability ( K e ) has approached zero. At the beginning of the debinding process, a minimum capillary pressure ( P d ) is required to initiate the binder flow from the large pores of the green part into the finer pores of the wicking medium. This pressure overcomes the resistance associated with the initial liquid–gas interface. Finally, as reported by Brooks and Corey [43], the pore size distribution index ( λ ) is a critical parameter reflecting the breadth of the pore size distribution. It plays a key role in governing both the relationship between capillary pressure and saturation, and the relationship between relative permeability and saturation throughout the wick-debinding process.
Depending on the material and processing conditions, this index typically ranges from 3 to 7 for porous ceramic or metallic networks [44,45]. A high pore size distribution index indicates a narrow pore size distribution (i.e., a more homogeneous pore structure), while a low pore size distribution index reflects a broader pore size distribution (i.e., a more heterogeneous pore structure). As shown in Figure 1b, the particle size distribution (PSD) of the dry stainless steel powder is characterized by a D10 = 3 µm and a D90 = 31 µm, yielding a D90/D10 ratio of approximately 10, indicating a broad particle size distribution. According to Mualem [46], such a wide PSD generally leads to a heterogeneous pore network. At a solid loading of 60 vol. %, this broad PSD promotes a non-uniform packing structure, which gives rise to a heterogeneous pore size structure, as evidenced by the SEM image presented in Figure 1a. Following the classification proposed by Dullien [47], these morphological characteristics correspond to an intermediate pore structure, which is typically associated with a low pore size distribution index.
For the wicking computational domain, a pore size distribution index of λ w i c k i n g = 0.74 was adopted, based on mercury intrusion porosimetry (MIP) measurements reported by Somasundram et al. [32]. However, for the injected green part, this MIP approach cannot be applied since its pore network was filled with binder, preventing MIP infiltration. Consequently, the pore size distribution index for this second computational domain ( λ p a r t ) was estimated through a parametric numerical study, guided by values reported in the literature for similar systems. To assess the impact of λ p a r t , a series of numerical simulations were conducted with λ p a r t values ranging from 0.6 to 10, and the step size reciprocal was plotted for all time steps (Figure 4). A high step size reciprocal (meaning a small time step) designates an unstable simulation, where the solver must reduce its step to maintain convergence. Conversely, a low step size reciprocal implies a large time step, leading to a stable simulation and faster computation. In Figure 4, convergence is indicated by the formation of a plateau, signifying that the solution reaches a numerically acceptable equilibrium (even at a non-zero but sufficiently small value of the residual). At low λ values (e.g., 0.6 or 1), the solver initially converges, but becomes rapidly unstable and diverges. Physically, such a low λ value corresponds to excessive capillary pressures, leading to unrealistic fluid velocities. For intermediate values (i.e., 1.4 ≤ λ p a r t ≤ 2.6), the debinding model converges rapidly and remains stable. These values offer a realistic balance between capillarity and permeability, resulting in a gradual and physically consistent evolution of binder saturation. On the other hand, higher λ values (e.g., 3 and 5) exhibit slower convergence, while λ = 10 causes the simulation to diverge immediately. This behavior reflects a loss of capillary efficiency, where a narrow pore size distribution leads to insufficient capillary pressure and thus, an immobile binder, contradicting with experimental observations. In light of these results, four intermediate pore size distribution index values between 1.4 and 2.6 were selected to study the influence of the binder distribution in both computational domains.
In the Multiphase Flow in Porous Media method proposed in this work, the interface between the binder and the wicking agent evolves dynamically under the influence of pressure gradients and fluid properties. The simulation tracks the transport and distribution of the two immiscible fluids (binder and argon gas) as they move from the green part into the wicking medium, corresponding to the two distinct computational domains. This process is governed by mass conservation, which is expressed through the following Equation (8), incorporating Darcy’s law:
t ε j ρ i S i j + ρ i K j K r , i j μ i P i j = Q i j = 0
where ε j is the volume fraction of porosity in the domain j , ρ i is the density of the fluid i , S i j is the saturation of the fluid i calculated in the domain j , K j is the intrinsic permeability of the domain j , K r , i j is the relative permeability of the part experienced by the fluid i calculated in the domain j , μ i is the viscosity of the fluid i , P i j is the capillary pressure of the fluid i calculated in the domain j , and Q i j is the flow of the fluid i within the computational domain j , with the index i denoting the fluid (i.e., the binder or argon gas) and the index j representing the computational domain (i.e., the green part or the wicking medium).
As proposed by Brooks and Corey [43], the relative permeability of the domain was defined for the specific fluid being modeled, since this parameter depends not only on the intrinsic permeability of the computational domain, but also on the saturation of the fluid flowing within it. The relative permeability of the part, experienced by each fluid phase (binder or argon), initially introduced in Equation (7), is formally expressed below in Equations (13) and (14). Although this approach can ultimately be used to assess the amount of binder or argon within the two computational domains, Equation (8) was used to calculate only the binder saturation, either within the part ( S b i n d e r , p a r t ) or within the wicking medium ( S b i n d e r , w i c k i n g ). During the debinding process, the relative permeability in both domains evolves over time (as reported in Equation (7)). Specifically, the binder saturation in the part decreases as the binder is extracted, while it increases in the wicking medium as the binder is absorbed. Since the total volume fraction of binder within the combined porous network (i.e., the green part and the wicking medium) must remain conserved, the binder saturation in the part is computed as:
S b i n d e r , p a r t = 1 S b i n d e r , w i c k i n g
with a saturation S b i n d e r , p a r t = 1 at the beginning of the debinding process, indicating that 100 vol. % of the pore volume in the part is initially filled with binder, while the binder saturation in the wicking medium S b i n d e r , w i c k i n g = 0. In this work, the binder initially present in the green part corresponds to 40 vol. % of the total volume of the part, as the LPIM feedstocks were formulated using a solid loading of 60 vol. %. By rearranging Equation (4), the capillary pressure of the binder in a given domain P b i n d e r , j  can be defined as a function of the effective saturation of the binder in one of the domains S e , b i n d e r , j , the minimum capillary pressure P d , j within one of the domains at the start of binder extraction, and λ j representing the pore distribution index in each domain:
P b i n d e r , j = P d , j 1 S e , b i n d e r , j 1 / λ j = P d , j 1 S e , b i n d e r , j 1 / λ j
This parameter, P b i n d e r , j , changes throughout the debinding process, as the effective saturation evolves over time with the progressive migration of the binder from the part domain to the wicking domain. Specifically, P b i n d e r , j increases when the binder content decreases (i.e., when S e , b i n d e r , j decreases), and conversely, decreases when the binder content is higher. This relationship highlights that a higher capillary pressure is required to maintain the binder capillary front as the porosity network in the part domain becomes increasingly depleted. By further rearranging Equation (4), the effective saturation of the binder in one of the domains ( S e , b i n d e r , j ) can be expressed in Equation (11) as a function of the binder saturation ( S b i n d e r , j ) and the irreducible saturation in this domain ( S r , b i n d e r , j ):
S e , b i n d e r , j = S b i n d e r , j S r , b i n d e r , j 1 S r , b i n d e r , j
Since argon is a gas, no irreducible saturation ( S r , a r g o n , j ) is expected for this fluid. Consequently, its effective saturation in one of the domains ( S e , a r g o n , j ) becomes:
S e , a r g o n , j = S a r g o n , j
when considering S r , p a r t , a r g o n = S r , w i c k i n g , a r g o n = 0. The relative permeability of the part experienced by the binder ( K r , b i n d e r , j ) or the argon gas ( K r , a r g o n , j ) into one of the domains can be specifically formulated by combining Equations (11) and (12) into Equation (7) to obtain the following expressions:
K r , b i n d e r , j = S e , b i n d e r , j ( 2 + 3 λ j ) λ j = S b i n d e r , j S r , b i n d e r , j 1 S r , b i n d e r , j ( 2 + 3 λ j ) λ j
K r , a r g o n , j = 1 S e , a r g o n , j 2 1 S e , a r g o n , j 2 + λ j λ j
These relative permeabilities include the intrinsic permeability under conditions of no mass transport (i.e., when saturation remains constant). Since the permeability of the part varies with fluid distribution, this equation adjusts the effective flow resistance during the thermal wick-debinding process by integrating an adjusted K r into Darcy’s law to accurately simulate binder extraction. The resulting equations capture the non-linear behavior of the permeability and capillary pressure on the saturation within each porous medium. Accordingly, the relative permeabilities of the part and the wicking medium are calculated as functions of their respective saturations, as described above in Equations (11) and (12). In summary, the model proposed in this work simulates the dynamic evolution of binder saturation in both the green part and the wicking medium during the debinding process.

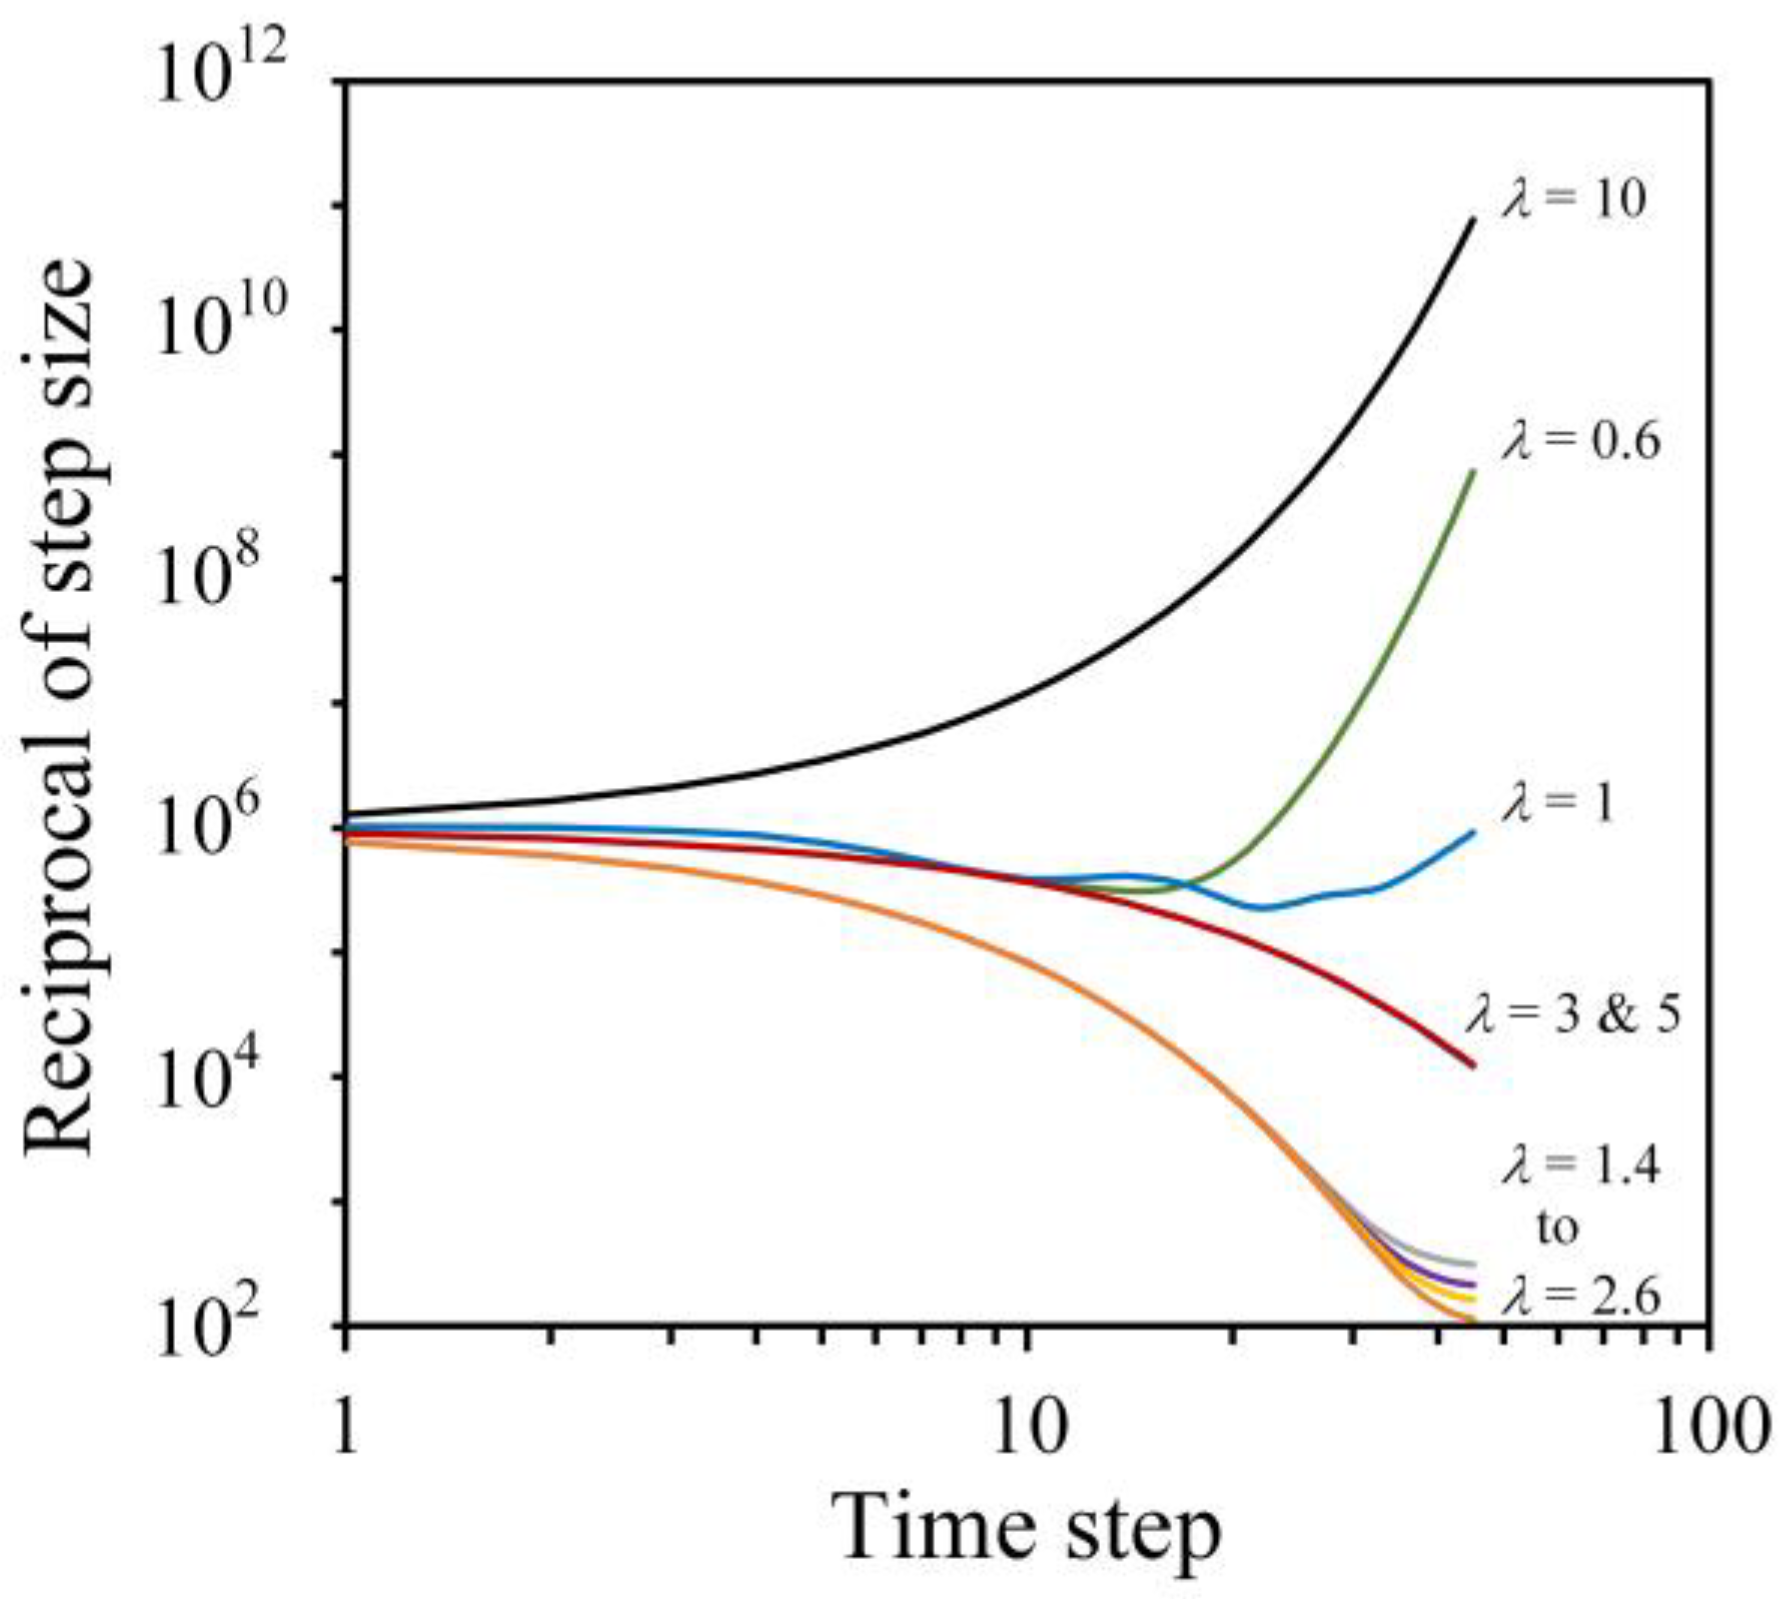
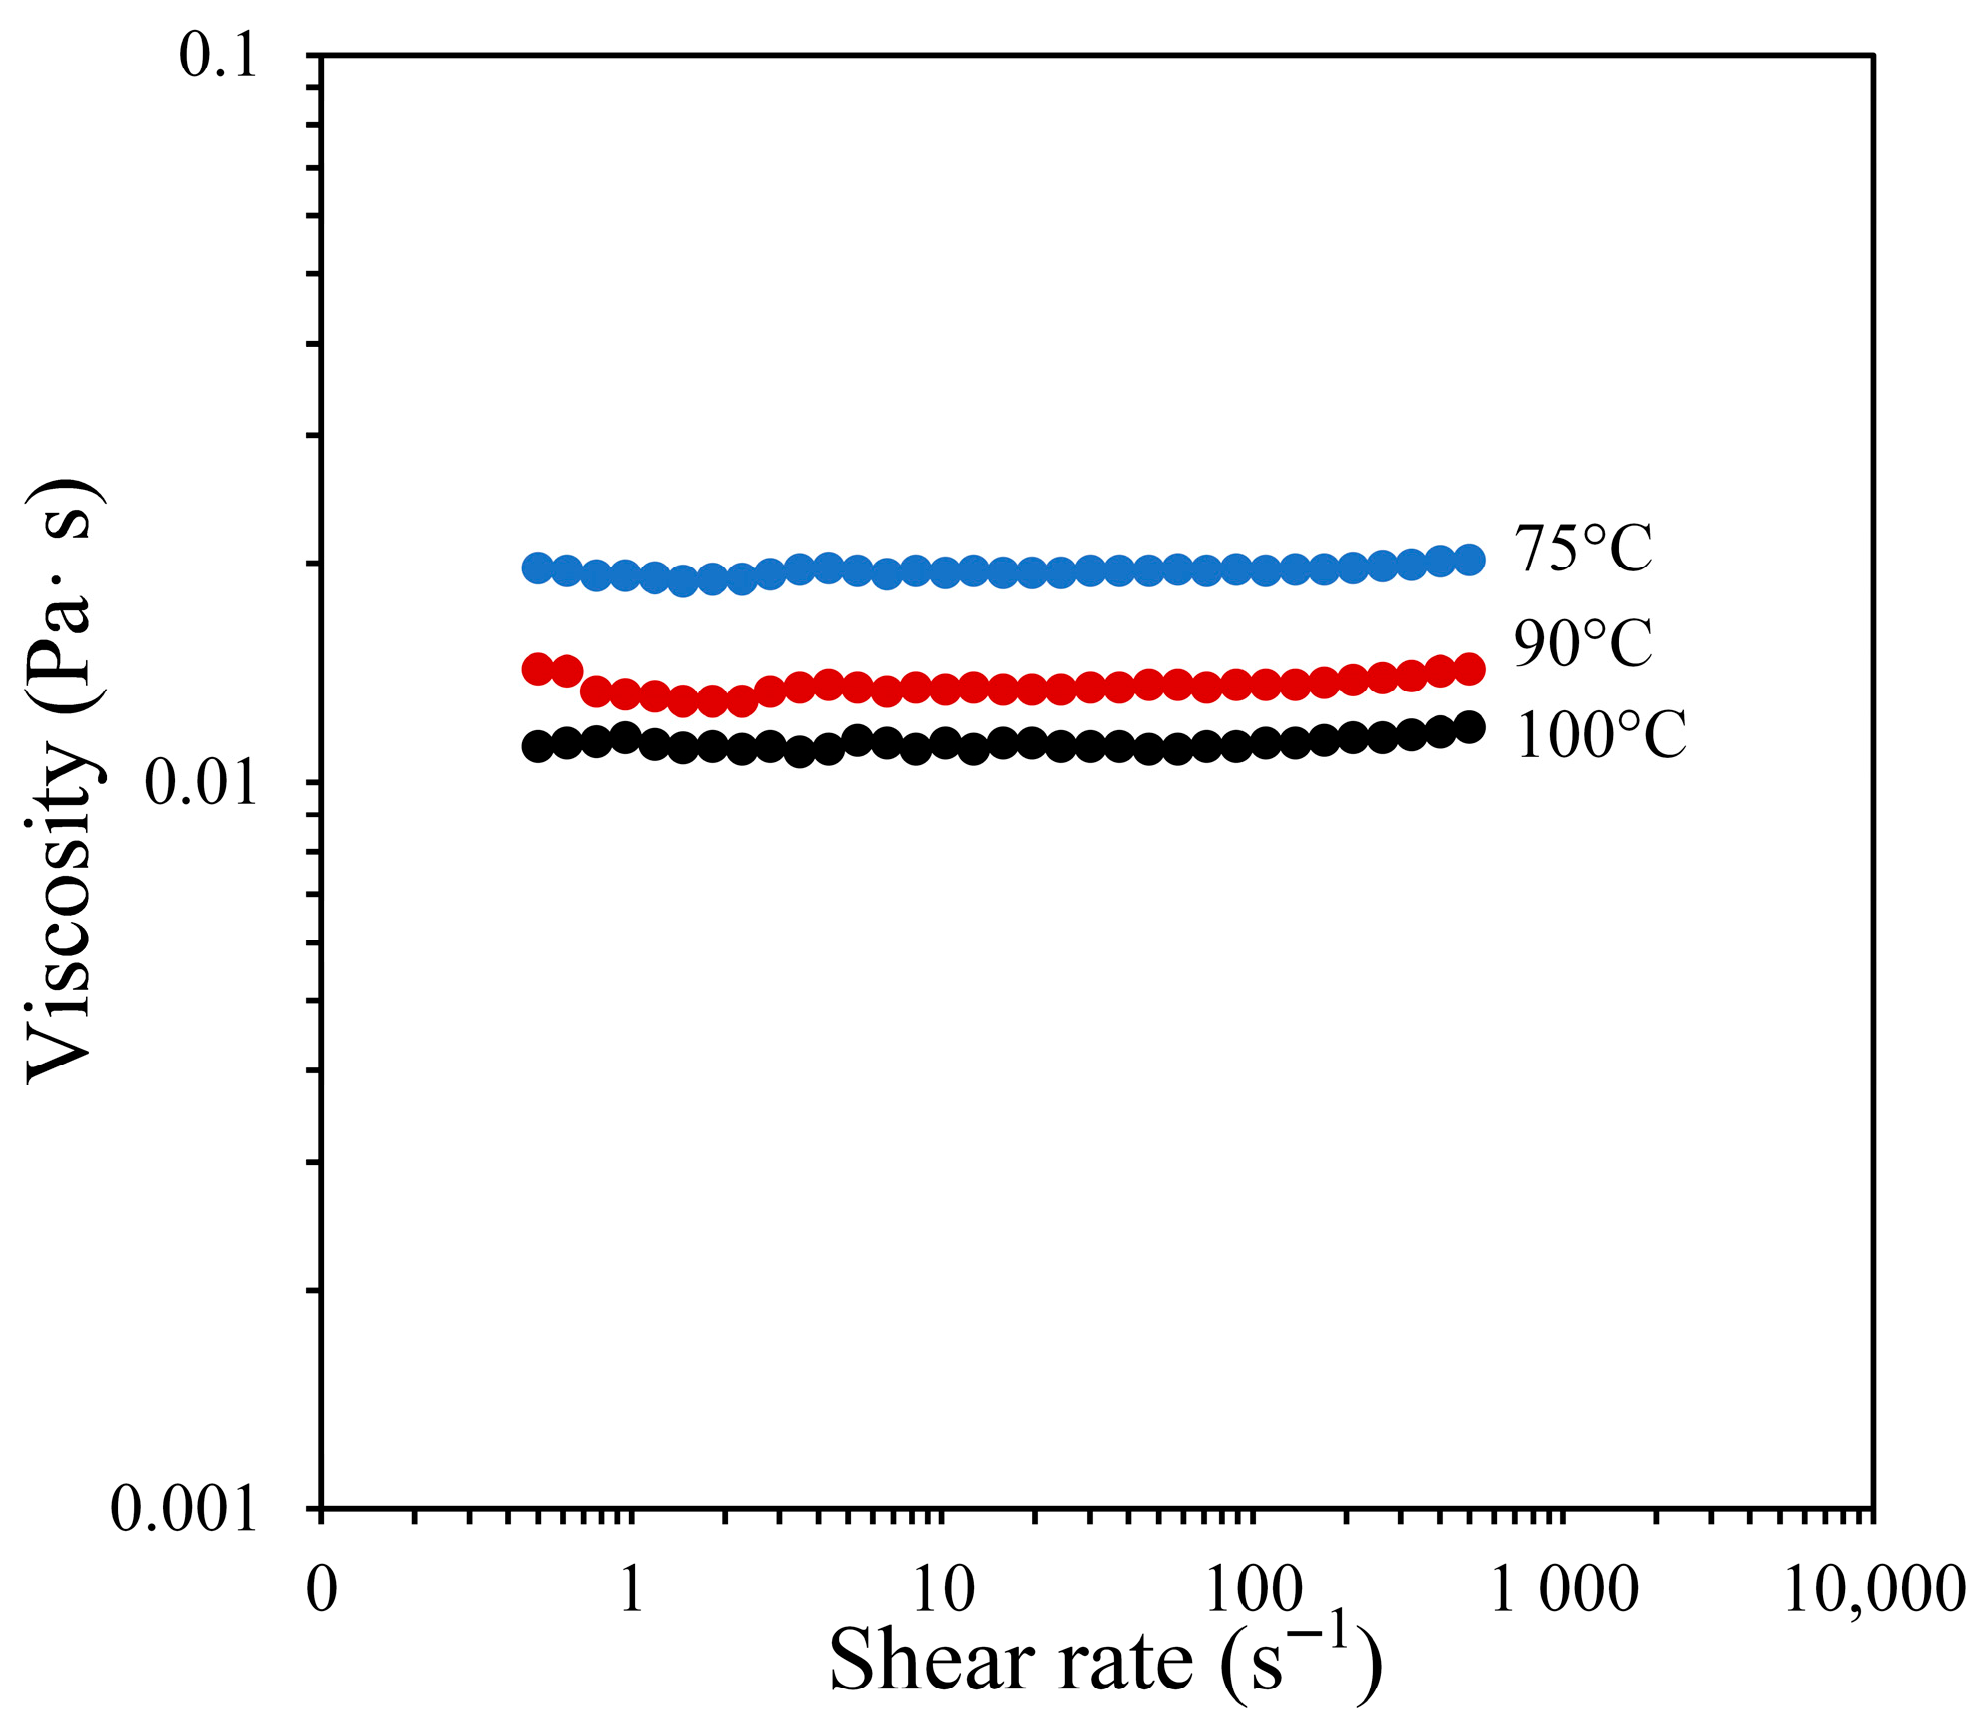
2.3.2. Determination of Simulation Parameters

The binder viscosity was determined using the feedstock viscosity profiles presented in Figure 5, which were obtained at 75, 90, and 100 °C using a rotational rheometer (Anton Paar MCR 302, Montreal, QC, Canada). A concentric-cylinder cell (CC-17), coupled with a Peltier temperature-controlled measuring system (C-PTD 200, Montreal, QC, Canada), was employed to apply shear deformation rates ranging from 0.5 to 500 s−1. The temperature of approximately 100 °C represents the maximum temperature before excessive binder evaporation is observed during testing. Therefore, a mean viscosity value of 0.011 Pa·s, extracted from Figure 5, was used as the binder viscosity at the debinding temperature (250 °C) in the simulations.
The pore-scale model, initially based on a standard application in the COMSOL Multiphysics library, was used to determine the intrinsic permeability of the part ( K p a r t ) and wicking medium ( K w i c k i n g ), as well as the minimum capillary pressure in the part ( P d , p a r t ) and in the wicking medium ( P d , w i c k i n g ). These four parameters served as input values for the debinding model proposed in the present work. To extract them, SEM observations reported in Figure 6a,b were used to represent the connectivity and size of internal pores. The SEM images were processed using the Fiji (ImageJ, version 2.16.0) image processing software, where grayscale images were binarized to distinguish the porous space (black regions in Figure 6c,d) from the solid region (white regions in Figure 6c,d). As seen in Figure 6e,f, the porous area ( A p ) was meshed, while the solid area ( A s ) was excluded from the calculation. In this model, the binder is arbitrarily assumed to flow from left to right through the pore network, driven by a pressure gradient between the inlet and outlet, without penetrating the stainless steel or alumina particles. To ensure representativity, the SEM images were selected to capture a typical pore structure: large enough to include multiple particles and pores, thereby representing pore-scale details, but detailed enough to reveal the relevant geometric features needed for fluid flow modeling (while avoiding isolated anomalies). The Creeping Flow interface method available in COMSOL was employed to simulate the fluid behavior. This approach was selected to account for the highly laminar fluid flow patterns across few microns wide pore channels expected during debinding (i.e., a very low Reynolds number). In fact, the equations solved by this method are the Stokes equation and the continuity equation, describing the conservation of momentum Equation (15) and conservation of mass Equation (16):
P b i n d e r , i + μ b i n d e r 2 u b i n d e r = 0
· u b i n d e r = 0
using the same binder capillary pressure within each domain ( P b i n d e r , j ), binder viscosity ( μ b i n d e r ), and binder velocity vector ( u b i n d e r ) previously defined. The fluid was considered isothermal with a constant density, and gravitational effects were neglected due to the small scale of the problem. A no-slip boundary condition was applied at the surfaces of solid particles by setting the fluid velocity to zero at those boundaries. Additionally, a symmetry condition was imposed to ensure the absence of flow across the upper and lower boundaries highlighted in red in Figure 6e,f.
The minimum capillary pressure ( P d , j ) for each domain j (i.e., the part or the wicking medium) was assessed using a pore-scale model in COMSOL. As reported in Figure 7, this was achieved by varying the binder capillary pressure in each domain ( P b i n d e r , j ) and numerically calculating the resulting effective porosity ( ε e f f ) within the porous domain using the following relation:
ε e f f = A e x t r a c t e d P d , j A p
where A e x t r a c t e d P j is the surface area of the binder displaced within each domain under a given minimum capillary pressure P d , j , and A p is the porous area. To determine P d , j , an initial capillary pressure of 5.89 × 10⁴ Pa, as proposed by Somasundram et al. [32], was used as a starting point and iteratively adjusted until the resulting capillary pressure produced the expected targeted porosity ( ε j ), which was formally calculated with Equation (18):
ε j = A p A t
using the numerically integrated porous area ( A p ) and the total modeled area ( A t = A p + A s = L × H ), both described above in Figure 6e,f. The total area covers 109 × 167 µm for the part computational domain and 3.3 × 2.2 µm for the wicking computational domain. The resulting minimum capillary pressure values for the part ( P d , p a r t ) and the wicking medium ( P d , w i c k i n g ) are reported in Table 2. Since the outlet pressure is set to zero, the pressure difference required in the Creeping Flow interface method was set to P = P d , p a r t for the part, and P = P d , w i c k i n g for the wicking medium.
The intrinsic permeability K j of each porous domain was calculated using the binder velocity in the rearranged Darcy’s law:
K j = u b i n d e r μ b i n d e r L j P b i n d e r , j
where L i is the length of the computational domain, μ b i n d e r and P b i n d e r , j are previously defined, and u b i n d e r is the binder velocity. u b i n d e r can be computed as:
u b i n d e r = Q o u t - b i n d e r , j H j
where Q o u t - b i n d e r , j is the volumetric flow rate of the binder at the outlet boundary and H j is the height of the computational domain. The volumetric flow rate at the outlet boundary was calculated by integrating the normal component of the velocity field over the outlet boundary using the following formal representation:
Q o u t , j = ʃ Γ o u t u b i n d e r · n   d Γ
where Γ o u t is the outlet boundary (represented by the blue line in Figure 6e,f) and n is the outward normal vector. Table 2 outlines all parameters and material properties required in the present study. It is important to note that several parameters, such as intrinsic permeability and capillary pressure, are directly influenced by particle size, shape, surface roughness, and interparticle interaction (e.g., packing density). Consequently, these parameters must be recalculated if any changes in powder characteristics occur.

3. Results and Discussion

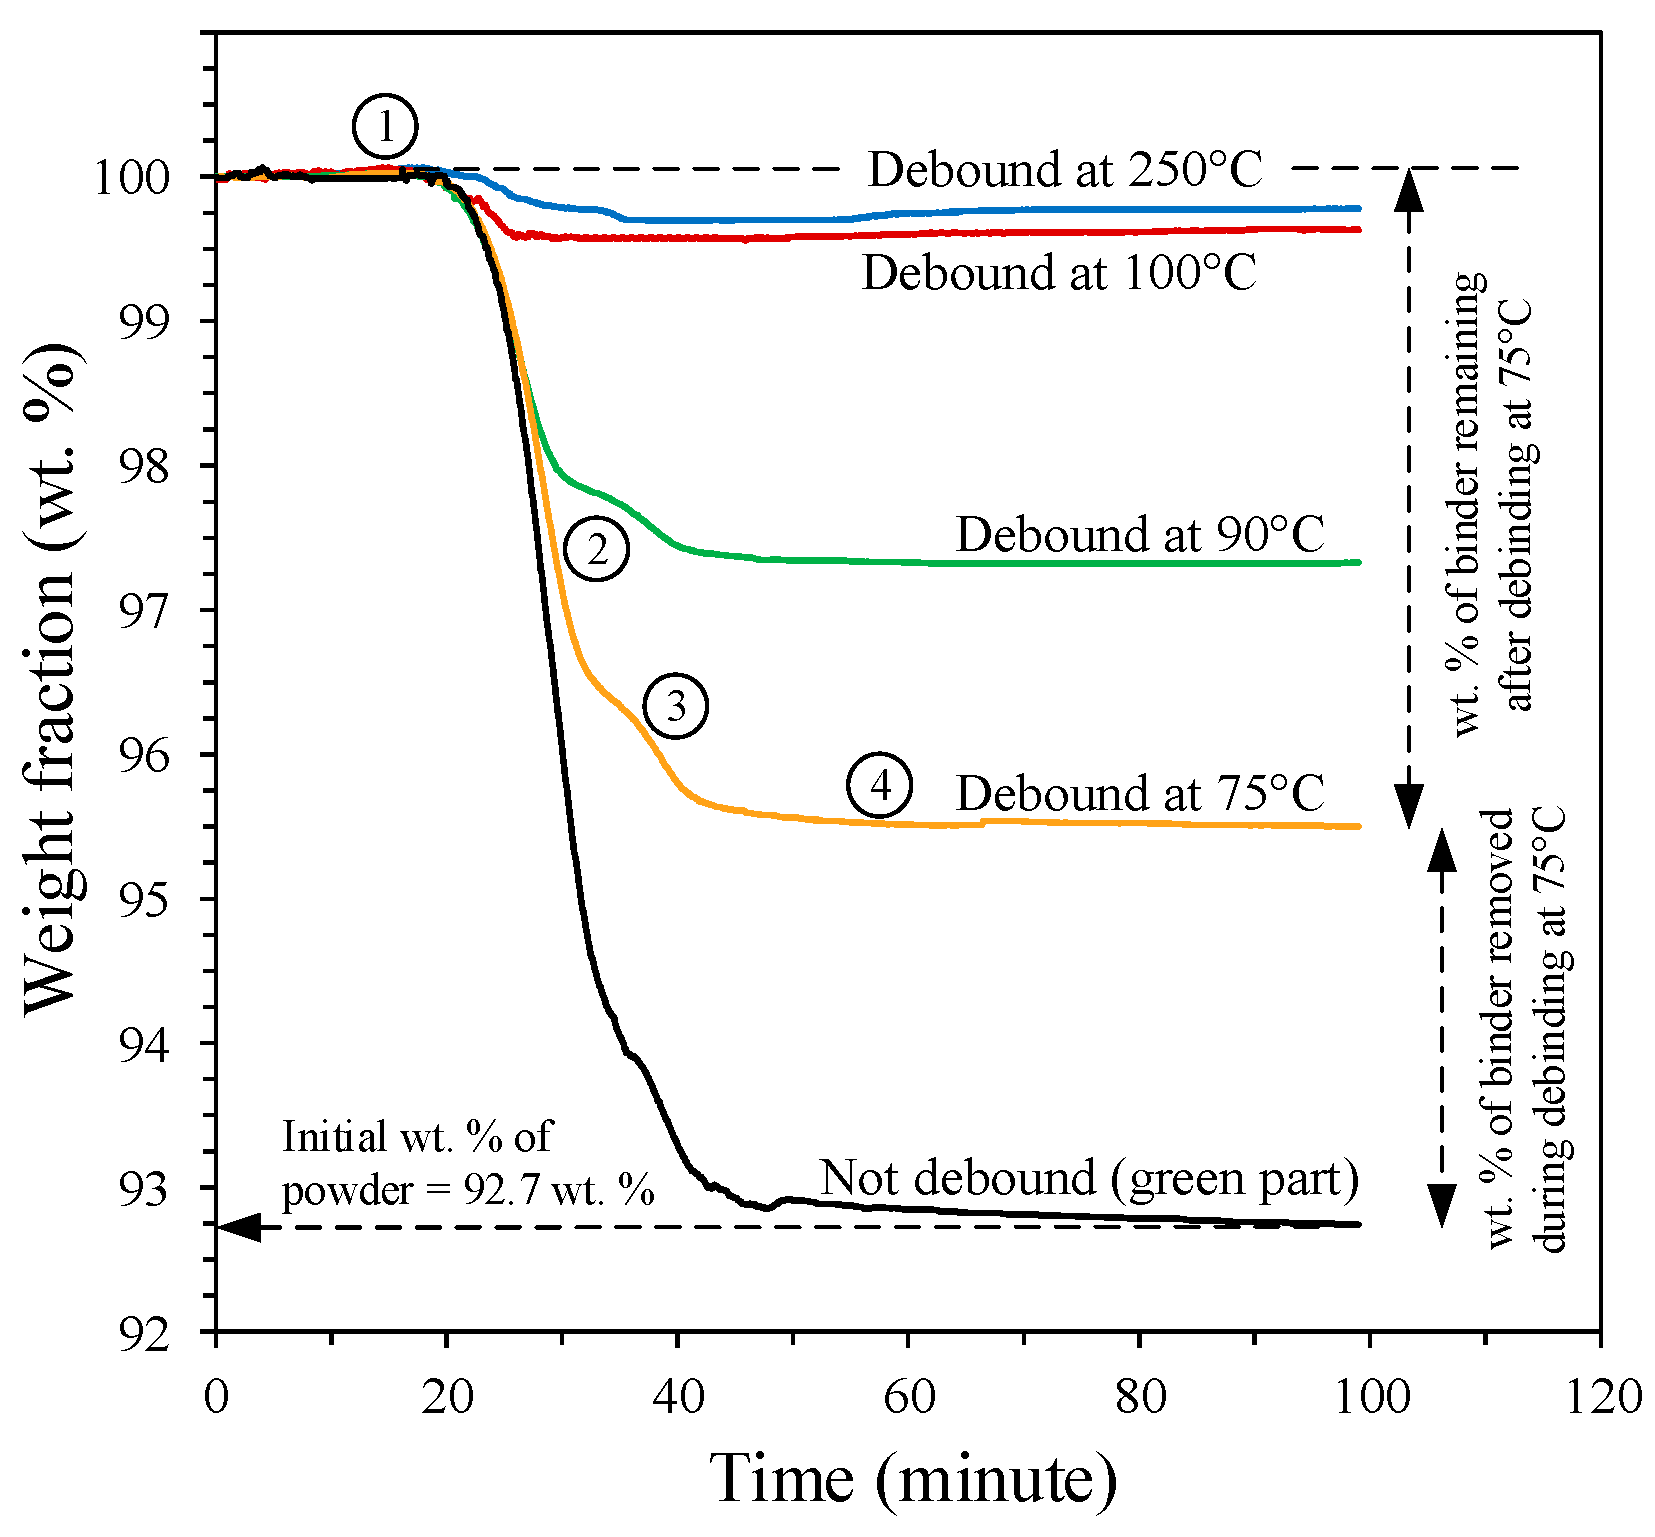
3.1. Calculation of the Binder Saturation

Figure 8 illustrates the spatio-temporal evolution of binder saturation in two neighboring parts and its migration into the wicking medium for a debinding at 100 °C using two different numerical models. Exploiting the symmetry of the numerical domain, parts #1 and #2 (separated by 2 mm) are represented as quarter sections embedded within the wicking medium. The interface between them is indicated by the black line in Figure 8. Since the permeability of the wicking agent is lower than that of the green parts (i.e., its finer pores generate higher capillary suction), the liquid binder is radially extracted from the coarser pores of the green parts into the finer pores of the wicking agent under capillary pressure. Simultaneously, argon gas flows in to displace the binder and escapes through the wicking pore network. In this top view representation of the debinding model, the binder extraction occurs along the x-y 2D plane (consistent with the experimental setup shown in Figure 3a–d and described by Darcy’s law), where the binder velocity is proportional to the capillary pressure gradient and the permeability of the part, and inversely proportional to the binder viscosity.
Following the approach of Somasundram et al. [32], the Level Set method, combined with Darcy’s law, was initially used in the COMSOL Multiphysics commercial package to simulate the debinding process of two LPIM metallic parts. Figure 8a–d presents the numerical results after 0.3, 2, 8, and 40 h of debinding. When this model, originally developed for ceramic LPIM parts, was directly applied to LPIM metallic parts, unexpected outcomes emerged. The simulations revealed the presence of isolated binder clusters trapped within the part, particularly after 8 h and 40 h of debinding. After 40 h, the simulation predicted that these large clusters accounted for approximately 37% of the remaining binder, as reported in Figure 8d. This outcome is inconsistent with the experimental observations, which confirmed a more uniform and continuous binder extraction throughout the stainless steel powder network.
Therefore, the current work proposes using a Multiphase Flow in Porous Media method to better describe thermal wick-debinding occurring in LPIM parts. This method, available in the COMSOL Multiphysics commercial package, combines the Darcy’s law interface with the Phase Transport in Porous Media interface. The latter was used to model the transport of the binder and the debinding atmosphere (i.e., two immiscible phases) within a porous medium, while the former models the capillary-driven fluid flow through the same porous network. Unlike the Level Set method, the Multiphase Flow in Porous Media approach is grounded in the physical mechanisms governing flow in porous structures. As such, it can describe the migration of the binder across both computational domains, namely, from the green part to the wicking medium, with greater fidelity.
As expected, the Multiphase Flow in Porous Media method proposed in this work yields numerical results exhibiting a continuous binder extraction throughout the green part and a uniform binder distribution within the wicking medium (unlike the isolated binder clusters observed with the Level Set method in Figure 8a–d). During the initial minutes of debinding (Figure 8e), the mass transport process begins, although most of the binder remains mostly retained in the part, with only trace amounts entering the wicking agent. After 1 h (Figure 8f), the binder continues to migrate outward from the part, forming a well-defined radial front along the part-wicking interface. After 2 h (Figure 8g), the binder fronts from neighboring parts have advanced further and begin to interact. At this stage, the binder fronts from closely spaced parts start to merge, reducing the effective wicking surface area between the parts, slowing the lateral binder extraction and initiating a shift toward dominant vertical migration of the binder. By 10 h (Figure 8h), the debinding is already completed with no further evolution. The binder flow is predominantly upward through approximately 3 mm of the wicking medium due to the reduction in efficiency of lateral extraction following the collision of the binder fronts. These numerical results provide valuable insight into the binder removal dynamic, particularly in predicting the transition from lateral to vertical binder migration. Ultimately, this understanding can be used to evaluate and optimize debinding efficiency for different part layouts.
Numerically, the saturation within the green part during the debinding treatment was averaged over the entire domain by a scalar quantity. As defined by Equation (1), this parameter serves as a global indicator of the residual volume fraction of binder remaining in the part, ranging from 0 (completely debound) to 1 (fully saturated). Given that the simulation was performed in 2D, the mean saturation was computed using the post-processing tools available in COMSOL Multiphysics by performing a domain integral over the part area and normalizing it by the total surface area. This calculation effectively yields the remaining binder volume fraction per unit thickness. The simulated saturation values obtained for various debinding temperatures and times were subsequently validated against experimentally measured saturation values.
Experimentally, the binder saturation was quantified using two complementary techniques, namely, debound mass and thermogravimetric analysis (TGA). In practice, both approaches are expected to produce similar results. Since saturation cannot be measured experimentally, the initial ( V b , i ) and remaining ( V b , r ) volumes of binder were derived using the well-established Equations (22) and (23):
V b , i = m b , i ρ b
And
V b , r = m b , r ρ b
where m b , i , m b , r , and ρ b are the mass of binder initially present in the part before debinding, the mass of binder remaining after debinding, and the binder density, respectively. By substituting these expressions into Equation (1), the binder saturation can be reformulated in terms of mass as:
S d e b o u n d   m a s = V b i n d e r V p o r e s = V b , r V b , i = m b , r ρ b · ρ b m b , i = m b , r m b , i = m b , i m b , d e b o u n d m b , i
The initial binder mass can be calculated using the relation m b , i = m p a r t , i · w t . % b , where m p a r t , i is the initial mass of the green part and w t . % b is the weight fraction of binder, obtained either by TGA or calculated from the solid loading. The mass of binder removed during debinding is given by m b , d e b o u n d = m p a r t , i m p a r t , d e b o u n d , where m p a r t , d e b o u n d is the mass of the part after the debinding step. Following the debinding operation, the remaining binder weight fraction (i.e., the weight loss during debinding) was also quantified using thermogravimetric analysis on one green part and four debound parts. Each sample was heated from 20 to 450 °C over 38 min (~11 °C/min), followed by a 60-min isothermal hold at 450 °C. The resulting thermograms, presented in Figure 9, allow the estimation of the binder content at the end of each thermogram (i.e., after 98 min) based on a previous study using a similar binder formulation [42]. For instance, the green part retained approximately 100 − 92.7 = 7.3 wt. %, while debound samples exhibited lower residual binder, reflecting mass loss from the thermal wick-debinding process. The thermograms can be divided into four segments, numbered 1 to 4 in Figure 9. The first segment corresponds to an initial plateau where no binder degradation occurs. The second segment marks the degradation of low melting point constituents. The third segment corresponds to degradation of EVA, and the fourth segment shows a final plateau where binder degradation ceases and no significant further weight loss is measured. Using the thermograms presented in Figure 9, the binder saturation assessed by TGA can be calculated as follows:
S T G A = w t . % b , r e m a i n i n g w t . % b , r e m a i n i n g + w t . % b , r
where w t . % b , r e m a i n i n g and w t . % b , r are the weight fractions of binder remaining and removed during debinding, respectively, and are graphically represented in Figure 9. In the case of the green part, which contains all of its initial 40 vol. % of binder (i.e., no mass loss due to the debinding operation), the final weight corresponds to the weight fraction of powder ( w t .   % p o w d e r ), which was also used to validate the initial solid loading using Equation (26):
v o l .   % p o w d e r = 1 + ρ p o w d e r ρ b i n d e r 1 w t .   % p o w d e r 1 1
where v o l .   % p o w d e r is the volume fraction of powder (also called the solid loading), ρ p o w d e r is the density of the stainless steel powder available in Table 1, and ρ b i n d e r is the binder density calculated with a rule of mixtures based on the data reported in Table 1, later validated by gas pycnometry and reported in Table 2. The calculated solid loading of approximately 59.96 vol. % was in excellent agreement with the nominal solid loading of 60.0 vol. % used in this work.

3.2. Validation of the Model

3.2.1. Comparison of the Binder Saturation

Figure 10a presents the evolution of binder saturation as a function of the debinding temperature for a total debinding time of 2 h, in isolated conditions (i.e., using a part-to-part gap of approximately 10 mm). The error bars reflect the standard deviation calculated from three different samples (mass and TGA measurements). As expected, both experimental and simulated results exhibit a similar behavior: an increase in debinding temperature leads to a more efficient binder removal process, reflected by a lower final saturation. Simulations were performed for debinding temperatures varying from 50 to 250 °C. At temperatures below 65 °C, the saturation stabilizes at values approaching unity, although never reaches it. This is probably due to the low mobility of paraffin wax, which possess multiple melting points, thereby inducing only limited capillary flow. Since it is impossible to simulate a debinding condition in which 100% of the binder remains within the part while still being in a liquid state, the curve obtained numerically was interpolated and plotted as a dotted line. This allows for the inclusion of a reference point at S = 1 , corresponding to the hypothetical saturation condition where the binder has reached its molten state but no mass loss has occurred, as measured experimentally by TGA. Interestingly, the numerical approach slightly overestimates the saturation values in comparison to those obtained by mass loss measurements of debound parts. This discrepancy, ranging from 6 to 10 vol. %, is likely attributable to limitations of the experimental approach itself. In particular, the debinding process involves the handling of fragile and weakly bonded parts, and post-debinding cleaning steps, such as brushing, can result in the detachment of metal powder particles. This mechanical loss contributes to a lower measured mass and, consequently, an underestimation of remaining binder content. Despite this minor offset, the Multiphase Flow in Porous Media method used in this work appears to accurately capture the physics of the debinding problem. The simulated saturation profile aligns well with the experimental trend by taking the debound masses.
Although generally considered more accurate than the debound mass approach, TGA measurements exhibited significantly greater deviations from both the numerical predictions and the mass-based saturation values. Notably, this discrepancy increases with the debinding temperature, probably due to the intrinsic nature of the test. In fact, the small sample size required for TGA tests (typically on the millimetric scale, and approximately 1000 times smaller than the debound parts) was systematically extracted from the peripheral zone of the cylindrical specimens. The peripheral zone is known to contain less binder than the inner core of the part (see Figure 8g), particularly at later stages of debinding. As a result, TGA-based measurements do not provide a reliable representation of the average binder saturation across the entire part, as estimated either numerically or via mass loss. In cases of incomplete debinding, this outer region may still retain some binder, leading to moderate discrepancies between TGA and debound mass measurements (18 to 27 vol. % difference from saturation obtained by debound mass). However, when debinding is more efficient, the peripheral zone becomes significantly depleted of binder, resulting in differences of up to 46 vol.% compared with the previous experimental approach.
Figure 10b presents the evolution of binder saturation over time during a debinding performed at a constant temperature of 100 °C with a gap of 2 mm (i.e., a condition known to enable efficient debinding). The Multiphase Flow in Porous Media method used in this work seems to adequately capture the physics of the debinding problem in the temporal domain, as the numerically simulated saturation values exhibit trends consistent with the experimental measurements. In line with the observations reported in Figure 10a, the apparent overestimation observed in the numerical results relative to experimental data is likely attributable to the inherent limitations of the experimental approach, particularly the mandatory brushing operation performed after debinding. This step may lead to the detachment of metal powders, which is not accounted for in the measured debound mass, thereby artificially lowering the calculated saturation. From the authors’ perspective, the difference in binder saturation between the simulations and experiments remains reasonably small, ranging from 3 and 10 vol. %, for debinding durations of 1, 2, 5, and 10 h. In the next phase of this project, the debinding stage (e.g., 100 °C for 10 to 14 h) will be followed by a pre-sintering operation, in which the samples remain embedded in the wicking agent, but are subsequently heated up to 900 °C. This treatment aims to promote surface bonding specifically, making the samples cleanable without causing metallic powder detachment. These future efforts are intended to validate the assumption that weak bonding immediately after debinding contributes to metal powder loss, which in turn leads to an underestimation of the experimentally measured residual mass.

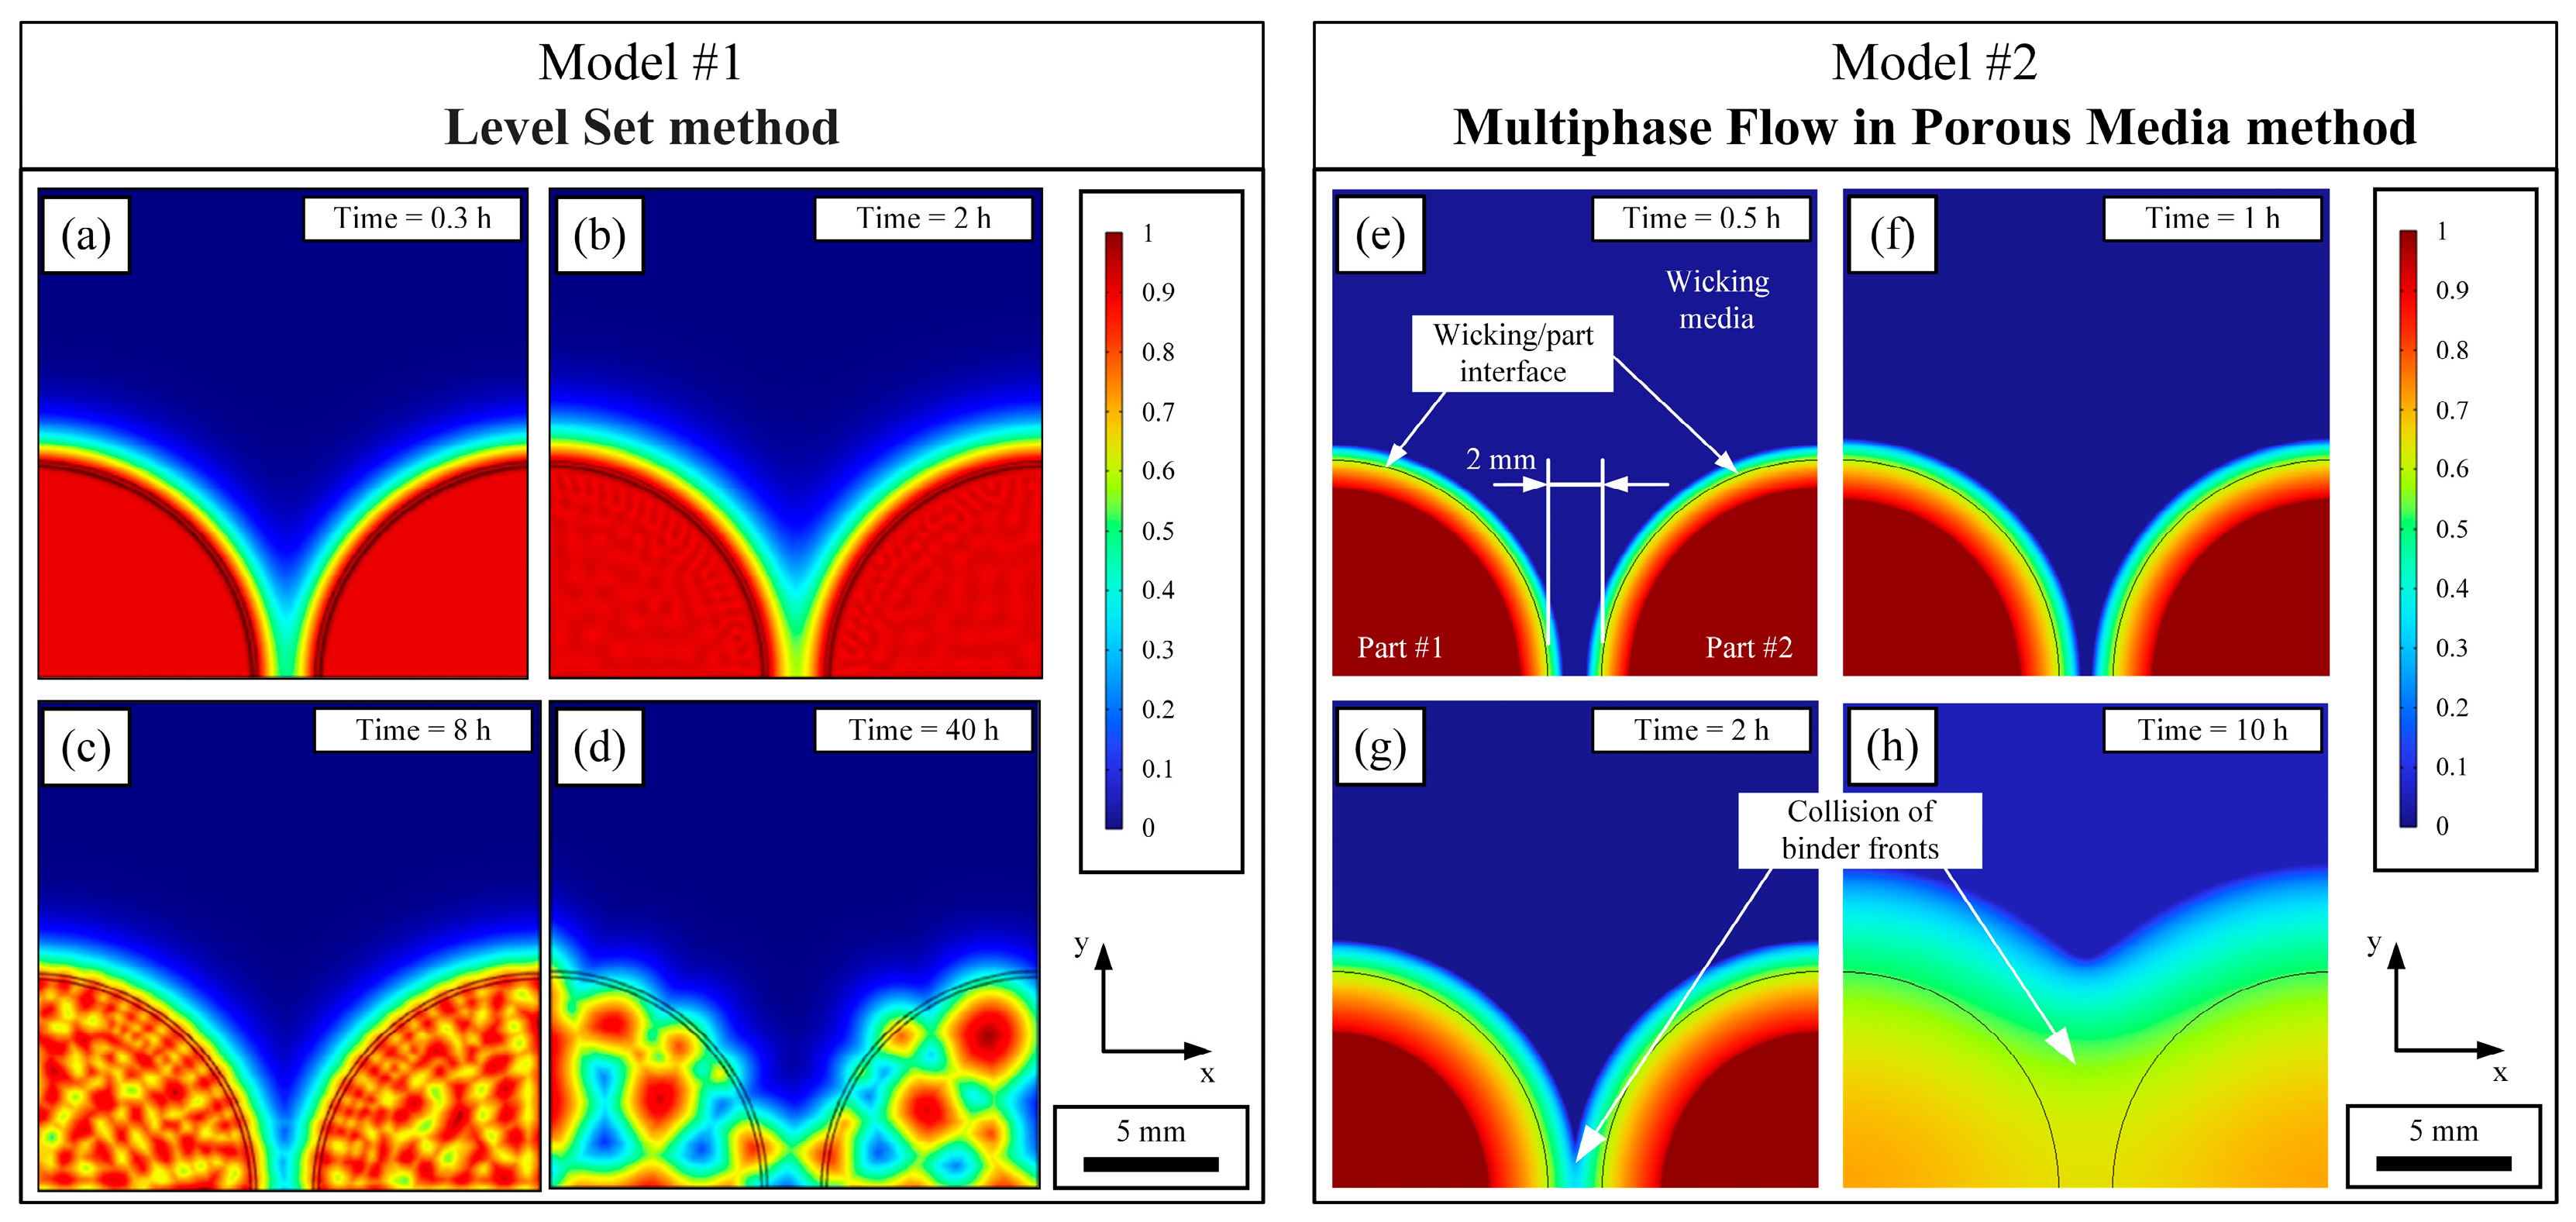
3.2.2. Visualization of the Binder Distribution

The injected part and the parts debound for 2 h at various temperatures were observed using a scanning electron microscope (SEM), with representative micrographs presented in Figure 11. For a given part, no significant difference can be seen for the SEM micrographs taken at the center and at the edge. The SEM observations of the as-injected part reveal a uniform distribution of the binder throughout the powder network (Figure 11a,b). The absence of binder-rich or binder-poor regions confirms an adequate feedstock preparation protocol and suggests that capillary-driven binder migration during thermal wick-debinding is expected to occur uniformly across the part. In contrast, the SEM observations of the part debound at 75 °C reveal significant residual binder, as indicated by arrows in Figure 11c,d. With only about a third of the binder removed under this condition (see Figure 9), this temperature appears to be too close to the binder’s melting point of approximately 59 °C (measured in [42]) to significantly promote mass transport mechanisms. The interconnection and continuity in the binder arrangement indicates insufficient capillary action for effective extraction out of the part. However, at a debinding temperature of 90 °C, the binder appears more isolated, forming discrete clusters with traces covering metallic powders (highlighted by arrows in Figure 11e,f). This indicates that a moderate increase of 15 °C relative to the previous condition reduces the binder viscosity sufficiently for capillary forces to become effective in extracting the binder from the part. Following debinding at 100 °C and 250 °C (i.e., both below the temperature at which polymer degradation begins), the SEM micrographs presented in (Figure 11g–j) reveal a binder-free powder network with no significant traces of residual binder. This observation is consistent with the low residual binder content measured experimentally under these debinding conditions (see Figure 9).

3.3. Study of the Influence of Process Parameters

The validation tests presented above confirm that the Multiphase Flow in Porous Media method proposed in this work is sufficiently robust to accurately predict binder extraction kinetics for simple geometries. This model thus represents a valuable predictive tool prior to launching real-scale productions. One critical parameter during debinding is the gap distance between parts. A large gap reduces packing density and hence production efficiency, whereas a small gap may significantly slow down or even hinder binder extraction due to diminished capillary flow and a reduced effective surface area for binder removal. To investigate this, the influence of gap size was studied by varying the inter-part distance from 1 to 5 mm and simulating the resulting binder distributions over debinding times ranging from 0.5 to 10 h using COMSOL Multiphysics. The simulation results are presented in Figure 12. During the first 30 min of debinding (Figure 12a–d), each part debinds independently, and the gap size has minimal influence on binder migration. However, after 1 h, the narrowest gap (1 mm) leads to the interstitial wicking zone becoming saturated with binder (Figure 12e), while larger gaps still exhibit binder-free regions in this zone (Figure 12f–h). After 2 h of debinding, binder saturation increases further in the interstitial zone. For the 2 mm gap, the binder fronts from adjacent parts start merging without disrupting extraction efficiency, while the 3 mm and 5 mm gaps retain fully functional interstitial wicking regions (Figure 12f–h). After an extended debinding time of 10 h, binder saturation becomes visible in the interstitial zone for all gap sizes. As the gap size increases, the hue of the interstitial zone changes from orange to green, indicating that saturation reaches levels of 50 to 70 vol. % (Figure 12m–p), potentially reducing the local capillary pressure gradient and thus slowing or hindering further binder extraction in that zone.
Another key parameter influencing debinding productivity is the shape of the parts, as the overall footprint of the injected part determines the loading capacity of each debinding tray. The influence of the part geometry on binder distribution was studied using three different shapes (disk, dodecagon, and square), as shown in Figure 13, for various debinding times using COMSOL Multiphysics. During the first hour of debinding, each geometry behaves independently when the gap distance is fixed at 2 mm (Figure 13a–f). After 2 h, however, geometrical effects become apparent. The cylindrical part exhibits an early interaction of binder fronts (Figure 13g), while dry wicking medium remains in the inter-part space within the interstitial zone for the dodecagonal prism (Figure 13h) and rectangular part (Figure 13i). This interesting result highlights that binder distribution within the wicking medium is strongly affected by the path taken by the binder during the debinding operation (schematized by back arrows in Figure 13g–i). In the case of cylindrical parts, the radial capillary flow directs the binder perpendicularly to the walls, leading to early saturation of the interstitial wicking zone. In contrast, parts with flat or angled walls tend to preserve a more efficient wicking region for a longer duration. After 10 h of debinding, the difference in binder saturation within the interstitial zone becomes negligible for the cylindrical and dodecagonal parts (Figure 13j–k). However, in the case of square parts, the parallel walls promote binder accumulation within the central wicking zone), significantly impairing the capillary-driven extraction process. This effect leads to localized over-saturation, where saturation reaches up to 100 vol. % in the middle of the part after 10 h (Figure 13l).
In addition to the color maps presented in Figure 12, the temporal evolution of the mean saturation within the part is plotted in Figure 14a for various gap spacings. This temporal representation confirms that the time required to reach irreducible saturation is strongly influenced by the gap distance between the parts. Specifically, a narrow gap spacing promotes early interaction of binder fronts, which may significantly decrease the capillary suction, thereby reducing the efficiency of the wicking medium, and ultimately slowing down the debinding process. In the present work, a gap of 5 mm yields a Debinding Time Threshold ( D T T 5   m m 7 h) that is comparable to the isolated parts condition (i.e., gap of 10 mm). This indicates that a further increase in the gap beyond 5 mm does not result in additional debinding time optimization, as parts are sufficiently far apart to debind independently, and the wicking agent operates locally at each part interface. However, a reduction of the gap to 3, 2 and 1 mm increased the D T T value to 9, 10, and 15 h, respectively, effectively doubling the debinding time. These results demonstrate the practical utility of the numerical model developed in this work, which can be employed to determine the optimal inter-part spacing to reduce the debinding time while maximizing the use of the alumina bed to increase the debinding productivity.
Similarly, the results obtained in Figure 13 were transposed into mean binder saturation as a function of time and plotted in Figure 14b for different part geometries. Once again, this temporal representation confirms that the overall shape of the parts may significantly affect the time required to reach irreducible saturation. In this work, rectangular parts placed in close proximity induced a strong binder front interaction that reduced the efficiency of the wicking medium. As a result, although the dodecagonal and cylindrical geometries required a similar Debinding Time Threshold (9 < D T T < 10 h), the same volume of powder-binder mixture required nearly twice as long to debind when injected into a rectangular shape ( D T T 18 h). Despite having comparable debinding times, it is interesting to note that a slight geometrical change from a cylindrical to a quasi-cylindrical shape (the dodecagonal part) leads to distinct interactions between the binder fronts (visible in Figure 13g,h), which in turn altered the debinding rate from a mean saturation of approximately 0.65. On one hand, the cylindrical part began with a debinding rate of approximately 0.15 vol. %/h, which gradually decreased to a nearly constant rate of around 0.05 vol. %/h until irreducible saturation was reached at 10 h. On the other hand, the dodecagonal part maintained its initial debinding rate of about 0.15 vol. %/h for a longer duration before undergoing a sharp reduction to 0.025 vol. %/h, reaching irreducible saturation in 9 h. The investigation of this subtle change in debinding rate accounting for the minor variations in D T T could only be revealed through numerical modelling. Therefore, the numerical tool developed in this work can be used to define the appropriate process parameters such as the inter-part spacing, part geometry, or other parameters not investigated in the present project such as feedstock solid loading and proportion of each binder component in the feedstock. By identifying such parameters, the model facilitates the reduction of debinding time while optimizing the space within the alumina bed, and ultimately, enhances the overall productivity of the wick-debinding process.

4. Conclusions

A numerical model was developed to investigate the thermal wick-debinding process commonly employed in low-pressure powder injection molding (LPIM) to maintain part geometry and remove backbone-free binder prior to sintering. Traditionally optimized through time-consuming experimental trials, this process presents challenges due to the complex interactions among binder transport, capillary forces, and thermal effects. The Multiphase Flow in Porous Media model proposed in this work simulates binder removal kinetics by coupling Darcy’s law with a Phase Transport in Porous Media interface in COMSOL Multiphysics. The model was validated using experimental data and subsequently applied to evaluate the effects of debinding parameters such as the temperature, time, gap distance and part geometry on binder removal efficiency. The key findings of this investigation are summarized as follows:
  • The Level Set method, previously used for LPIM of ceramic parts, produces a binder extraction pattern inconsistent with SEM observations.
  • The Multiphase Flow in Porous Media method proposed in this work predicts a continuous binder extraction throughout the green part, in line with experimental evidence.
  • The numerical model accurately captures the trend of decreasing binder saturation with increasing debinding temperature and time, as confirmed experimentally.
  • Discrepancies between experimental and numerical results (ranging from 3 to 10 vol. %) are considered acceptable and are likely due to the mandatory brushing operation when handling the samples.
  • The cylindrical 2-D model for LPIM metallic-based feedstock proposed in this work determined optimal debinding conditions at 100 °C with a gap distance of 5 mm, minimizing debinding time to approximately 7 h.

Author Contributions

M.A.T.: methodology, numerical simulations, validation, writing—original draft, visualization. D.D.: methodology, writing—original draft, visualization. G.M.-S.-O.: methodology, writing—original draft, visualization. V.D.: supervision, conceptualization, project administration, writing—review and editing. All authors have read and agreed to the published version of the manuscript.

Funding

This work was carried out with the financial support of the Mitacs Globalink Graduate Fellowship and Natural Science and Engineering Research Council (NSERC, RDCPJ 531851—18).

Institutional Review Board Statement

Not applicable.

Informed Consent Statement

Not applicable.

Data Availability Statement

The datasets generated during the current study are available from the corresponding author on all requests. Data will be sent directly by email, in order avoid managing and maintain perennial a public repository.

Conflicts of Interest

The authors declare no conflicts of interest.

References

  1. Heaney, D.F. Handbook of Metal Injection Molding, 2nd ed.; Woodhead Publishing: Cambridge, UK, 2019; pp. 1–656. [Google Scholar]
  2. Vervoort, P.J.; Vetter, R.; Duszczyk, J. Overview of powder injection molding. Adv. Perform. Mater. 1996, 3, 121–151. [Google Scholar] [CrossRef]
  3. Randall, M.G.; Bose, A. Injection Molding of Metals and Ceramics, 1st ed.; Metal Powder Industry Federation: Princeton, NJ, USA, 1997; pp. 1–413. [Google Scholar]
  4. Wolff, M.; Schaper, G.J.; Suckert, M.R.; Dahms, M.; Feyerabend, F.; Ebel, T.; Willumeit-Römer, R.; Klassen, T. Metal injection molding (MIM) of Mg-alloys. In Proceedings of the TMS Annual Meeting, Phoenix, AZ, USA, 11–15 March 2018; Volume 6, pp. 1–12. [Google Scholar]
  5. Kupecki, J.; Kluczowski, R.; Papurello, D.; Lanzini, A.; Kawalec, M.; Krauz, M.; Santarelli, M. Characterization of a circular 80 mm anode supported solid oxide fuel cell (AS-SOFC) with anode support produced using high-pressure injection molding (HPIM). Int. J. Hydrogen Energy 2019, 44, 19405–19411. [Google Scholar] [CrossRef]
  6. Peltsman, M.I.; Peltsman, I.D. Low Pressure Hot Molding Machine. U.S. Patent 4416603, 22 November 1983. [Google Scholar]
  7. Mangels, J.A. Low-pressure injection molding. Am. Ceram. Soc. Bul. 1994, 73, 37–41. [Google Scholar]
  8. Medvedovski, E.; Peltsman, M. Low pressure injection molding of advanced ceramic components with complex shapes for mass production. In Proceedings of the 36th International Conference on Advanced Ceramics and Composites, Daytona Beach, FL, USA, 22–27 January 2012; pp. 35–51. [Google Scholar]
  9. Oliveira, R.V.B.; Soldi, V.; Fredel, M.C.; Pires, A.T.N. Ceramic injection moulding: Influence of specimen dimensions and temperature on solvent debinding kinetics. J. Mater. Process. Technol. 2005, 160, 213–220. [Google Scholar] [CrossRef]
  10. Hidalgo, J.; Abajo, C.; Jimenez-Morales, A.; Torralba, J.M. Effect of a binder system on the low-pressure powder injection moulding of water-soluble zircon feedstocks. J. Eur. Ceram. Soc. 2013, 33, 3185–3194. [Google Scholar] [CrossRef]
  11. Aslam, M.; Ahmad, F.; Bm-Yousoff, P.S.M.; Altaf, K.; Omar, M.A.; Raza, M.R. A study on the optimization of solvent debinding process for powder injection molded 316L stainless steel parts. Adv. Mater. Res. 2016, 1133, 324–328. [Google Scholar] [CrossRef]
  12. Bloemacher, M.; Weinand, D. CatamoldTM-a new direction for powder injection molding. J. Mater. Process. Technol. 1997, 63, 918–922. [Google Scholar] [CrossRef]
  13. Krug, S.; Evans, J.; Ter Maat, J.H.H. Transient effects during catalytic binder removal in ceramic injection moulding. J. Eur. Ceram. Soc. 2001, 21, 2275–2283. [Google Scholar] [CrossRef]
  14. Fu, G.; Loh, N.H.; Tor, S.B.; Tay, B.Y.; Murakoshi, Y.; Maeda, R. Injection molding, debinding and sintering of 316L stainless steel microstructures. Appl. Phys. A 2005, 81, 495–500. [Google Scholar] [CrossRef]
  15. Kim, Y.-H.; Kim, Y.-H.; Lee, Y.-W.; Park, J.-K.; Lee, C.-H.; Lim, J.S. Supercritical carbon dioxide debinding in metal injection molding (MIM) process. Korean J. Chem. Eng. 2002, 19, 986–991. [Google Scholar] [CrossRef]
  16. Agne, A.; Barrière, T. Modelling and numerical simulation of Supercritical CO2 debinding of Inconel 718 components elaborated by Metal Injection Molding. Appl. Sci. 2017, 7, 1024. [Google Scholar] [CrossRef]
  17. Dugauguez, O.; Agne, A.; Jimenez-Morales, A.; Torralba, J.M.; Barriere, T. Experimental and numerical analysis of effects of supercritical carbon dioxide debinding on Inconel 718 MIM components. Powder Technol. 2019, 355, 57–66. [Google Scholar] [CrossRef]
  18. Zorzi, J.E.; Perottoni, C.A.; Da Jornada, J. A new partially isostatic method for fast debinding of low-pressure injection molded ceramic parts. Mater. Lett. 2003, 57, 3784–3788. [Google Scholar] [CrossRef]
  19. Tafti, A.A.; Demers, V.; Seyed, M.M.; Vachon, G.; Brailovski, V. Effect of thermal debinding conditions on the sintered density of low-pressure powder injection molded Iron parts. Metals 2021, 11, 264. [Google Scholar] [CrossRef]
  20. German, R.M. Theory of thermal debinding. Int. J. Powder Metall. 1987, 23, 237–245. [Google Scholar]
  21. Patterson, B.; Aria, C. Debinding injection molded materials by melt wicking. JOM 1989, 41, 22–25. [Google Scholar] [CrossRef]
  22. Vetter, R.; Sanders, M.J.; Majewska-Glabus, I.; Zhuang, L.; Duszczyk, J. Wick-debinding in powder injection molding. Int. J. Powder Metall. 1994, 30, 115–124. [Google Scholar]
  23. Vetter, R.; van den Brand Horninge, W.R.; Vervoort, P.J.; Majewska-Glabus, I.; Zhuang, Z.; Duszczyk, J. Square root wick debinding model for powder injection moulding. Powder Metall. 1994, 37, 265–271. [Google Scholar] [CrossRef]
  24. Chen, C.-C.; Hourng, L.-W. Basic permeability concepts related to wick debinding in metal injection moulding. Powder Metall. 2001, 44, 117–122. [Google Scholar] [CrossRef]
  25. Chen, C.-C.; Hourng, L.-W.; Liou, L.-M. Optimum analysis of wick debinding in MIM–laboratory experiment. Powder Metall. 2001, 44, 123–127. [Google Scholar] [CrossRef]
  26. Gorjan, L.; Dakskobler, A. Partial wick-debinding of low-pressure powder injection-moulded ceramic parts. J. Eur. Ceram. Soc. 2010, 30, 3013–3021. [Google Scholar] [CrossRef]
  27. Gorjan, L.; Dakskobler, A.; Kosmač, T. Strength evolution of injection-molded ceramic parts during wick-debinding. J. Am. Ceram. Soc. 2012, 95, 188–193. [Google Scholar] [CrossRef]
  28. Shih, M.-S.; Hourng, L.-W. Numerical simulation of capillary-induced flow in a powder-embedded porous matrix. Adv. Powder Technol. 2001, 12, 457–480. [Google Scholar] [CrossRef]
  29. Lin, T.-L.; Hourng, L.-W. Investigation of wick debinding in metal injection molding: Numerical simulations by the random walk approach and experiments. Adv. Powder Technol. 2005, 16, 495–515. [Google Scholar] [CrossRef]
  30. Somasundram, I.M.; Cendrowicz, A.; Wilson, D.I.; Johns, M.L. Phenomenological study and modelling of wick debinding. Chem. Eng. Sci. 2008, 63, 3802–3809. [Google Scholar] [CrossRef]
  31. Somasundram, I.M.; Johns, M.L.; Wilson, D.I. An Improved Model for Simulation of Wick Debinding of Moulded Parts. In Proceedings of the 17th Plansee Seminar, Reutte, Austria, 25–29 May 2009; Volume 3, pp. 1–10. [Google Scholar]
  32. Somasundram, I.M.; Cendrowicz, A.; Johns, M.L.; Prajapati, B.; Wilson, D.I. 2-D simulation of wick debinding for ceramic parts in close proximity. Chem. Eng. Sci. 2010, 65, 5990–6000. [Google Scholar] [CrossRef]
  33. B923–16; Standard Test Method for Metal Powder Skeletal Density by Helium or Nitrogen Pycnometry. ASTM International: West Conshohocken, PA, USA, 2016.
  34. Monzón, M.D.; Ortega, Z.; Martínez, A.; Ortega, F. Standardization in additive manufacturing: Activities carried out by international organizations and projects. Int. J. Adv. Manuf. Technol. 2015, 76, 1111–1121. [Google Scholar] [CrossRef]
  35. Gonçalves, A.C. Metallic powder injection molding using low pressure. J. Mater. Process. Technol. 2001, 118, 193–198. [Google Scholar] [CrossRef]
  36. Wen, G.; Cao, P.; Gabbitas, B.; Zhang, D.; Edmonds, N. Development and Design of Binder Systems for Titanium Metal Injection Molding: An Overview. Metall. Mater. Trans. A 2013, 44, 1530–1547. [Google Scholar] [CrossRef]
  37. Lin, D.; Sanetrnik, D.; Cho, H.; Chung, S.T.; Kwon, Y.S.; Kate, K.H.; Hausnerova, B.; Atre, S.V.; Park, S.J. Rheological and thermal debinding properties of blended elemental Ti-6Al-4V powder injection molding feedstock. Powder Technol. 2017, 311, 357–363. [Google Scholar] [CrossRef]
  38. Rei, M.; Milke, E.; Gomes, R.; Schaeffer, L.; Souza, J. Low-pressure injection molding processing of a 316-L stainless steel feedstock. Mater. Lett. 2002, 52, 360–365. [Google Scholar] [CrossRef]
  39. Hu, F.; Liu, W.; Xie, Z. Surface modification of alumina powder particles through stearic acid for the fabrication of translucent alumina ceramics by injection molding. Ceram. Int. 2016, 42, 16274–16280. [Google Scholar] [CrossRef]
  40. Standring, T.; Blackburn, S.; Wilson, P. Investigation into Paraffin Wax and Ethylene Vinyl Acetate Blends for Use as a Carrier Vehicle in Ceramic Injection Molding. Polym.-Plast. Technol. Eng. 2016, 55, 817–820. [Google Scholar] [CrossRef]
  41. Arès, F.; Delbergue, D.; Demers, V. Injection Flow Rate Threshold Preventing Atypical In-Cavity Pressure during Low-Pressure Powder Injection Molding. Powders 2023, 2, 709–726. [Google Scholar] [CrossRef]
  42. Majdi, S.M.; Tafti, A.A.; Demers, V.; Vachon, G.; Brailovski, V. Effect of powder particle shape and size distributions on the properties of low-viscosity iron-based feedstocks used in low-pressure powder injection moulding. Powder Metall. 2021, 65, 170–180. [Google Scholar] [CrossRef]
  43. Brooks, R.H.; Corey, A.T. Hydraulic properties of porous. Media Hydrol. Pap. 1964, 3, 1–27. [Google Scholar]
  44. Bear, J. Dynamics of Fluids in Porous Media, Rev ed.; Dover Publications: Garden City, NY, USA, 2013; pp. 1–800. [Google Scholar]
  45. Van Genuchten, M.T. A closed-form equation for predicting the hydraulic conductivity of unsaturated soils. Soil Sci. Soc. Am. J. 1980, 44, 892–898. [Google Scholar] [CrossRef]
  46. Mualem, Y. A new model for predicting the hydraulic conductivity of unsaturated porous media. Water Resour. Res. 1976, 12, 513–522. [Google Scholar] [CrossRef]
  47. Dullien, F.A.L. Porous Media: Fluid Transport and Pore Structure, 2nd ed.; Academic Press: Cambridge, MA, USA, 2012; pp. 1–598. [Google Scholar]
  48. Argon—Density and Specific Weight. Available online: https://www.engineeringtoolbox.com/argon-density-specific-weight-temperature-pressure-d_2089.html (accessed on 7 May 2025).
  49. Gases—Dynamic Viscosities. Available online: https://www.engineeringtoolbox.com/gases-absolute-dynamic-viscosity-d_1888.html (accessed on 7 May 2025).
Figure 1. Scanning electron microscope observations and particle size distribution of the (a,b) stainless steel powder, and (c,d) alumina powder.
Powders 04 00022 g001
Figure 2. Injection setup showing (a) the molding press, and (b) an exploded view of the mold cavity used to produce cylindrical green parts.
Powders 04 00022 g002
Figure 3. Illustration of the debinding setup with two green parts sandwiched between quartz plates (a,b) before debinding and (c,d) during debinding from the top and side views, (e) green parts deposited on quartz in an alumina bed and a metallic container, (f) parts buried in alumina, and (g) schematic representation of the debinding cycles.
Powders 04 00022 g003
Figure 4. Assessment of the pore size distribution index in the part computational domain.
Powders 04 00022 g004
Figure 5. Viscosity profile of the binder obtained at different temperatures.
Powders 04 00022 g005
Figure 6. Steps required to assess the permeability and capillary pressure in the computational domains: (a,b) SEM observations of the stainless steel and alumina powders, (c,d) filtering and contouring using Fiji, (e,f) meshing of the porosity zones and definition of the domains.
Powders 04 00022 g006
Figure 7. Calculation of the minimum capillary pressure for the part and the wicking domains.
Powders 04 00022 g007
Figure 8. Evolution of binder saturation in the parts and surrounding wicking medium during debinding at 100 °C, simulated using (ad) the Level Set method, and (eh) Multiphase Flow in Porous Media method.
Powders 04 00022 g008
Figure 9. Thermograms obtained using an isothermal profile at 450 °C.
Powders 04 00022 g009
Figure 10. Comparison between experimental and simulated saturation as a function of (a) debinding temperature after 2 h of treatment, and (b) debinding time at a constant temperature of 100 °C.
Powders 04 00022 g010
Figure 11. SEM micrographs of the (a,b) injected, and (cj) debound parts taken at the center and edge.
Powders 04 00022 g011
Figure 12. Influence of the gap size on the spatial distribution of the binder over debinding time: (a) 0.5h-1mm; (b) 0.5h-2mm; (c) 0.5h-3mm; (d) 0.5h-5mm; (e) 1h-1mm; (f) 1h-2mm; (g) 1h-3mm; (h) 1h-5mm; (i) 2h-1mm; (j) 2h-2mm; (k) 2h-3mm; (l) 2h-5mm; (m) 10h-1mm; (n) 10h-2mm; (o) 10h-3mm; (p) 10h-5mm.
Powders 04 00022 g012
Figure 13. Influence of the part geometry on the spatial distribution of the binder over debinding time: (a) 0.5h-shape #1; (b) 0.5h-shape #2; (c) 0.5h-shape #3; (d) 1h-shape #1; (e) 1h-shape #2; (f) 1h-shape #2; (g) 2h-shape #1; (h) 2h-shape #2; (i) 2h-shape #3; (j) 10h-shape #1; (k) 10h-shape #2; (l) 10h-shape #3.
Powders 04 00022 g013
Figure 14. Influence of the (a) gap distance, and (b) part geometry on the mean saturation.
Powders 04 00022 g014
Table 1. Properties and proportion of feedstock constituents.
Stainless
Steel
Powder
Paraffin
Wax
Carnauba
Wax
Stearic
Acid
Ethylene
Vinyl
Acetate
Density (g/cm3)7.80.91.01.00.9
Melting point (°C)>140455846286
Volume fraction for
feedstock (vol. %)
6030721
Table 2. Properties of the fluids and computational domains.
DescriptionValueTechnique
Density of binder (kg/m3) ρ b i n d e r = 920Experiment using a pycnometer
Dynamics viscosity of binder (Pa·s) μ b i n d e r = 0.011Experiment using a rotational rheometer
Density of Argon (kg/m3) ρ a r g o n = 1.623Data from literature [48,49]
Dynamics viscosity of argon (Pa·s) μ a r g o n = 0.025Data from literature [48,49]
Porosity of green part (m3/m3) ε p a r t = 0.40Directly calculated from the feedstock solid loading
Permeability of green part (m2) K p a r t = 1.2 × 10 − 10Simulation (see Figure 6a)
Porosity of wicking agent (m3/m3) ε w i c k i n g = 0.25Simulation using Equation (18)
Permeability of wicking agent (m2) K w i c k i n g = 2.9 × 10 − 17Simulation (see Figure 6b)
Pore size distribution index in part 1.4   <   λ p a r t < 2.6 Assessed in Figure 4
Pore size distribution index in wicking medium λ w i c k i n g = 0.74Value from [32]
Minimum capillary pressure for part domain (Pa) P d , p a r t = 3.95 × 10⁴By simulation (see Figure 7)
Minimum capillary pressure for wicking domain (Pa) P d , w i c k i n g = 2.28 × 10⁵By simulation (see Figure 7)
Disclaimer/Publisher’s Note: The statements, opinions and data contained in all publications are solely those of the individual author(s) and contributor(s) and not of MDPI and/or the editor(s). MDPI and/or the editor(s) disclaim responsibility for any injury to people or property resulting from any ideas, methods, instructions or products referred to in the content.

