Article

Toward Multi-Dimensional Separation of Nanoparticles in Tubular Centrifuges

Institute of Mechanical Process Engineering and Mechanics, Karlsruhe Institute of Technology (KIT), Strasse am Forum 8, 76131 Karlsruhe, Germany
*
Author to whom correspondence should be addressed.
Submission received: 11 December 2023 / Revised: 20 December 2024 / Accepted: 15 January 2025 / Published: 27 January 2025

Abstract

:
The processing and preparation of particulate products is an important process in modern industry and science. The enormous potential for innovation in research and development is due to the complex interactions of solids with their environment. The aim of advanced particle production is to achieve high yields of narrowly distributed particle sizes, shapes or material compositions that provide advantageous product specifications. The integration of solid–liquid separation into these processes expands the process engineering scope in terms of product quality and efficiency. Designing these processes to accommodate a wide range of separation characteristics at small-particle-size scales is a major challenge. Taking these aspects into account, the present work aims to improve a dynamic simulation tool for tubular centrifuges that models the time- and space-dependent mass transport and thus, for the first time, can predict separation outcomes when processing both single- and multi-component systems. Utilizing an optical measurement technique, nanosuspension properties can be measured in real time during separation to support model validation. The simulation results align closely with experimental findings and offer plausible insights when addressing multi-dimensional property distributions of non-spherical particles. This study contributes to advanced modeling of separation experiments in tubular centrifuges in real time, taking into account multiple particle properties such as material density and particle form.

1. Introduction

The processing and preparation of particulate products is an important process in modern industry and science. Nanotechnology in particular investigates physico-chemical and biological systems from atomic to sub-micron size [1,2]. Through elaborate syntheses [3,4] and mechanical formulations [5,6] in the liquid phase, it is possible to produce a wide range of nanoparticles (NPs) in a controlled environment. Examples of potential applications range from biomedical diagnostics and disease control [7], to organic semiconductors [8], to the design of new materials [9,10]. The enormous potential for innovation in research and development is due to the manifold interactions of nanoparticles with their environment. In this regard, a large number of studies specifically characterize the relationships between particle properties and the enhancement of desired product properties [11,12,13,14,15,16]. Therefore, manufacturing processes are ideally designed to achieve high yields of desired, narrowly distributed particle properties such as size, morphology, and material composition. Downstream solid–liquid separation processes can be used to further optimize the properties of the particles produced, increasing the flexibility to improve product quality.
However, the current state of separation technology often neglects this multi-dimensional nature of real particle systems. Commonly, the separation process of a particle collective is designed on the basis of a single feature (one-dimensional (1D)), e.g., an equivalent particle diameter, and referred to as classification. Fractionation according to multiple (multi-dimensional (2D, 3D, …)) particle properties, on the other hand, occurs less frequently and considers anisotropies in their geometric, interfacial or compositional features. The main difficulty is the necessary understanding of the complex physical processes that occur during separation. Concurrently, there is an increased demand for advanced quantification methods and quality assurance. Extensions of existing processes to multiple dimensions have not yet been comprehensively described and are therefore the subject of topical research [17,18].
This work deals with the multi-dimensional fractionation of nanosuspensions by applying a centrifugal force. The most common laboratory-scale apparatuses are batch centrifuges, which accelerate containers and small cuvettes with volumes of a few milliliters. Remarkable separation qualities in the nanometer range are achieved by the density gradient centrifugation method, which is extensively documented in the literature [19,20,21]. The findings of these studies confirm that effective fractionation by size, density and shape is feasible for a variety of materials. Drawbacks of such single-batch processes include small yields, low throughput, challenging scalability, and the neglect of cost efficiency in favor of high product quality and purity.
On larger scales and for semi-continuous processing, tubular centrifuges can be used. Their typical design features a slim, cylindrical rotor mounted on at least one side. With this design, high centrifugal accelerations of up to 80,000× g can be achieved with commercially available machines. An incoming feed suspension is separated into a coarse fraction (sediment) and a fine fraction (centrate). A large number of studies document the advantages of the generated centrifugal force in the classification and separation of very fine particles (<1 µm) [22,23,24,25]. For this work, the term density fractionation defines a simultaneous separation by particle size and density. Similarly, form fractionation evaluates the outcome of a separation experiment based on additional geometric factors.
The major disadvantage of the apparatus is the semi-continuous mode of operation, which requires a periodic removal of the formed sediment. During separation, the accumulating solids reduce the cross-sectional area of the liquid, causing the suspension to move at an increased velocity through a steadily decreasing pond volume. The altered conditions directly affect separation efficiency over longer process times, preventing consistent product qualities. In a preliminary work, Konrath et al. [26] present an online measurement technique that monitors the centrate flow during the experiment via a scattered light measurement. A regression model simultaneously translates the optical signals into a solid concentration of the centrate, which in turn is used to evaluate the separation efficiency in real time. The authors show that an adjustment of the rotor speed based on the measurable real-time information leads to a consistent product quality. However, further considerations indicate that the shown detection methods do not meet the requirements of multi-dimensional fractionation. Recorded measurement data must necessarily contain the information of several properties, so that a multivariate evaluation is possible. This work explores the use of data-driven software sensors which are quantitative modules that perform a fast extraction of multiple target variables from easy-to-measure process variables. Due to a variety of applicable regression models, soft sensors are considered versatile. They can be trained using historical process data or offline measurements of defined calibration samples for various applications [27,28]. In this regard, the article by Butler et al. [29] highlights both established machine learning methods and their potential in particle engineering and materials science. One common type of easy-to-measure process data is optical multi-wavelength signals measured, e.g., online during a separation process. In direct comparison to a simple scattered light measurement, UV/vis spectroscopy generates a larger amount of data, on the basis of which a data-driven regression model can be developed. Haiss et al. determine both the diameter and concentration of dispersed gold NPs in this way, demonstrating that multivariate information can be extracted from the measured spectra [30]. Another example of an offline soft sensor is presented by Stone et al. [31]. The authors use a multivariate regression model and a UV/vis spectrum to predict the concentrations of two microorganisms in a mixture. The literature also provides examples of online measurements that can be used to monitor multiple suspension properties over a given process time period. However, the focus is often on the evaluation of particle syntheses on small scales [32,33]. A more recent study presents advances in online monitoring of multi-dimensional fractionation processes by functionalising particles with fluorescent markers [34]. The authors use an inverted microscope and a camera to quantify the effective entrapment and sorting of particles according to their shape, size and surface properties by an insulator-based dielectrophoresis device. Building on this state of development, this work includes a concept for integrating UV/vis spectroscopy into a separation process monitoring system. There are two immediate objectives. The first is to achieve real-time, multi-component, online analysis of the composition of a centrate suspension. The second goal is to use the soft sensor data to validate a novel process model for tubular centrifuges, which is the main focus of this work.
For a deeper understanding of the physical processes within the tubular centrifuge and the efficient acquisition of important process knowledge, mathematical modeling of the separation process is crucial. Following the concept of dynamic flow sheet simulation, which has been extended to particle technology [35,36], research approaches in recent years have produced numerical models that allow real-time evaluation of separation efficiency and sediment build-up in solid bowl centrifuges [37,38]. In this context, physics-based dynamic simulations describe fundamental particle physics during the separation process based on empirical material functions, the geometry of the apparatus, and some simplifying assumptions. Regardless of the type of process and how it is managed, numerical calculations can help optimize the operation and identify the most advantageous process parameters. Furthermore, the exclusion of inappropriate operating conditions supports the design of experiments, reducing the total number of experiments required. Furthermore, unlike high-resolution computational fluid dynamics (CFD) and discrete particle simulations, the dynamic process models provide results in real time and are therefore applicable in the context of model predictive control [39]. Finally, it should be emphasized that the theoretical consideration of fractionation in tubular centrifuges has so far been limited to only one dimension [40]. The multi-dimensional description of established separation processes in particle technology requires the simultaneous consideration of several geometric and material properties [41,42]. In the context of technical applications, these are to be considered as continuous or discrete variables that can be narrowly to broadly distributed. This challenge motivates the search for a generalized definition of multi-dimensional particle trait distributions (PTDs) [43,44,45]. Compared to the classical 1D particle size distribution (PSD), the PTD contains two-dimensional (2D), three-dimensional (3D) or even n-dimensional descriptors, depending on its definition. These concepts are not yet included in the experimental and theoretical consideration of tubular centrifuge fractionation.
Therefore, the aim of this study is to investigate the applicability of a tubular centrifuge as a multi-dimensional separation apparatus both experimentally and by means of process simulation. In addition, an online quantification of the separation efficiency integrated into the fractionation setup supports both the presented experimental studies and the validation of the enhanced process model.

2. Materials and Methods

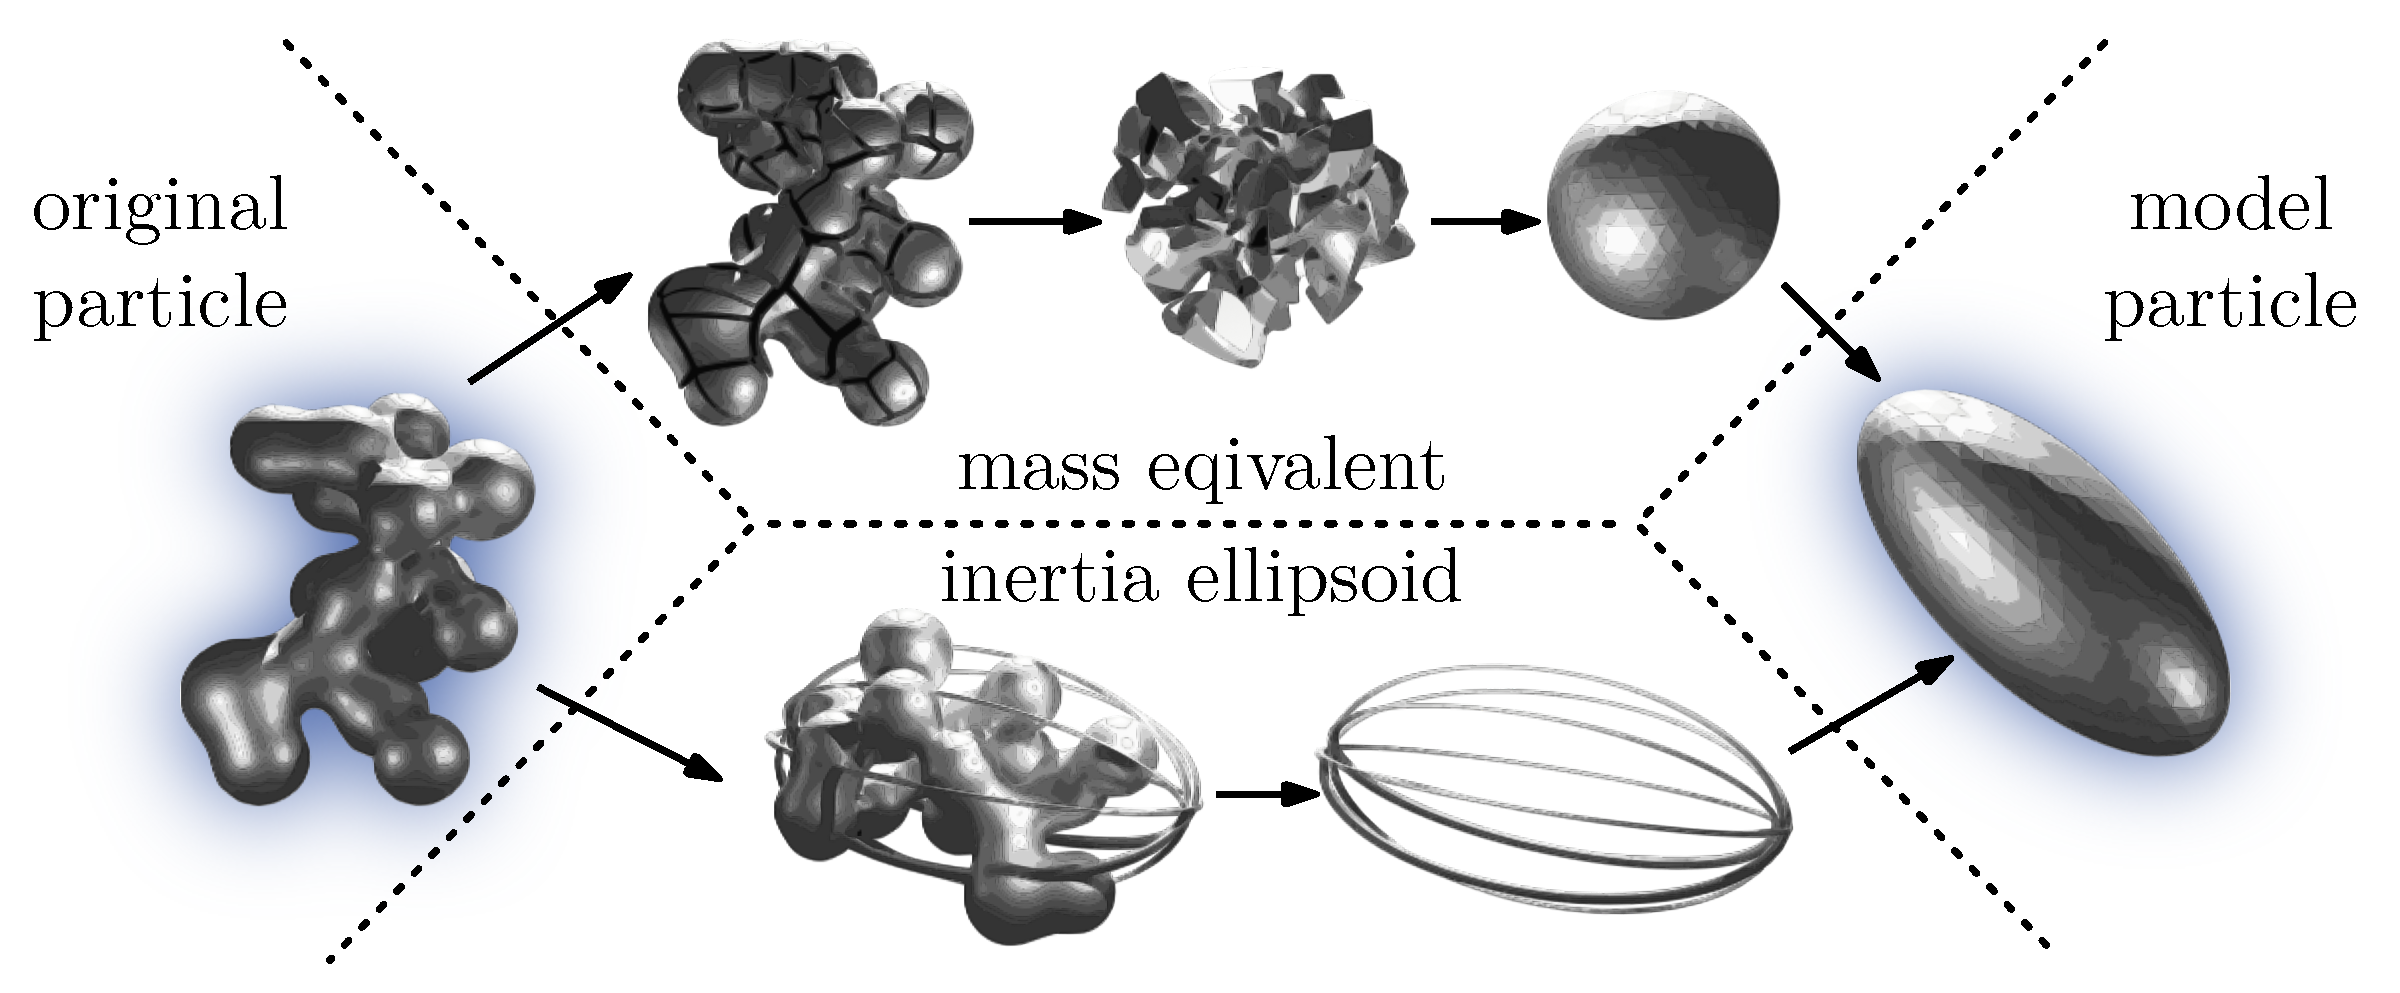
2.1. Mathematical Description of the Sedimentation Coefficient for Ellipsoids

During its movement along the radial coordinate r, a smooth nanoparticle is accelerated due to its mass and decelerated due to its interactions with the surrounding fluid and particles. For uncharged single particles in highly diluted suspensions and excluding any particle–particle interactions, the equilibrium of forces between drag, buoyancy and centrifugal force results in the expression
u 0 : = d d t r = V s r ω 2 Δ ρ c W A 1 2 ρ l
for the change in distance from the axis of rotation over time. This approximation is known as the terminal sedimentation velocity u 0 . Increasing particle volumes V s , a high angular velocity ω and a large density difference between solid and fluid Δ ρ = ( ρ s ρ l ) increase the settling rate. The dynamic pressure on the projection surface A in the direction of the radial coordinate and frictional effects slow down the particle. The hydrodynamic resistance is quantified by the drag coefficient c W . Due to the small size scales of submicrons and nanoparticles, very small Reynolds numbers (Re 1 ) are to be expected. Stokes [46] defines an analytical solution for the terminal settling velocity for this laminar flow regime with the well-known expression
u 0 , St = d 2 Δ ρ r ω 2 18 η l .
Here, Stokes applies Equation (1) and the geometric projection surface A K = π 4 d 2 of a sphere, its volume, the viscosity of the fluid η l and the drag coefficient c W , St = 24 Re 1 . According to Equation (2), u 0 , St depends on only one geometric parameter, the equivalent diameter d = 6 π V s 3 . To extend this one-dimensional definition with more geometric particle traits, numerous approaches can be found in the literature that are based on the principle of correcting the Stokes drag coefficient [47]. A comprehensive study by Trunk et al. presents correlations for the description of c W as a function of several macro- and mesoscopic descriptors of non-spherical particles [48]. For further considerations and an extension of the correlations beyond the Stokes regime, the reader is referred to this publication. This work utilizes the expression
c W , E = c W , St k St ,
presented in [49,50], with k St introduced as the Stokes drag correction parameter. For scalene ellipsoids, analytical solutions for k St were derived by Oberbeck [51]. A comprehensive study on the modeling of c W , E in gaseous and liquid media is described by the authors Bagheri et al. [52]. Their model equation covers a large range of sub-critical Reynolds numbers (Re 3 × 10 5 ). In the Stokes domain, they implement the analytical solutions of Oberbeck and argue that the introduction of easily derivable form factors is advantageous from a technical perspective. In this context, two general shape factors are highlighted: the particle elongation e and the flatness f. These metrics can be easily calculated from the longitudinal dimensions at each major axis. Combining Equations (1) and (3) with the authors’ definition of k St , E for ellipsoids in creeping motion and with random orientation, a multi-dimensional expression for the terminal settling velocity
u 0 , E = d 2 Δ ρ 9 η l f e 1.3 1 / 3 + f e 1.3 1 / 3 sedimentation coefficient s 0 , E r ω 2
can be derived [53]. Going forward, the highlighted sedimentation coefficient (SC)
s 0 , E = u 0 , E r ω 2
in Equation (4) is used as a characteristic parameter to quantify the radial movement of a particle based on all introduced physical and material traits [54]. The explanation of the model particle under consideration is supported by the illustration in Figure 1. The upper path shows the approximation of the particle as a mass equivalent sphere. The bottom path illustrates the construction of the above-mentioned inertia ellipsoid. Originating in mechanics, this convex body shares the same moments of inertia and the same center of mass as the original particle [55]. A combination of the equivalent mass of a volume-equivalent sphere and the form of an inertia ellipsoid results in the chosen model particle morphology.
The definition of the SC used in Equation (5) applies to individual particles in an infinitely diluted suspension. This assumption is not applicable for technical applications and is only relevant in the scope of theoretical investigations. Processes on an industrial scale typically process more concentrated suspensions, which leads to other observable effects. Both the density and viscosity of a suspension increase with the solid volume fraction ϕ . At the same time, the directed particle movement during centrifugation results in an inverse flow of the liquid. If the momentum exchange between the solid and liquid phase increases further, so-called zone sedimentation takes place. During this phenomenon, all particles of a collective sediment at a uniform speed and a sharp phase boundary between the clarified liquid and the suspension emerge. Other influential physico-chemical factors are based on inter-particle interactions, such as those due to surface charges or steric hindrance. For this study, the special case of sedimentation in highly diluted suspensions is examined in more detail. Batchelor [56] derives the first-order dependence
s E = s 0 , E 1 + w ϕ 1 ,
for the concentration-dependent SC of monodisperse particles. Here, the concentration coefficient w is an empirical constant. For highly diluted suspensions, second- or higher-order influences are approximately negligible [54]. Based on the measuring principle of analytical ultracentrifugation, Mächtle et al. [57] describe a method that derives an empirical solution for w from experimental data of the SC and Equation (6). A detailed description of the methodological application to quantify w for each nanosuspension used in this work can be found here [53].

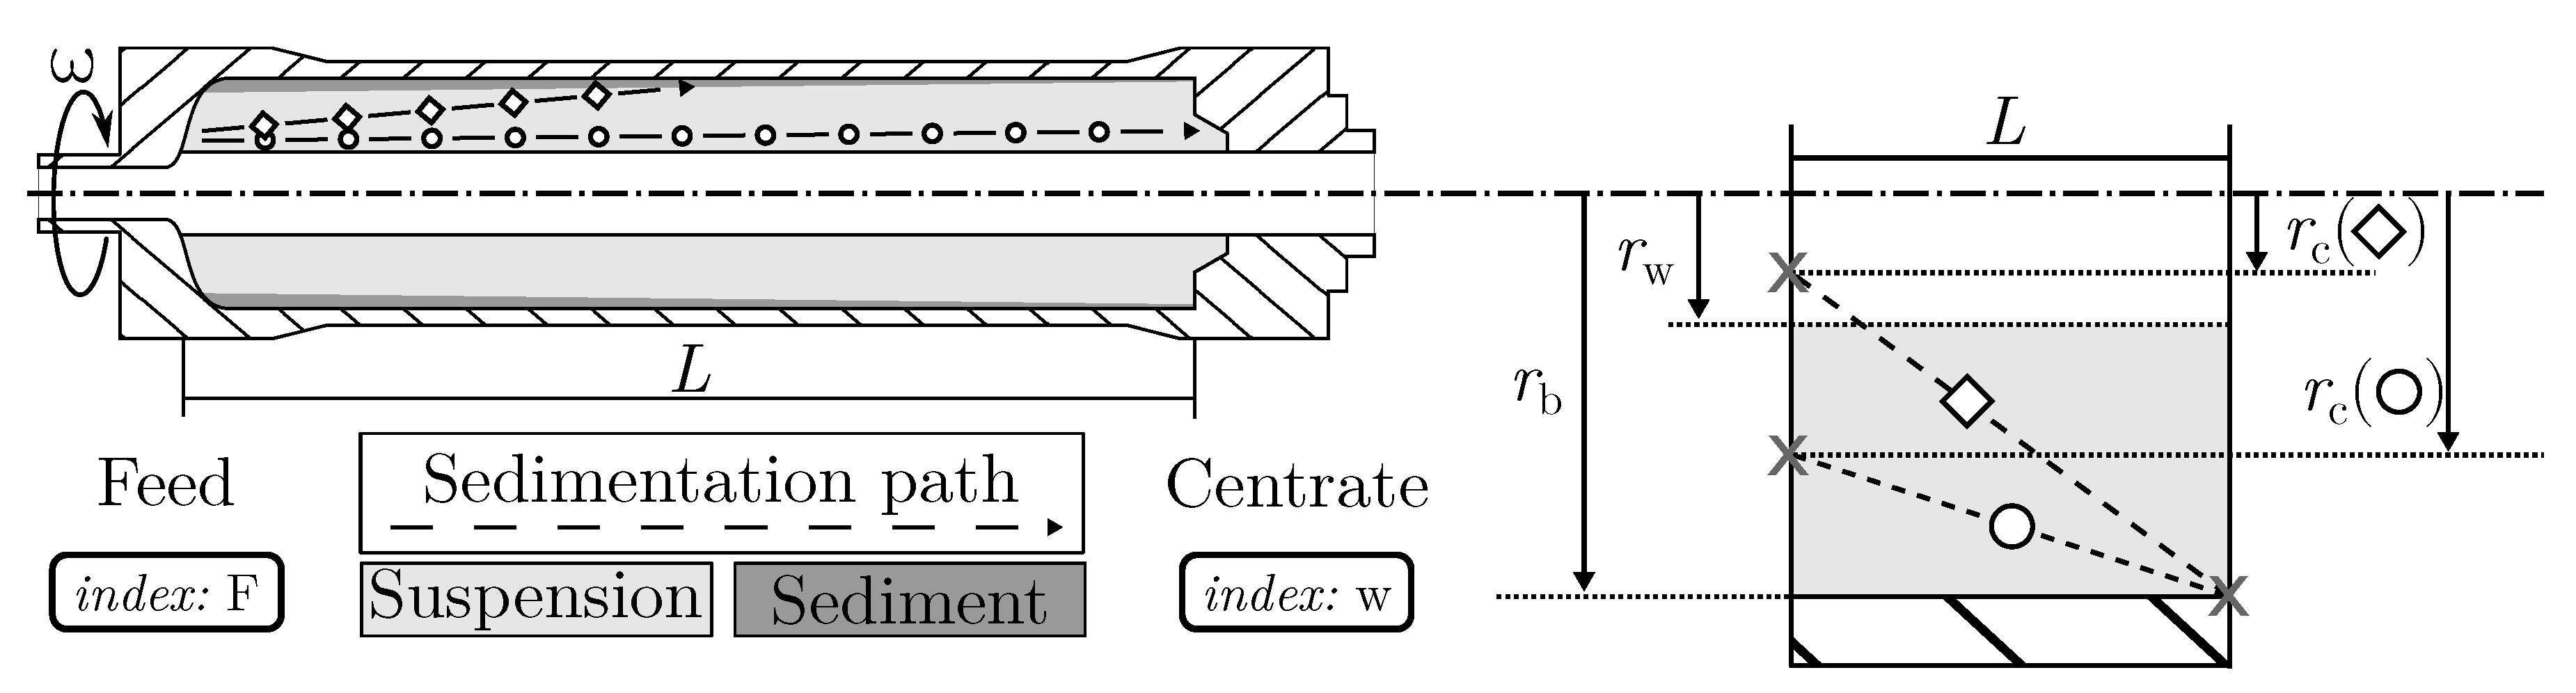
2.2. Tubular Centrifuge Separation Theory

Fractionation of nanoparticles in tubular centrifuges is semi-continuous. A motor drives a cylindrical rotor which generates the centrifugal field. The rotor is filled with suspension, forming a pond with a phase boundary to a central gaseous core. The height of the pond is determined by the weir radius r w at the end of the rotor, which is a direct property of the machine type. Ideally, a rigid body rotation of the liquid pond should be assumed. This means that the angular velocity ω generated by the rotor and that of the liquid ω l are the same. An important operation parameter and characteristic, dimensionless measure is the centrifugal number
C = ω 2 r b g
that expresses the ratio between centrifugal acceleration and gravitational acceleration g. Due to the low height of the liquid pond of only a few centimeters (laboratory scale), it is a valid simplification that C is not a function of the radial coordinate r. With this in mind, calculations based on the rotor radius r b produce the approximated solution seen in Equation (7). The second operating parameter is the volumetric flow rate V ˙ l . As the suspension is fed into the separation zone at a constant rate, separated particles accumulate in the form of a saturated sediment on the rotor wall. Retained solids are discharged as centrate over the rotor weir. Whether an incoming particle with defined physical properties reaches the centrifuge downstream at fixed operating parameters depends on the ratio of the radial sedimentation time to the axial residence time when passing through a pond volume V of length L. Its movement happens normal to the cross-sectional area A = π ( r b 2 r w 2 ) of the pond which is set by the geometry of the rotor. Here, r w is the weir radius, the distance between the rotor axis and the pond surface. In the context of this work, the critical radius
r c ( s 0 , E ) = r b exp s 0 , E ω 2 π ( r b 2 r w 2 ) L V ˙ l
is a key parameter in modeling separation behavior and defines the radial position within the liquid pond where a given particle trajectory begins that ends exactly at the axial boundary x ax = L . The calculation is performed by equating the residence and sedimentation time of a particle along a predefined axial distance [58,59]. Note that Equation (8) assumes an ideal plug flow in the separation zone. In Figure 2, this radius is visualized based on two model particles. Both settle with different rates, e.g., due to their unique solid density, size or form. This approximation enables a quick process evaluation, but greatly simplifies the particle movement. Fluid backflow and turbulence in the pond can lead to deviations with real-world observations. Here, the suspension inlet and the geometry of the weir, i.e., limitations introduced by the centrifuge design, are important as well.
Particularly in the case of prolonged separation experiments, the sediment build-up influences the flow conditions in the pond and, as a result, the particle movement. In Equation (8), this effect is taken into account by substituting r b with the radius of the sediment surface. The transition between suspension and sediment is characterized by an erratic change in material behavior. Particles within the sediment form a network that can absorb forces and can be characterized by porosity. For a compressible sediment, its solid volume fraction is a function of the so-called solid yield pressure, for which empirical models exist [60]. In this case, the sediment height is directly dependent on the acting centrifugal force. When dealing with a homogeneous, incompressible cake, however, the solid concentration is defined as constant and can be derived from sedimentation experiments in analytical or bucket centrifuges. For this work, the sediment built by nanoscale particles in a tubular centrifuge is assumed to be incompressible. The solid volume fraction ϕ mpd of a saturated sediment at maximum packing density determines the porosity [61]. Thus, the sediment height is empirically related to a concentration of particles in the sediment at a constant solid density.

2.3. Multi-Dimensional Grade Efficiency Definition

In the field of particle technology, it is common practice to deal with particle collectives characterized by multivariate and polydisperse geometric and material properties. An accurate determination of the probability distribution of all important particle traits is essential to elucidate a particle system both before and after a separation step. In addition, a comparative analysis of these distributions serves as a prerequisite for evaluating the effectiveness of the separation apparatus performance. The following principles from the field of statistics can be found here [62,63]. Probability density functions, or PDFs, are generally used both to characterize a particulate product and to quantify the result of a separation experiment. In most technical cases, a one-dimensional particle size distribution (PSD) is derived either from indirect analysis of a dispersed physical property or by direct image processing. The random variable Z = { d 1 , d 2 , , d M } is commonly used to represent the equivalent diameter d of each discrete particle size class within a predefined sample space. This work focuses on the development of a multi-dimensional process model for separation in tubular centrifuges when processing scalene particles and their corresponding inertia ellipsoids. Therefore, it becomes necessary to introduce two additional random variables for a proper description of a multi-dimensional particle trait distribution (PTD). Let Y be the second discrete random variable with values denoted by { e 1 , e 2 , , e L } , and X be the third discrete random variable with values designated by { f 1 , f 2 , , f K } , representing the shape parameters of elongation and flatness. This leads to the definition of q 3 ( f , e , d ) : R 3 R for the volume-weighted, joint probability density function of the continuous random vector ( Z , Y , X ) . In discrete notation, the expression
q 3 ( f ¯ k , e ¯ l , d ¯ m ) = μ k l m k = 1 K l = 1 L m = 1 M μ k l m 1 Δ f k Δ e l Δ d m
gives the probability density within the intervals
f k X f k + 1 , e l Y e l + 1 , d m Z d m + 1
with μ k l m representing the partial particle volume in that trait class. The quantities f ¯ k , e ¯ l and d ¯ m are the arithmetic means of each included particle property.
As a consequence, the determination of property-specific separation probabilities is essential for the separation process evaluation. The parameter used for this purpose is called global grade efficiency
T w ( f ¯ k , e ¯ l , d ¯ m ) = 1 ( 1 A ) q 3 , w ( f ¯ k , e ¯ l , d ¯ m ) q 3 , F ( f ¯ k , e ¯ l , d ¯ m )
Additionally, both PTDs defined by Equation (9) at the centrifuge inlet and outlet are used in the calculation. It follows that the numerical dimensions of the discrete grade efficiency correspond to those of the density function. In Equation (10), the global separation efficiency
A w = 1 ϕ w ϕ F = 1 c w c F
is defined as a function of the solid volume fraction ϕ or particle concentration c in the centrate (index w) and in the feed (index F).

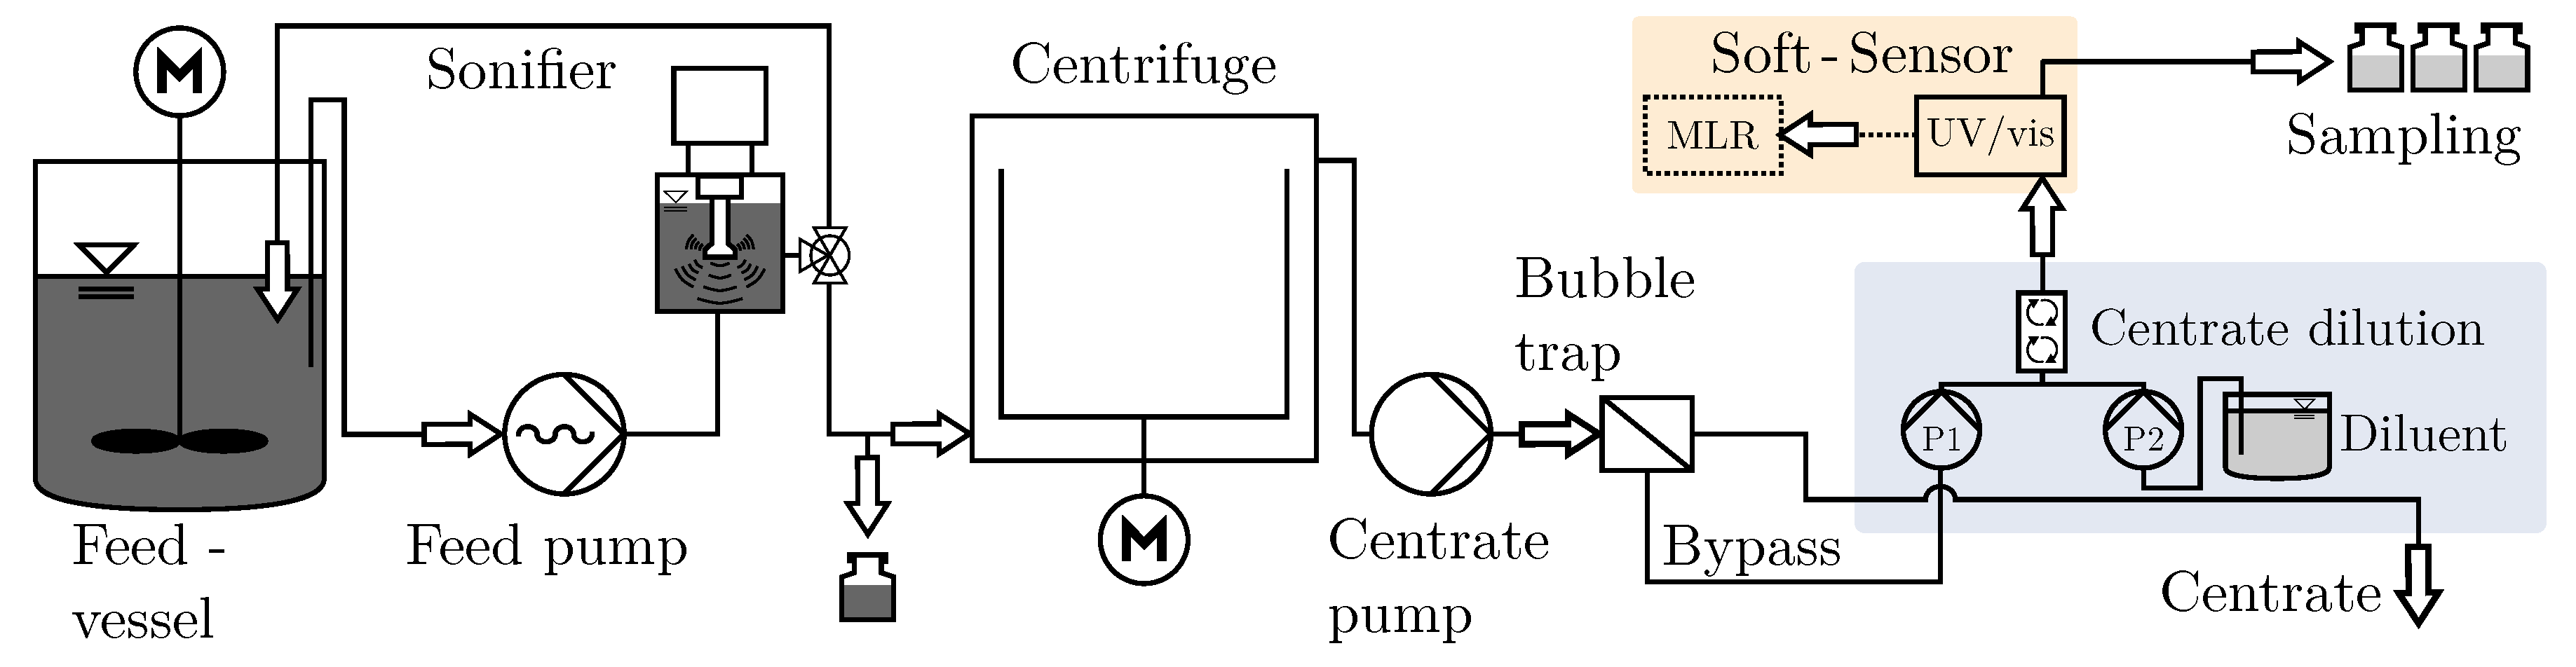
2.4. Experimental Setup and Procedure

The procedure for the separation experiments is similar to that described in [59,64]. The experimental setup is divided into three sections and their interconnection is shown in FigureFigure 3. The fractionation upstream includes modules for feed suspension supply and pre-treatment. All studies in this work on fractionation based on various particle properties assume the ideal case of primary particle sedimentation, which is why additional pre-treatment steps are necessary to prevent agglomeration. An in situ sonifier, permanently installed prior to the feed sampling, is used for this purpose.
The downstream part of the process begins after the rotor outlet with a centrate collection tray. A pump system in combination with a gas–liquid separation unit (bubble trap) feeds the centrate to an online UV/vis analysis. In the following, this combination of spectroscopic hardware and a data-driven evaluation is referred to as a software sensor or soft sensor. The system is designed to determine the mass-specific composition of the centrate in real time based on a readily accessible extinction signal. An optional dilution unit upstream of the UV/vis flow cell can be used to dilute the centrate with deionized water. This is necessary when the extinction induced by the dispersed nanoparticles exceeds the upper detection limit of the spectrometer. Finally, both described stages are connected by a tubular centrifuge. Two process centrifuges are used for this study. The design of the first centrifuge, a prototype with a horizontal rotor layout, is described in detail here [64,65]. In comparison with commercially available tubular centrifuges, the prototype uses a horizontal rotor design as well as an alternative motor technology. Permanent magnets are attached to the rotor in the inner section. The outer construction houses the stator including conductive coils that generate a time-variant magnetic field. With this innovative design, rotor speeds up to 64,000 m−1 were achieved, assisting research projects on nanoparticle separation below 100 nm. The second apparatus is a commercially available tubular centrifuge with the designation Z11 manufactured by Carl Padberg Zentrifugenbau GmbH (CEPA, Lahr, Germany). The geometric dimensions of both rotors and separation zones are listed in Table A1.
This segment describes the general execution of a separation experiment in the setup described above, valid for both centrifuge models. Each run starts with the specification of a target angular velocity ω . The pump in the upstream then starts pumping deionized water into the separation zone. After reaching a maximum pond filling height, the deionized water enters the downstream of the separation process. During operation, the rotor contains approximately 240 mL (Z11) or 270 mL (prototype) of suspension. The particle residence time ranges between 40 and 160 s, depending on the constant volumetric flow rate. If the online extinction is to be recorded via the UV/vis spectrometer, pump P1 then starts pumping the demineralized water from the gas–liquid separator into the flow cell. At this point, it is possible to record a background spectrum via the software of the UV/vis spectrometer. This procedure ensures that only the dispersed nanoparticles in the centrate contribute to the measured extinction signal during the analysis. Now, the actual separation step begins by pumping the feed suspension from the feed vessel into the rotor. During quasi-stationary operation, the centrate flows from the collection tray to the downstream. Reference sampling is possible via a tube at the UV/vis crossflow cell outlet. Each separation test is repeated at least once in order to make a statement about the reproducibility of the experiment. The post-processing of a separation test includes the disassembly of the centrifuge and the removal of the accumulated sediment from inside the rotor. Finally, the two main experimental protocols used in this work are named. Short-term tests investigate the initial stationary separation conditions and, in their evaluation, the sediment height is assumed to be negligibly small. Long-term tests, on the other hand, aim to observe the separation behavior under constantly changing process conditions.

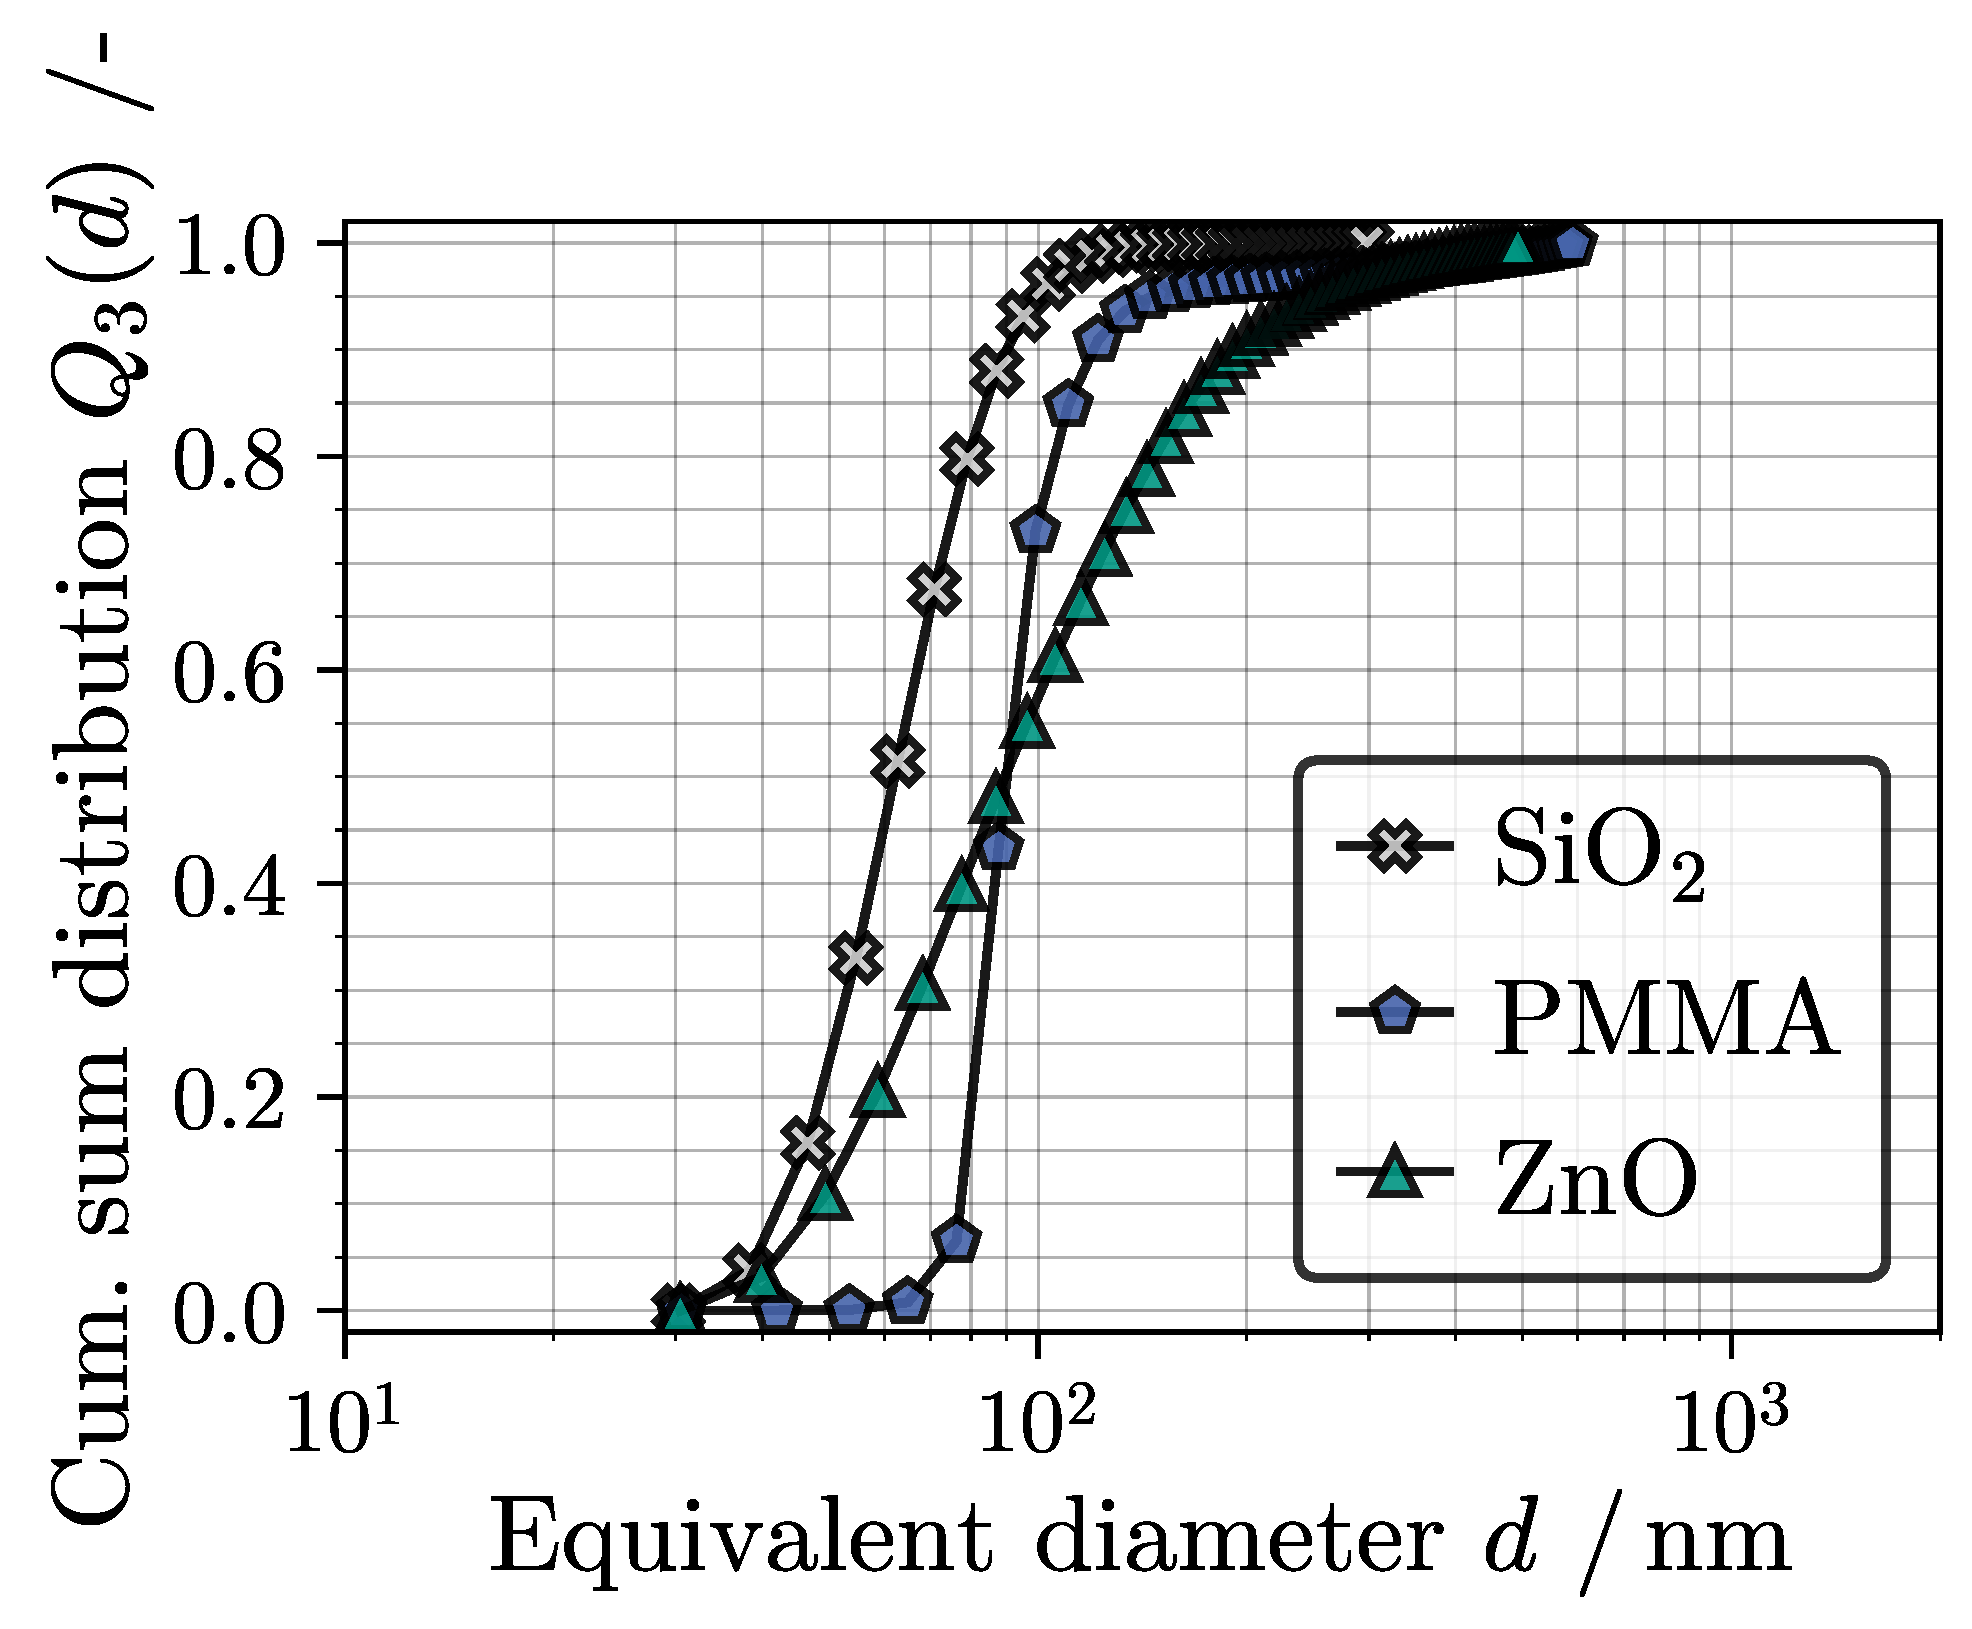
2.5. Particle Systems

The selection of particle systems for this study was based on the following two criteria. First, a substantial amount of the solid mass is distributed among particle size classes below 500 nm. The second important aspect is that the density of the different solids must deviate significantly for all particle systems; i.e., a broad density spectrum (∼1000 kg m−3 ρ s 6000 kg m−3) is covered. The reason for this decision is to ensure that the specified operating parameters of the tubular centrifuge favor fractionation rather than total separation of the systems. For example, when separating by density and particle size, the goal is to extract two material systems with detectable quantities of mass in the centrate. In addition, it is always assumed that the volume of a particle is homogeneously composed of a single substance of constant density with no hetero-agglomeration. Agglomeration reduces the primary particle number and the particles settle in clusters with increased volume. According to Equation (1), this means that the sedimentation velocity increases. Consequently, an isolated evaluation of a separation experiment, e.g., regarding a constant size distribution or material composition in the nanosuspension, would be difficult. To inhibit occurring (hetero-)agglomeration processes, every prepared nanosuspension was stabilized with 0.1 mM sodium hexametaphosphate (Na6P6O18) (Sigma-Aldrich, St. Louis, MO, USA). The mechanism of stabilization is based on the so-called ion size effect. For a more comprehensive explanation, the reader is encouraged to examine the literature related to this topic [66,67,68,69].
For a more detailed description of the systems used, the volume-weighted PSDs are shown in Figure 4. The data were recorded using an analytical disk centrifuge (ADC) called CPS 24,000 (CPS Instruments Inc., Prairieville, LA, USA) with pure feed suspension samples. A qualitative description of the particle morphology is provided by scanning electron microscope (SEM) images depicted in Figure 5a.
For long-term classification experiments, the material polymethylmethacrylate (PMMA) with a density of 1193 kg m−3 is used. The SEM image reveals that the polymer particles are ellipsoids with a predominantly spherical form. Due to its low density, the system is also utilized as a lightweight component of a mixed suspension including a second system of nanoparticles with a significantly higher density. Whenever a mixed suspension is processed, this paper refers to the separation process as density fractionation. In short-term fractionation experiments, a comparison between the separation efficiencies of PMMA and the higher-density zinc oxide (ZnO) are evaluated. Both the PSD analysis and the microscopic images confirm a maximum particle size below 500 nm. The nanoparticles have a density of 5600 kg m−3 and are present as aggregates with a primary particle size of approx. 40 nm after the sonifier pre-treatment.
Fumed silicon dioxide (SiO2) is used as a reference system in form fractionation modeling. The solid density is 2200 kg m−3 and the particles have a mean aggregate size of 64.7 nm. These aggregates, as well as unwanted agglomerates due to the preparation of the SEM sample, can be seen in Figure 5b. Experimentally determined separation efficiencies provide a valuable data source from which to verify the plausibility of the real-time process simulation during form fractionation. However, the separation behavior simulated in Section 3.3 is based on a virtual SiO2 particle system, which has the designation VP-SiO2. This is due to the fact that a complete characterization of the PTD based on d, e and f was not possible by the available measurement techniques. The creation of a virtual particle collective is a workaround that nevertheless allows the application and evaluation of the novel dynamic simulation approach based on 3D distribution data. In light of this, both nanoparticle collectives share the same material density. Moreover, their equivalent diameter range lies within the same scope. The underlying generative algoritm is thoroughly discussed in [53]. A graphical representation of a small selection of the implemented particles included in VP-SiO2 is depicted in Figure 5c.

2.6. Dynamic Separation Model Description

The following part explains the approach for the dynamic simulation of a multi-dimensional separation process in tubular centrifuges. The underlying algorithm first appeared in the work of Gleiss et al. [40,70] involving decanter centrifuges and was later adapted to tubular centrifuges as well.
This study replaces various elements of the core algorithm to simulate both classification and fractionation of nanoparticles. The basic scheme of the parametric tubular centrifuge model (TCM) is visualized in Figure 6. To account for separation experiments in higher dimensions, three segments are highlighted: classification (1D, p = 1 ), fractionation based on particle form (3D, p = 1 ) and density fractionation (1D, p = 2 ). The index variable p indicates the number of components in a suspension. Required inputs to the model include at least one PSD or PTD, the feed concentration, and various physical parameters of the fluid and the dispersed nanoparticles. Additionally, material functions can be implemented that characterize physical sub-processes such as sedimentation hindrance based on empirical correlations. Finally, the chosen operating parameters, the process time and the rotor geometry, i.e., all important process conditions, must be known and included. A temporal and spatial discretization approximates the process dynamics. The scale of this discretization must ensure plausible particle movement in the separation zone as well as a real-time acquisition of the simulation result. The succeeding sections offer a concise description of the TCM algorithm, accompanied by a display of all mass balance equations and their numerical solution approach. For a revision of all model assumptions and a more thorough explanation of the underlying methods, the reader is referred to this publication by Winkler et al. [53] and similar studies based on this methodology found in the literature [37,40].
Spatial discretization is accomplished by dividing the separation zone shown in Figure 2 with the length L into J compartments of equal volume and length Δ L . The connection between these segments is based on mass balances that include both suspended solids in the suspension zone (I)
d ( ϕ I , j V I , j ) d t = V ˙ l ϕ I , j 1 ( 1 ϵ j , sep ) V ˙ l ϕ I , j ,
and accumulated particles in the sediment zone (II)
d ( ϕ II , j V II , j ) d t = ϵ j , sep V ˙ l ϕ I , j 1 .
Here, the assumption of a constant material density of each particle system applies, whereby a substitution of the particle mass by the product of the volume of the suspension zone V I , j and the solid volume fraction ϕ s is feasible. The volumetric flow rate V ˙ l is set as a constant operating parameter. With both Equations (12) and (13) for J compartments, the necessary set of balance equations for real-time modeling of the transient separation process is complete. Note the assumption that the dispersed particles are homogeneously mixed after entering the suspension zone (I) of any given compartment j. The local separation efficiency
ϵ j , sep = k = 0 K 1 l = 0 L 1 m = 0 M 1 T ˜ j f ¯ k , e ¯ l , d ¯ m q ˜ 3 , j f ¯ k , e ¯ l , d ¯ m
       = k = 0 K 1 l = 0 L 1 m = 0 M 1 r b , j 2 r c , j 2 f ¯ k , e ¯ l , d ¯ m r b , j 2 r w 2 q ˜ 3 , j f ¯ k , e ¯ l , d ¯ m
is defined as the product of the local grade efficiency T ˜ j f ¯ k , e ¯ l , d ¯ m in Equation (10) [37,71] and the PTD q ˜ 3 , j f ¯ k , e ¯ l , d ¯ m written out in Equation (9) for the whole collective. This means that for any given dimension of a separation process simulation, the algorithm performs a numerical integration to calculate ϵ j , sep . For example, a one-dimensional classification is computed with a PSD in which the discrete size variables are K > 0 and L , M = 0 . The definition in Equation (14) shows that the grade efficiency of an individual particle depends directly on the calculated critical radius r c , j 2 f ¯ k , e ¯ l , d ¯ m for the respective combination of the chosen distribution characteristics f ¯ k , e ¯ l , d ¯ m . Referring to Section 2.2 and the derivation of the critical radius in Equation (8), it is important to restate that the implemented calculation of the local grade efficiency is only valid under the assumption of an ideal plug flow in the liquid pond. This leads to the implementation of the sedimentation coefficient s E f ¯ k , e ¯ l , d ¯ m with Equations (5) and (6) as a function of the elongation, flatness, equivalent diameter and density of the particle as well as their particle–particle interactions as a function of ϕ . The PTD of the suspension emerging from compartment j 1
q ˜ 3 , j f ¯ k , e ¯ l , d ¯ m = q ˜ 3 , j 1 f ¯ k , e ¯ l , d ¯ m 1 T ˜ j f ¯ k , e ¯ l , d ¯ m 1 ϵ j , s e p
is normalized by the difference 1 ϵ j , sep . Note that the particle trait distribution of the centrate q ˜ 3 , j f ¯ , e ¯ , d ¯ is assumed to be equal to the one leaving the last compartment.
All established dependencies yield a system of ordinary differential equations for J compartments. The temporal discretization (process dynamics) is determined by an explicit Euler method. The volumes of the suspension and sediment zones are redefined using the sediment radius r II , j . This couples the two domains I and II by a boundary condition and reduces the number of unknowns in each compartment to two. Finally, the linear system is solved numerically as an initial value problem. Before each new time step, the simulation updates the results of Equations (14) and (15), resulting in new initial values for the solution of the discretized mass balances. For the results presented in this article, preliminary investigations [53] have shown that a time step width of Δ t = 0.5 and a compartment number of J = 20 are optimal.
In summary, all of the equations listed, and the fact that the geometric properties of the particles are represented by those of an inertial ellipsoid, provide a description of how TCM handles particle systems whose properties are distributed in more than one dimension.

3. Results

The presented results provide an overview of the outcome of several experimental studies on the classification and fractionation of nanoparticles in tubular centrifuges. In addition, the numerical solution calculated by the TCM is evaluated and documented. A comparison of the two sources facilitates a validation of the simulation tool and gives insight into the underlying separation processes and its mechanisms. Additionally, the results address the question of backwards compatibility of the TCM with respect to all distribution variables under consideration. In other words, the model should be flexible; i.e., it should be possible to include only one (1D) or up to three (3D) particle properties in the calculation. The presentation of all results is standardized. Variables calculated by the TCM are highlighted with the accent ˜ . Reference values have the accent ^ if they come from the UV/vis soft sensor, or no accent if they are measured by offline analysis. Additionally, results based on the particle systems used are highlighted in a consistent color and with a definitive marker style.

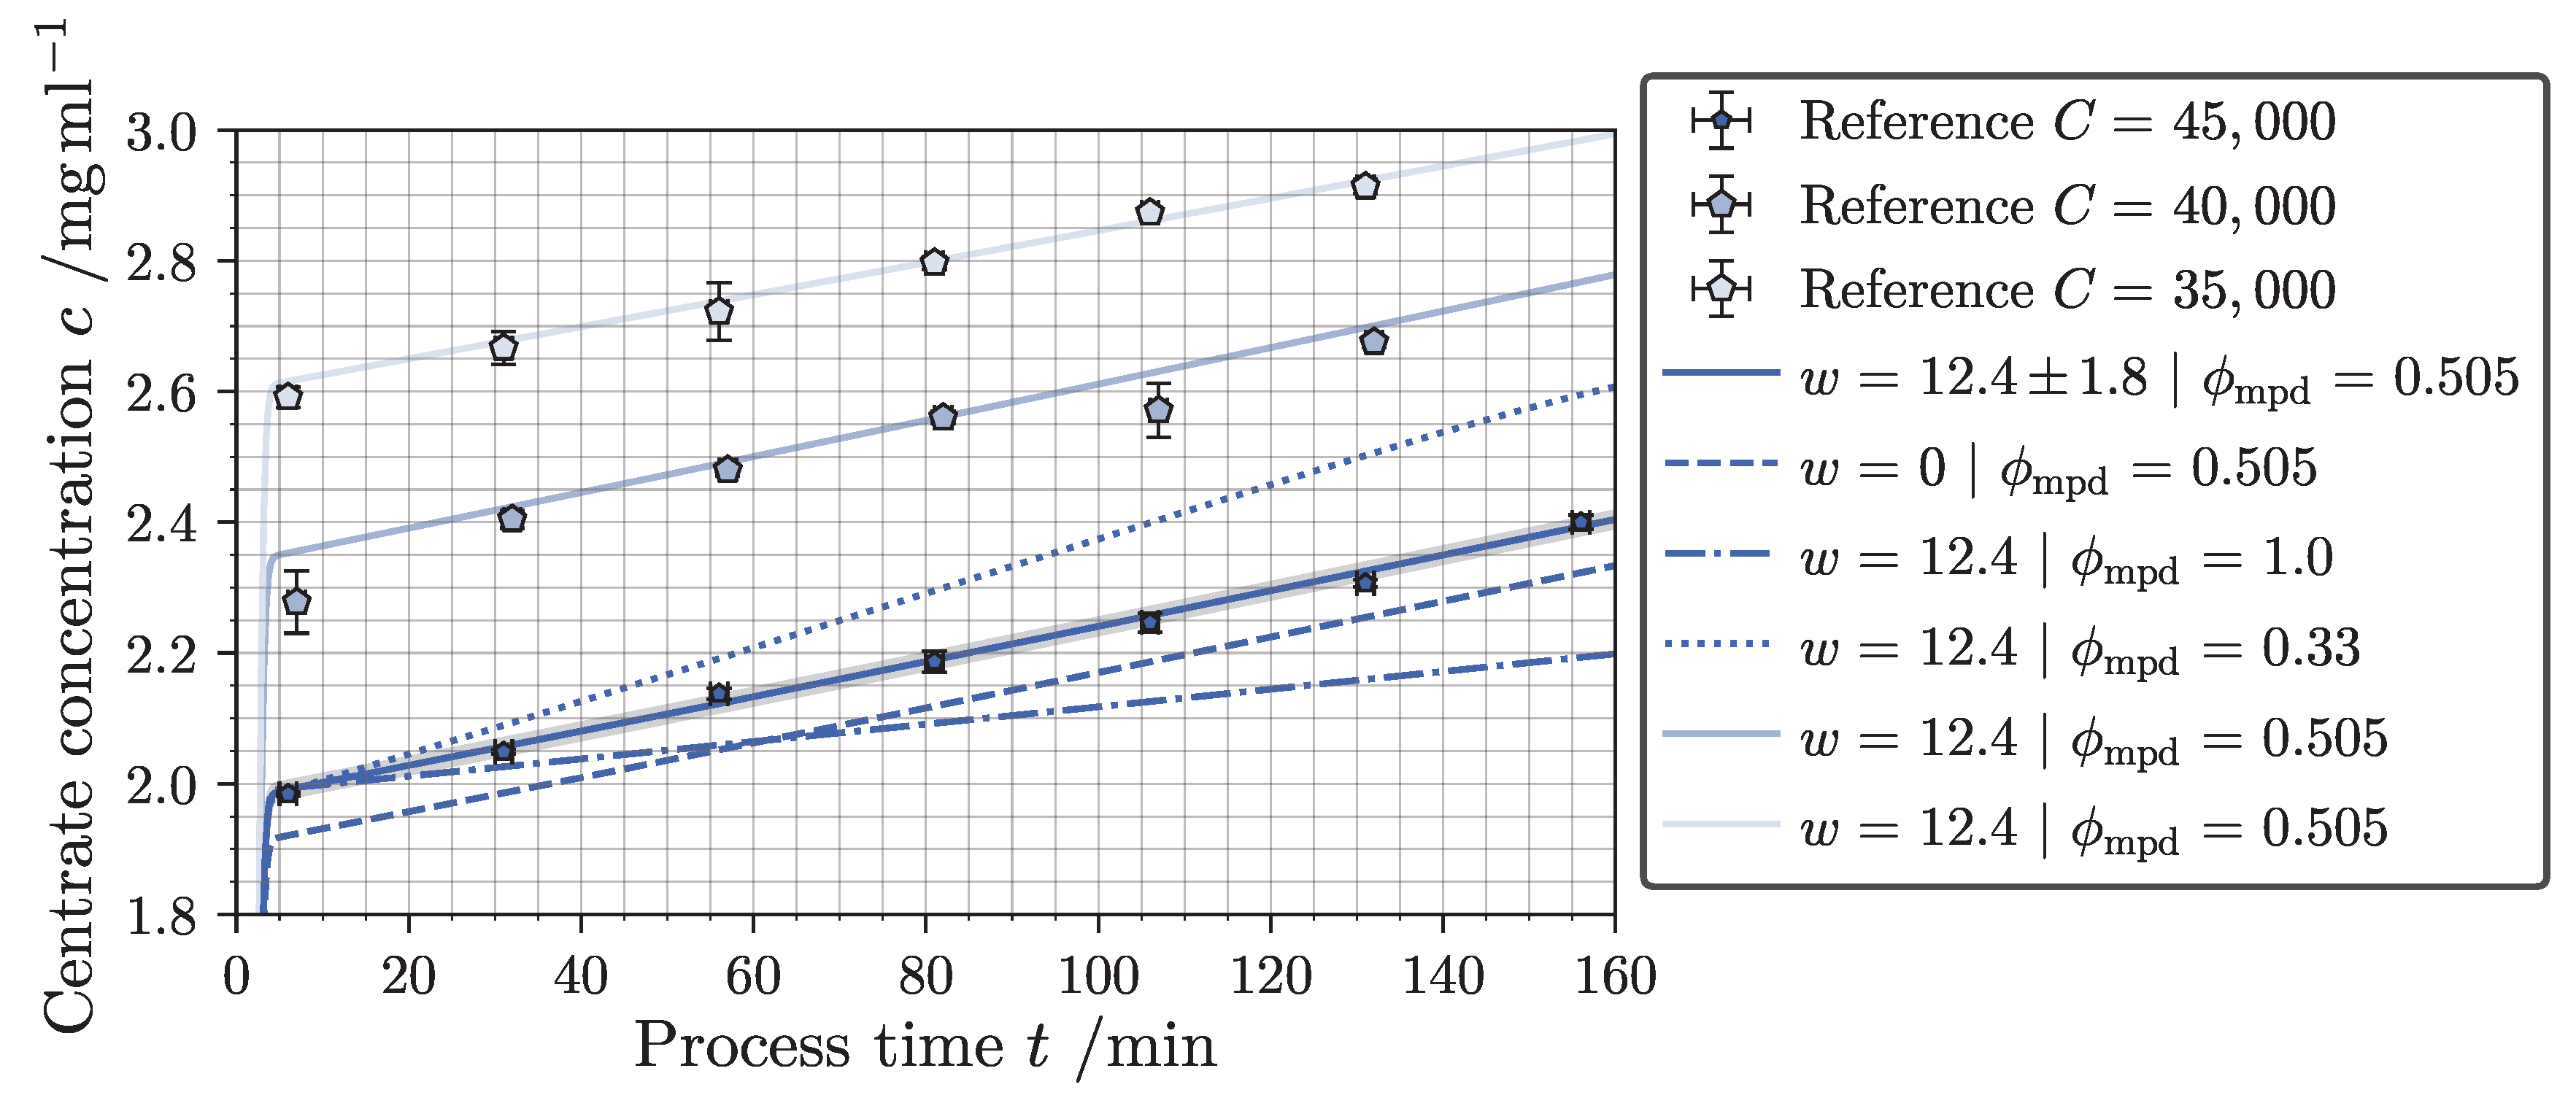
3.1. Long-Term Classification

In order to verify the applicability of the adapted TCM for process simulation in the standard 1D case, reference data of a PMMA classification experiment are used. All noteworthy boundary conditions for the constructed simulation cases are extracted from the experimental parameters and listed in Table 1. A compilation of the remaining geometric and material parameters defined in the simulation tool models can be reviewed in Table A1. The prototype apparatus mentioned in Section 2.4 is used as the process centrifuge. The PMMA nanosuspension is processed with three different centrifugal numbers and in a time interval between 130 and 160 min. Due to the long process time, influences of the sediment build-up on the separation result are to be expected. Consequently, a physics-based assignment of the concentration coefficient w PMMA (Equation (6)) and the solid volume fraction at the maximum packing density ϕ mpd is needed. Both factors were determined empirically using analytical centrifugation (AC) during preliminary studies. For more information on the applied methods involving AC experiments, see [53]. A plot of centrate concentration over process time in Figure 7 is used to discuss the observed process dynamics and their prediction by the TCM.
Gravimetric offline measurements of the PMMA concentration (scattered points) in the centrate show a linear relationship for all three centrifuge numbers. The TCM output (lines) indicates a comparable trend for all three process conditions. The mean deviation for all depicted sampling points is less than 1.4%. However, this is only the case if the material parameters ϕ mpd and w PMMA are set to the same values determined by the AC analysis. To emphasize this observation, further simulation results for C = 45,000 are shown in the diagram. The dashed line is based on a solution of the mass balance that assumes no sedimentation hindrance ( w PMMA = 0 ). This results in a more effective separation of the polymer NPs because no particle–particle interactions reduce their sedimentation rate in the suspension zone. As a result, the TCM calculates higher separation efficiencies and thus a lower centrate concentration.
The dash-dotted and dotted lines in Figure 7 give insight into the influence of sediment height as a function of ϕ mpd . The dash-dotted line corresponds to the assumption of zero porosity in the sediment. For the dynamic calculation, this means that the sediment accumulates at a slower pace for the exact same solid mass transfer. As a result, the particles move at a lower average velocity in the liquid pond and the separation efficiency is greater. Setting the material constant to a model value of ϕ mpd = 0.33 causes the opposite behavior. This case is represented by a dotted line in FigureFigure 7. The sediment takes up more volume in each compartment, which reduces the separation efficiency both locally and globally, resulting in elevated centrate concentrations with a steeper increase over the course of the separation experiment. Overall, the results indicate that the TCM output is consistent with the experimental references provided. Furthermore, the results are comparable to those presented in other publications that use a similar experimental setup and model structure but investigate different material systems [26,40]. Notably, the centrate concentration increases with process time, and an increase in C yields an improved nanoparticle separation. This can be seen in both offline and online analysis, as well as in the output of comparable dynamic process models.

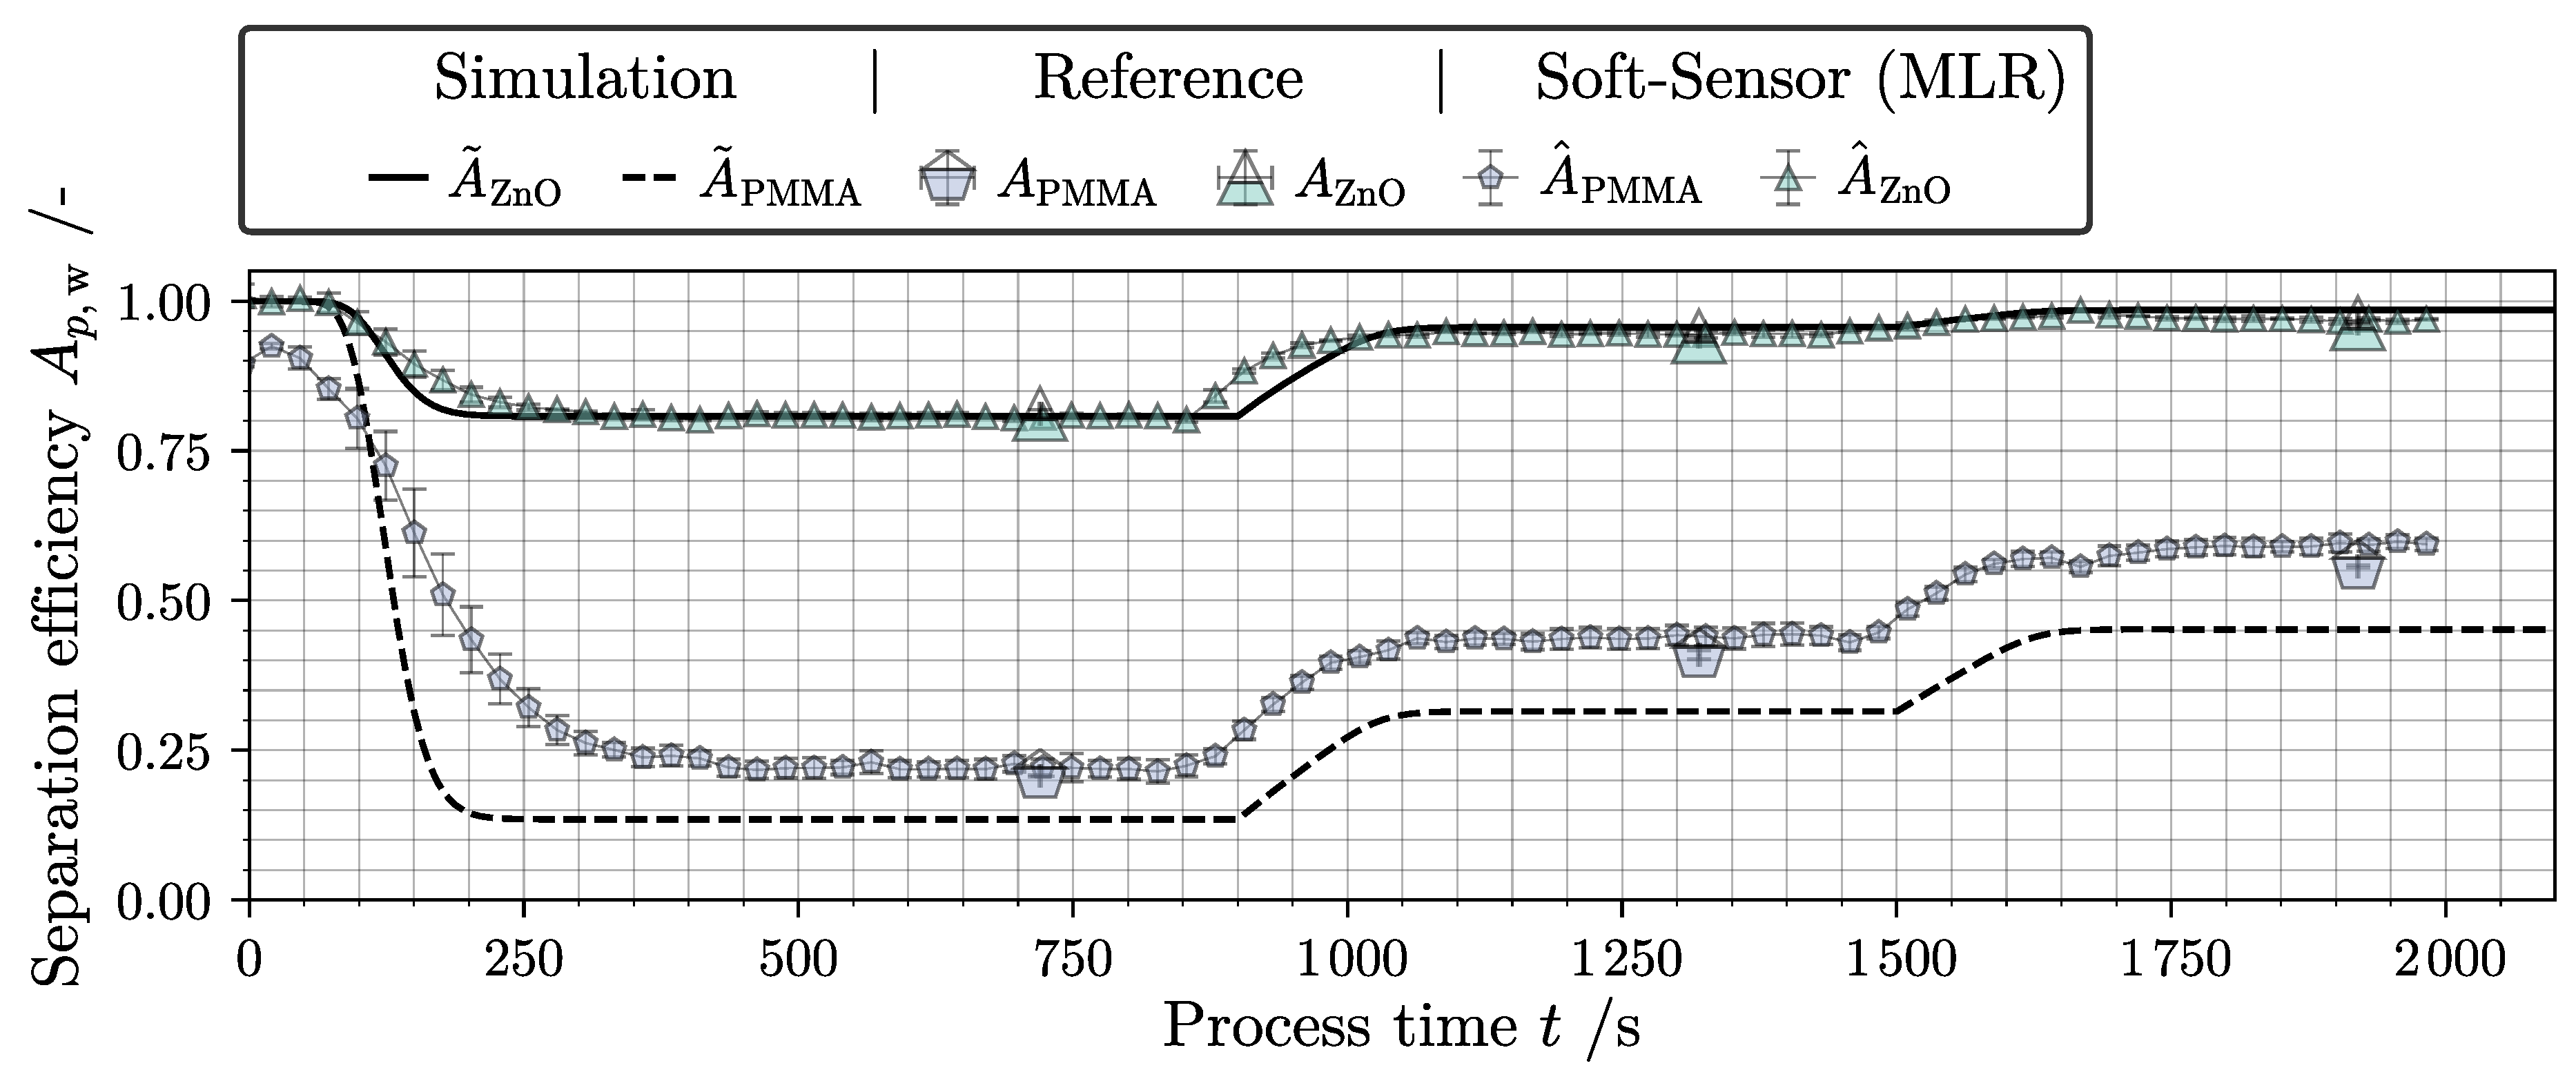
3.2. Short-Term Density Fractionation

To validate the TCM for the case of density fractionation (1D, p = 2 ), a mixed suspension of the PMMA and ZnO nanoparticles is used. The experimental data have been published here [59] and serve as a reference. More specifically, an inductively coupled plasma optical emission spectroscopy (ICP-OES) analysis evaluated the material composition of the centrate. The grade efficiencies for both systems were measured using an ADC. As before, the boundary conditions of the experimental study and the material parameters and constants embedded in the simulation are listed in Table 1 and Table A1. The C-value ramp from 10,000 to 30,000 after 12 min and from 30,000 to 50,000 after 22 min is taken into account. Sedimentation hindrance is implemented for both particle systems. The concentration coefficients are set to w PMMA = 12.4 and w ZnO = 1004.31 . Again, these material parameters are determined by AC measurements with the same method described in [53]. Furthermore, since this study is based on short-term tests with very low feed concentrations, the influence of sediment formation is neglected in the simulation.
In Figure 8, the calculated separation efficiencies A ˜ p , w are shown. Large markers represent the sampling times and analysis by ICP-OES measurement. The small dots identify the output of a UV/vis soft sensor. It applies a pre-trained regression model that translates a raw extinction spectrum of the centrate into a suspension composition in real time. A detailed flow chart and explanation of the soft sensor design and execution can be found here [59]. Lastly, the TCM model output is depicted as a solid line for ZnO and a dashed line for PMMA. The simulated data correspond well with the online measurement of the sensor A ^ p , w , which implies a plausible mathematical description of the residence time by the TCM. The simulated separation efficiencies for ZnO nanoparticles show a mean deviation of below 1.5% compared to the sample references measured by ICP-OES. With a mean deviation of roughly 25%, the discrepancy is greater for the material system PMMA. The TCM output underestimates the separation efficiency significantly. A possible explanation for this discrepancy is provided by a model assumption made for the TCM. Particle–particle interactions are only accounted for using two one-dimensional concentration coefficients w p . However, it cannot be ruled out that material-specific interactions between particles may occur in a mixed suspension during centrifugation. An entrainment of the lighter PMMA particles by the heavier and significantly faster ZnO-NPs would speak for the observed increase in A PMMA during density fractionation. In other words, due to higher sedimentation speeds of the ZnO-NPs, the lighter PMMA particles are separated more effectively. This is a phenomenon that cannot be represented by the idealized TCM model in its current state. The ability of the model to calculate a precise prediction of the separation efficiency is shown by the results presented in Figure 7. This reinforces the hypothesis that a change in sedimentation behavior due to additional components can influence the outcome of a density fractionation. By empirically deriving the concentration coefficient for mixed suspensions, this effect could be investigated in more detail in the future and incorporated into the model structure of the TCM.
Figure 9 shows model T ˜ w ( d ) and reference data T w ( d ) for the grade efficiency. As expected, the cut size d ( T p , w = 0.5 ) shifts towards smaller particle sizes for increasing C values. The ZnO nanoparticles are separated more effectively due to their 4.6-times-higher density compared to PMMA. Curves for ZnO, which can no longer be determined precisely with the ADC due to too-low concentrations in the centrate, are defined qualitatively by the TCM.
In summary, the results emphasize that both particle size and material density, as primary particle properties, comprehensively determine the separation outcome in density fractionation. With respect to the development of the TCM, it is now possible for the first time to numerically quantify the separation of two components in a mixed suspension in parallel. However, it has been shown that the accuracy of the model needs to be further improved when dealing with mixed suspensions. A promising approach is to analyze an array of possible interactions between multiple components as a function of their respective solid concentrations and other physical properties such as, e.g., their morphology or surface functionalization. For this, specific methods involving commercial analytical centrifuges and highly sophisticated devices [54] are needed to evaluate these multi-dimensional material functions and to enhance a purely physics-based modeling approach.

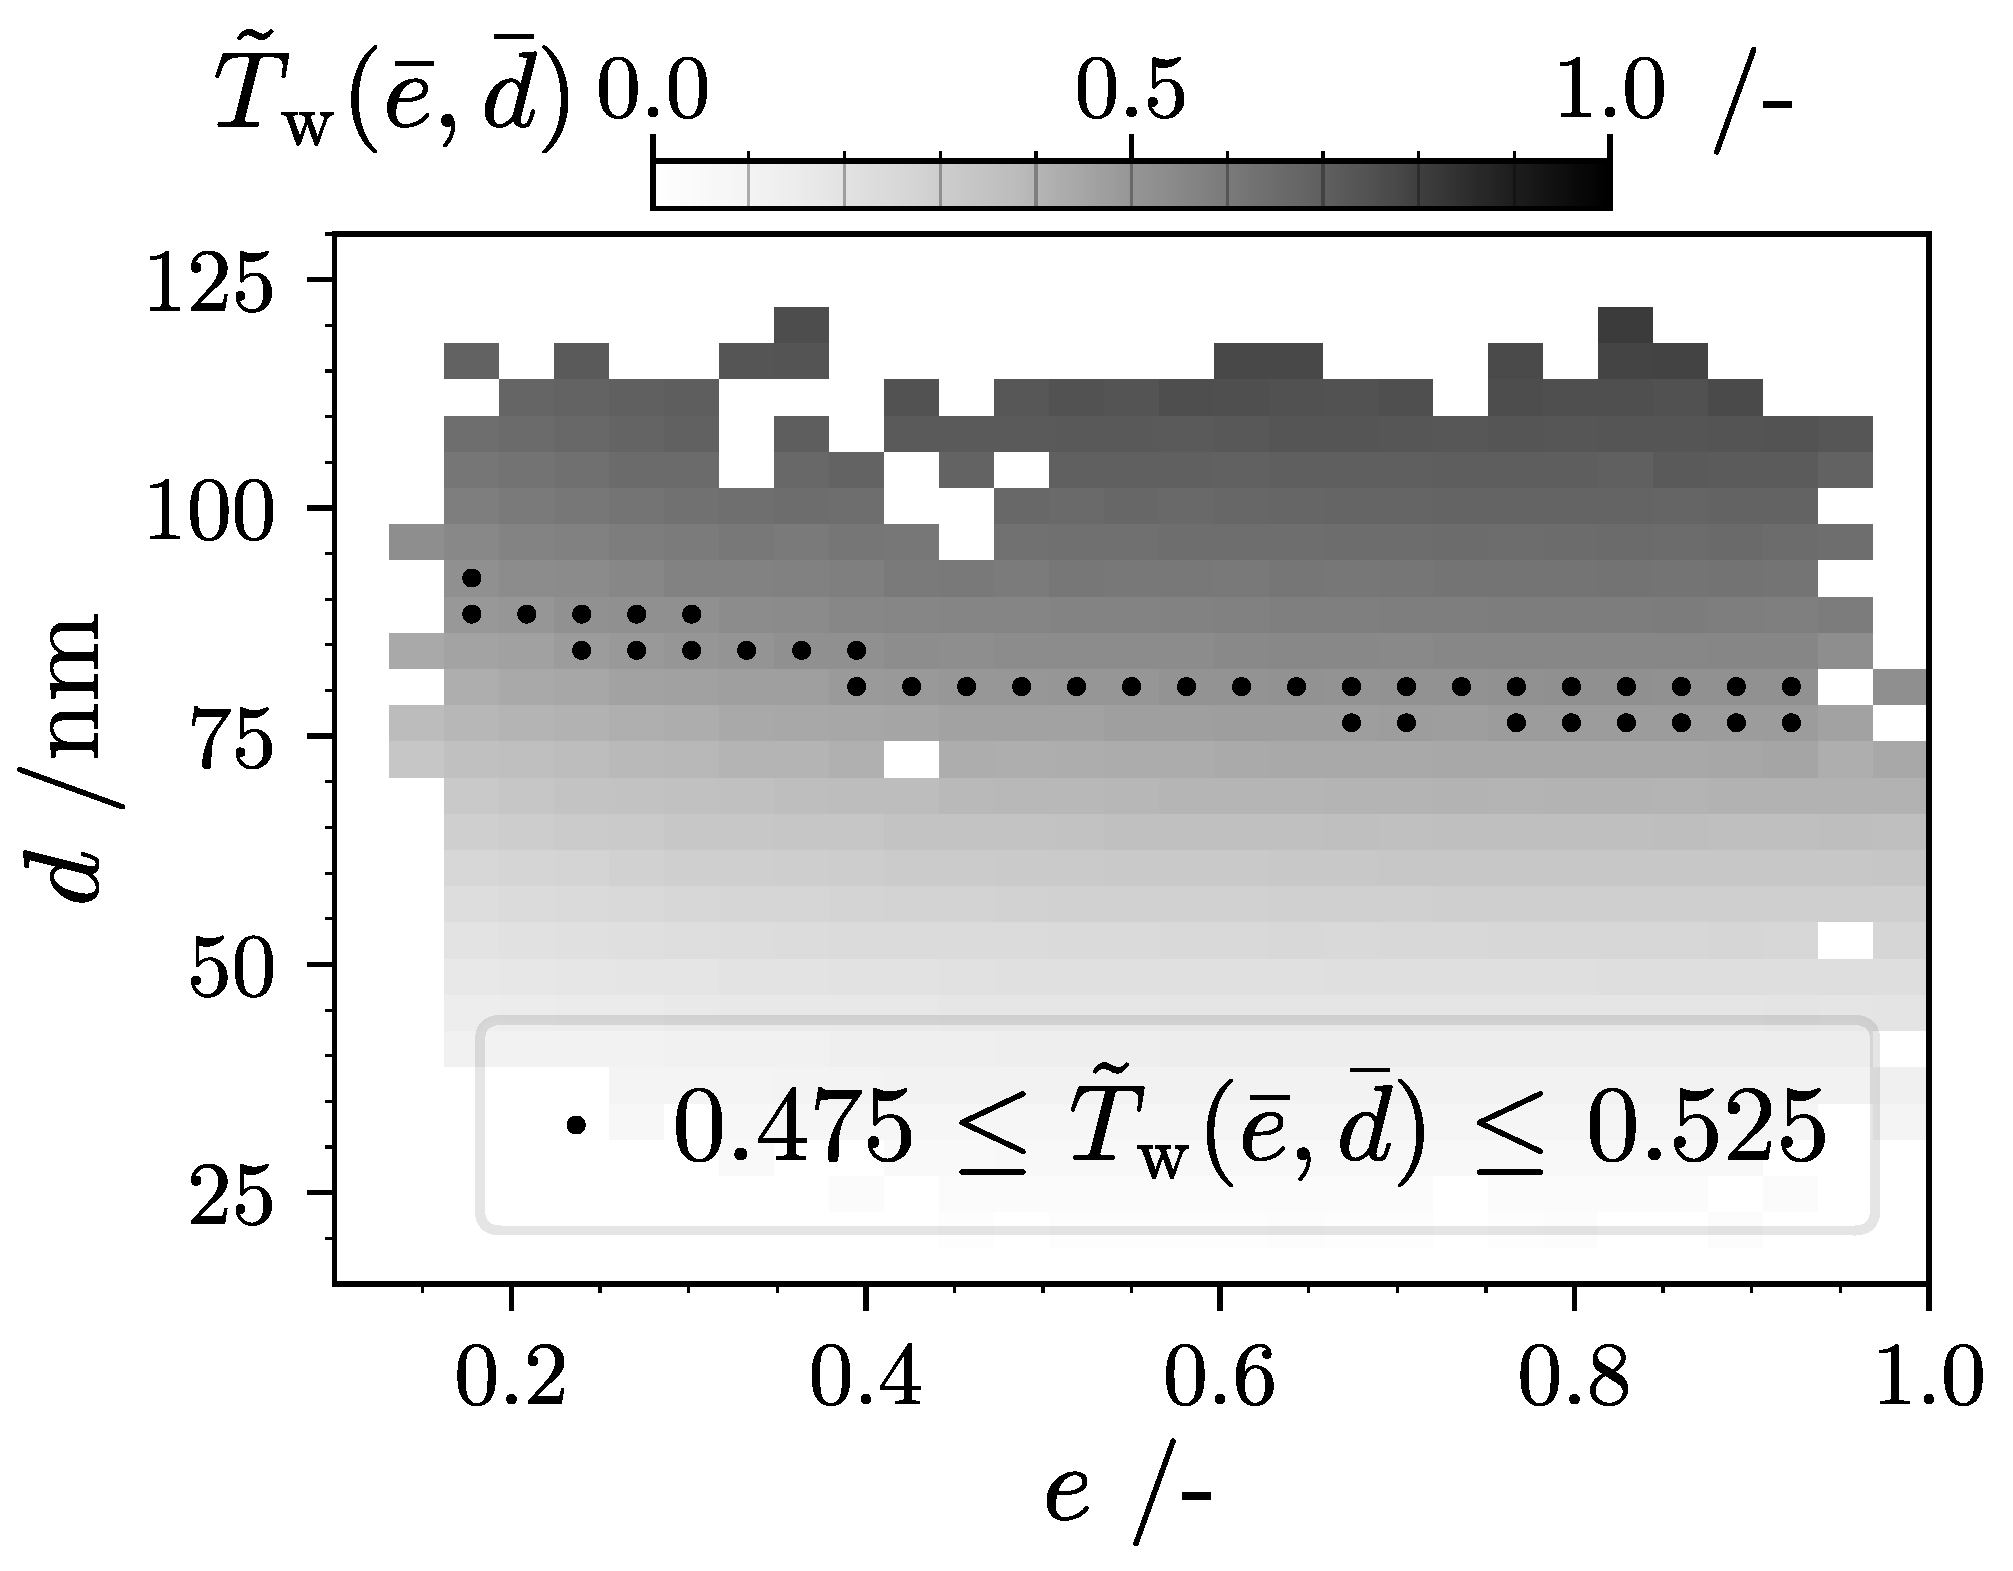
3.3. Short-Term Form Fractionation

The data shown in this chapter were already published and discussed in [53]. In order to emphasize the advancement of the TCM and all its novel capabilities with respect to multi-dimensional fractionation modeling in tubular centrifuges, all findings are discussed again in the context of this work.
A developed generative algorithm produces a total of N = 3771 individual aggregates, four of which are shown in Figure 5c. A subsequent algorithm then carries out a volumetric analysis of the VP-SiO2 collection and stores the density distribution for a defined discretization range as a matrix. If f = e = 1 , the described routine would produce a standard PSD with ( M 1 ) classes and q 3 R 1 × 1 × M 1 . This distribution type is well known and common in particle technology and its presentation is trivial. However, the discussion of three-dimensional PTDs represents a new and major challenge in modern separation technology research. In this work, a new method is proposed based on the probability theory for discrete multi-dimensional distribution data described by Equation (9). In Figure 10, the calculated 3D PTD of VP-SiO2 based on the total particle count N distributed over
K 1 L 1 M 1 = 29 3 = 24389
property classes is shown. This results in q 3 R K 1 × L 1 × M 1 displayed as a data cloud in the set 3D domain. Darker shades of gray indicate a higher density of particles. In other words, the probability of encountering a particle with this combination of properties in the collective is higher. Empty classes are not colored and are completely transparent. An advantage of this visualization is the quick identification of elongated, flat or bladed NP populations. The graphical visualization is thus closely related to the classification method of Zingg [72]. However, a major drawback is that a large portion of the data points are hidden, depending on the orientation of the 3D graph. In addition, values within the cloud are not visible at any viewing angle. Marginal distributions can overcome this problem. Their definition in the context of this work is highlighted in Equations (A1) and (A2). The calculation and depiction of each marginal distribution assists the discussion and interpretability of 3D PTDs from a technical standpoint. Winkler et al. [53] demonstrates this fact with a holistic depiction of VP-SiO2 and all its marginal distributions. An additional example is shown in Figure 11 with the marginalized distribution q 3 d ¯ derived from q 3 f ¯ , e ¯ , d ¯ obtained after numerical integration twice along the variables e and f.
A major advantage of this data preparation pipeline is that it is independent of the source of the particle volumetric data. In other words, the model system VP-SiO2 is a virtual particle system, but the described procedure can be used with real data, too. Specifically, this could be experimental data from a nano-CT or µ-CT measurement [73,74] or transmission electron microscopy (TEM) image analysis [75]. Consequently, the TCM may be further validated based on additional separation experiments in future research.
To validate the TCM for the case of form fractionation (3D, p = 2 ), the VP-SiO2 model system and its 3D PTD data depicted in Figure 10 are used. Additionally, 1D PSD data of a separation experiment with SiO2 are used to evaluate the plausibility of the TCM output. One last time, the boundary conditions of the experimental study, the material parameters and defined constants are listed in Table 1 and Table A1. The simulation time is t N = 360 s. The visualization drawn in Figure 12 quantifies the output of the fractionation modeling via a 3D representation of the grade efficiency, calculated according to Equation (10). The data clearly demonstrate that the separation efficiency is higher for particles with a larger equivalent diameter. This conclusion can be explained by the Stokes settling velocity defined in Equation (2). It implies that the change in sedimentation speed is proportional to the square of the corresponding change in d. One of the questions to be addressed is whether a dependency of the additional form parameters e and f can also be derived from the model data of the TCM. For this purpose, Figure 13 focuses on the primary separation criterion d, which represents the total particle volume, in combination with the secondary criterion e, i.e., the particle elongation. The image draws a heat-map of T ˜ w e ¯ l , d ¯ m . Similar to Figure 10, darker shades of gray indicate a higher separation efficiency. The calculation is based on both 2D marginal distributions q 3 , F e ¯ l , d ¯ m and q ˜ 3 , w e ¯ l , d ¯ m . Black dots mark the classes for which the 3D TCM calculated a separation efficiency close to T ˜ w e ¯ 50 , d ¯ 50 = 0.5 . This partial highlighting shows more clearly that for smaller values of e, i.e., particles that increasingly deviate from a spherical shape, a reduced separation efficiency is to be expected for the same equivalent diameters. In other words, the final cut size shifts toward larger equivalent diameters for smaller e values.
This outcome is intended by the TCM in accordance with the expression of the form-dependent SC introduced in Section 2.1. Therefore, these observations can be marked as valid.
A detailed comparison between the 1D and 3D TCM output is shown in Figure 14. Here, the separation efficiencies are plotted for the real reference system SiO2 as well as for VP-SiO2. In addition, bar charts with M = 29 classes are plotted showing the 1D marginal distribution of the VP-SiO2 NPs. The PSD of the inlet q 3 , F is normalized, while the PEV of the centrate q ˜ 3 , w is weighted with the factor ( 1 A ˜ w ) . For the qualitative validation of the 3D TCM, a direct comparison of the two results is carried out. Both the VP-SiO2 and the reference system consist of a collective of nanoparticles that are in a similar size range in terms of volume. Furthermore, the boundary conditions of the simulation are identical to the 1D case. Therefore, it is expected that for short process times and the chosen low concentration of the feed suspension, the separation probabilities of the particles will be close to each other. This is exactly the case for both simulations. Differences in the data are only found at larger equivalent diameters. A possible explanation is given in Figure 10. The 3D PTD shows that a large fraction of the generated particles with e 0.25 have an equivalent diameter of d 75 nm. This means that noticeable deviations from a spherical shape are mainly present in the classes filled by large particles of the collective. Note that the 1D TCM uses a conventional 1D particle size distribution determined by an ADC measurement. The instrument records the equivalent diameter of the aggregates d as the exclusive particle feature. According to the implemented model equations, the sedimentation velocity of a sphere is always greater than that of a non-spherical particle. It is therefore plausible that the 3D TCM calculates a lower separation efficiency for an aggregate with this combination of properties.
Compared to the previously investigated separation characteristics of volume and density as primary separation criteria, the results of this section indicate that the influence of the form parameters is negligible. Hence, elongation and flatness are to be defined as secondary separation characteristics for the majority of process engineering applications involving tubular centrifuges for nanoparticle fractionation. According to the current state of knowledge, it is difficult to achieve a sharp technical separation in tubular centrifuges when focusing exclusively on these shape parameters. However, assuming different process and boundary conditions, a possible increase in the influence of e and f on the global grade efficiency cannot be excluded. An example of this is the theoretical consideration of particles with extreme spatial dimensions that diverge from a compact particle form ( e 1 , f 1 ). This is supported by studies investigating an increase in the drag coefficient with the increasingly non-spherical form of colloidal particles. As an example, He et al. [76] studied the superimposed effects of concentration and shape on the sedimentation of colloidal platelets in an analytical centrifuge. The study found that at higher concentrations, additional factors such as the orientation of the platelets in the collective play an important role.

3.4. Notes on Efficient Monitoring of Fractionation in Tubular Centrifuges

When dealing with arbitrary multi-component systems and their separation, multi-dimensional quantification methods are essential for a trustworthy process evaluation. In this context, the results of Section 3.3 show that these analytical methods are either not available for the desired PTD type and resolution or are extremely time-consuming and costly to perform. However, Section 3.2 shows that new solutions can be developed for global evaluation criteria applied to nanosuspensions with multiple components. In the presented findings, the real-time process monitoring of the separation efficiency was highlighted. This is a very important feature in, e.g., density fractionation in tubular centrifuges since the process runs semi-continuously. The monitoring system allows an immediate response to changing product characteristics caused by sediment build-up. The strategy involves the implementation of the centrate signal to a process control loop similar to [26] by adjusting the centrifugal number live during an experiment. The results of Section 3.2 are based on a preliminary study [64] that investigates the offline monitoring of density fractionation by means of UV/vis spectroscopy. Here, the working principle is tested based on separation experiments involving two common pigment nanosuspensions and their mixture. The preliminary results of this study indicate that changes in the PSD relative to the feed suspensions resulted in wavelength-dependent alterations in the UV/vis spectra of both material systems. This leads to reduced accuracy in determining nanoparticle concentration using regression methods based on extinction data derived from feed suspensions. This challenge can be addressed by integrating historical process data into the quantitative model. The study and the subsequent development of the soft sensor show that the indirect and time-efficient evaluation of essential process variables in the fractionation of nanoparticles in tubular centrifuges is feasible. However, as the complexity of nanosuspensions increases, future research will be faced with the task of advancing established methods, e.g., to enable online measurement of additional separation metrics such as multi-dimensional PTDs.

4. Conclusions

The evaluation of separation efficiency in tubular bowl centrifuges is typically based on particle size, represented by the radius of a volume-equivalent sphere. However, recent research has highlighted the importance of beneficial product properties associated with the distribution of, e.g., particle form or other geometric and material properties within a nanoparticle collection. This study addresses this issue by developing a simulation tool for modeling the fractionation of multi-dimensional nanosuspensions in tubular bowl centrifuges. To obtain numerical calculations for both one- and multi-dimensional grade efficiencies in nanoparticle fractionation, an existing model is restructured, modified and enhanced. At its core, the dynamic model solves mass balance equations for a finite number of compartments that spatially discretize the sedimentation zone and define the residence time of the solids.
The functionality of the fundamental TCM is preserved. Results from a 1D case study of long-term classification confirm that accurate prediction of the separation outcome is possible even over longer process times. TCM calculations are physics-based but contain multiple assumptions to ensure real-time calculations. Non-physical behavior is addressed by empirically determined material functions for sedimentation hindrance and sediment build-up. In addition to the separation based on the equivalent diameter as a single continuously distributed variable, this work also presents the density fractionation of a mixed suspension of two components. The PSD of both materials and their different material densities are simultaneously considered and used in conjunction to solve the mass balance of the TCM. Experimental results validate the simulation results based on the concentration and size distribution of several centrate samples. As a result, the developed model, combined with the output of the data-driven sensor described earlier, allows a deeper understanding of multi-component separation processes. With the established tools, future research can be supported when optimizing a multi-dimensional separation process with, e.g., other materials or a different tubular centrifuge design. This is mainly because multiple separation metrics can be approximated by the TCM, which reduces the experimental effort.
Finally, the theoretical results of 3D TCM reveal the feasibility of modeling three-dimensional fractionation. The particle volume and its form, characterized by the elongation and flatness of an associated inertial ellipsoid, are included in the mass balance of the model. The investigated material system consists of virtual SiO2 aggregates that emulate a real product with similar specifications. Direct validation of the simulation is not possible due to the lack of quantitative information on the particle form. Nano-CT analysis or comparable high-resolution methods for image-based and discrete characterization of particle collectives represent a possible solution strategy. However, the limitations of the measurement methods mentioned in the literature suggest that validation in the nanoscale particle size range is not feasible with the current state of the art. Nevertheless, computer-generated nanoparticles and their volumetric analysis provide an interim solution that will ultimately allow for the testing of 3D TCM. The findings herein support the assertion that volume and density are primary and particle form is a secondary separation characteristic. In conclusion, with the separation apparatus used in this work and in the parameter range investigated, an isolated and efficient separation by particle form in the nanometer range is not possible. That being said, however, the novel approach discussed in this work is now able to handle multi-dimensional input data for the first time ever. This opens up new possibilities in future research devoted to separation tasks involving more than just one targeted criterion.

Author Contributions

Conceptualization, M.W.; methodology, M.W.; software, M.W. and M.G.; validation, M.W.; formal analysis, M.W.; investigation, M.W.; resources, M.W.; data curation, M.W.; writing—original draft preparation, M.W.; writing—review and editing, M.W. and M.G.; visualization, M.W.; supervision, M.G. and H.N.; project administration, H.N.; funding acquisition, H.N. All authors have read and agreed to the published version of the manuscript.

Funding

This research was funded by the German Research Foundation (Deutsche Forschungsgemeinschaft, DFG) in the priority program 2045 “Highly specific and multi-dimensional fractionation of fine particle systems with technical relevance.” Grant number: NI 414/31-2.

Institutional Review Board Statement

Not applicable.

Informed Consent Statement

Not applicable.

Data Availability Statement

The presented datasets are available from the corresponding author on request and are part of the following dissertation work (thesis): Winkler, M., “Prozesstechnische Fraktionierung von nanoskaligen Partikeln in Röhrenzentrifugen”, Dissertation, Karlsruhe Institut of Technology (KIT), Karlsruhe, Germany, 25 July 2023. [77].

Acknowledgments

The authors would like to thank Carl Padberg Zentrifugenbau GmbH (CEPA) for providing the Z11-type tubular centrifuge and Evonik Industries AG for donating the SiO2 and PMMA NPs. Funding by the Deutsche Forschungsgemeinschaft (DFG; NI 414/31-2) is gratefully acknowledged.

Conflicts of Interest

The authors declare no conflicts of interest. The funders had no role in the design of the study; in the collection, analyses, or interpretation of data; in the writing of the manuscript; or in the decision to publish the results.

Abbreviations

The following symbols are used in this manuscript:
ρ s solid densitykg m−3
ρ l liquid densitykg m−3
ω angular velocityrad s−1
η l dynamic viscositykg m−1 s−1
ϕ solid volume fraction-
μ partial particle volumem3
ϵ local separation efficiency-
Aseparation efficiency-
Aparticle projection surfacem2
Ccentrifugal number-
c w drag coefficient-
cparticle concentrationkg m−3
dequivalent diameterm
eelongation-
fflatness-
ggravitational forcem s−2
kdrag correction parameter-
Lliquid pond lengthm
qprobability density functionm−1
rradiusm
ssedimentation coefficients
Tgrade efficiency-
ttimes
u 0 terminal sedimentation velocitym s−1
V s solid volumem3
wconcentration coefficient-
k , l , m , j counter variables (subscripts)-
The following symbols are used in this manuscript:
1DOne-dimensional
2DTwo-dimensional
3DThree-dimensional
ISedimentation zone
IISediment zone
ACAnalytical centrifugation
ADCAnalytical disk centrifuge
CFDComputational fluid dynamics
CTComputer tomography
EXPExperiment
MLPMultiple linear regression
NPNanoparticle
PDFProbability density function
PSDParticle size distribution
PTDParticle trait distribution
SCSedimentation coefficient
SEMScanning electron microscopy
TEMTransmission electron microscopy
TCMTubular centrifuge model
UV/visUltraviolet/visible

Appendix A. Additional Simulation Parameters and Geometric Constants

Table A1. Geometric, material and simulation parameters used in the tubular centrifuge model (TCM).
ParameterSymbolValueSI Einheit
Weir radius (MGZ) r w 0.0155 m
Weir radius (Z11) r w 0.0073 m
Wall radius r b = r II , j t 0 0.0215 m
Pond length (MGZ)L0.359 m
Pond length (Z11)L0.175 m
Density liquid ρ l 998.207 kg m 3
Viscosity η l 1.0027 × 10 3 kg m 1 s 1
Compartment countJ20
Simulation time t N case dependent s
Time step size Δ t 0.5 s

Appendix B. Marginalization of Higher Dimensional Particle Trait Distributions

A major difficulty in the practical handling of three-dimensional distributions is that their visualization in planar space (paper, screen) is limited. A possible solution is offered by so-called marginal distributions, which allow a reduction in complexity and thus a better readability of the data [43]. In practice, the method known as marginalization performs an integration along a dispersion variable. In continuous notation, the expression
q 3 ( f , e ) = d min d max q 3 ( f , e , d ) d d ,
combined with a standard normalization, reduces the data within a tensor to a 2D matrix that describes the first marginal distribution. To eliminate the form-defining variables e and f, the equation
q 3 ( d ) = f min f max e min e max q 3 ( f , e , d ) d e d f
can be used. Here, a 3D particle trait distribution (PTD) is transformed into a traditional PSD by means of marginalization. Now, this PSD can be plotted using conventional methods.

References

  1. Hulla, J.; Sahu, S.; Hayes, A. Nanotechnology: History and future. Hum. Exp. Toxicol. 2015, 34, 1318–1321. [Google Scholar] [CrossRef] [PubMed]
  2. Nasrollahzadeh, M.; Sajadi, S.M.; Sajjadi, M.; Issaabadi, Z. An Introduction to Nanotechnology. In Interface Science and Technology; Elsevier: Amsterdam, The Netherlands, 2019; pp. 1–27. [Google Scholar] [CrossRef]
  3. Wong, A.; Liu, Q.; Griffin, S.; Nicholls, A.; Regalbuto, J.R. Synthesis of ultrasmall, homogeneously alloyed, bimetallic nanoparticles on silica supports. Science 2017, 358, 1427–1430. [Google Scholar] [CrossRef] [PubMed]
  4. Adair, J.H.; Suvaci, E. Morphological control of particles. Curr. Opin. Colloid Interface Sci. 2000, 5, 160–167. [Google Scholar] [CrossRef]
  5. Zhang, J.; Yang, S.; Chen, Z.; Yan, Y.; Zhao, J.; Li, J.; Jiang, Z. In Situ synthesis of SiC-graphene core-shell nanoparticles using wet ball milling. Ceram. Int. 2018, 44, 8283–8289. [Google Scholar] [CrossRef]
  6. Malamatari, M.; Taylor, K.M.; Malamataris, S.; Douroumis, D.; Kachrimanis, K. Pharmaceutical nanocrystals: Production by wet milling and applications. Drug Discov. Today 2018, 23, 534–547. [Google Scholar] [CrossRef]
  7. Ramos, A.P.; Cruz, M.A.E.; Tovani, C.B.; Ciancaglini, P. Biomedical applications of nanotechnology. Biophys. Rev. 2017, 9, 79–89. [Google Scholar] [CrossRef]
  8. He, Z.; Zhang, Z.; Bi, S. Nanoparticles for organic electronics applications. Mater. Res. Express 2020, 7, 012004. [Google Scholar] [CrossRef]
  9. Plüisch, C.S.; Wittemann, A. Shape-Tailored Polymer Colloids on the Road to Become Structural Motifs for Hierarchically Organized Materials. Macromol. Rapid Commun. 2013, 34, 1798–1814. [Google Scholar] [CrossRef]
  10. Vogel, N.; Retsch, M.; Fustin, C.A.; del Campo, A.; Jonas, U. Advances in Colloidal Assembly: The Design of Structure and Hierarchy in Two and Three Dimensions. Chem. Rev. 2015, 115, 6265–6311. [Google Scholar] [CrossRef]
  11. Narayanan, R.; El-Sayed, M.A. Shape-Dependent Catalytic Activity of Platinum Nanoparticles in Colloidal Solution. Nano Lett. 2004, 4, 1343–1348. [Google Scholar] [CrossRef]
  12. Auffan, M.; Rose, J.; Bottero, J.Y.; Lowry, G.V.; Jolivet, J.P.; Wiesner, M.R. Towards a definition of inorganic nanoparticles from an environmental, health and safety perspective. Nat. Nanotechnol. 2009, 4, 634–641. [Google Scholar] [CrossRef] [PubMed]
  13. Kutvonen, A.; Rossi, G.; Puisto, S.R.; Rostedt, N.K.J.; Ala-Nissila, T. Influence of nanoparticle size, loading, and shape on the mechanical properties of polymer nanocomposites. J. Chem. Phys. 2012, 137, 214901. [Google Scholar] [CrossRef] [PubMed]
  14. Truong, N.P.; Whittaker, M.R.; Mak, C.W.; Davis, T.P. The importance of nanoparticle shape in cancer drug delivery. Expert Opin. Drug Deliv. 2014, 12, 129–142. [Google Scholar] [CrossRef]
  15. Rodrigues, T.S.; da Silva, A.G.M.; Camargo, P.H.C. Nanocatalysis by noble metal nanoparticles: Controlled synthesis for the optimization and understanding of activities. J. Mater. Chem. A 2019, 7, 5857–5874. [Google Scholar] [CrossRef]
  16. Visalakshan, R.M.; García, L.E.G.; Benzigar, M.R.; Ghazaryan, A.; Simon, J.; Mierczynska-Vasilev, A.; Michl, T.D.; Vinu, A.; Mailänder, V.; Morsbach, S.; et al. The Influence of Nanoparticle Shape on Protein Corona Formation. Small 2020, 16, 2000285. [Google Scholar] [CrossRef]
  17. Rhein, F.; Zhai, O.; Schmid, E.; Nirschl, H. Multidimensional Separation by Magnetic Seeded Filtration: Experimental Studies. Powders 2023, 2, 588–606. [Google Scholar] [CrossRef]
  18. Wilhelm, T.; Sygusch, J.; Furat, O.; Bachmann, K.; Rudolph, M.; Schmidt, V. Parametric Stochastic Modeling of Particle Descriptor Vectors for Studying the Influence of Ultrafine Particle Wettability and Morphology on Flotation-Based Separation Behavior. Powders 2023, 2, 353–371. [Google Scholar] [CrossRef]
  19. Fagan, J.A.; Becker, M.L.; Chun, J.; Nie, P.; Bauer, B.J.; Simpson, J.R.; Hight-Walker, A.; Hobbie, E.K. Centrifugal Length Separation of Carbon Nanotubes. Langmuir 2008, 24, 13880–13889. [Google Scholar] [CrossRef]
  20. Sun, X.; Tabakman, S.; Seo, W.S.; Zhang, L.; Zhang, G.; Sherlock, S.; Bai, L.; Dai, H. Separation of Nanoparticles in a Density Gradient: FeCo@C and Gold Nanocrystals. Angew. Chem. Int. Ed. 2009, 48, 939–942. [Google Scholar] [CrossRef]
  21. Plüisch, C.S.; Bössenecker, B.; Dobler, L.; Wittemann, A. Zonal rotor centrifugation revisited: New horizons in sorting nanoparticles. RSC Adv. 2019, 9, 27549–27559. [Google Scholar] [CrossRef]
  22. Kohsakowski, S.; Seiser, F.; Wiederrecht, J.P.; Reichenberger, S.; Vinnay, T.; Barcikowski, S.; Marzun, G. Effective size separation of laser-generated, surfactant-free nanoparticles by continuous centrifugation. Nanotechnology 2019, 31, 095603. [Google Scholar] [CrossRef] [PubMed]
  23. Spelter, L.E.; Steiwand, A.; Nirschl, H. Processing of dispersions containing fine particles or biological products in tubular bowl centrifuges. Chem. Eng. Sci. 2010, 65, 4173–4181. [Google Scholar] [CrossRef]
  24. Konrath, M.; Brenner, A.K.; Dillner, E.; Nirschl, H. Centrifugal classification of ultrafine particles: Influence of suspension properties and operating parameters on classification sharpness. Sep. Purif. Technol. 2015, 156, 61–70. [Google Scholar] [CrossRef]
  25. Stahl, S.; Spelter, L.E.; Nirschl, H. Investigations on the Separation Efficiency of Tubular Bowl Centrifuges. Chem. Eng. Technol. 2008, 31, 1577–1583. [Google Scholar] [CrossRef]
  26. Konrath, M.; Hackbarth, M.; Nirschl, H. Process monitoring and control for constant separation conditions in centrifugal classification of fine particles. Adv. Powder Technol. 2014, 25, 991–998. [Google Scholar] [CrossRef]
  27. Kadlec, P.; Gabrys, B.; Strandt, S. Data-driven Soft Sensors in the process industry. Comput. Chem. Eng. 2009, 33, 795–814. [Google Scholar] [CrossRef]
  28. Souza, F.A.; Araújo, R.; Mendes, J. Review of soft sensor methods for regression applications. Chemom. Intell. Lab. Syst. 2016, 152, 69–79. [Google Scholar] [CrossRef]
  29. Butler, K.T.; Davies, D.W.; Cartwright, H.; Isayev, O.; Walsh, A. Machine learning for molecular and materials science. Nature 2018, 559, 547–555. [Google Scholar] [CrossRef]
  30. Haiss, W.; Thanh, N.T.K.; Aveyard, J.; Fernig, D.G. Determination of Size and Concentration of Gold Nanoparticles from UV-Vis Spectra. Anal. Chem. 2007, 79, 4215–4221. [Google Scholar] [CrossRef]
  31. Stone, K.A.; Shah, D.; Kim, M.H.; Roberts, N.R.M.; He, Q.P.; Wang, J. A novel soft sensor approach for estimating individual biomass in mixed cultures. Biotechnol. Prog. 2017, 33, 347–354. [Google Scholar] [CrossRef]
  32. Bartosiak, M.; Giersz, J.; Jankowski, K. Analytical monitoring of selenium nanoparticles green synthesis using photochemical vapor generation coupled with MIP-OES and UV–Vis spectrophotometry. Microchem. J. 2019, 145, 1169–1175. [Google Scholar] [CrossRef]
  33. Chen, X.; Wang, J.; Pan, R.; Roth, S.; Förster, S. Insights into Growth Kinetics of Colloidal Gold Nanoparticles: In Situ SAXS and UV–Vis Evaluation. J. Phys. Chem. C 2020, 125, 1087–1095. [Google Scholar] [CrossRef]
  34. Weirauch, L.; Giesler, J.; Pesch, G.R.; Baune, M.; Thöming, J. Highly Permeable, Electrically Switchable Filter for Multidimensional Sorting of Suspended Particles. Powders 2024, 3, 574–593. [Google Scholar] [CrossRef]
  35. Werther, J.; Heinrich, S.; Dosta, M.; Hartge, E.U. The ultimate goal of modeling—Simulation of system and plant performance. Particuology 2011, 9, 320–329. [Google Scholar] [CrossRef]
  36. Dosta, M.; Antonyuk, S.; Hartge, E.U.; Heinrich, S. Parameter Estimation for the Flowsheet Simulation of Solids Processes. Chem. Ing. Tech. 2014, 86, 1073–1079. [Google Scholar] [CrossRef]
  37. Menesklou, P.; Nirschl, H.; Gleiss, M. Dewatering of finely dispersed calcium carbonate-water slurries in decanter centrifuges: About modelling of a dynamic simulation tool. Sep. Purif. Technol. 2020, 251, 117287. [Google Scholar] [CrossRef]
  38. Menesklou, P.; Sinn, T.; Nirschl, H.; Gleiss, M. Scale-Up of Decanter Centrifuges for the Particle Separation and Mechanical Dewatering in the Minerals Processing Industry by Means of a Numerical Process Model. Minerals 2021, 11, 229. [Google Scholar] [CrossRef]
  39. Nirschl, H.; Winkler, M.; Sinn, T.; Menesklou, P. Autonomous Processes in Particle Technology. Chem. Ing. Tech. 2021, 94, 230–239. [Google Scholar] [CrossRef]
  40. Gleiss, M.; Nirschl, H. Dynamic Simulation of Mechanical Fluid Separation in Solid Bowl Centrifuges. In Dynamic Flowsheet Simulation of Solids Processes; Springer International Publishing: Berlin/Heidelberg, Germany, 2020; pp. 237–268. [Google Scholar] [CrossRef]
  41. Schach, E.; Buchmann, M.; Tolosana-Delgado, R.; Leißner, T.; Kern, M.; van den Boogaart, K.G.; Rudolph, M.; Peuker, U.A. Multidimensional characterization of separation processes—Part 1: Introducing kernel methods and entropy in the context of mineral processing using SEM-based image analysis. Miner. Eng. 2019, 137, 78–86. [Google Scholar] [CrossRef]
  42. Buchmann, M.; Schach, E.; Leißner, T.; Kern, M.; Mütze, T.; Rudolph, M.; Peuker, U.A.; Tolosana-Delgado, R. Multidimensional characterization of separation processes—Part 2: Comparability of separation efficiency. Miner. Eng. 2020, 150, 106284. [Google Scholar] [CrossRef]
  43. Frank, U.; Wawra, S.E.; Pflug, L.; Peukert, W. Multidimensional Particle Size Distributions and Their Application to Nonspherical Particle Systems in Two Dimensions. Part. Part. Syst. Charact. 2019, 36, 1800554. [Google Scholar] [CrossRef]
  44. Furat, O.; Leißner, T.; Bachmann, K.; Gutzmer, J.; Peuker, U.; Schmidt, V. Stochastic Modeling of Multidimensional Particle Properties Using Parametric Copulas. Microsc. Microanal. 2019, 25, 720–734. [Google Scholar] [CrossRef] [PubMed]
  45. Furat, O.; Masuhr, M.; Kruis, F.E.; Schmidt, V. Stochastic modeling of classifying aerodynamic lenses for separation of airborne particles by material and size. Adv. Powder Technol. 2020, 31, 2215–2226. [Google Scholar] [CrossRef]
  46. Stokes, G. On the Effect of Internal Friction of Fluids on the Motion of Pendulums. Trans. Camb. Philos. 1851, 9, 8–106. [Google Scholar]
  47. Leith, D. Drag on Nonspherical Objects. Aerosol Sci. Technol. 1987, 6, 153–161. [Google Scholar] [CrossRef]
  48. Trunk, R.; Bretl, C.; Thäter, G.; Nirschl, H.; Dorn, M.; Krause, M.J. A Study on Shape-Dependent Settling of Single Particles with Equal Volume Using Surface Resolved Simulations. Computation 2021, 9, 40. [Google Scholar] [CrossRef]
  49. Ganser, G.H. A rational approach to drag prediction of spherical and nonspherical particles. Powder Technol. 1993, 77, 143–152. [Google Scholar] [CrossRef]
  50. Loth, E. Drag of non-spherical solid particles of regular and irregular shape. Powder Technol. 2008, 182, 342–353. [Google Scholar] [CrossRef]
  51. Oberbeck, A. Ueber stationäre Flüssigkeitsbewegungen mit Berücksichtigung der inneren Reibung. In Journal füR Die Reine und Angewandte Mathematik Band 81; De Gruyter: Berlin, Germany, 1876; pp. 62–80. [Google Scholar] [CrossRef]
  52. Bagheri, G.; Bonadonna, C. On the drag of freely falling non-spherical particles. Powder Technol. 2016, 301, 526–544. [Google Scholar] [CrossRef]
  53. Winkler, M.; Rhein, F.; Nirschl, H.; Gleiss, M. Real-Time Modeling of Volume and Form Dependent Nanoparticle Fractionation in Tubular Centrifuges. Nanomaterials 2022, 12, 3161. [Google Scholar] [CrossRef]
  54. Uttinger, M.J.; Walter, J.; Thajudeen, T.; Wawra, S.E.; Peukert, W. Brownian dynamics simulations of analytical ultracentrifugation experiments exhibiting hydrodynamic and thermodynamic non-ideality. Nanoscale 2017, 9, 17770–17780. [Google Scholar] [CrossRef] [PubMed]
  55. DIN ISO 9276-6:2012-01; Representation of Results of Particle Size Analysis—Part 6: Descriptive and Quantitative Representation of Particle Shape and Morphology. Technical Standard; DIN Deutsches Institut für Normung e. V.: Berlin, Germany, 2012.
  56. Batchelor, G.K. Sedimentation in a dilute dispersion of spheres. J. Fluid Mech. 1972, 52, 245–268. [Google Scholar] [CrossRef]
  57. Mächtle, W.; Börger, L. (Eds.) Analytical Ultracentrifugation of Polymers and Nanoparticles; Springer: Berlin/Heidelberg, Germany, 2006. [Google Scholar] [CrossRef]
  58. Spelter, L.E.; Nirschl, H.; Stickland, A.D.; Scales, P.J. Pseudo two-dimensional modeling of sediment build-up in centrifuges: A compartment approach using compressional rheology. AIChE J. 2013, 59, 3843–3855. [Google Scholar] [CrossRef]
  59. Winkler, M.; Gleiss, M.; Nirschl, H. Soft Sensor Development for Real-Time Process Monitoring of Multidimensional Fractionation in Tubular Centrifuges. Nanomaterials 2021, 11, 1114. [Google Scholar] [CrossRef]
  60. Green, M.D.; Eberl, M.; Landman, K.A. Compressive yield stress of flocculated suspensions: Determination via experiment. AIChE J. 1996, 42, 2308–2318. [Google Scholar] [CrossRef]
  61. Usher, S.P.; Studer, L.J.; Wall, R.C.; Scales, P.J. Characterisation of dewaterability from equilibrium and transient centrifugation test data. Chem. Eng. Sci. 2013, 93, 277–291. [Google Scholar] [CrossRef]
  62. Wasserman, L. All of Statistics; Springer: New York, NY, USA, 2004. [Google Scholar] [CrossRef]
  63. Pitman, J. Probability; Springer: New York, NY, USA, 1993. [Google Scholar] [CrossRef]
  64. Winkler, M.; Sonner, H.; Gleiss, M.; Nirschl, H. Fractionation of ultrafine particles: Evaluation of separation efficiency by UV–vis spectroscopy. Chem. Eng. Sci. 2020, 213, 115374. [Google Scholar] [CrossRef]
  65. Konrath, M.; Gorenflo, J.; Hübner, N.; Nirschl, H. Application of magnetic bearing technology in high-speed centrifugation. Chem. Eng. Sci. 2016, 147, 65–73. [Google Scholar] [CrossRef]
  66. Israelachvili, J.N. Intermolecular and Surface Forces; Elsevier: Amsterdam, The Netherlands; Heidelberg, Germany, 2011. [Google Scholar]
  67. Bohinc, K.; Kralj-Iglič, V.; Iglič, A. Thickness of electrical double layer. Effect of ion size. Electrochim. Acta 2001, 46, 3033–3040. [Google Scholar] [CrossRef]
  68. Borukhov, I.; Andelman, D.; Orland, H. Steric Effects in Electrolytes: A Modified Poisson–Boltzmann Equation. Phys. Rev. Lett. 1997, 79, 435–438. [Google Scholar] [CrossRef]
  69. Rhein, F. Mehrdimensionale Trennung Mit Hilfe Magnetischer Partikel. Ph.D. Thesis, Karlsruher Institut für Technologie (KIT), Karlsruhe, Germany, 2022. [Google Scholar] [CrossRef]
  70. Gleiß, M. Dynamische Simulation der Mechanischen Flüssigkeitsabtrennung in Vollmantelzentrifugen. Ph.D. Thesis, KIT Scientific, Karlsruhe, Germany, 2018. [Google Scholar] [CrossRef]
  71. Gleiss, M.; Hammerich, S.; Kespe, M.; Nirschl, H. Application of the dynamic flow sheet simulation concept to the solid–liquid separation: Separation of stabilized slurries in continuous centrifuges. Chem. Eng. Sci. 2017, 163, 167–178. [Google Scholar] [CrossRef]
  72. Zingg, T. Beitrag zur Schotteranalyse. Ph.D. Thesis, ETH Zurich, Zurich, Switzerland, 1935. [Google Scholar] [CrossRef]
  73. Ditscherlein, R.; Furat, O.; de Langlard, M.; de Souza e Silva, J.M.; Sygusch, J.; Rudolph, M.; Leißner, T.; Schmidt, V.; Peuker, U.A. Multiscale Tomographic Analysis for Micron-Sized Particulate Samples. Microsc. Microanal. 2020, 26, 676–688. [Google Scholar] [CrossRef] [PubMed]
  74. Ditscherlein, R.; Furat, O.; Löwer, E.; Mehnert, R.; Trunk, R.; Leißner, T.; Krause, M.J.; Schmidt, V.; Peuker, U.A. PARROT: A Pilot Study on the Open Access Provision of Particle-Discrete Tomographic Datasets. Microsc. Microanal. 2022, 28, 350–360. [Google Scholar] [CrossRef]
  75. Neumann, S.; Menter, C.; Mahmoud, A.S.; Segets, D.; Rafaja, D. Microstructure characteristics of non-monodisperse quantum dots: On the potential of transmission electron microscopy combined with X-ray diffraction. CrystEngComm 2020, 22, 3644–3655. [Google Scholar] [CrossRef]
  76. He, P.; Mejia, A.F.; Cheng, Z.; Sun, D.; Sue, H.J.; Dinair, D.S.; Marquez, M. Hindrance function for sedimentation and creaming of colloidal disks. Phys. Rev. E 2010, 81, 026310. [Google Scholar] [CrossRef] [PubMed]
  77. Winkler, M. Prozesstechnische Fraktionierung von Nanoskaligen Partikeln in Röhrenzentrifugen. Ph.D. Thesis, Karlsruhe Institut of Technology (KIT), Karlsruhe, Germany, 2023. [Google Scholar] [CrossRef]
Figure 1. Schematic of an arbitrarily shaped particle (left) and its corresponding model particle (right) defined by a mass-equivalent inertia ellipsoid.
Powders 04 00004 g001
Figure 2. Schematic cross-section of a tubular centrifuge rotor highlighting the separation of two particles with different sedimentation coefficients (SCs). The illustration on the right-hand side shows the radius of the pond surface, the wall radius and both critical radii calculated using Equation (8).
Powders 04 00004 g002
Figure 3. Schematic of the upstream of fractionation with a sonifier circuit for deagglomeration (left) and the downstream of fractionation (right). The modules on the downstream side are a soft sensor combining a spectrometer and multiple linear regression (MLR) as well as an optional centrate dilution station. The tubular centrifuge with a centrate pump is shown in the middle of the flow diagram.
Powders 04 00004 g003
Figure 4. Cumulative particle size distributions (PSDs) of the used particle systems measured by an ADC (DC2400, CPS Instruments).
Powders 04 00004 g004
Figure 5. (a) SEM images of PMMA (partially highlighted in blue) and ZnO (partially highlighted in green). (b) SEM images of SiO2 aggregates and agglomerates. (c) Two-dimensional (2D) representation of four nanoparticles as part of the virtual particle system (VP-SiO2).
Powders 04 00004 g005
Figure 6. Schematic of the parametric tubular centrifuge model (TCM). Pictograms visualize essential input and calculated output variables of the dynamic simulation. The adaptive structure of the algorithms allows the processing of 1D, 2D and 3D particle trait distributions (PTDs).
Powders 04 00004 g006
Figure 7. Course of the centrate concentration of PMMA determined by the tubular centrifuge model (TCM) at three different centrifugal numbers and different values for the concentration coefficient w and maximum packing density ϕ mpd of the sediment. Different shades of blue show the corresponding gravimetric measurements and simultaneously map the displayed simulation parameters to the simulated data. A gray shaded area at C = 45,000 shows the influence of the standard deviation of w on the simulated result.
Powders 04 00004 g007
Figure 8. Separation efficiency plotted against separation process time for the density fractionation of PMMA and ZnO. The output of the tubular centrifuge model (TCM), a gravimetric reference at three sampling times and the output of a data-driven soft sensor are compared.
Powders 04 00004 g008
Figure 9. Grade efficiency measured by an analytical disk centrifuge (ADC) compared to the tubular centrifuge model (TCM) calculation for PMMA and ZnO. Three different process conditions, defined by the centrifuge number C, are displayed.
Powders 04 00004 g009
Figure 10. Three-dimensional (3D) illustration of the particle trait distribution (PTD) derived for the virtual model system VP-SiO2.
Powders 04 00004 g010
Figure 11. One-dimensional (1D) marginal particle size distribution (PSD) for the virtual model system VP-SiO2.
Powders 04 00004 g011
Figure 12. Three-dimensional (3D) illustration of the grade efficiency calculated by the tubular centrifuge model (TCM).
Powders 04 00004 g012
Figure 13. Two-dimensional (2D) grade efficiency calculated from the associated marginal distributions of feed and centrate distribution data obtained during form fractionation modeling.
Powders 04 00004 g013
Figure 14. Comparison of the separation results for the virtual particle system (VP-SiO2) and the reference particle system (SiO2) for matching boundary conditions of the simulation.
Powders 04 00004 g014
Table 1. Overview of the feed material parameters and operating conditions for each presented simulation case.
Material ρ s / kg m 3 c F /mg mL−1C/- V ˙ l /mL min−1
Long-term classification (1D, p = 1 )
PMMA11936.1135,000100
6.1740,000
5.8745,000
Short-term density fractionation (1D, p = 2 )
PMMA11931.66330,000100
ZnO56100.61910,000100
Short-term form fractionation (3D, p = 1 )
SiO2220018.3747,000300
Disclaimer/Publisher’s Note: The statements, opinions and data contained in all publications are solely those of the individual author(s) and contributor(s) and not of MDPI and/or the editor(s). MDPI and/or the editor(s) disclaim responsibility for any injury to people or property resulting from any ideas, methods, instructions or products referred to in the content.

