Article

Evaluating Flow Characteristics of Ground and Cut Biomass for Industrial Applications

1
Department of Mechanical Engineering, Embry-Riddle Aeronautical University (ERAU), Daytona Beach, FL 32114, USA
2
Engineering Technical College, Al-Furat Al-Awsat Technical University, Najaf 54001, Iraq
3
College of Arts and Sciences Microscopy, Texas Tech University, Lubbock, TX 79410, USA
*
Author to whom correspondence should be addressed.
Powders 2024, 3(3), 437-459; https://doi.org/10.3390/powders3030024
Submission received: 3 July 2024 / Revised: 27 August 2024 / Accepted: 2 September 2024 / Published: 11 September 2024

Abstract

In recent years, biomass utilization has significantly increased, presenting challenges in its incorporation into various systems. Effective handling requires reliable data on biomass flow properties for designing warehouses and processing equipment. This study investigates the physical properties of ground barley grains, ground oak leaves, ground straw, and cut jute. Barley grains, oak leaves, and straw bales were milled, and jute was cut into 2–3 mm lengths and oven-dried. Particle size distribution, bulk density, Hausner ratio, Carr’s index, moisture content, static angle of repose, and flowability tests and SEM analysis were conducted. The study found that ground barley, having the smallest particle size and highest bulk density, showed superior flow properties due to its rounded particles and clusters, as reflected by a low Hausner ratio. In contrast, jute fibers had a low bulk density and poor flowability, while ground straw exhibited hindered flow due to its larger, more irregular particles. Additionally, the biomass sliding behavior varied with particle size and surface irregularities, with ground barley adhering well to plywood and ground oak leaves adhering well to aluminum. These findings underscore the pivotal roles of particle shape and interparticle forces in determining the biomass flow properties, pointing towards a future where precise environmental control and advanced analytical methods drive innovations in biomass utilization.

1. Introduction

In recent years, the focus on reducing CO2 emissions to combat climate change has increased the interest in using biomass for energy generation. This includes its use in transportation for liquid fuels and electricity production when mixed with coal. Biomass is converted into solid, liquid, and gaseous fuels through biochemical processes like fermentation and thermochemical processes such as torrefaction, gasification, and pyrolysis, with combustion for heat generation being predominant [1]. Optimizing the combustion performance requires a thorough understanding of the biomass powder properties relevant to storage and transportation. Challenges often arise due to the assumption that biomass behaves similarly to cohesive and stable coal [2].
Examining biomass powders is also crucial for composite fabrication. Ground and chemically processed biomasses have become common ingredients in eco-friendly composite manufacturing. This pulverized and treated biomass is blended with resin, and its efficacy is assessed for diverse applications [3,4]. Even minor alterations in its thermophysical properties can significantly impact the characteristics of the resulting reinforced composite [3,4,5]. Therefore, analyzing the physical and chemical properties of the ground biomass powders, including the particle size distribution, bulk density, and moisture content, is imperative to ensure the consistency and quality of these newly developed composite materials. Utilizing environmentally friendly composites not only yields superior performance but also reduces waste and lowers costs [3,4].
Biomass particles exhibit heterogeneity in terms of their size, shape, density, moisture content, and compressibility [6]. These characteristics can vary depending on factors such as the plant species, geographical location, growing conditions, as well as harvesting and storage practices. Efficient biomass conveyance is crucial for operational effectiveness, as inadequate feeding can lead to reduced efficiency. Silo and conveyor selection necessitate the consideration of the density, flowability, and static angle of friction [7]. Consistent and accurate measurement of biomass properties is essential for designing effective bioprocessing operations [8].
Despite the constancy of energy and feedstock demands, biomass availability is subject to seasonal fluctuations [8]. Before utilization, natural fibers undergo rigorous pretreatment and precise characterization processes [9]. The density of biomass and bulk density of stacked fiber biomass significantly impact transportation and storage requirements. Typically, three to four times the volume of dry biomass is needed to match the energy output of coal, necessitating appropriate transportation and fuel handling measures if biomass is sourced from locations distant from its intended use [7].
The storage, transfer, and feeding of biomass particles often cause problems in biobased production sites. Irregular flow in storage units and blockage cause supply uncertainties and production downtime, and this results in economically harmful consequences. Despite industrial awareness of these problems, reliable analysis methods and predictive tests of biomass particle size flow properties are not sufficient [10]. Proper storage silo design is crucial for smooth operations in a production facility. Silos should ensure consistent product flow to the mixer, truck, or other downstream processes. Inadequate silo design can lead to production disruptions, increased workloads, and safety risks [11]. Flow issues like material arching, ratholing, flushing, and segregation are common and difficult to prevent. In Figure 1, common flow problems are depicted. These problems can result in a limited storage capacity, product caking, deterioration, structural instability, and other complications [11]. The two main types of flow are funnel flow, where some material remains stationary, and mass flow, where all the material moves. The cohesive properties of the material, such as arching and ratholing tendencies, influence the design considerations. Achieving mass flow is preferred, requiring the entire silo content to discharge uniformly [11]. Determining the hopper angle for mass flow involves considering the wall friction properties on different surfaces and measuring the bulk density at various pressures. Cone-shaped and wedge-shaped hoppers are common designs [11].

1.1. Applications of Biomass Properties

Understanding biomass properties is essential for promoting sustainable resource utilization and effective environmental management. The particle size, in particular, serves as a critical design parameter for optimizing downstream conversion processes [15]. Woody and herbaceous biomasses exhibit irregular shapes, with some possessing high aspect ratios, such as spine-shaped varieties [15]. Conversely, ground biomass often has more uniform shapes, with aspect ratios closer to one, although this can vary depending on the raw materials. The variation in particle size is significant within woody biomass, while herbaceous crops may include particles with fluffy leaves and stems. These particles are characterized by three dimensions: length, width, and thickness. However, traditional particle size measurement techniques, like sieving, are limited to one dimension, typically measuring only the particle thickness. Consequently, longer pieces may pass through the sieve due to their small thickness, complicating accurate particle size determination. Therefore, the development of precise characterization methods for both the size and shape of biomass particles is imperative for designing effective handling, storage, and processing units. Sieve analysis and digital imaging techniques emerge as the two primary methods for particle size analysis [15].
The bulk density of biomass plays a crucial role in supply logistics, transportation, and storage considerations [15]. Both particle size and bulk density influence the heating and drying rates during combustion. Incorrectly sized fuel can lead to reduced combustion efficiency, as well as potential jamming and damage to the handling equipment [8]. Smaller fuel particles facilitate easier burning and offer finer control over burning rates [8]. Additionally, color serves as a rapid indicator for assessing the fuel quality, including its heating value [15].
The bulk density significantly impacts the burning behavior, as denser particles tend to burn for longer durations [16]. Calculating the bulk density involves determining the ratio of the powder’s mass to the volume of the container it occupies, accounting for the space between particles [17]. The bulk density varies across different forms of biomass, such as chips, logs, pellets, and ground particles [15].
The transportation requirements of raw materials to factories or warehouses directly influences their pricing. However, the non-uniform size and shape of unprocessed biomass, like stems and leaves, can hinder proper feeding into transportation and storage units. Thus, standardizing measurement methods becomes imperative for optimizing the logistics efficiency.
Moisture is an important parameter for the transport of biomass and thermal conversion. The moisture content of solid biomass affects the net calorific value and combustion efficiency [15,16]. Moisture decreases the combustion temperature and the occurrence of polluting smoke emissions [7]. Moisture occurs in the form of extracellular and intracellular water and is largely removed by drying, and this affects the conversion efficiency [17]. Biomass consists of organic material and water. However, large amounts of soil, bark, and other foreign matter can be mixed into the harvested biomass. This affects the amount of wet and dry mass [7]. Dried biomass is preferred for use and storage. This is necessary to minimize mold formation, off-gassing, and heating conditions [15]. When harvested, the wet-basis moisture content of the plants is between 50% and 90%. The material is considered dry if it provides long-term equilibrium with the environment with a water content of 10–15% by mass [7]. Excess dry fuel causes dust problems, equipment fouling, and potential explosion hazards [8].
The Hausner ratio (HR), Carr’s index, and static angle of repose (AoR) are used to express the flowability of powders. Both the Hausner ratio and Carr’s index assume that the compressibility of a solid is related to its flowability [18]. The term “flowable” refers to the ability of a powder to undergo irreversible deformation and exhibit flow behavior when subjected to external energy or force [19]. The biggest disadvantage of the angle of repose, the Hausner ratio, and Carr’s ratio is that they are both experimental and provide only one index, giving limited information about flow properties and arching tendencies [10]. Salehi et al. examined the silo emptying and arching behaviors of wood chips (from beech and pine forest residues) of different sizes. The Hausner ratio of biomass was not considered to be a decisive parameter in estimating biomass flow [10]. Table 1 shows the classification of the flow behaviors of solids under low or non-consolidation stress conditions based on the Hausner ratio, Carr’s index, and angle of repose [18,20,21].
The angle of repose (AoR) is one of the most important features determining the granular material flow behavior, influencing aspects like the fluidity, avalanche potential, and stratification [15]. Several factors impact this angle, including the material’s density, particle surface area, shape, friction coefficient, and cohesiveness [15,17]. Understanding flowability provides insights into phenomena like landslides and stratification [16].
The angle of repose (AoR) is crucial in designing biomass material containers such as silos and hoppers. The angle of friction is essential for designing transport and filling systems for biomass fuel containers, helping to prevent bridging issues during filling and transportation [17]. For example, the dimensions of a belt conveyor used to transport biomass depend on this angle to prevent transport problems [17]. Carr’s classification suggests that AoR values between 40° and 50° indicate fairly poor flow, while values below 35° are more acceptable [11]. Studies by Salahi et al. demonstrated varied AoR values for different biomass types, reflecting their flow characteristics [10]. The particle size, shape, surface roughness, and friction forces between particles all influence the AoR, with smaller particles typically exhibiting greater cohesion [2]. Coarse particles tend to flow more freely due to dominant inertial and gravitational forces, while fine particles experience increased cohesion from interparticle forces like electrostatic and van der Waals forces [2].
Digital imaging techniques offer a solution for capturing 3D images to analyze flow behavior [16]. The wall friction angle, an important physical property, indicates how solid biomass materials will slide on various surfaces, which is crucial for storage and conveyor flow optimization [16].

1.2. Analysis of Existing Research

Several researchers have investigated the flow properties of solid fuels and biomass feedstocks for use in industrial feed systems. Craven et al. [2] studied the effects of interparticle friction using large-scale shear testing equipment. They compared wood pellets, torrefied wood pellets, torrefied wood chips, and ground anthracite grains with fine fuel samples. Their study showed that particle size is the most important factor affecting the flowability of particles. Coarse bulk solid samples flowed more freely than milled and pulverized samples [2]. Wu et al. [16] investigated various types of wood pellets (diameters of 6 mm, 8 mm, 12 mm, and varying lengths), wood chips (0–20 mm, 0–40 mm, and 0–100 mm), and torrefied pellets (diameter of 6 mm). They observed that wood pellets had the best flowability among the tested materials. The high moisture content in wood chips showed that moisture was one of the factors that affected the flowability of wood chips [16].
Some researchers tried to improve the flowability by pretreating biomass. Xu et al. [22] investigated the angle of repose and packing properties of soybean straw, corn straw, rice straw, and rice husk powder and their torrefied powders. They found that the Hausner ratio and the compressibility index cannot always predict the flowability accurately. Their experiments showed that the flowability of biomass powder is improved by the torrefaction pretreatment [22]. The relationship between preprocessing and flowability will depend on the nature of the feedstock. (i.e., amount and structure of lignin, crystallinity, amount of fiber, etc.) Crawford et al. studied how the preprocessing of corn stover particles affected the flow properties of corn stover [6]. They studied the effects of particle size reduction, moisture reduction, and chemical addition processes. Ground, milled (dry and wet), acid-impregnated, and deacetylated corn stover samples were examined. Among these samples, the ground corn stover was found to be the least compressible and most fluid material. In contrast, the deacetylated stover was the most compressible and least fluid [6].
Several researchers investigated the characterization of the flow behavior of biomass feedstocks based on the wear life, uniformity of the mixture, breakage, and flow rate of biomass [23]. If the wear life of the surfaces is important, abrasive wear tests must be performed. If uniformity of particle mixtures is important, segregation tests should be performed. If the sample is fragile and will break into small pieces when sheared, attrition tests should be performed. Permeability testing will help us understand powder filling processes and flow rate limitations. To calculate the hopper’s exit size and other important dimensions of the hopper, it is necessary to perform compressibility, shear, and wall friction tests [23]. Barletta et al. [24] evaluated the implementation of the Jenike procedure in the design of storage units by taking two separate sawdust samples: dry and moist. They compared the measured flow functions and the experimental results of the critical output magnitude for arching states using the Jenike design procedure and found close values for some cases [24]. Salehi et al. [10] conducted various studies to predict the silo discharge and arching behaviors of wood chips in different size fractions of beech and pine forest residues. They found that the equation that gives the regression model that best fits the critical hopper exit size is linearly proportional to the square of the hopper half-opening angle and the angle of repose [10].
In this study, we conducted a comparative analysis of the flow properties of ground oak, ground barley, ground straw, and cut jute fibers, each approximately 2–3 mm in length, as biomass feedstocks. We aimed to assess the flow characteristics of these biomass materials under specific conditions by evaluating both ground and cut samples. Ground samples were chosen to mimic the state of the biomass after mechanical processing, simulating scenarios where the biomass undergoes grinding or milling before further utilization. On the other hand, the cut sample was selected to represent a common form of biomass feedstock, reflecting scenarios where the biomass is processed into shorter lengths for easier handling or incorporation into various applications.
The scientific hypothesis guiding this study is that the physical and flow properties of biomass materials are significantly influenced by their particle size and shape. Despite extensive research on biomass materials, a gap remains in understanding the precise relationship between these properties and their industrial applicability. This study addresses this gap by comparing the flow properties of various biomass materials, including ground oak, ground barley, ground straw, and cut jute fibers. The key question of this study is how the flow properties of different biomass materials vary with the particle shape, bulk density, and interparticle forces. The novelty of this study lies in its detailed analysis of how the particle shape, bulk density, and interparticle forces directly influence flowability, providing crucial insights for optimizing biomass handling systems for energy generation and other applications.

2. Materials and Methods

2.1. Biomass Materials

In this section, the biological properties of biomass materials are described. Understanding the cellular structure, composition, and physiological processes of biomass materials is crucial for optimizing their morphology and flow properties [25,26].
Common barley (Hordeum vulgare) originated in western Asia and northern Africa. This plant is the main ingredient of many liquors and beer. This species has spikelets arranged in a herringbone pattern, with long awns giving the inflorescences a prickly appearance [27,28]. In this study, common barley grains collected from breweries were used, and they were unhulled. Barley grain consists of a large endosperm (80% of the grain), an embryo, and maternal tissues (Figure 2). The endosperm contains aleurone, sub-aleurone, and starchy cells with starch granules and proteins. The embryo is rich in lipids and enzymes.
Dried oak leaves (Quercus virginiana) were collected from a southern live oak tree on the Embry-Riddle Aeronautical University campus. Oak is a tree that grows in southeastern North America. Live oaks shed old leaves when new leaves appear in spring. These leaves are stiff, leathery, and brown [31]. Oak consists of cellulose (45%), hemicellulose (22%), lignin (25%), and tannin (0.8% to 10%) [32]. The anatomy of the oak leaf is given in Figure 3.
Straw is an agricultural byproduct composed of the dry stalks of cereal plants that are left after the removal of grain and chaff (Figure 4). It constitutes approximately half of the total yield by weight of cereal crops like barley, oats, rice, rye, and wheat [35]. The straw that is examined in this study is barley straw. Barley straw is predominantly lignocellulosic, comprising cellulose (37.6%), hemicellulose (34.9%), and lignin (15.8%). Cellulose forms glucose-based fiber chains, while hemicellulose, composed of pentose sugars, binds these fibers together. Barley straw is a common by-product of barley farming worldwide [36]. Barley, a monocot, features collateral vascular bundles containing both the xylem (for water/nutrient transport) and the phloem (for assimilate transport) [37]. The anatomy of straw is given in Figure 4.
Tossa jute (Corchorus olitorius) is a bast fiber known for its long, soft, shiny silky inner fibers (Figure 5) and is derived from blooming plants of the Corchorus species from the Malvaceae family. Jute production is primarily centered in West Bengal, India. The fibers are extracted from the plant’s stem and outer skin through retting and subsequent stripping processes [40]. Jute fiber is a natural bast fiber that comes from the bark of the jute plant. It consists mainly of cellulose (around 58–63%), hemicellulose (20–24%), and lignin (12–15%). In addition, it also contains small amounts of other components like fats, pectin, and aqueous extract [41]. The structure of a jute stem (Figure 5) comprises both xylem and phloem tissues [42].
We recognize that the purchased jute cord in our study is a processed product, having undergone retting, stripping, washing, drying, carding, spinning, twisting, and possibly additional treatments. These processes subject the fibers to compressive and tensile stresses, altering their original state. Despite these alterations, the use of processed jute cord reflects its common application in practical settings. Chong et al. [43] investigated the effects of continuous screw-extrusion steam explosion (CSESE) pretreatment on jute fibers, examining their morphology, composition, thermal properties, and crystallinity. SEM analysis revealed structural changes, including a reduced diameter and increased surface cracks. The contents of hemicellulose and extractives decreased, while those of cellulose and lignin increased, leading to a rise in the crystallinity from 66.31% to 70.19%, as confirmed via XPS. TGA showed a higher initial decomposition temperature, and DMA indicated a slight reduction in the glass transition temperature. Overall, CSESE enhances jute fiber reactivity, making it suitable for chemical modification, biofuels, and various applications [44]. The CSESE pretreatment can significantly influence the flow properties of jute fibers during processing. The reduction in fiber diameter and increased surface cracks could alter the bulk density and flowability of jute fiber materials. The increase in crystallinity enhances the mechanical stability of the fibers [44], potentially reducing issues such as clumping and aggregation during processing. Additionally, the higher initial decomposition temperature indicates improved thermal stability, ensuring consistent flow properties under elevated temperatures [45]. These factors could collectively contribute to the enhanced usability of CSESE-treated jute fibers in various manufacturing processes.
Figure 5. Anatomy of jute stem. (A) Anatomical structures. (B) Transverse section of jute stem. (C) Cross-section of fibers with labeled parts ((A,C) are based on Figures 2.2 and 2.1 from Krishnan et al. [46], and (B) is based on Figure 4.1 from Chand et al. [47]; original sources are referenced for inspiration).
Powders 03 00024 g005
Contamination during transport and handling can introduce industrial residues, altering the properties of biomass; thus, proper handling and storage are crucial [48]. Environmental factors, such as luminosity, temperature, soil nutrients, and humidity, also influence the chemical composition of biomass, leading to variations in different geographic regions [48]. In summary, the chemical composition of biomass is influenced by its type, mixing, transport, handling, geographic location, and contaminants.
The biomass samples were first ground using a Victoria Manual Low Hopper Grain Grinder Model GRN-113, (Victoria, Medellín, Columbia) which is made of cast iron with sanitary double-tin plating to resist stains and corrosion. This type of grinder is designed for manual operation and is commonly used for grinding grains and other biomass materials. The coarseness and fineness of the milling is adjusted using the adjusting screw. All samples were dried at 85 °C for 4 h to eliminate moisture and ensure that the biomass samples were in a consistent dry state. Next, ground barley grains, oak leaves, and straw were run through a common mesh. A sieve designation of 60 OPN was used. This sieve designation has a 1.524 mm (0.06 in) square hole mesh opening. The portion that passed through sieve 60 OPN was used. A jute cord was employed by cutting it into 2–3 mm sections and consolidating all the fibers into a single mass. Due to the unique structural characteristics of the cut jute pieces, initial sieving was not performed using a mesh strainer. The biomass samples are shown in Figure 6.

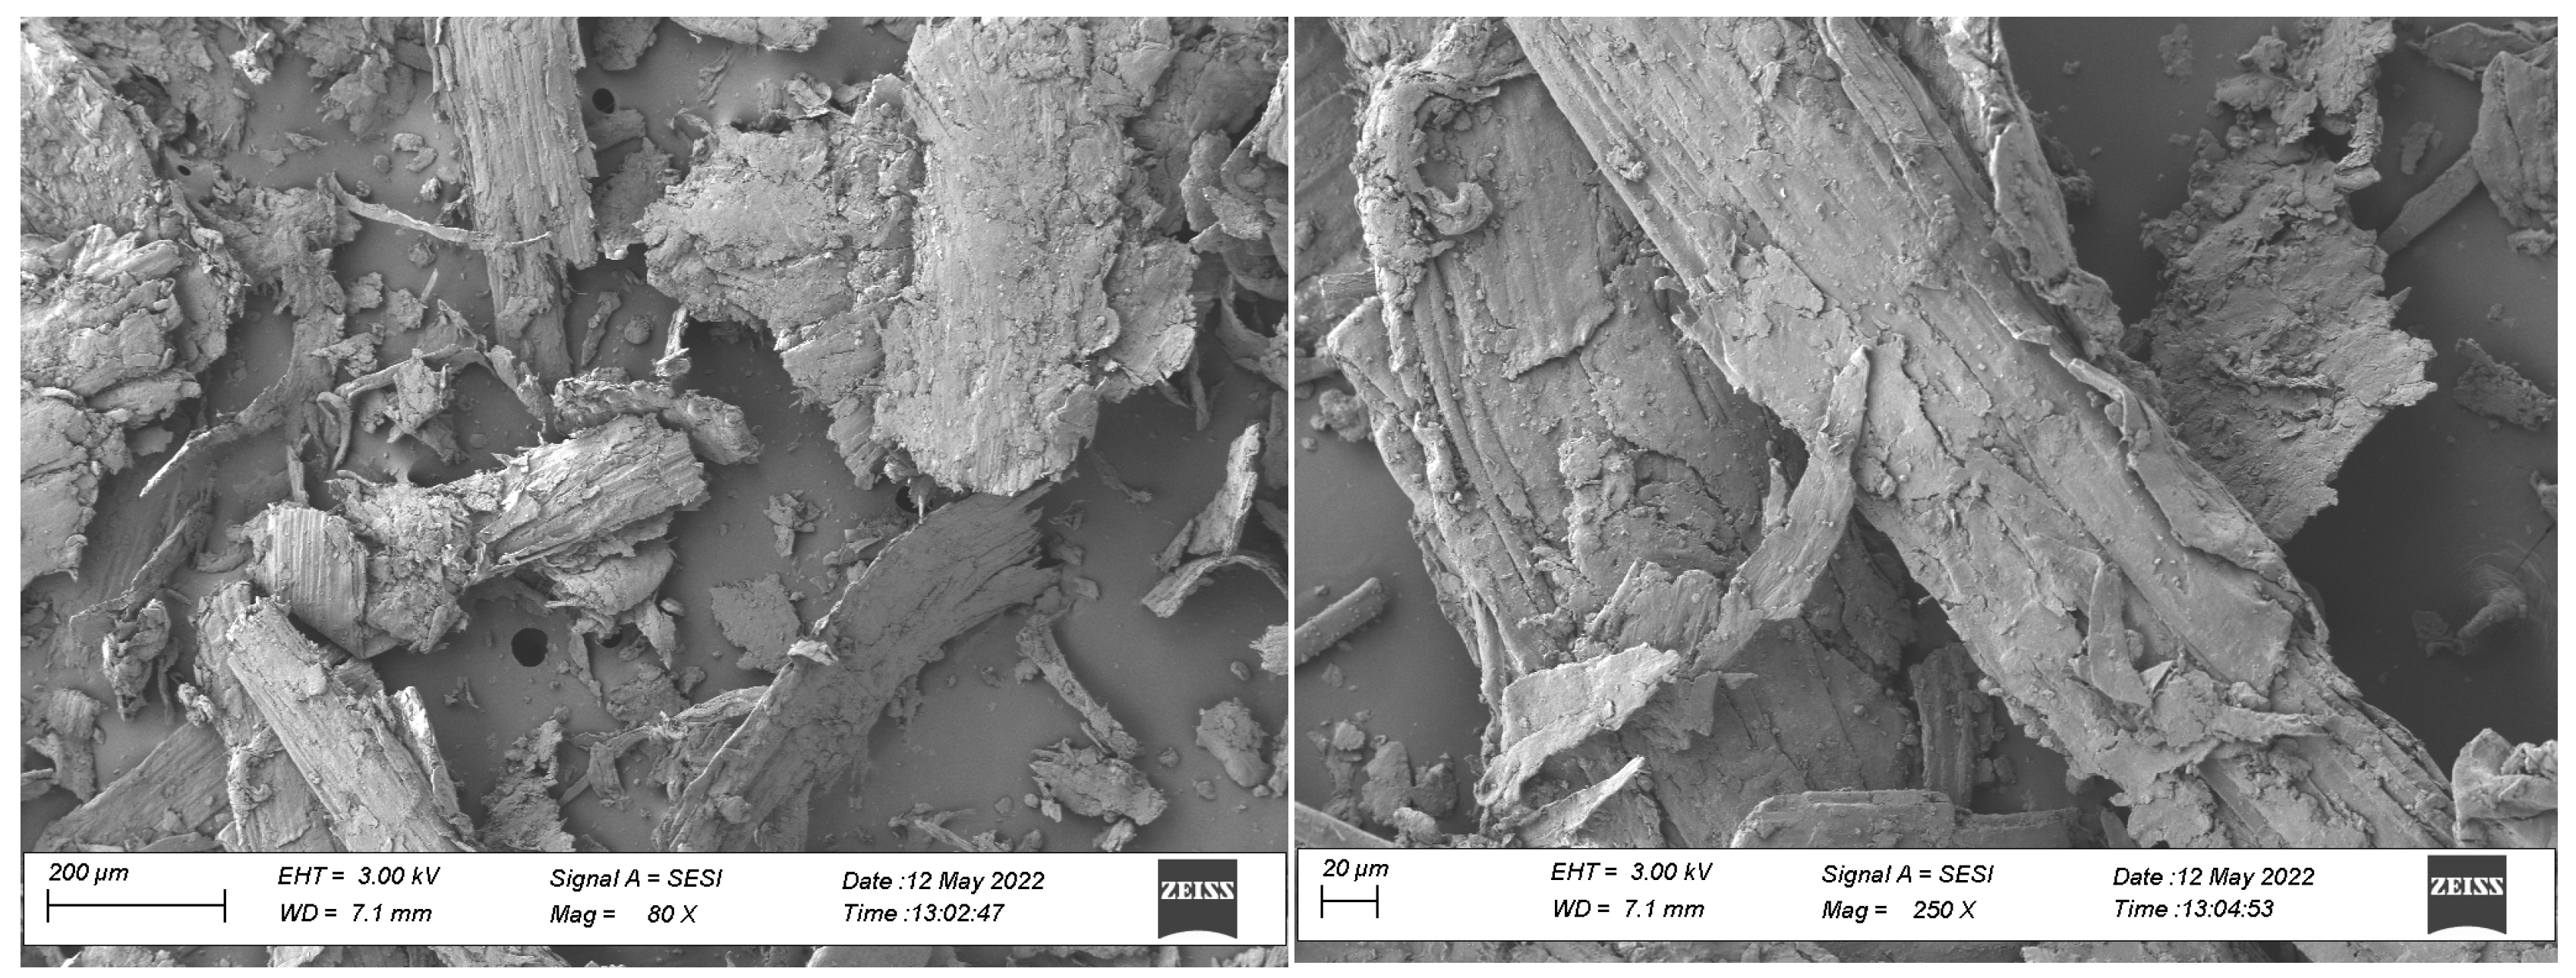
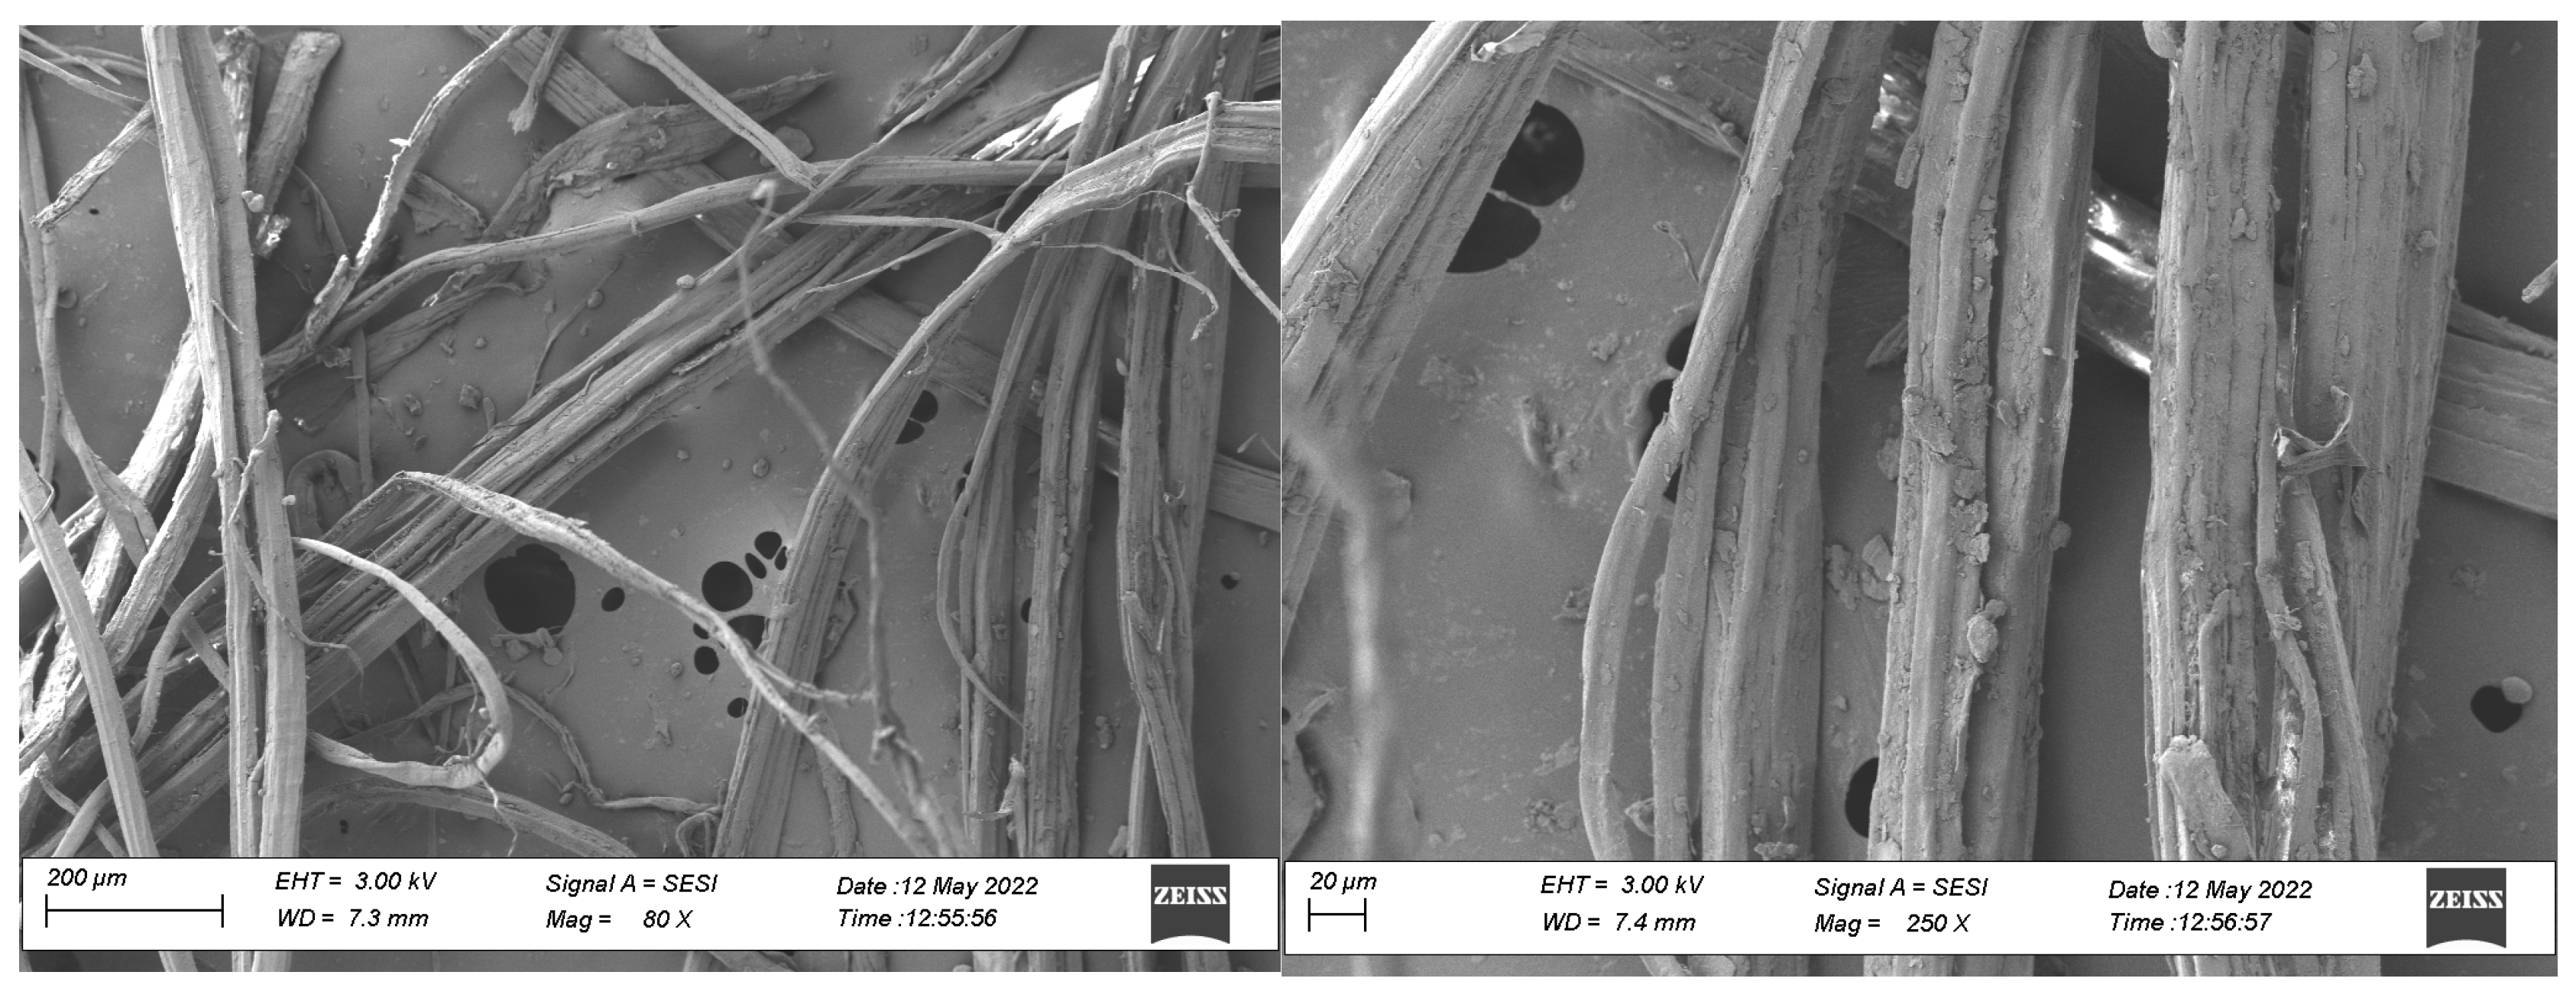
2.2. Scanning Electron Microscopy (SEM)

SEM is a widely employed technique for imaging biomass particles due to its ability to provide high-resolution visualization of their surface morphology and structure. This aids in the comprehensive analysis of biomass, facilitating a better understanding of its physical properties and composition. The biomass samples were mounted onto aluminum sample mounts using double-sided carbon tape, and the loose particles were air-blown away before a 5 nm thin layer of iridium (Ir) was coated onto the samples to provide conductivity. The SEM images were acquired using a Zeiss Crossbeam 540 scanning electron microscope (Carl Zeiss AG, Jena, Germany) equipped with a secondary electron detector. Images were captured at magnifications of ×80, ×250, ×400, and ×1000, with all scans conducted under a 5 kV accelerating voltage.

2.3. Particle Size and Particle Size Distribution (PSD)
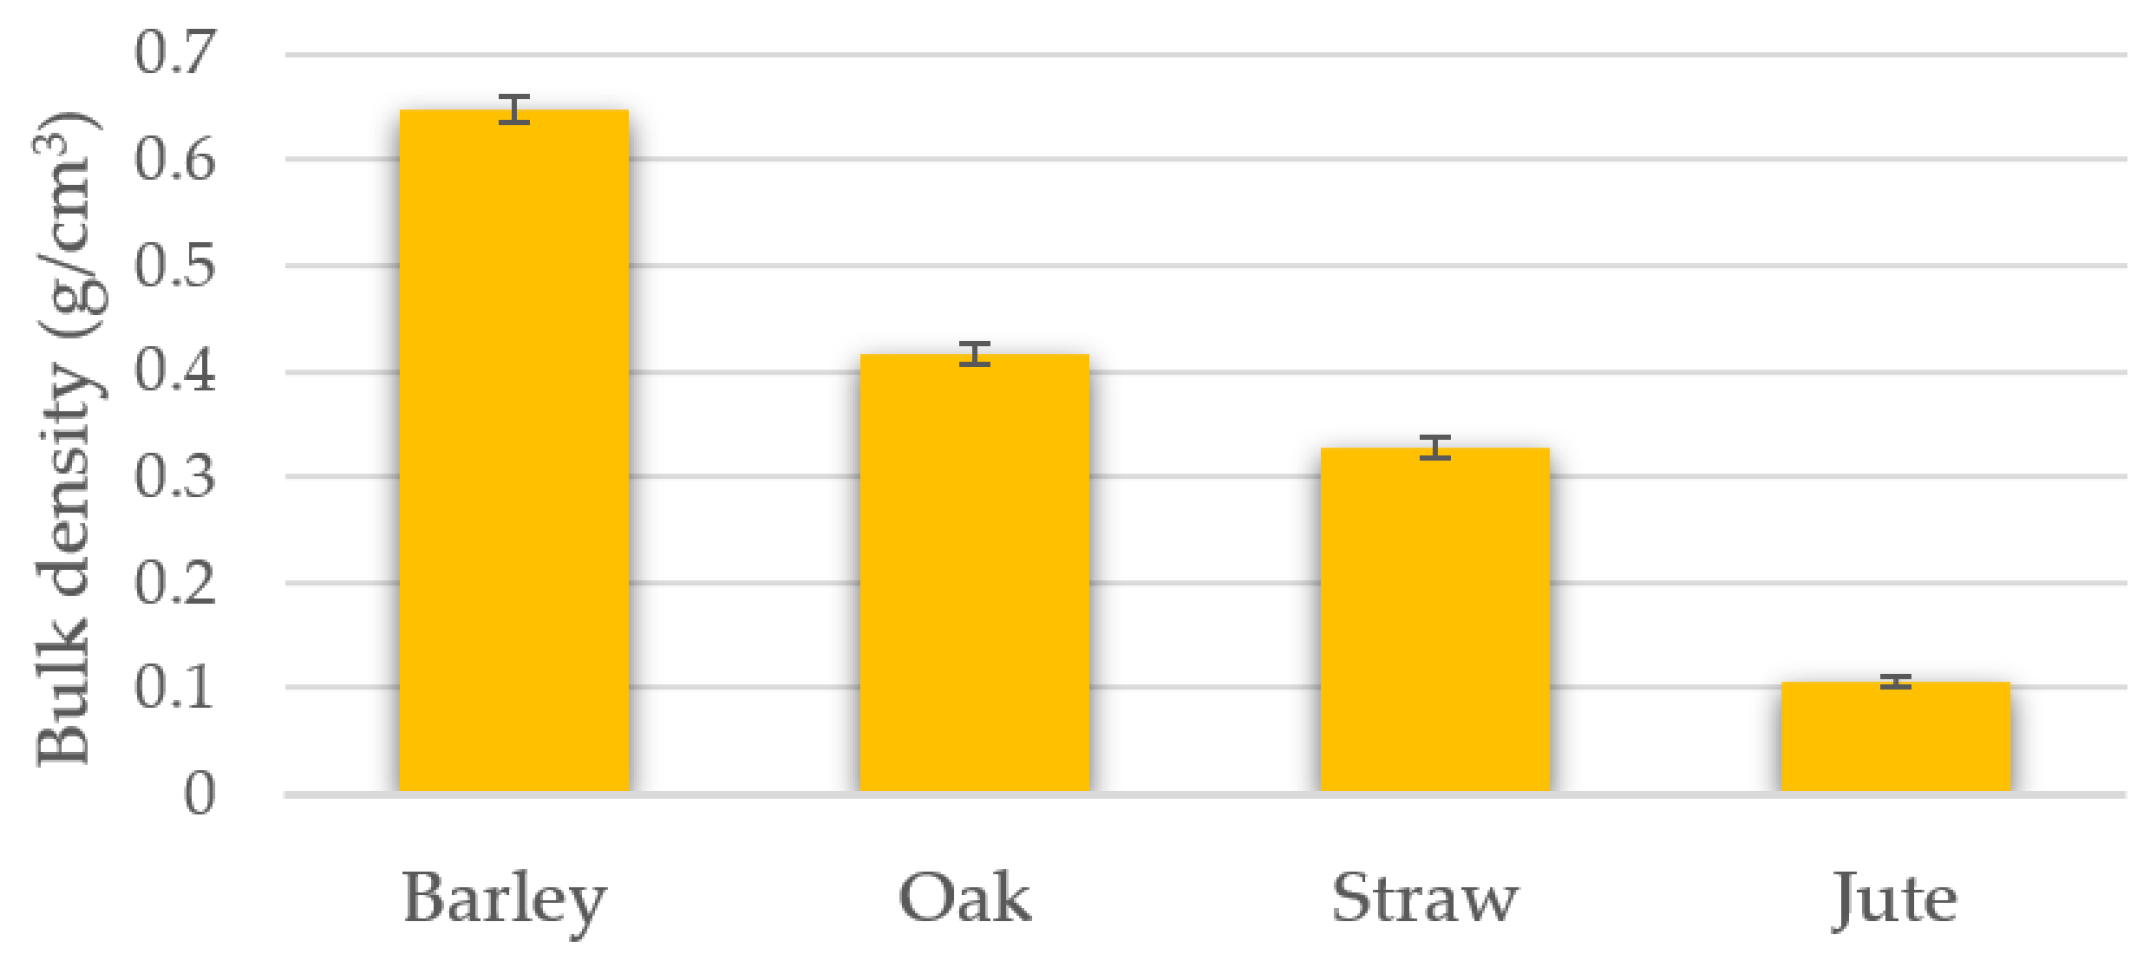
For particle size distribution (PSD) determination, combinations of sieves that were appropriate for the dimensions of the ground biomass samples were employed. A Geotech sand shaker (Geotech Environmental Equipment, Inc., Denver, CO, USA) and mechanical sieve field analysis kit were used for sieve analysis. The Geotech sand shaker is a mechanical sieve kit that is designed for reliable particle size analysis. It has 20 stainless steel screens with US Standard sieve numbers ranging from 4 to 270. Number 4 corresponds to a mesh opening of 4.7498 mm (0.1870 in), and number 270 corresponds to a mesh opening of 0.0533 mm (0.0021 in). The 4.7 cm high and 5 cm diameter cylinders are separated by a foam gasket and stainless steel sieve. The upper surface was opened, and the pre-milled and measured dry biomass was poured from the upper cylinder at environmental conditions of 22.4 °C, 58% relative humidity, and 1016 mbar. The sample was placed into the top of the five cylinders and shaken to distribute the different-sized particles. The percentage of each quantity was collected by different rows, and the size distribution was measured as a percent of the total sample by weight.

2.4. Bulk Density

For determining the bulk density, a TQC Pycnometer (specific density cup, TQC BV, Netherlands) was employed. It is made of an anodized aluminum specific gravity cup, and it has a weight of 61 g and a calibrated volume of 50 mL. The outer cup diameter is 49 mm and 34.2 mm high. It has an outer lid of 52 mm. The density cup has a calibration certificate and complies with ISO 2811, DIN 53 217, and ASTM D 1475 standards.
The density cup was cleansed, and its weight was noted. Biomass was then carefully poured into the density cup, ensuring the cover was placed on without any tilting. Any excess biomass overflowing from the cup was removed, and the filled density cup was subsequently weighed. Each powder was shaken five times to allow settling. Air bubbles were avoided. Additional samples were added, and excess samples were removed from the top edge. The Torbal AGZN analytical balance (Torbal, Inc., Clifton, NJ, USA) that was used for weight measurements has a readability of 0.0001 g, repeatability (standard deviation) of 0.0001 g, and stabilization time of 3 s. The bulk density, ρ (g/cm3), was calculated using Equation (1), where  m b s  is the weight of the density cup and the sample,  m b  is the weight of the density cup, and  V d  is the volume of the density cup.
ρ = ( m b s m b ) / V d
The test was repeated five times, and the average as well as the standard deviation were calculated.

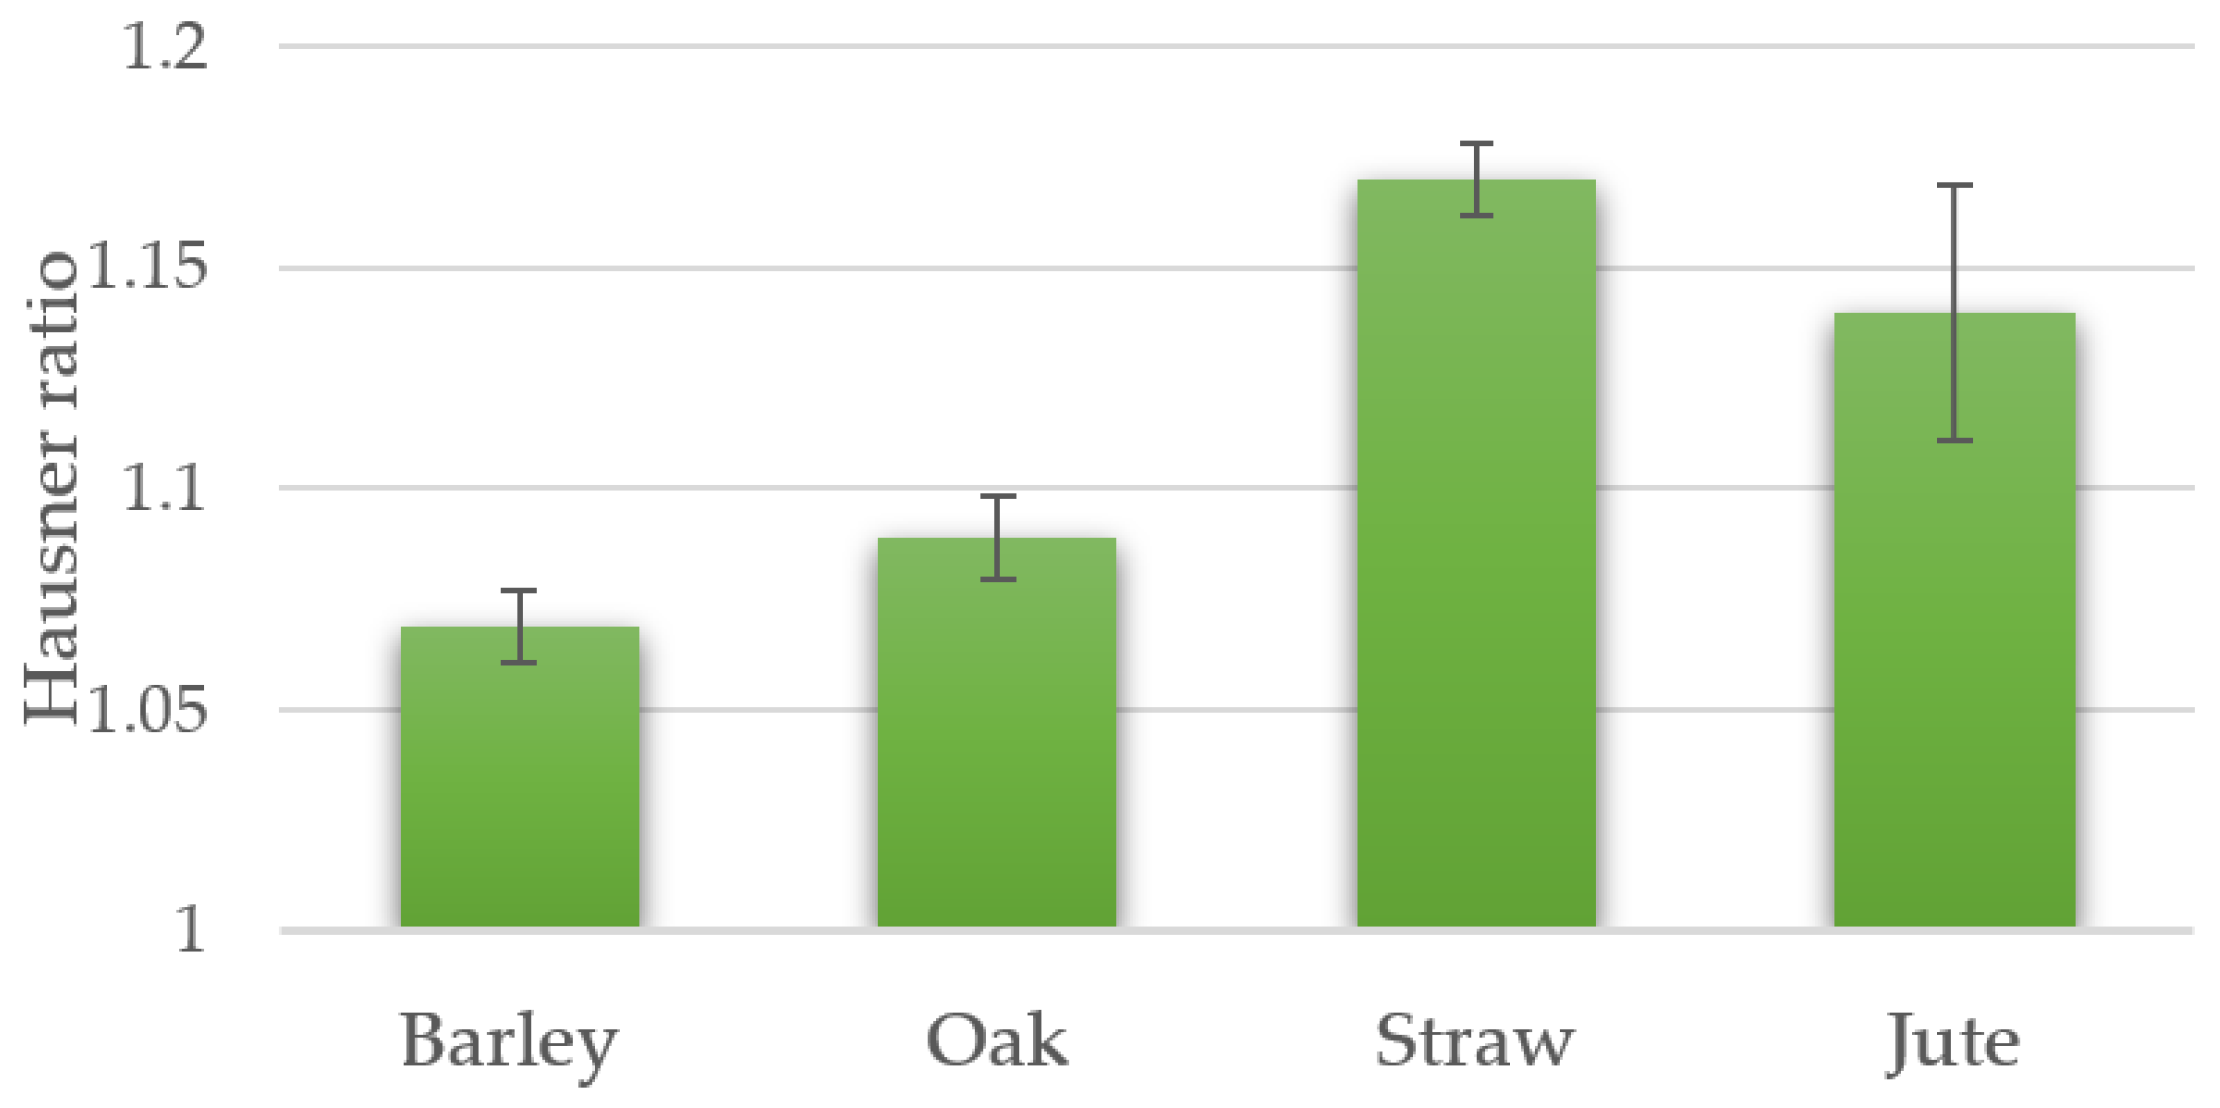
2.5. Hausner Ratio (HR) and Carr’s Index

The particles were filled into a 50 mL TQC Pycnometer (specific density cup, TQC BV, Capelle aan den IJssel, The Netherlands), and the bulk density was recorded. After tapping the Pycnometer five times to settle the particles, additional material was added until it slightly exceeded the top height of the cup. Excess material exceeding the cup’s rim was carefully scraped off to ensure accurate measurement. The density recorded in this way was called the tapped density. The Hausner ratio is given in Equation (2), and Carr’s index is shown in Equation (3).
H R = ρ T / ρ B
C a r r s   i n d e x = 1 ρ B ρ T × 100
where  ρ T  is the tapped density, and  ρ B  is the initial density (i.e., fluffy density).
For repeatability, the experiments were repeated 5 times, and a standard deviation was found and reported. Here, the tapped density will be affected by the vibration movement and the frequency of the acceleration given to the system. Therefore, experiments need to be conducted as close to each other as possible [10].
Tapping causes the particles to come closer to each other, filling the initial gaps and bringing the packaging structure to a more compressed form. A low Hausner ratio (HR) or Carr’s index suggests that the initial bulk density and tapped density are closely aligned, indicating good flowability. Particles with poor flowability are expected to rearrange themselves and make tighter packaging. For example, if the particles have a rougher surface, this indicates that the amount of friction between the particles is high and will prevent the particles from filling the gaps initially but will allow them to fill the gaps when tapped. Therefore, the HR of the powder with poor flowability will be higher [15].

2.6. Moisture Content (MC)

The moisture content (MC) is the amount of water present in the biomass material and is measured as a percentage of the total weight of the biomass, as given in Equation (4). Here,  m i  is the initial weight of the biomass sample, and  m f  is the final constant weight after drying [17].
% M C = m i m f m i × 100 %
The moisture content, MC, was measured using a Manual Relative Humidity Meter (PCE-MA series, PCE Instruments UK Ltd., Southampton, UK). The biomass sample was placed on the sample pan in an evenly thin layer (2–5 mm). It was then placed in the drying chamber of the moisture balance. The result obtained with the device was recorded after three measurements.
In these tests, precise control over temperature and humidity is crucial. It is essential to minimize changes in laboratory conditions. To maintain consistency, the biomass materials were placed in airtight containers and stored in a closed metal locker to prevent fluctuations in humidity.

2.7. Static Angle of Repose (AoR)

The angle of repose is the angle formed when the biomass is poured on the horizontal surface. When granular biomass is poured from the vertical funnel to the horizontal surface, a mound or cone-shaped mound is formed. This angle is the internal angle between the surface of the heap and the horizontal surface (Figure 7). Factors affecting this angle are the density of the material being poured, the surface area of the particle, the shape of the particle, and the friction coefficient and cohesiveness of the particle [15,17]. The AoR is a factor that shows the gravitational forces acting on particles and the friction between particles.
Twenty-five grams of ground biomass was poured slowly from the funnel to the horizontal surface.
The height, H, and radius of the cone, R, were measured, and the static angle of repose, α, was found. As given in Equation (5), α is the angle of repose (degree), H is the height (cm), and R is the radius (cm).
α = t a n 1 H R
The flowability arrangement is shown in Figure 7. The test was performed five times for each biomass sample, and the average along with the standard deviation were calculated, followed by a comparison of the results.

2.8. Angle of Friction (Static Coefficient of Friction)

The angle of friction is a factor that shows the resistance of particles to each other and to slip on the surface they lift. The angle of friction is the angle that occurs when the biomass is lifted horizontally from one side. If the surface is smooth, the biomass will slide from a narrower angle than the rough surface. The angle of friction arrangement is shown in Figure 8. Aluminum, paper, rubber, and plywood surfaces, each measuring 22 cm × 22 cm and of equal size, were utilized in the experiment. Initially, a quantity of twenty-five grams of ground biomass was placed onto the chosen surface. Then, the surface was lifted from one side, and the angle at which the biomass started to slide was recorded.
Equation (6) is used for the determination of the static coefficient of friction. In the equation, µ is the static coefficient of friction, and θ is the inclination angle.
μ = tan ( θ )

3. Results and Discussion

3.1. Color, SEM Images, and Particle Size Distribution (PSD)

The color assessments were conducted through visual observation under consistent lighting conditions. Each sample was examined and compared to its original form to document the changes in hue and lightness. Although the visual assessment method is subjective and less precise than instrumental methods, it provides a qualitative understanding of the color transformations in biomass materials. Figure 6 illustrates barley grains, oak leaves, straw, and jute, both before and after undergoing the grinding process. The barley grain powder emerges as the lightest in color, with oak leaves presenting the darkest shade. Barley grains exhibit a tan hue, while the resulting ground powder has a lighter oat color, suggesting that the internal composition of barley is lighter in color. The outer hull of barley grains, which is exposed to environmental factors like sunlight, dust, and soil, becomes darker, while the interior, which is protected from these elements, retains a lighter color due to its composition of starch and protein [50]. Oak leaves, which are originally dark green due to high chlorophyll concentrations essential for photosynthesis, lighten when ground. As oak leaves dry, chlorophyll breaks down, revealing brown or tan pigments like tannins. The interior tissues, which are less exposed to light and environmental stressors, remain lighter green in fresh leaves and lighter brown in dried leaves [51]. Similarly, straw, which is initially pale yellow, lightens upon grinding. The inner fibers, which are shielded from direct environmental exposure, remain lighter in color due to their composition of cellulose, hemicellulose, and lignin [35]. Jute, with its baked beige tone, maintains color consistency because it is cut rather than ground. The outer layers of jute fibers darken over time due to exposure to air and light, while the inner fibers, which are protected from these elements, retain their natural lighter color. The inner part of the jute stem is composed of cellulose and lignin [52].
Figure 9, Figure 10, Figure 11 and Figure 12 present scanning electron microscope (SEM) images of the biomass samples, revealing distinctive features of each ground material. In the case of ground barley, a diverse array of irregularly shaped particles, including both large and small variants, is evident, exhibiting a predominantly rounded morphology. The observed particles range in size from 5 to 10 μm to a substantial 460 μm in length, forming clusters measuring 170 µm × 100 µm. Additionally, there are pill-like particles with dimensions of 10–20 µm, often accompanied by smaller particles measuring 3–4 µm. Ground oak leaves, on the other hand, showcase star-like particles measuring 140 µm in length and 52 µm in leg span, which are arranged in clusters of 760 µm × 380 µm. Some elongated ground oak leaf particles exceed 900 µm in length and lack the characteristic star shape, suggesting potential organic adherence or mineral deposits manifesting in crystal formations. Jankiewicz et al. [34] investigated the anatomy and surface ultrastructure of galls induced on oak leaves by Neuroterus numismalis and Cynips (Diplolepis) quercusfolii using SEM and LM. They found that N. numismalis galls exhibited external tissues resembling phellem, phellogen, phelloderm, and parenchyma acting as storage tissue, while C. quercusfolii galls showed internal nutritive tissues with globules above larval chambers, potentially affected by larval activity. Older C. quercusfolii galls displayed lignification near the larval chamber and harbored microorganisms, including fungi from the oak phyllosphere. Their study suggested that genetic material transfer and larval secretions could influence gall morphogenesis and nutrient redirection within the host leaf [34]. These findings contribute to our understanding of the biological and ecological interactions between plants and their herbivores, shedding light on adaptation mechanisms and nutrient dynamics within plant tissues.
Ground straw exhibits fibrous-appearing crusty particles with branch-like structures, which are remarkably larger than those found in ground oak leaves. Certain fragments resemble longitudinally fibrous pieces, akin to thin crusts. In the case of cut jute, slender, hair-like particles are observed, ranging in thickness from 20 µm to 67 µm. These straight, hair-like particles of jute measure approximately 1.5 to 2.5 mm in length, with diameters spanning from 20 to 67 µm.
Table 2 presents the PSD percentages of ground oak leaves, barley grain, and straw, respectively. The results from the PSD tests indicate that approximately 94% of the ground barley grain comprises particles smaller than 584.2 µm, while approximately 94% of the ground oak leaves consist of particles smaller than 1016 µm. In the case of straw, approximately 98% of the particles are smaller than 1524 µm. Barley exhibits the smallest particle size among the tested materials, whereas straw possesses the largest particle size. Owing to the unique structural characteristics of cut jute pieces, particle size testing was not conducted using a mesh strainer. This decision is because of the inherent nature of jute particles, characterized by their thin, elongated (hairlike) morphology, making them prone to clustering and impeding their free flow through the mesh.

3.2. Bulk Density

Figure 13 illustrates the bulk density of biomass samples, with the bulk density tests revealing that barley grain exhibits the highest density at 0.647 (g/cm3). In contrast, jute demonstrates a significantly lower bulk density of 0.106 (g/cm3) when compared to other samples. This characteristic is attributed to the hair-like structure of the jute that does not efficiently occupy the vessel space, resulting in a larger volume requirement.
The observed high bulk density serves as an indication of low powder porosity and substantial powder compaction [16]. Particle density also contributes to the overall bulk density of biomass materials, with the expectation that the powder featuring the smallest particle size would yield the highest bulk density [16]. As anticipated, ground barley grain, with its rounded particles, irregular shapes, and observed clusters, does indeed exhibit the highest bulk density. This elevated bulk density, coupled with a low powder porosity, signifies heightened powder compression, influencing factors such as the available water capacity and the movement of air and water through the particles [2].
The SEM images directly correlate with the bulk density, revealing an inverse relationship between the particle size and bulk density. Barley’s distinctive rounded particles, irregular shapes, and observed clusters contribute to it having the highest bulk density value, whereas jute’s slender, elongated particles result in it having the lowest bulk density due to the inadequate filling of gaps between particles.

3.3. Moisture

Figure 14 presents the moisture content of the biomass samples, as determined through moisture content tests, revealing a moisture range of 7.13% to 11.83% in the biomass powders. Ground barley grain demonstrates the lowest moisture content, while jute exhibits the highest.
Particles inherently absorb moisture from the environment, and high humidity conditions can lead to particle agglomeration, thereby increasing the measured particle size. Moreover, humidity induces particle swelling, resulting in larger-than-normal particle sizes. For example, Aviara et al. investigated the physical properties of Guna fruit that are relevant to bulk handling and mechanical processing [52]. The moisture content of the fruit decreased as the storage period increased. The size and volume of the fruit increased with an increase in the amount of moisture. The real and bulk densities of the fruit increased with an increase in the amount of moisture [52]. Gil et al. [53] examined the effects of physical properties such as the moisture content, particle size, and shape of milled poplar and corn stover on their handling behavior. A small particle size improved interparticle displacement. They found that high humidity creates high interparticle friction and a greater tendency to form arches and ratholes, making it more difficult for particles to rearrange, resulting in lower bulk density [53].
The extent of particle swelling, or moisture absorption, varies across different biomass types, and non-uniform moisture distribution within particles can contribute to an increased particle size distribution range. As particles absorb moisture, their weight increases, influencing interparticle attraction or separation, a phenomenon dependent on the specific characteristics of the biomass.
Furthermore, humidity has broader implications, causing changes in its chemical composition, as noted by Kymalien et al. [54]. The presence of moisture can lead to the degradation of components and the formation of mold, which, in turn, releases emissions into the air, showing the negative impact of humidity on biomass properties [54].
According to the Agriculture and Horticulture Development Board (AHDB) [55], grains with a moisture content below 14% are considered dry and do not require additive treatment, allowing for loose storage under cover. Common dry grains include maize, barley, wheat, oats, and triticale. High-moisture grains need to be preserved whole or crimped, and if harvested with more than 14.5% moisture, should be treated with a preservative to prevent spoilage and nutrient loss [55].
We recognize the potential impact of residual moisture in our oven-dried biomass samples. While we assumed the measured moisture levels to be close, variability in the moisture content across samples could influence the outcomes of other measured characteristics. Some studies highlight the importance of optimizing drying temperatures and milling methods for different biomass types. For instance, Jewiarz et al. [56] investigated the grindability of various plant species and found that optimal drying temperatures varied significantly depending on the biomass type. Miscanthus was the easiest to grind, while Fagus was the hardest, with the grindability improving at higher temperatures for Miscanthus and Silphium but decreasing for Pinus. Tumuluru et al. [57] optimized the physical properties of ground biomass by adjusting the moisture content and grinder speed, finding that a higher moisture content and grinder speed improved the bulk and tapped densities. These studies underscore the need to carefully control the drying and grinding parameters to enhance the processing efficiency of biomass materials.
Moisture content impacts the physical properties of grains, affecting their handling, harvesting, drying, storing, grinding, and processing. Understanding fracture characteristics is essential for designing efficient grinding systems and optimizing process parameters. Tavakoli et al. [58] measured the fracture resistance of barley grains by testing the grain rupture force and energy at moisture levels of 7.34%, 12.11%, 16.82%, and 21.58% (dry basis). They found that the force required for grain rupture decreased with a higher moisture content, indicating increased flexibility in the horizontal orientation [58]. The moisture content of our biomass samples ranged from 7.13% to 11.83%, suggesting that moisture may not be significantly affecting the fracture resistance and physical properties of these samples.

3.4. Hausner Ratio (HR) and Carr’s Index

Figure 15 presents the Hausner ratio (HR) results, revealing that ground barley grains exhibit the smallest HR, while ground straw demonstrates the highest HR among the four samples. This outcome suggests that ground straw particles possess heightened roughness and friction compared to ground barley, which, in contrast, exhibits smoother particles with reduced interparticle friction. The larger particle size and irregular shapes of ground straw particles impede flow, contributing to the elevated HR. Jute, characterized by low compaction, displays the highest error bar in its HR test.
A uniform particle size is expected to result in a lower HR, as similar and spherical particles generally exhibit improved flowability. The relationship between flowability and HR is further evident, as poor particle flowability leads to incomplete container filling upon tapping. Consequently, a high bulk density corresponds to a low HR, while a low bulk density results in a higher HR due to loose packing and poor flowability. Particularly, ground barley’s high bulk density aligns with its favorable HR.
Figure 16 presents Carr’s index results, and the results are consistent with the Hausner ratio results. Ground barley’s and oak’s Hausner ratios are between 1.00 and 1.11, which indicates excellent flowability. By the same manner, ground barley’s and oak leaf’s Carr’s indexes are less than 10, which indicates excellent flowability. Ground straw’s and jute’s Hausner ratios are between 1.12 and 1.18; this indicates good flow. In the same manner, ground straw’s and jute’s Carr’s indexes are between 11 and 15, and this indicates good flow (Table 1).
Both the Hausner ratio and Carr’s index are derived from the same density measurements, but they express the data differently. The Hausner ratio is direct, whereas the Carr’s index is a percentage that represents the compressibility of the powder. A lower Carr’s index or Hausner ratio indicates a more flowable material [18]. Performing both tests provides a more comprehensive understanding of a material’s flow properties. While the Hausner ratio can give a quick indication of flowability, Carr’s index can offer additional insight into the compressibility and the potential for caking or segregation during processing [18]. This can be particularly important in industries like pharmaceutics, where the flowability of powders is critical to the manufacturing process [21].
Moisture content introduces another dimension to the HR, as increased moisture leads to stickier, more cohesive particles with diminished flowability, thereby yielding a higher HR. Conversely, lower moisture conditions, as observed in barley, contribute to superior flowability and a lower HR.
The parallel relationship between the HR and angle of repose is evident, where a lower angle of repose signifies improved particle flowability, correlating with a smaller HR. Ground oak leaves, exhibiting a broader mound and the lowest angle of repose, indicate smooth surfaces and reduced friction among non-spherical particles, reinforcing the connection between particle characteristics, flowability, HR results, and Carr’s index.

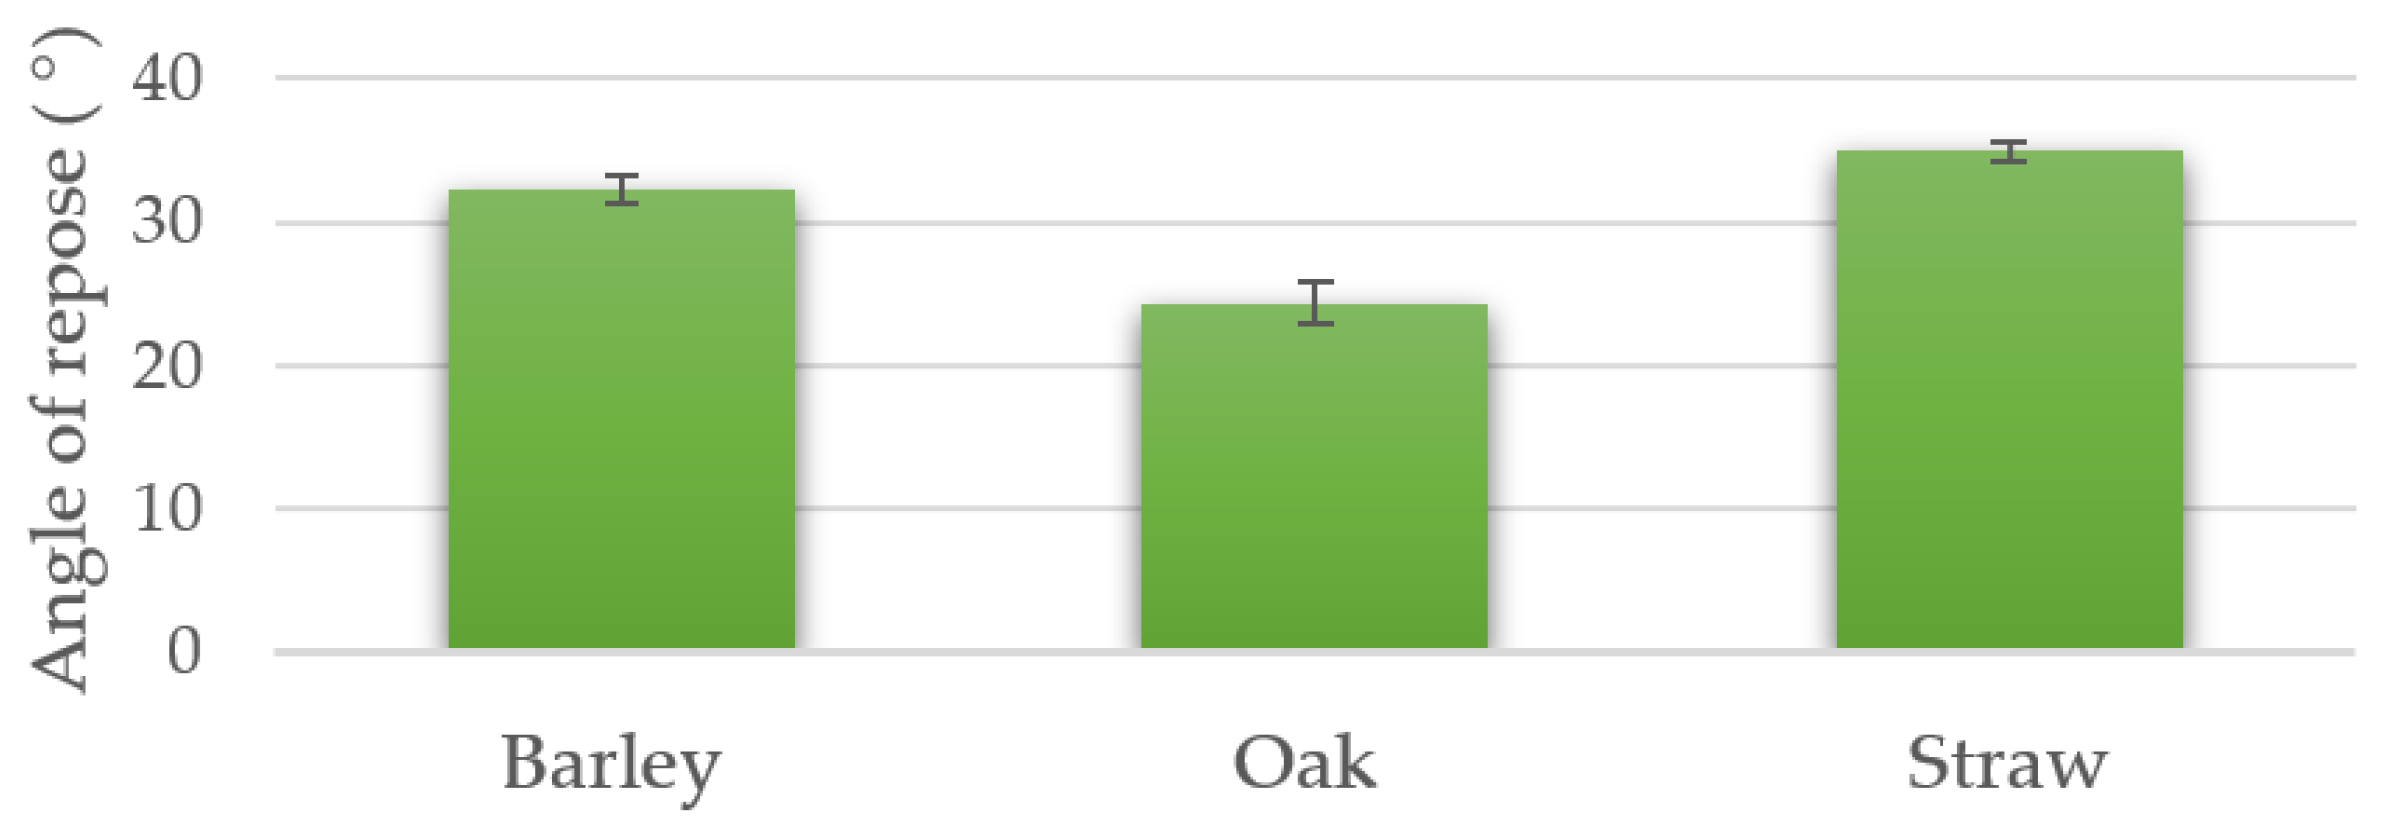
3.5. Static Angle of Repose

Figure 17 presents the static angle of repose results for biomass samples, with differences observed among the different materials. Ground oak leaves form a broader mound with the lowest angle of repose, implying the presence of smooth surfaces and reduced friction among the particles. Conversely, ground straw exhibits a more rugged surface, leading to enhanced interlocking of particles and the formation of a steeper hill, resulting in a higher angle of repose. The static angle of repose for jute was omitted due to its soft nature, as it tends to fall in clusters rather than forming a flat slope surface with a distinct angle.
Jute fibers are soft and flexible, and when poured or piled, they tend to clump together rather than forming a uniform, flat slope. This clustering behavior occurs because the fibers can intertwine and interlock, creating a structure that does not conform to the traditional concept of an angle of repose. In other words, instead of forming a distinct slope with a measurable angle, jute tends to form irregular clusters or mounds. These clusters may have varying densities and shapes, making it difficult to pinpoint a specific angle of repose for the material as a whole. Therefore, the concept of a static angle of repose may not be applicable or meaningful for jute due to its unique behavior when piled or poured.
The results of the Hausner ratio, Carr’s index, and static angle of repose for the biomass feedstock are presented in Table 3 along with their respective evaluations. The experimental outcomes emphasize that particle morphology plays a pivotal role in the observed angle of repose. Particles with more crooked and shapeless characteristics tend to interlock more effectively, creating additional contact points. Despite ground barley’s comparatively rounder particles and smaller particle size, ground oak particles display the lowest static angle of repose. This contradicts the conventional expectation that rounder, smoother particles would exhibit lower angles of repose. The cohesion feature of particles also influences the angle of repose, with increased cohesion observed in straw and barley particles. Surface properties and texture further contribute to these results. Moisture content, known to augment particle cohesion and stickiness, was considered in the analysis. However, the proximity of moisture rates among the particles suggests that moisture may not exert a significant impact on the observed angle of repose.

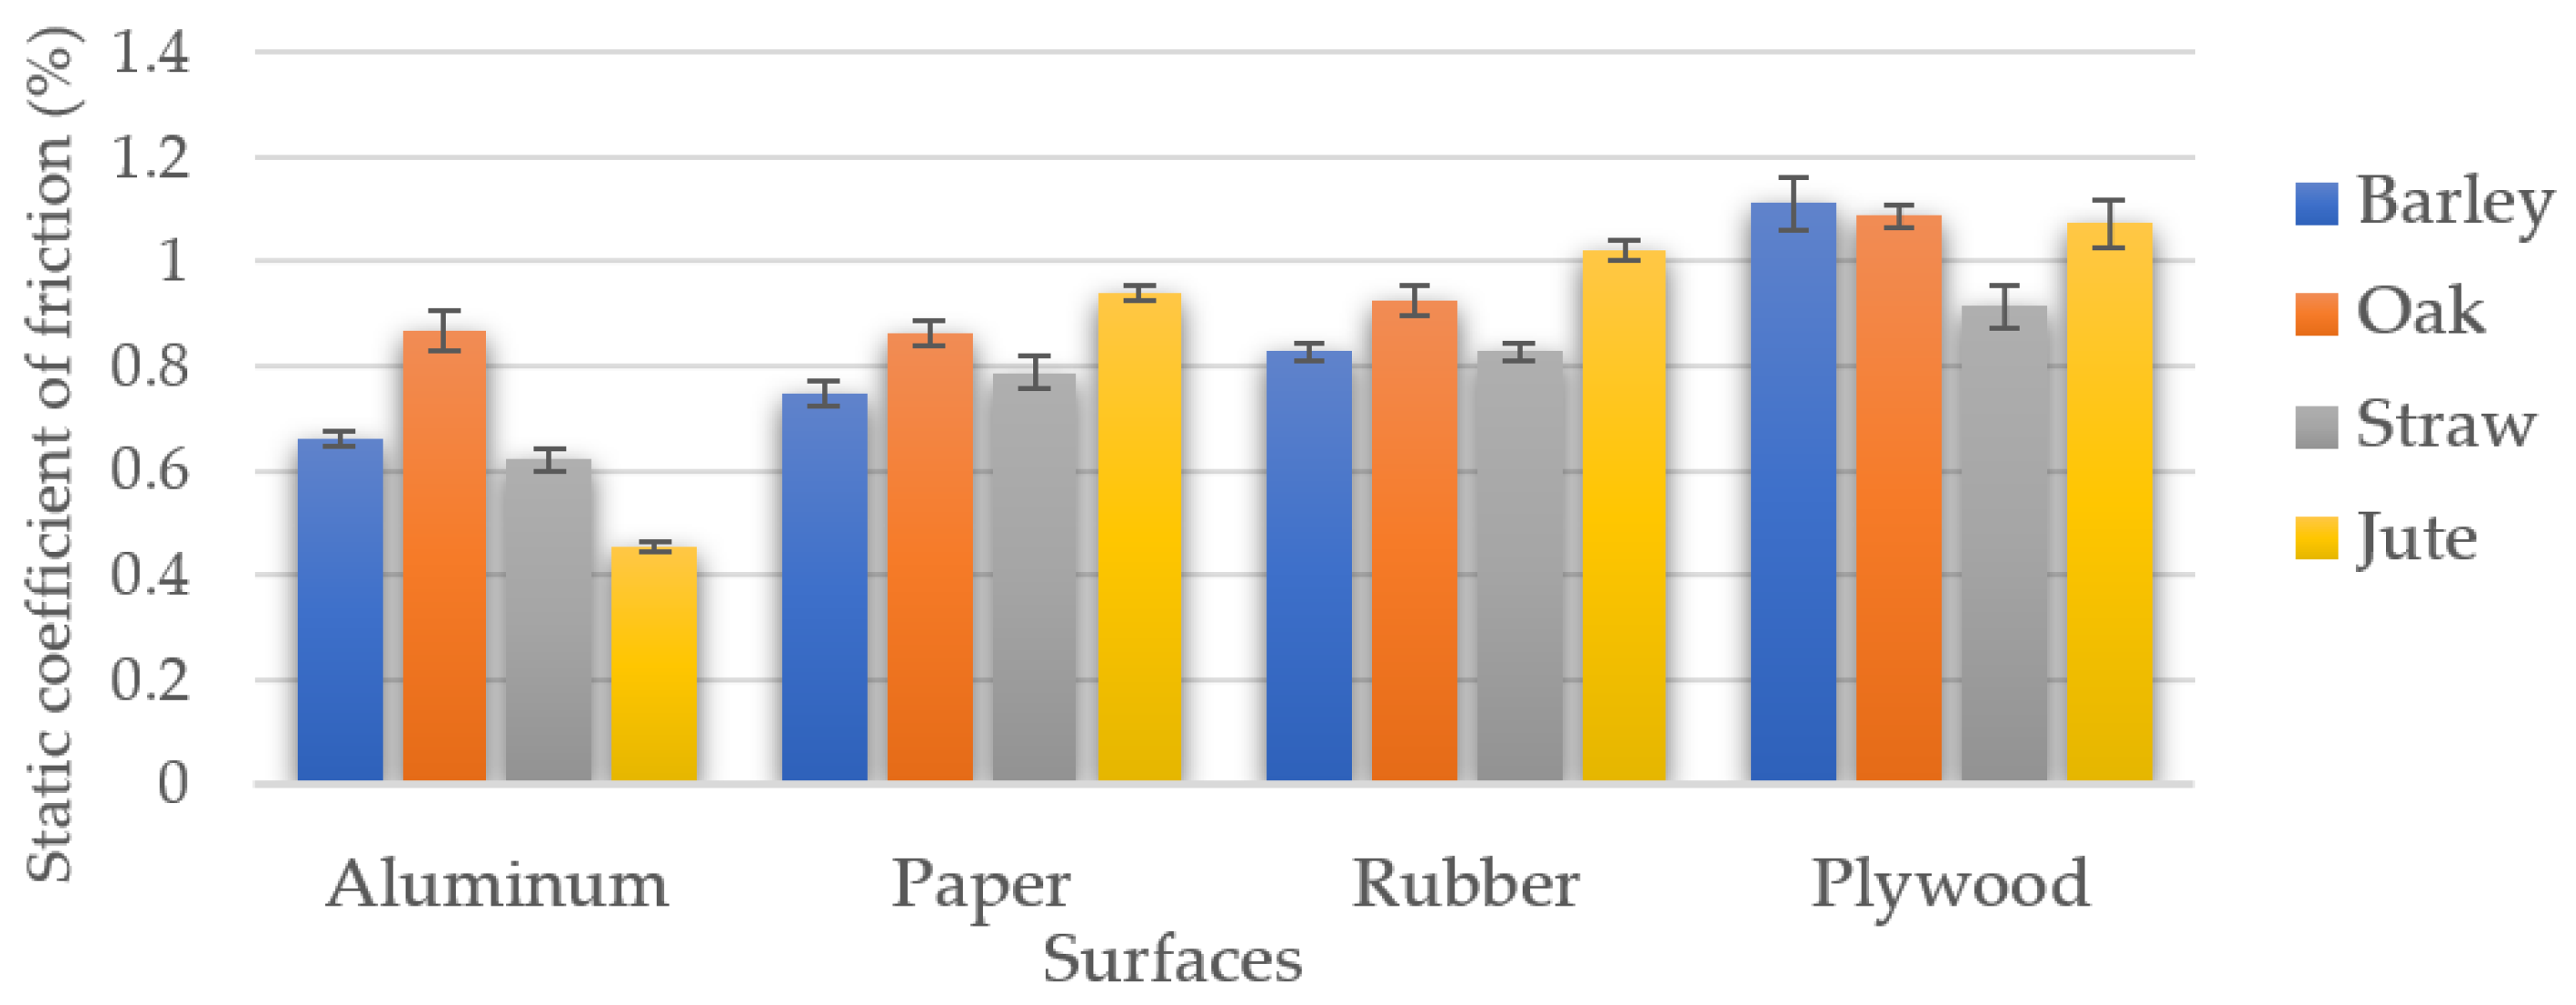
3.6. Static Angle of Friction

Figure 18 illustrates the results of the static coefficient of friction, comparing the sliding surfaces for biomass powders. In wall friction tests, aluminum exhibited the lowest angle, signifying its smoothness, while plywood demonstrated the highest angle, indicating a more rugged surface. The order of ruggedness, from most to least, is plywood–rubber–paper–aluminum. This observation was consistent with the flow behaviors of various samples on all surfaces.
Differential frictional characteristics arise based on the observed particle shape. Flat particles may exhibit shear alone, while voluminous particles may display both shear and rotational friction [16]. These variations result from differences in interparticle forces at the surfaces. The bulk density and flowability of biomass particles are influenced by the particle size and shape [15]. Flowability discrepancies in biomass grinds originate from differences in particle shapes and the forces between particles [15].
Factors such as humidity, particle size, temperature, and storage duration affect flowability. Humidity enhances flowability, making the solid more cohesive as the moisture content increases [11]. The static coefficient of friction increases with moisture due to increased adhesion [59], impacting the wettability and Van der Waals forces between particles [15]. Stasiak et al. [60] investigated the mechanical properties required for design and process control at five different moisture rates for sawdust and woodchips. The increase in the amount of humidity caused the poured and consolidated density to increase. The modulus of elasticity values decreased with increasing humidity. After sawdust exceeded 30% moisture content and woodchips exceeded 20%, the friction coefficients on steel and aluminum surfaces decreased [60]. Mattsson et al. investigated the angle of repose, friction against surfaces, and bridge-building tendencies of various wood fuels (sawdust, fuel pellets, fuel chips, hog fuel, and chunkwood). The angle of static friction ranged from 10° to 40° depending on the surface and increased in the order of coated plywood, urethane rubber, particle board, stainless steel, concrete, and rubber belt conveyor. Bridge formation increased in hooked and long particles and high humidity conditions [61].
Temperature also affects flowability, with higher temperatures causing particle agglomeration. The duration of biomass particles remaining stationary in storage further influences flowability, as solids gain strength when subjected to forces [4]. Ground barley’s round-shaped particles adhere well to plywood, resulting in a high static angle of friction. In contrast, ground straw’s fibrous structure shows less adhesion to plywood, leading to fewer contact points with the surface. Both ground barley and straw exhibit similar angle frictions on rubber, paper, and aluminum surfaces. Ground oak leaves, on the other hand, adhere well to aluminum, indicating increased contact and friction compared to other biomass samples.
The macroscopic property of the angle of friction is influenced by the particle shape. A broader range of particles in a powder sample can interlock more with the surface, yielding a larger angle. However, interlocking on different surfaces displays variations; for instance, oak leaf particles exhibit optimal interlocking on aluminum, jute on paper and rubber, and barley on plywood.
The sliding behavior of biomass on a surface is contingent on the relationship between the particle size and surface indentations and protrusions. If the particle width aligns closely with the surface features, interlocking occurs, resulting in a higher measured static coefficient of friction. Conversely, a significant width disparity prevents interlocking, leading to a lower static coefficient of friction.
Moisture contributes to an increase in the static coefficient of friction by enhancing adhesion [59]. However, it can also render surfaces slippery, causing particles to slide off. The influence of humidity on the static coefficient of friction is indirect, with the powder’s properties, particle size, shape, weight, and the homogeneous distribution of moisture within particles also impacting experimental outcomes.
Computational simulations are essential for linking the micro- and macro-behaviors of granular materials [62,63]. Madrid et al. [63] studied the effect of drop height on the angle of repose of pinewood pellets through experiments and simulations. Their findings revealed that higher friction or rolling friction coefficients lead to an increased angle of repose, and that understanding the rolling friction coefficient is crucial for accurately predicting granular material behavior [63].
By understanding the characteristics of biomass powder, handling, storage, and conversion processes can be improved. This leads to the more sustainable and efficient use of this renewable resource. These results can also give an idea about how biomass powders exhibiting this physical behavior in biomass-reinforced composites will adhere to the resin, how much biomass powder should be added to the resin, and how the amount and physical properties of the biomass materials may change the properties of the composite.
In order to enhance this study further, a wider variety of biomass materials could be studied. This would provide a more comprehensive understanding of biomass materials.

4. Conclusions

This study investigates the physical properties of various biomass materials, which are critical for optimizing processes, developing efficient technologies, and ensuring successful biomass utilization for energy generation and other applications, particularly in silo and conveyor design.
Our experimental analysis showed that ground barley, having the smallest particle size and highest bulk density, exhibited superior flow properties due to its rounded particles and clusters, as indicated by a low Hausner ratio. In contrast, jute fibers had the lowest bulk density and poor flowability due to their slender, elongated shape, resulting in a higher Hausner ratio and Carr’s index. Ground straw also showed impeded flow due to its large, irregular particles.
The study highlights the direct relationship between particle shape, bulk density, and flow properties: a high bulk density correlates with good flowability, whereas loose packing leads to poor flowability. These findings underscore the importance of the particle shape and interparticle forces in determining the biomass flow properties.
The physical properties observed are closely linked to the homogeneity of the humidity levels and environmental conditions within the biomass pile. The particle structure and morphology significantly influence macroscopic behaviors such as the bulk density and flowability. While our study utilized established methods, incorporating advanced imaging and particle analysis could offer more precise characterization and a deeper understanding of biomass behaviors.
The sliding behavior of biomass on surfaces varies with particle size and surface irregularities. Ground barley adhered well to plywood, while ground straw had fewer contact points. Both materials exhibited similar friction angles on rubber, paper, and aluminum surfaces. Ground oak leaves adhered well to aluminum, indicating increased contact and friction.
Given the unique characteristics of jute fibers, traditional methods of static angle of repose testing may not yield meaningful results. Our study demonstrates the effectiveness of using the Hausner Ratio and Carr’s Index to evaluate jute’s flow properties. Future studies could employ image analysis techniques to explore jute’s clustering patterns and flow behavior further.
In summary, this study provides a comprehensive comparison of the flow properties of different biomass materials, offering valuable insights for the design and optimization of biomass handling systems. Future studies should adopt advanced methods to optimize biomass handling and processing for industrial applications, including biofuel production, material handling, storage, and the creation of biomass-reinforced composites.

Author Contributions

Conceptualization, B.D.; methodology, B.D. and H.A.K.S.; software, B.D., H.A.K.S. and B.Z.; validation, B.D., H.A.K.S. and B.Z.; formal analysis, B.D. and H.A.K.S.; investigation, B.D., H.A.K.S. and B.Z.; resources, B.D. and B.Z.; data curation, H.A.K.S. and B.D.; writing—original draft preparation, B.D. and H.A.K.S.; writing—review and editing, B.D.; visualization, H.A.K.S. and B.Z.; supervision, B.D.; project administration, B.D.; funding acquisition, B.D. All authors have read and agreed to the published version of the manuscript.

Funding

This research was supported by Embry-Riddle Aeronautical University. No external funding or grant number is associated with this work.

Institutional Review Board Statement

Not applicable.

Informed Consent Statement

Not applicable.

Data Availability Statement

The data presented in this study are available in this paper.

Acknowledgments

The research was carried out within the Energy Systems Laboratory at ERAU. Special thanks are extended to Michelle Pantoya for facilitating the connection with Bo Zhao at Texas Tech University (TTU) to obtain the scanning electron microscopy (SEM) images.

Conflicts of Interest

The authors declare no conflicts of interest.

References

  1. Ghoniem, A. Energy Conversion Engineering towards Low CO2 Power and Fuels; Printed Book; Cambridge University Press: Cambridge, UK, 2022. [Google Scholar]
  2. Craven, J.M.; Swithenbank, J.; Sharifi, V.N. Investigation into the Flow Properties of Coarse Solid Fuels for Use in Industrial Feed Systems. J. Powder Technol. 2015, 2015, 786063. [Google Scholar] [CrossRef]
  3. Dikici, B.; Motagi, S.; Kantamani, P.; Ayyagari, S.; Al-Haik, M. Thermal conductivity study of biomass reinforced polymer composites. In Proceedings of the SHTC Summer Heat Transfer Conference, Orlando, FL, USA, 13–15 July 2020. [Google Scholar]
  4. Dikici, B.; Motagi, S.; Kantamani, P.; Ayyagari, S.; Villarroel, G.; Al-Haik, M. Processing of agricultural biomass for producing reinforced polymer composites. In Proceedings of the ASME Power Conference and Nuclear Forum, Salt Lake City, UT, USA, 15–18 July 2019. [Google Scholar]
  5. Dikici, B.; Narasimha PR, B.; Kamdar, S.D. Investigation of thermal conductivity variation of biomass products with moisture. In Proceedings of the ASME International Conference on Power Engineering (ICOPE), Charlotte, NC, USA, 26–30 June 2017. [Google Scholar]
  6. Crawford, N.C.; Nagle, N.; Sievers, D.A.; Stickel, J.J. The effects of physical and chemical preprocessing on the flowability of corn stover. Biomass Bioenergy 2016, 85, 126–134. [Google Scholar] [CrossRef]
  7. Twidell, J.; Weir, T. Renewable Energy Resources, Printed Book, 3rd ed.; Routledge: New York, NY, USA, 2015; pp. 365–366. [Google Scholar]
  8. Clean Energy Business Council. (n.d.). Feedstock availability. Clean Energy Business Council. Available online: https://cleanenergybusinesscouncil.com/biomass-energy-glossary/feedstock-availability/ (accessed on 8 August 2024).
  9. Islam, S.; Kovalcik, A.; Hasan, M.; Thakur, V. Natural Fiber Reinforced Polymer Composites. Int. J. Polym. Sci. 2015, 2015, 813568. [Google Scholar] [CrossRef]
  10. Salehi, H.; Poletto, M.; Barletta, D.; Larsson, S.H. Predicting the silo discharge behavior of wood chips—A choice of method. Biomass Bioenergy 2019, 120, 211–218. [Google Scholar] [CrossRef]
  11. Marinelli, J. Industry Insights: ‘Why Is Proper Storage Silo Design Important? Available online: https://www.powderbulksolids.com/storage/why-proper-storage-silo-design-important (accessed on 27 September 2022).
  12. 911 Metallurgist. (n.d.). Bulk Storage Hopper Flow & Feeder. 911 Metallurgist. Available online: https://www.911metallurgist.com/blog/bulk-storage-hopper-flow-feeder (accessed on 4 July 2024).
  13. United States Systems, Inc. (n.d.). Hoppers, Bins, Tanks, Vessels & Silos. United States Systems, Inc. Available online: https://unitedstatessystems.com/hoppers-bins-tanks-vessels-silos/ (accessed on 6 May 2024).
  14. Schulze, D. Storage and Discharge of Bulk Solids. In Production, Handling and Characterization of Particulate Materials; Merkus, H., Meesters, G., Eds.; Particle Technology Series; Springer: Cham, Switzerland, 2016; Volume 25. [Google Scholar] [CrossRef]
  15. Lam, P.S.; Sokhansanj, S. Engineering Properties of Biomass. In Engineering and Science of Biomass Feedstock Production and Provision; Shastri, Y., Hansen, A., Rodríguez, L., Ting, K., Eds.; Springer: New York, NY, USA, 2014. [Google Scholar] [CrossRef]
  16. Wu, M.R.; Schott, D.L.; Lodewijks, G. Physical properties of solid biomass. Biomass Bioenergy 2011, 35, 2093–2105. [Google Scholar] [CrossRef]
  17. Capareda, S. Introduction to Biomass Energy Conversions; CRC Press: Boca Raton, FL, USA, 2014. [Google Scholar]
  18. Powder Process Technology. “Carr Index & Hausner Ratio.” Powder Process Technology. Web. Available online: https://powderprocess.net/Powder_Flow/Carr_Index_Hausner_Ratio.html (accessed on 29 April 2024).
  19. Hadjittofis, E.; Das, S.C.; Zhang, G.G.Z.; Heng, J.Y.Y. ‘Chapter 8- Interfacial Phenomena’, Developing Solid Oral Dosage Forms. In Pharmaceutical Theory and Practice, 2nd ed.; Academic Press: Cambridge, MA, USA, 2017; pp. 225–252. [Google Scholar] [CrossRef]
  20. Schlick-Hasper, E.; Bethke, E.; Vogler, N.; Goedecke, T. Flow properties of powdery or granular filling substances of dangerous goods packagings—Comparison of the measurement of the angle of repose and the determination of the Hausner ratio. Packag. Technol. Sci. 2022, 35, 765–782. [Google Scholar] [CrossRef]
  21. United States Pharmacopeia. “Bulk Density and Tapped Density of Powders <616>.” United States Pharmacopeia. Available online: www.pharmacopeia.cn/v29240/usp29nf24s0_c616.html#google_vignette (accessed on 24 June 2024).
  22. Xu, G.; Li, M.; Lu, P. Experimental investigation on flow properties of different biomass and torrefied biomass powders. Biomass Bioenergy 2019, 122, 63–75. [Google Scholar] [CrossRef]
  23. Cheng, Z.; Leal, J.H.; Hartford, C.E.; Carson, J.W.; Donohoe, B.S.; Craig, D.A.; Xia, Y.; Daniel, R.C.; Ajayi, O.O.; Semelsberger, T.A. Flow behavior characterization of biomass Feedstocks. Powder Technol. 2021, 387, 156–180. [Google Scholar] [CrossRef]
  24. Barletta, D.; Poletto, M. An Assessment on Silo Design Procedures for Granular Woody Biomass. Chem. Eng. Trans. 2013, 32, 2209–2214. [Google Scholar] [CrossRef]
  25. Polo, C.C.; Pereira, L.; Mazzafera, P.; Flores-Borges, D.N.A.; Mayer, J.L.S.; Guizar-Sicairos, M.; Holler, M.; Barsi-Andreeta, M.; Westfahl, H.; Meneau, F. Correlations between lignin content and structural robustness in plants revealed by X-ray ptychography. Sci. Rep. 2020, 10, 6023. [Google Scholar] [CrossRef]
  26. Khodayari, A.; Thielemans, W.; Hirn, U.; Van Vuure, A.W.; Seveno, D. Cellulose-hemicellulose interactions: A nanoscale view. Carbohydr. Polym. 2021, 270, 118364. [Google Scholar] [CrossRef] [PubMed]
  27. Botanical-Online. (n.d.). Barley Characteristics. Botanical-Online. Available online: https://www.botanical-online.com/en/botany/barley-characteristics (accessed on 24 June 2024).
  28. “Hordeum Vulgare (Barley)” Go Botany. Native Plant Trust. Web. Available online: https://gobotany.nativeplanttrust.org/species/hordeum/vulgare/ (accessed on 12 March 2024).
  29. Li, M.; Lopato, S.; Kovalchuk, N.; Langridge, P. Functional Genomics of Seed Development in Cereals. In Cereal Genomics II, 2nd ed.; Langridge, P., Ed.; Springer: Dordrecht, Netherlands, 2013; pp. 215–245. [Google Scholar] [CrossRef]
  30. Gous, P.W. Measurement of Barley (Hordeum Vulgare) Feed Quality Parameters in Sacco and Mapping of Associated Quantitative Trait Loci (QTL) in Cattle. Ph.D. Thesis, University of Southern Queensland, Darling Heights, QLD, Australia, 2009. [Google Scholar]
  31. Plant4Harvest. (n.d.). When do Live oak Trees Lose Their Leaves? Plant4Harvest. Available online: https://plant4harvest.com/when-do-live-oak-trees-lose-their-leaves/ (accessed on 24 June 2024).
  32. Oak Constituents. World Cooperage. Web. Available online: https://www.worldcooperage.com/oak-constituents/#:~:text=The%20four%20main%20constituents%20(aka,%2C%20hemicellulose%2C%20lignin%20and%20tannin (accessed on 12 March 2024).
  33. TreeHugger. (n.d.). Anatomy and Biology of Tree Leaves. Available online: https://www.treehugger.com/anatomy-and-biology-of-tree-leaves-1343507 (accessed on 30 April 2024).
  34. Jankiewicz, L.S.; Dyki, B.; Machlanska, A.; Dubert, F. Oak leaf galls: Neuroterus numismalis and Cynips quercusfolii, their structure and ultrastructure. Acta Soc. Bot. Pol. 2017, 86, 3537. [Google Scholar] [CrossRef]
  35. Fu, Y.; Zhang, J.; Guan, T. High-Value Utilization of Corn Straw: From Waste to Wealth. Sustainability 2023, 15, 14618. [Google Scholar] [CrossRef]
  36. Sun, J.X.; Xu, F.; Sun, X.F.; Xiao, B.; Sun, R.C. Physico-chemical and thermal characterization of cellulose from barley straw. Polym. Degrad. Stab. 2005, 88, 521–531. Available online: https://www.sciencedirect.com/science/article/abs/pii/S0141391005000066?via%3Dihub (accessed on 7 April 2024). [CrossRef]
  37. Mayer, S.; Munz, E.; Hammer, S.; Wagner, S.; Guendel, A.; Rolletschek, H.; Jakob, P.M.; Borisjuk, L.; Neuberger, T. Quantitative monitoring of paramagnetic contrast agents and their allocation in plant tissues via DCE-MRI. Plant Methods 2022, 18, 47. [Google Scholar] [CrossRef] [PubMed] [PubMed Central]
  38. Khan, T.S.; Mubeen, U. Wheat Straw: A Pragmatic Overview. Curr. Res. J. Biol. Sci. 2012, 4, 673–675. [Google Scholar]
  39. Zhang, L.; Larsson, A.; Moldin, A.; Edlund, U. Comparison of lignin distribution, structure, and morphology in wheat straw and wood. Ind. Crops Prod. 2022, 187 Pt B, 115432. [Google Scholar] [CrossRef]
  40. The Knots Manual. (n.d.). Jute Rope. The Knots Manual. Available online: https://www.theknotsmanual.com/rope/types-of-rope/jute/ (accessed on 24 June 2024).
  41. Wang, W.; Cai, Z.; Yu, J. Study on the Chemical Modification Process of Jute Fiber. J. Eng. Fibers Fabr. 2018, 3, 155892500800300203. [Google Scholar] [CrossRef]
  42. Mukul, M.M.; Ahmed, S.S.U.; Akter, N.; Mostofa, M.G.; Rahman, M.S.; Talukder, F.U. Responses of seed germination, seedling growth under salinity stresses, and variability for phenotypic traits in Tossa Jute (Corchorus olitorius L.). Plant Sci. Today 2021, 8, 166–180. [Google Scholar] [CrossRef]
  43. Chong, L.; Zhiyuan, S.; Hongzhen, F.; Chen, C.; Junjie, L.; Qiao, L.; Jianhui, D.; Huazheng, C.; Hongmei, W.; Hongbo, L.; et al. Effect of a promising CSESE pretreatment on the morphological structure and properties of jute fibers. E3S Web Conf. 2021, 252, 02049. [Google Scholar] [CrossRef]
  44. Song, F.; Wang, Q.; Wang, T. The effects of crystallinity on the mechanical properties and the limiting PV (pressure×velocity) value of PTFE. Tribol. Int. 2016, 93 Pt A, 1–10. [Google Scholar] [CrossRef]
  45. Izdebska, J. Aging and degradation of printed materials. In Printing on Polymers; Izdebska, J., Thomas, S., Eds.; William Andrew Publishing: Norwich, NY, USA, 2016; pp. 353–370. [Google Scholar] [CrossRef]
  46. Krishnan, K.B.; Doraiswamy, I.; Chellamani, K.P. Jute. In Bast and Other Plant Fibres; Franck, R.E., Ed.; Woodhead Publishing Series in Textiles; Woodhead Publishing: Cambridge, UK, 2005; pp. 24–93. ISBN 9781855736849. [Google Scholar] [CrossRef]
  47. Chand, N.; Fahim, M. Jute-reinforced polymer composites. In Tribology of Natural Fiber Polymer Composites, 2nd ed.; Chand, N., Fahim, M., Eds.; Woodhead Publishing Series in Composites Science and Engineering; Woodhead Publishing: Cambridge, UK, 2021; pp. 111–130. ISBN 9780128189832. [Google Scholar] [CrossRef]
  48. Thomas, S.; Hosur, M.; Pasquini, D.; Chirayil, C.J. (Eds.) Handbook of Biomass; Springer Nature: Singapore, 2024; Chapter 13. [Google Scholar] [CrossRef]
  49. Saad, H.A.K. Biomass Characterization and Insulation Optimization Studies. Ph.D. Dissertation, Embry-Riddle Aeronautical University, Daytona Beach, FL, USA, November 2022. Available online: https://commons.erau.edu/edt/695/ (accessed on 3 April 2023).
  50. Evers, A.D.; O’Brien, L.; Blakeney, A.B. Cereal structure and composition. Crop Pasture Sci. 1999, 50, 629–650. [Google Scholar] [CrossRef]
  51. Matile, P. Biochemistry of Indian summer: Physiology of autumnal leaf coloration. Exp. Gerontol. 2000, 35, 145–158. [Google Scholar] [CrossRef] [PubMed]
  52. Aviara, N.A.; Shittu, S.K.; Haque, M.A. Physical properties of guna fruits relevant in bulk handling and mechanical processing. Int. Agrophysics 2007, 21, 7–16. [Google Scholar]
  53. Gil, M.; Schott, D.; Arauzo, I.; Teruel, E. Handling behavior of two milled biomass: SRF poplar and corn stover. Fuel Process. Technol. 2013, 112, 76–85. [Google Scholar] [CrossRef]
  54. Kymalaien, H.R.; Sjoberg, A.M. Flax and hemp fibres as raw materials for thermal insulations. Build. Environ. 2008, 43, 1261–1269. [Google Scholar] [CrossRef]
  55. AHDB. (n.d.). Feeding Cereal Grains to Livestock: Moist vs. Dry Grain. Agriculture and Horticulture Development Board. Available online: https://ahdb.org.uk/knowledge-library/feeding-cereal-grains-to-livestock-moist-vs-dry-grain (accessed on 25 June 2024).
  56. Jewiarz, M.; Wróbel, M.; Mudryk, K.; Szufa, S. Impact of the Drying Temperature and Grinding Technique on Biomass Grindability. Energies 2020, 13, 3392. [Google Scholar] [CrossRef]
  57. Tumuluru, J.S.; Heikkila, D.J. Biomass Grinding Process Optimization Using Response Surface Methodology and a Hybrid Genetic Algorithm. Bioengineering 2019, 6, 12. [Google Scholar] [CrossRef]
  58. Tavakoli, H.; Mohtasebi, S.S.; Rajabipour, A.; Tavakoli, M. Effects of moisture content, loading rate, and grain orientation on fracture resistance of barley grain. Res. Agric. Eng. 2009, 55, 85–93. [Google Scholar] [CrossRef]
  59. Zhang, Y.; Tabil, L.G.; Wang, D. Effect of moisture content, postharvest treatment, and storage time on some properties and quality attributes of red lentil. In Proceedings of the 2008 ASABE Annual International Meeting, Rhode Island Convention Center, Providence, RI, USA, June 29–2 July 2008. [Google Scholar]
  60. Stasiak, M.; Molenda, M.; Banda, M.; Gondek, E. Mechanical Properties of sawdust and woodchips. Fuel 2015, 159, 900–908. [Google Scholar] [CrossRef]
  61. Mattsson, J.E. Basic handling characteristics of wood fuels: Angle of repose, friction against surfaces and tendency to bridge for different assortments. Scand. J. For. Res. 1990, 5, 583–597. [Google Scholar] [CrossRef]
  62. Saad, H.A.K.; Dikici, B.; Villarroel, G.; Divo, E. Characterization methods for biomass materials and optimizing heat transfer by using genetic algorithms. In Proceedings of the 7th Thermal and Fluids Engineering Conference (TFEC), Las Vegas, NV, USA, 15–18 May 2022. [Google Scholar]
  63. Madrid, M.A.; Fuentes, J.M.; Ayuga, F.; Gallego, E. Determination of the Angle of Repose and Coefficient of Rolling Friction for Wood Pellets. Agronomy 2022, 12, 424. [Google Scholar] [CrossRef]
Figure 1. Illustration depicting various examples of silo flow problems. (Figure 1 is based on the figures in [12,13,14]).
Powders 03 00024 g001
Figure 2. Anatomy of barley grain. (A) Transverse and longitudinal sections. (B) Interior sections with labeled parts ((A) is based on Figure 9.1 from Li et al. [29], and (B) is based on Figure 1.1 from Gous [30]; original sources are referenced for inspiration).
Powders 03 00024 g002
Figure 3. Anatomy of oak leaf: (A) anatomical structures (B,C) and cross-sections with labeled parts ((A) is based on a source from Treehugger [33]; (B,C) are based on Figure 4 from Jankiewicz et al. [34]; original sources are referenced for inspiration).
Powders 03 00024 g003
Figure 4. Anatomy of straw. (A) Morphology of straw. (B) Cross-section of the stem. (C) Abaxial view with labeled parts ((A) is based on Figure 1 from Khan et al. [38], (B) is based on Figure 3 from Zhang et al. [39], and (C) is based on Figure 1 from Mayer et al. [37]; original sources are referenced for inspiration).
Powders 03 00024 g004
Figure 6. Barley grains, oak leaves, straw, and jute before and after the grinding process [49], edited.
Powders 03 00024 g006
Figure 7. Flowability arrangement.
Powders 03 00024 g007
Figure 8. The angle of friction arrangement [49], edited.
Powders 03 00024 g008
Figure 9. SEM images of ground barley grains at 250× and 1000× magnifications.
Powders 03 00024 g009
Figure 10. SEM images of ground oak leaves at 80× and 400× magnifications.
Powders 03 00024 g010
Figure 11. SEM images of ground straw at 80× and 250× magnifications.
Powders 03 00024 g011
Figure 12. SEM images of cut jute at 80× and 250× magnifications.
Powders 03 00024 g012
Figure 13. Bulk density of ground/cut biomass samples.
Powders 03 00024 g013
Figure 14. Moisture content of ground/cut biomass samples.
Powders 03 00024 g014
Figure 15. Hausner ratio results of ground/cut biomass samples.
Powders 03 00024 g015
Figure 16. Carr’s index results of ground/cut biomass samples.
Powders 03 00024 g016
Figure 17. Static angle of repose (flowability) results of ground biomass samples.
Powders 03 00024 g017
Figure 18. Static coefficient comparison on various surfaces for different biomass types.
Powders 03 00024 g018
Table 1. Flowability expected based on the Hausner ratio, Carr’s index and angle of repose (constructed using data from [18,20,21]).
FlowabilityHausner Ratio (HR)Carr’s IndexAngle of Repose
Excellent1.00–1.11<1025–30
Good1.12–1.1811–1531–35
Fair1.19–1.2516–2036–40
Passable1.26–1.3421–2541–45
Poor flow1.35–1.4526–3146–55
Very poor flow1.46–1.5932–3756–65
Approximately no flow, very very poor>1.60>38>66
Table 2. PSD weight percentages of biomass materials.
Ground Barley GrainGround Oak LeavesGround Straw
<381 µm25.76 ± 5.08<660.4 µm43.36 ± 3.58<1016 µm20.96 ± 2.93
381 µm–508 µm34.48 ± 4.23660.4 µm–762 µm18.56 ± 0.781016 µm–1168.4 µm21.6 ± 5.00
508 µm–584.2 µm31.94 ± 2.78762 µm–1016 µm31.04 ± 3.131168.4 µm–1295.4 µm24.08 ± 1.04
584.2 µm–660.4 µm6.1 ± 1.101016 µm–1168.4 µm6.32 ± 0.661295.4 µm–1524 µm31.28 ± 6.14
>660.4 µm1.72 ± 0.39>1168.4 µm0.72 ± 0.33>1524 µm2.08 ± 1.00
Table 3. Flow property results and evaluations of biomass feedstock based on Hausner ratio, Carr’s index, and angle of repose.
SampleHausner
Ratio (HR)
Carr’s IndexAngle of Repose (°)Evaluation Based on HR or Carr’s IndexEvaluation Based on Angle of Repose
Barley1.07 ± 0.026.41 ± 1.4432.30 ± 0.94Excellent Good
Oak1.09 ± 0.028.15 ± 1.7724.35 ± 1.45Excellent Excellent
Straw1.17 ± 0.0214.50 ± 1.234.95 ± 0.72Good Good
Jute1.14 ± 0.0612.21 ± 4.3N/AGood N/A
Disclaimer/Publisher’s Note: The statements, opinions and data contained in all publications are solely those of the individual author(s) and contributor(s) and not of MDPI and/or the editor(s). MDPI and/or the editor(s) disclaim responsibility for any injury to people or property resulting from any ideas, methods, instructions or products referred to in the content.

