Article

Application of Multivariate Tromp Functions for Evaluating the Joint Impact of Particle Size, Shape and Wettability on the Separation of Ultrafine Particles via Flotation

1
Helmholtz-Zentrum Dresden-Rossendorf, Helmholtz Institute Freiberg for Resource Technology, 09599 Freiberg, Germany
2
Institute of Stochastics, Ulm University, 89069 Ulm, Germany
*
Authors to whom correspondence should be addressed.
These authors contributed equally to this work.
Powders 2024, 3(3), 338-366; https://doi.org/10.3390/powders3030020
Submission received: 25 January 2024 / Revised: 8 April 2024 / Accepted: 20 May 2024 / Published: 2 July 2024

Abstract

:
Froth flotation predominantly separates particles according to their differences in wettability. However, other particle properties such as size, shape or density significantly influence the separation outcome as well. Froth flotation is most efficient for particles within a size range of about 20–200 μm, but challenges arise for very fine or coarse particles that are accompanied by low recoveries and poor selectivity. While the impact of particle size on the separation behavior in flotation is well known by now, the effect of particle shape is less studied and varies based on the investigated zone (suspension or froth) and separation apparatus used. Beyond these complexities, many particle properties are correlated, making it challenging to analyze the isolated impact of individual properties on the separation behavior. Therefore, a multidimensional perspective on the separation process, considering multiple particle properties, enhances the understanding of their collective influence. In this paper, the two-dimensional case is studied; i.e., a parametric modeling approach is applied to determine bivariate Tromp functions from scanning electron microscopy-based image data of the feed and the separated fractions. With these functions it is possible to characterize the separation behavior of particle systems. Using a model system of ultrafine (<10 μm) particles, consisting of either glass spheres or glass fragments with different wettability states as the floatable fraction and magnetite as the non-floatable fraction, allows for the investigation of the influence of descriptor vectors consisting of size, shape and wettability, on the separation. In this way, the present paper contributes to a better understanding of the complex interplay between certain descriptor vectors for the case of ultrafine particles. Furthermore, it demonstrates the benefits of using multivariate Tromp functions for evaluating separation processes and points out the limitations of SEM-based image measurements by means of mineral liberation analysis (MLA) for the studied particle size fraction.

1. Introduction

Many separation processes are designed focusing on a certain particle property that is the dominating feature for a successful separation; e.g., in flotation, the particles are predominantly separated due to differences in their wettabilities. Particles that are hydrophobic attach to gas bubbles and are recovered through a froth, while hydrophilic particles remain in suspension, whereby specific reagents, such as collectors or depressants, are typically used to selectively adjust the particle wettability of the valuable or gangue material. However, in addition to this dominating separation feature, other particle properties also play an important role for the process outcome. In the case of flotation, apart from wettability, the particle size, shape, density or surface roughness significantly influence the separation. Regarding the particle size, there is a range of around 20– 200   μ m for which the separation by flotation works very efficiently [1,2,3]. However, if the particles are either too fine or too coarse, the recovery as well as the selectivity decline significantly. The challenges of processing very fine particles are their unselective recovery by entrainment (for fine particles of the gangue material), which increases with decreasing particle size, thus reducing the product grade. Additionally, there is a risk of slime coating onto coarser valuable particles, inhibiting their recovery [4,5,6,7,8]. Furthermore, very fine particles have rather slow flotation kinetics because the particle–bubble collision efficiency strongly depends on the particle–bubble size ratio and thus decreases along with decreasing particle size [9]. Coarse particles, on the other hand, have a high probability of colliding with a bubble, but their particle–bubble aggregates are less stable and can detach from the bubble more easily than finer particles, resulting in reduced recoveries [6].
Whereas many studies come to the same conclusion on how the size is affecting the separation by flotation, the influence of the particle shape is not as straightforward. This complexity arises from the zone under investigation, i.e., either the suspension or froth zone. The choice of the separation apparatus, i.e., micro-flotation, mechanical agitator-type froth flotation, column flotation, etc., and the underlying flotation mechanism, whether true flotation or entrainment, further contribute to the variability in how the particle shape affects the separation. Investigations in which the froth zone was more or less not considered showed that the flotation of irregularly shaped particles and/or particles with rough surfaces is accompanied by higher recoveries and faster kinetics than if particles are used that are rather spherical and/or have a smooth surface. This is mainly supposed to be a result of the facilitated rupture of the liquid film between the bubble and an edgy/rough particle, resulting in shorter attachment times and higher attachment probabilities [10,11,12,13,14,15]. Regarding the froth zone, Kursun et al. [16] reported higher recoveries for particles that were elongated and flat than for those that are spherical. On the other hand, Sygusch et al. [17] used a defined particle system with different shapes, and they tested those particles using a combination of mechanical and column flotation and compared the experiments with a benchmark mechanical cell. They showed that the influence of particle shape on the recovery and selectivity varies depending on the apparatus used as well as the wettability of the particles. Studies investigating the impact of particle shape on entrainment also report diverse results. Little et al. [18] and Kupka et al. [19] showed that, for their particle systems, the entrainment increased with increasing particle roundness. However, Wiese et al. [20] and Sygusch et al. [17] reported that, for their cases, the entrainment was more pronounced for elongated particles and fragments, respectively.
Although the wettability is the key separating feature for flotation, its effect on the process is usually only studied with respect to the suspension zone. Here, several studies report that the probability that a particle attaches to a bubble increases with its hydrophobicity. However, if the froth zone is considered, particles that are too hydrophobic induce bubble coalescence, resulting in the destabilization of the froth, i.e., froth collapse reducing the recovery, which is why for flotation, usually particles with a moderate hydrophobicity are favored [17,21,22,23,24]. Furthermore, many of these particle properties interact with each other. For example, the entrainment of particles is not only a function of their size but is also influenced by their mass density (as this affects their settling velocity). Not only the wettability influences the froth characteristics, but also the shape, as several studies have shown that the critical contact angle varies for differently shaped particles [17,25,26,27,28,29,30]. Therefore, adopting a multidimensional view on the separation process, i.e., considering multiple particle properties and descriptors rather than focusing on a single one, allows for a more comprehensive understanding of how these properties collectively influence the separation behavior of particles and at the same time reveals the interplay among these properties.
One way of obtaining such multidimensional information about material streams (e.g., feed, concentrate, tailings) is to use imaging methods. More precisely, SEM-based image analysis, for example, provides information on multiple properties of individual particles, such as size, shape or liberation. Extracting these information enables the computation of descriptor vectors whose components quantify the size, shape and composition of particles. Some examples of such descriptors are the so-called area/volume-equivalent diameter, aspect ratio or volume fractions of minerals [31]. Often, it is impractical to characterize particle systems by large lists of these descriptor vectors. Therefore, typically, univariate probability distributions are derived for characterizing particle systems, which lead to a significant complexity reduction, e.g., the particle size distribution or the distribution of aspect ratios. However, this type of stochastic modeling does not capture possibly correlated descriptors; e.g., small particles might have a tendency to exhibit different aspect ratios than large particles. These dependencies can be captured by means of multivariate probability distributions. This concept also transfers to so-called Tromp functions, which have been used in the literature to characterize separation processes [32,33,34,35,36]. More precisely, a Tromp function can be derived by comparing the probability distributions of descriptors before and after separation [34]. In the univariate case, the Tromp function maps a descriptor of a particle onto its separation probability. However, the separation outcome might depend on multiple descriptors, i.e., on descriptor vectors. This motivates the computation of multivariate Tromp functions derived by comparing multivariate probability distributions of descriptor vectors before and after separation. In Schach et al. [33], a non-parametric method, namely, kernel density estimation, was used to estimate multivariate probability distributions from descriptor vectors in order to derive multivariate Tromp functions. Kernel density estimation has the advantage that it makes minimal assumptions on the distribution. However, the amount of data required to adequately model multivariate probability distributions using kernel density estimation can become unfeasibly large if more than one particle descriptor is considered [37]. An alternative is given by parametric modeling approaches. Just as there are numerous parametric families of probability distributions in the univariate case (e.g., normal distribution, exponential distribution), there are numerous families of parametric multivariate probability distributions. Due to model assumptions, they can be calibrated reasonably well to descriptor vectors, even in higher dimensions. Similar to Wilhelm et al. [32], therefore, a parametric modeling approach is used to obtain the multivariate probability distributions of descriptor vectors from which multivariate Tromp functions are derived. In the present paper, bivariate Tromp functions are considered for the two-dimensional descriptor vectors of area-equivalent diameter and aspect ratio. Building on the study in [32], image measurements are available in this work for all output streams (five concentrates and tailings), eliminating the need for employing the optimization approach considered in [32] to determine bivariate Tromp functions.
Overall, this work contributes to the understanding of ultrafine particle flotation in comparison with previous studies, in particular, the combined effect of particle size, shape and wettability on the particle separation behavior. This is achieved by connecting classical flotation results, including grade, recovery, as well as mass and water pull in flotation-based separation, with the results obtained from analyzing the particle separation behavior with Tromp functions, which are obtained from image measurements acquired before and after separation. Furthermore, in the present paper, the advantages and limitations of the use of bivariate Tromp functions computed from image data are highlighted.

2. Materials and Methods
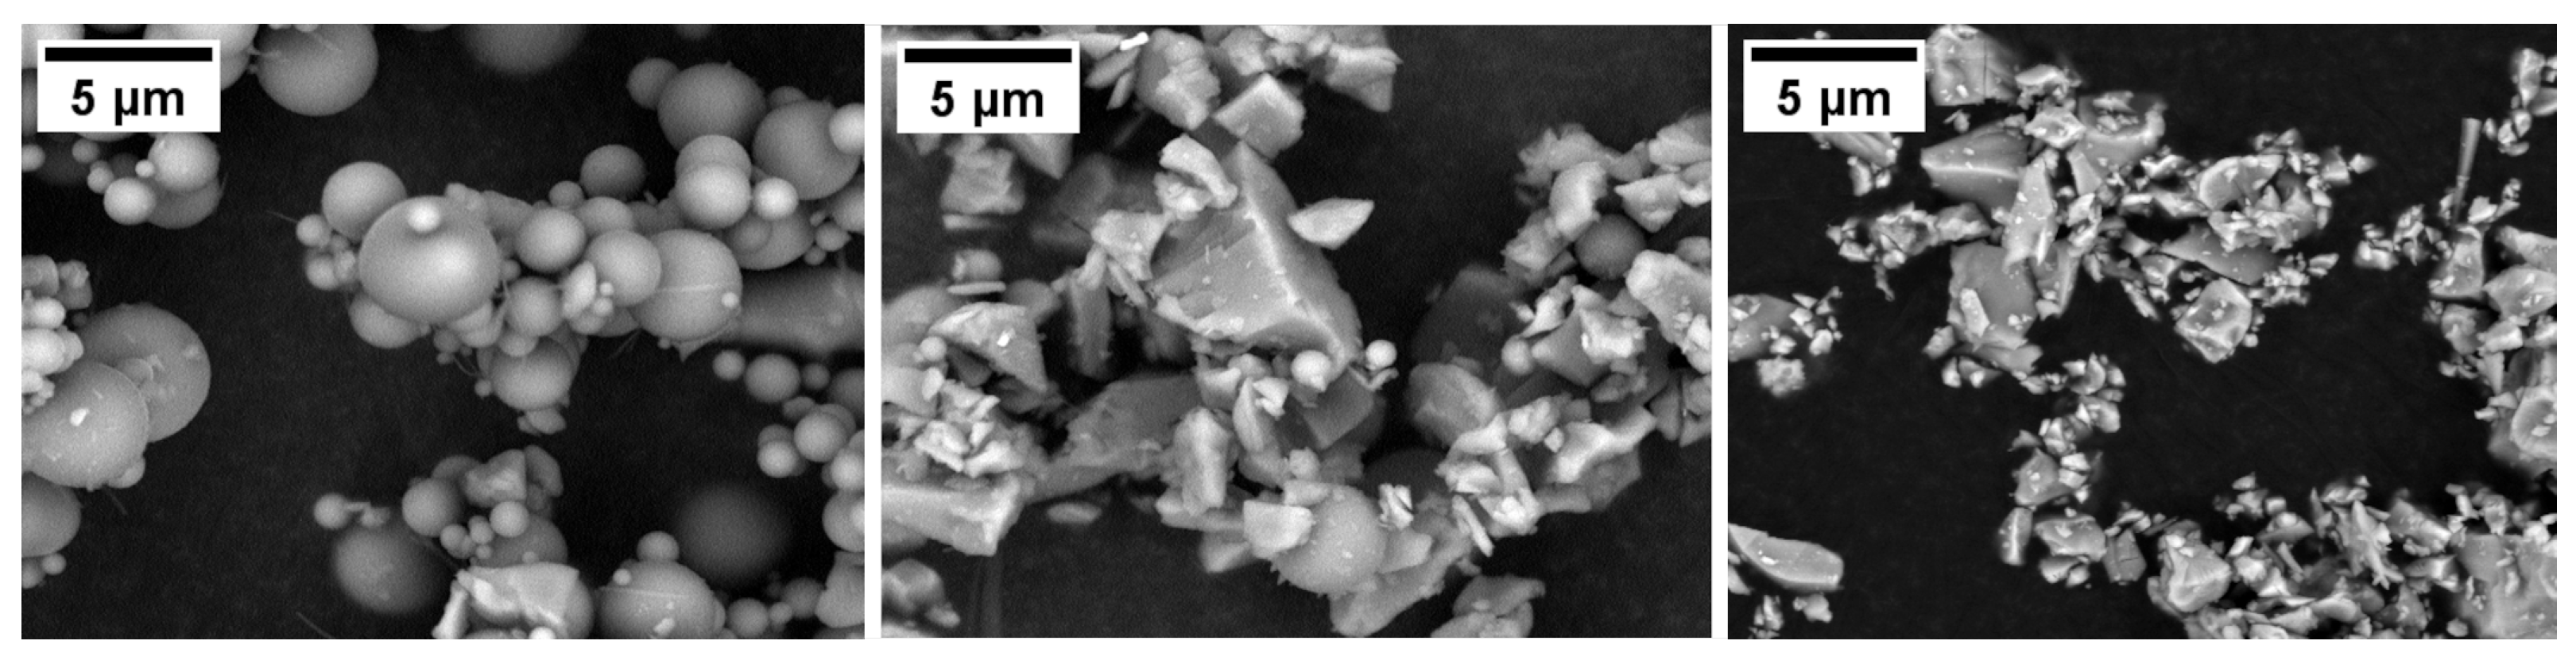
2.1. Materials

The feed material used for the flotation experiments consists of glass particles with different shapes, namely spheres or fragments, as the floatable fraction and magnetite as the non-floatable fraction. Such “model” particle systems are used in order to have better control over the studied particle properties and facilitate the attribution of observed effects. Here, magnetite has been chosen as the non-floatable fraction as the reverse flotation of quartz from magnetite is a common process in the mineral processing industry. Note that glass has been chosen as the floatable fraction instead of quartz as it is available in different shapes and its surface properties can be controlled easily while having the same chemical composition. Ultrafine size fractions of magnetite have been purchased from Kremer Pigmente, Germany, and an analysis via X-ray diffraction confirmed the material’s purity. Any impurity phases are below the detection limit, i.e., approximately 1 wt%. Glass spheres and fragments both consist of soda-lime glass with a SiO2 content of around 73% and have been purchased from VELOX, Germany, as SG7010 and SG3000, respectively. The glass spheres considered in this study have particle sizes below 10   μ m (SG7010). Ultrafine glass fragments are obtained by milling and aero classification of coarser glass spheres (SG3000). Figure 1 shows scanning electron microscope (SEM) images of the glass and magnetite fractions under consideration.
Both glass particle fractions have a mass density of 2500   k g / m 3 with a stationary settling velocity of 8.27 × 10 6   m / s . Magnetite has a mass density of 5200   k g / m 3 and, with 2.31 × 10 5   m / s , a faster settling velocity (the calculation of the settling velocity is based on spherical particles for the Stokes regime valid for laminar flow conditions, which is a valid assumption for fine particles and especially for the fluid flow conditions of the froth phase within the lamella [38]). While the magnetite was used as received, the glass particles underwent an esterification reaction using n-alcohols, which allows for the generation of particle fractions with defined wettability states depending on the alkyl chain length of the alcohol used, as presented in [39]. Three different wettability states of glass particles were used for this study: (i) pristine, unesterified hydrophilic particles; (ii) particles that are hydrophobized using the primary alcohols 1-hexanol ( C 6 , Carl Roth ≥ 98 % , used as received); and (iii) 1-decanol ( C 10 , Carl Roth ≥ 99 % , used as received) resulting in esterified particles with moderate and strong hydrophobicities. Table 1 displays the respective contact angles that increase with increasing hydrophobicity, measured on equally treated glass slides.

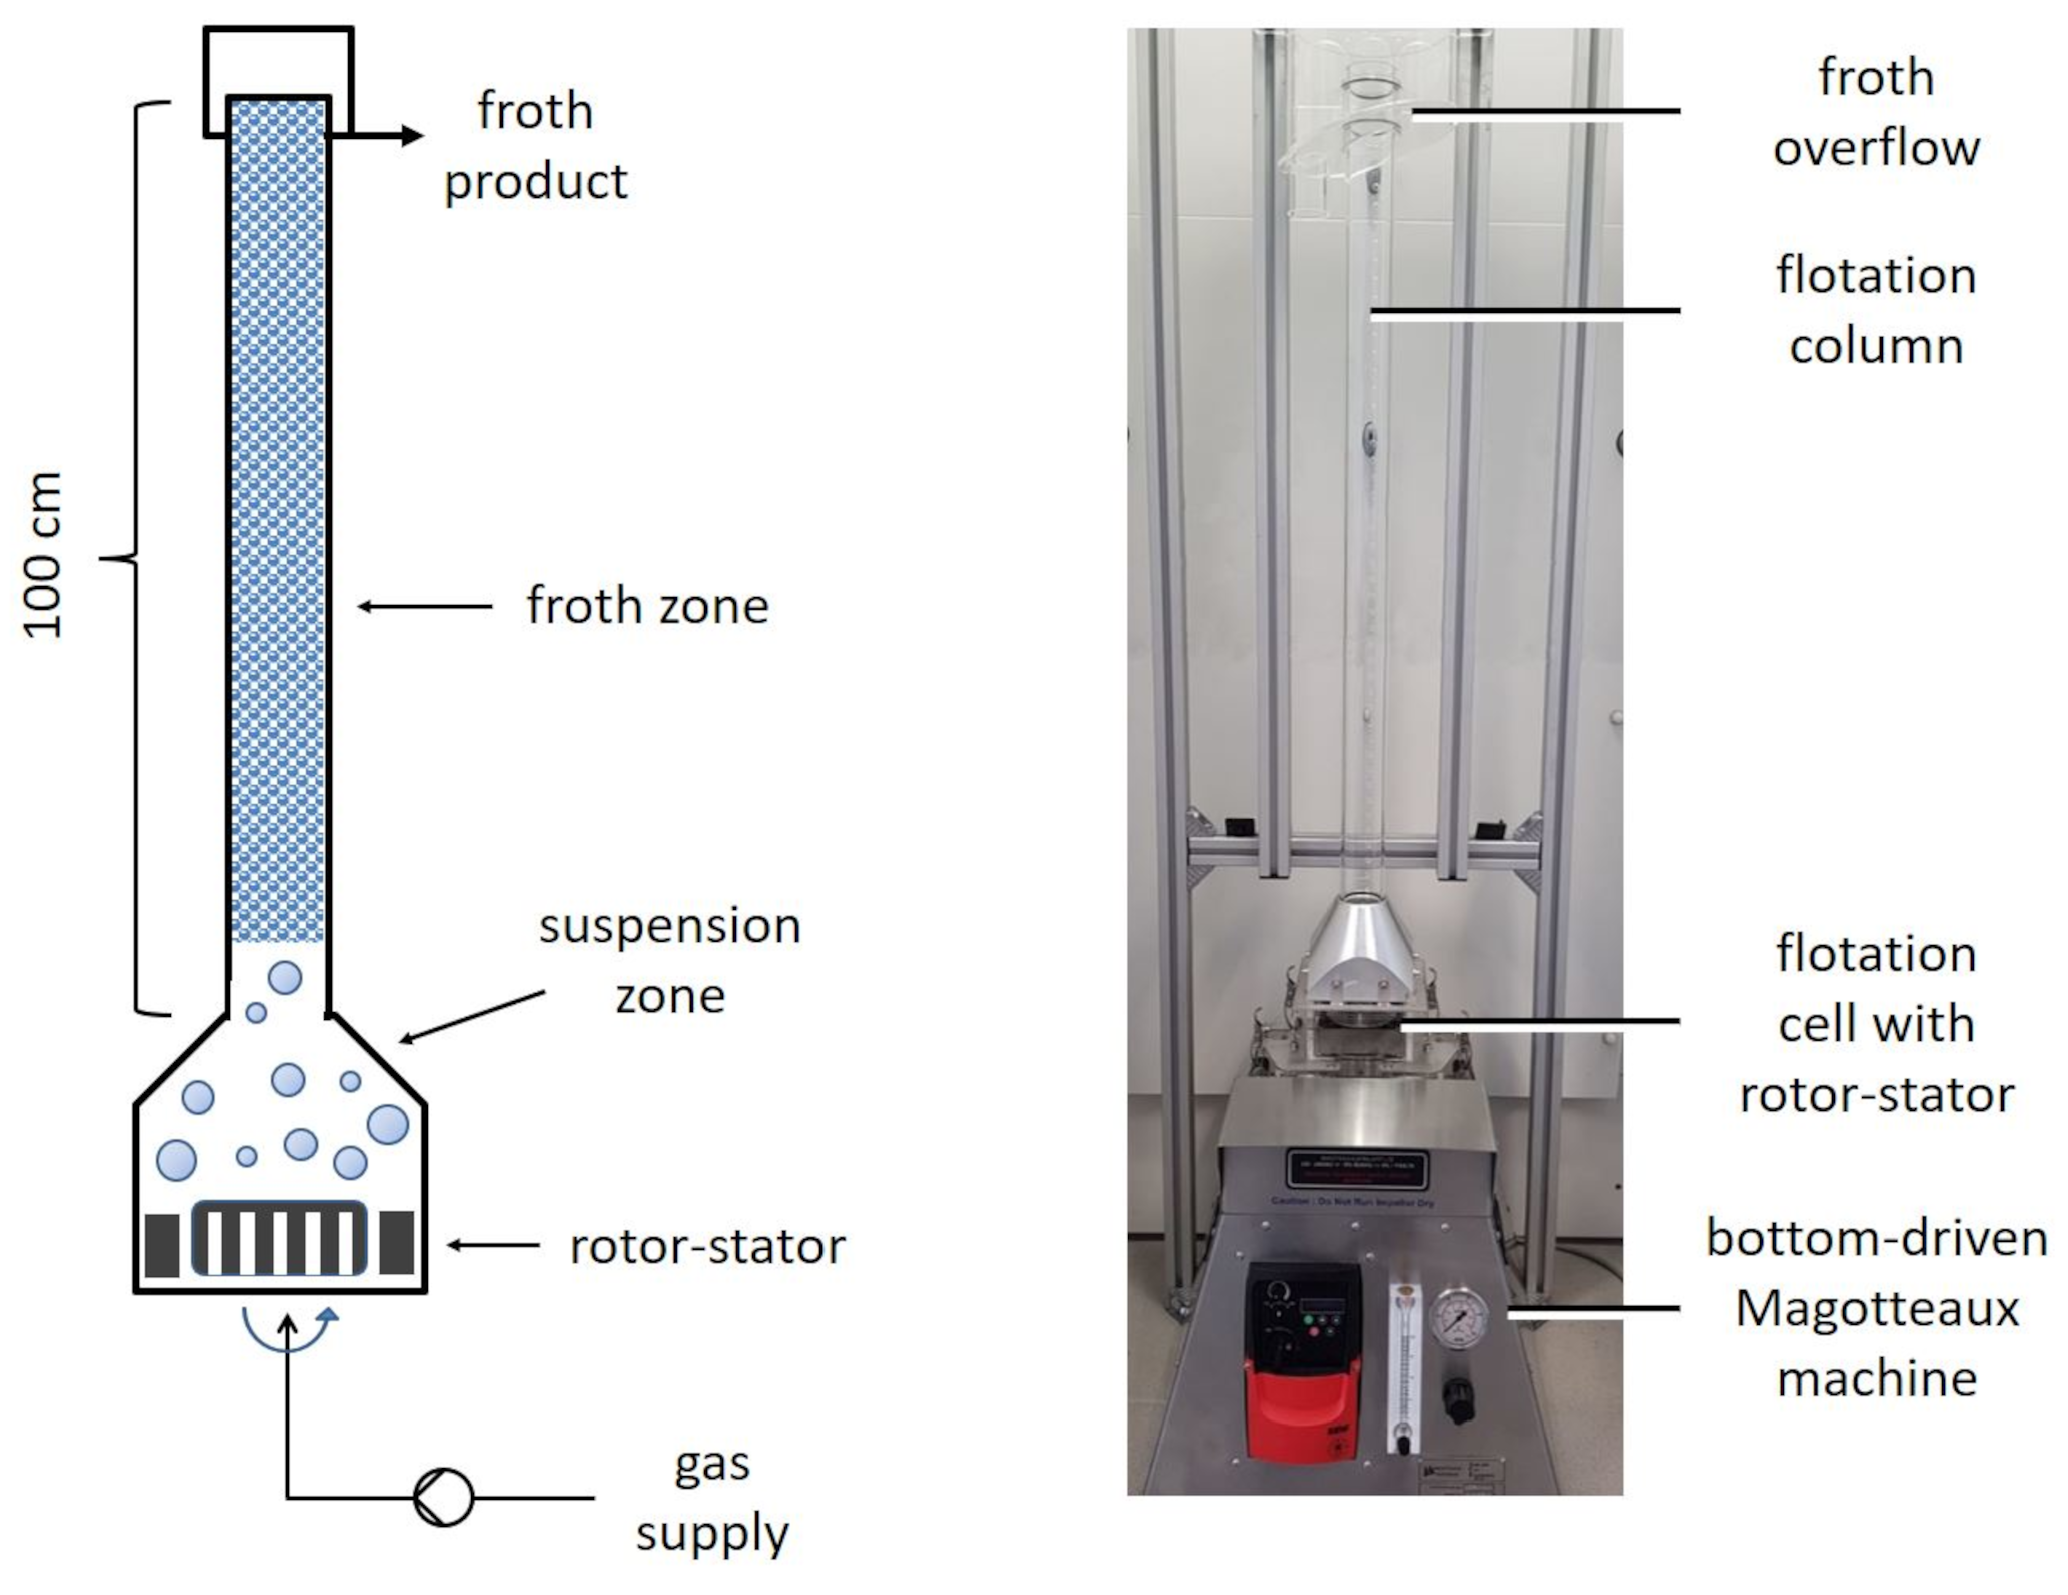
2.2. Flotation-Based Separation Experiments

All flotation experiments have been carried out using the newly developed MultiDimFlot separation apparatus shown in Figure 2, which combines mechanical agitator-type froth flotation using a bottom-driven Magotteaux machine ( 12   c m × 12   c m ) with column flotation, where a column length of 100   c m and a diameter of 5   c m were used.
The flotation experiments were conducted at a rotational speed of 600   min 1 using an airflow rate of 0.9   L / min and a superficial gas velocity of 0.76   cm / s . All experiments were conducted in batch mode using 4.8 % (w/w) pulp density with the glass particles and magnetite at a weight ratio of 1:9, respectively. Poly(ethylene glycol) (PEG, Carl Roth with a molecular weight of 10,000 g / mol ) was used as a frother. No collector was used for flotation as the glass particle wettability was modified prior to flotation; hence no conditioning was required. The particles were dispersed in a 10 2 M KCl background solution with a PEG concentration of 10 5 M using an Ultra Turrax (dispersion tool S25N-25F) from IKA, Germany, for 1 min at 11,000 min 1 , resulting in a dispersion with a pH of 9. Flotation experiments were carried out for 8   min with concentrates being taken after 1 , 2 , 4 , 6 and 8   min by scraping off the froth every 10 s . The concentrates and tailings were dewatered via centrifugation and dried in a drying cabinet. Characterization included a gravimetric analysis for mass balancing, X-ray fluorescence (with the Bruker S1 TITAN handheld device) to obtain the chemical composition, laser diffraction (HELOS, Sympatec) for the particle size, and mineral liberation analysis to obtain the composition of particle systems and particle-discrete information on size and shape. Each flotation experiment setting has been repeated three times. The analysis presented and the computation of the Tromp functions described below are carried out for one representative experiment of each setting.

2.3. Sample Preparation and SEM-Based Automated Mineralogy

Polished blocks were prepared for analysis by mixing representative sample splits with graphite powder and embedding the mixture in epoxy resin, followed by slicing, rotating and remounting to reduce the effects of gravity settling [40]. The MLA was conducted at the Helmholtz Institute Freiberg for Resource Technology utilizing a ThermoFisher (formerly FEI) Quanta 650F MLA system equipped with two Bruker Quantax X-Flash 5030 energy-dispersive X-ray spectroscopy (EDS) detectors. To generate false color images, backscattered electron (BSE) images and EDX analyses were seamlessly integrated using FEI’s MLA suite, version 3.1.4. In the BSE images, the gray scale’s lower limit was established at epoxy resin (<20), while the upper limit was set to copper (245–255). A comprehensive characterization of each mineral phase and its distribution across the entire samples was accomplished by mapping with one EDX measurement point per defined grain. This mapping was conducted using extended BSE liberation analysis (XBSE mode [41,42]), providing high resolution and enabling the analysis of post-BSE image segmentation based on user-defined parameters such as minimum grain size. Based on this post-BSE image segmentation, it was emphasized that the materials under consideration were either purely composed of glass or magnetite. The specific measurement parameters were configured as follows: an acceleration voltage of 15 kV, a probe current of 10 nA, a horizontal field width of 250   μ m and a frame resolution of 1000 pixels. These settings resulted in a spatial resolution of 0.25 microns per pixel. Further details regarding the measurement procedure can be found in Bachmann et al. [43].

2.4. Particle-Based Segmentation

Using 2D image data obtained by MLA, certain image processing steps were applied to each image measurement. First, all particles from a specific material (glass or magnetite) were extracted by a phase-based segmentation. In MLA measurements, this segmentation was simply obtained by extracting all regions that had the same label, i.e., corresponding to a specific material. Furthermore, challenges related to particle agglomeration were encountered, making particle-wise segmentation challenging. To address this, the watershed algorithm [44,45] was employed on all segmented regions observed in the image measurements corresponding to agglomerates, where one particle is connected with one or more other particles. A common issue with the watershed algorithm is oversegmentation, where single particles are often divided into multiple segments. However, in the context of the present paper, oversegmentation was avoided by assuming that all particles in the systems of spheres, fragments and magnetite were convex. Consequently, the watershed algorithm was applied only to those regions observed in the image measurements where the ratio of area (number of pixels belonging to the corresponding region) to the area of the convex hull (number of pixels belonging to the smallest convex area containing the corresponding region) was smaller than 0.7 . For single particles that were not part of an agglomerate, this ratio was larger than 0.7 due to particle convexity, whereas for agglomerates, this ratio was typically smaller than 0.7 . This ratio is also known as convexity factor [46] and is applied to similar particle systems in [47]. However, not all agglomerates were recognized when using the proposed segmentation approach. Especially for the spherical particles, agglomerates whose convexity factor was smaller than 0.7 were observed in the MLA images, such that an agglomerate was wrongly considered to be a single particle, which in turn influenced the analysis of the particle shape. This is an artifact of the MLA analysis and is further discussed in Section 3.4.
After the extraction of similarly labeled regions and the application of the watershed algorithm to account for agglomerates, a particle-based segmentation was obtained. To further refine the segmentation and exclude undesirable artifacts, all extracted regions with an area-equivalent diameter smaller than 1   μ m or larger than 10   μ m were disregarded by means of Equation (1). The obtained results are presented in Table A1 in Appendix A.1, providing information on the number of particles observed in the MLA images and the subsequent exclusion after particle-based segmentation. These data encompass various particle systems and include results from different wettability experiments involving both concentrate and tailings.

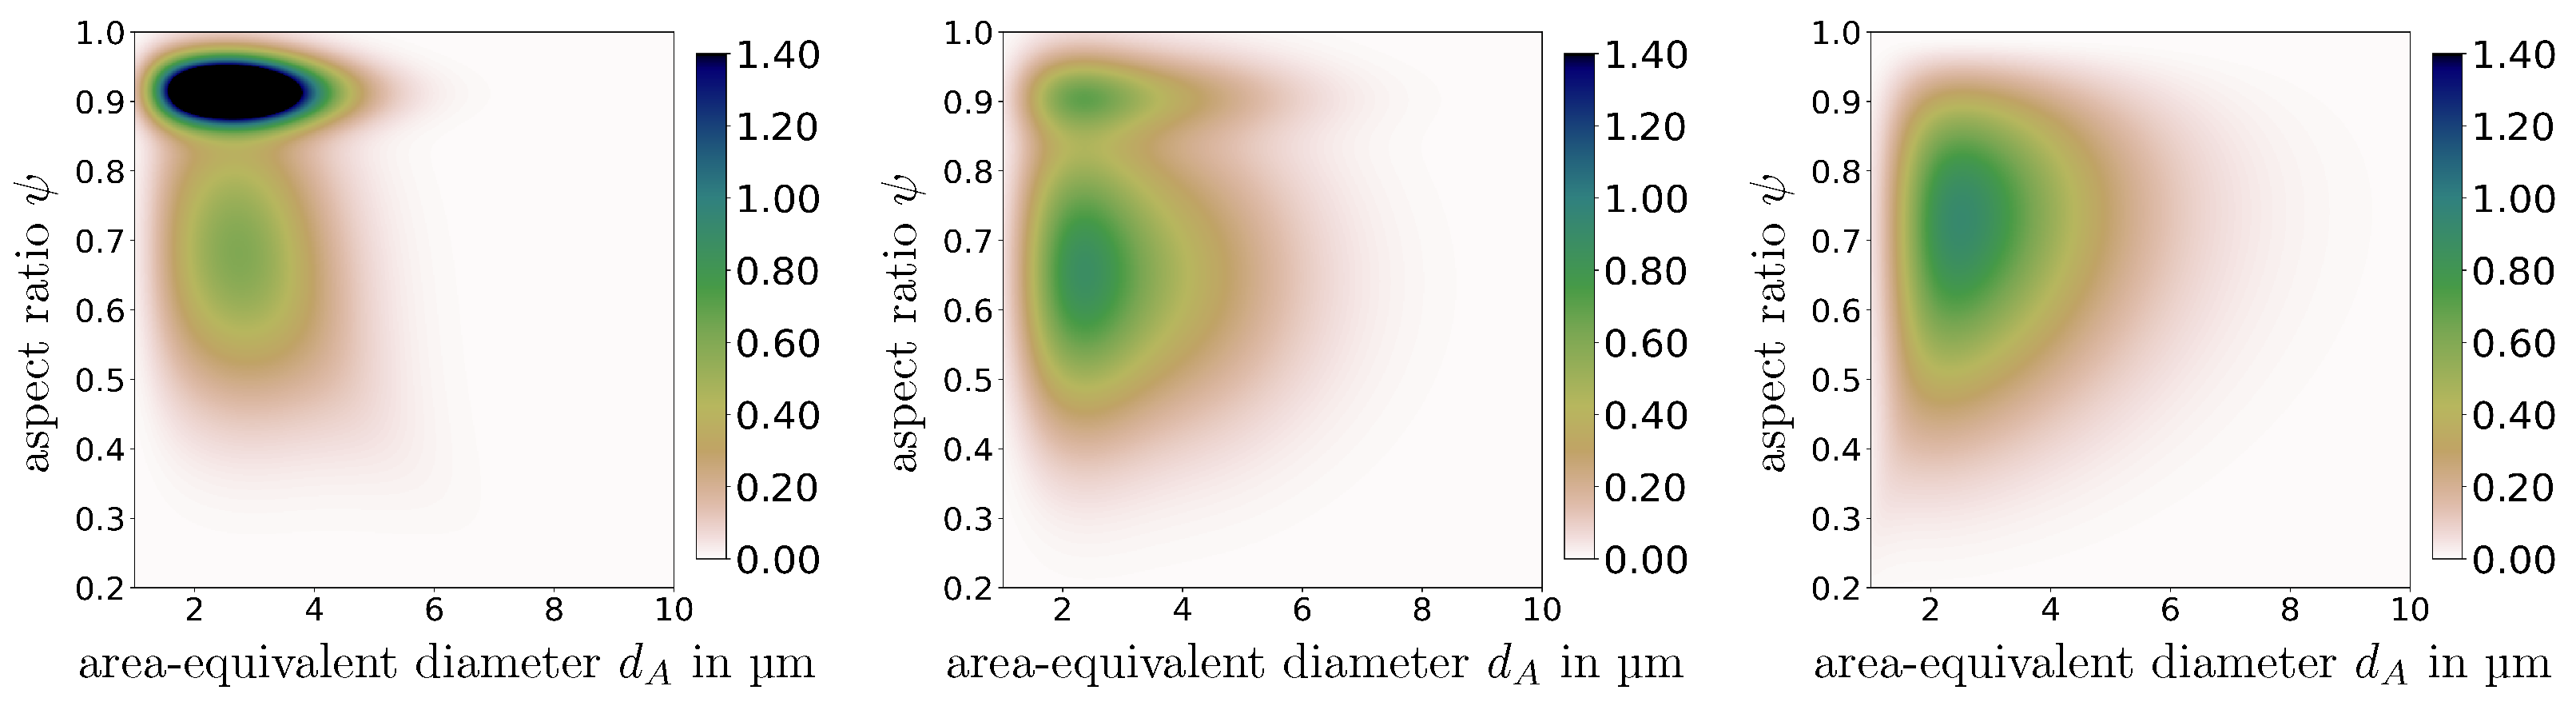
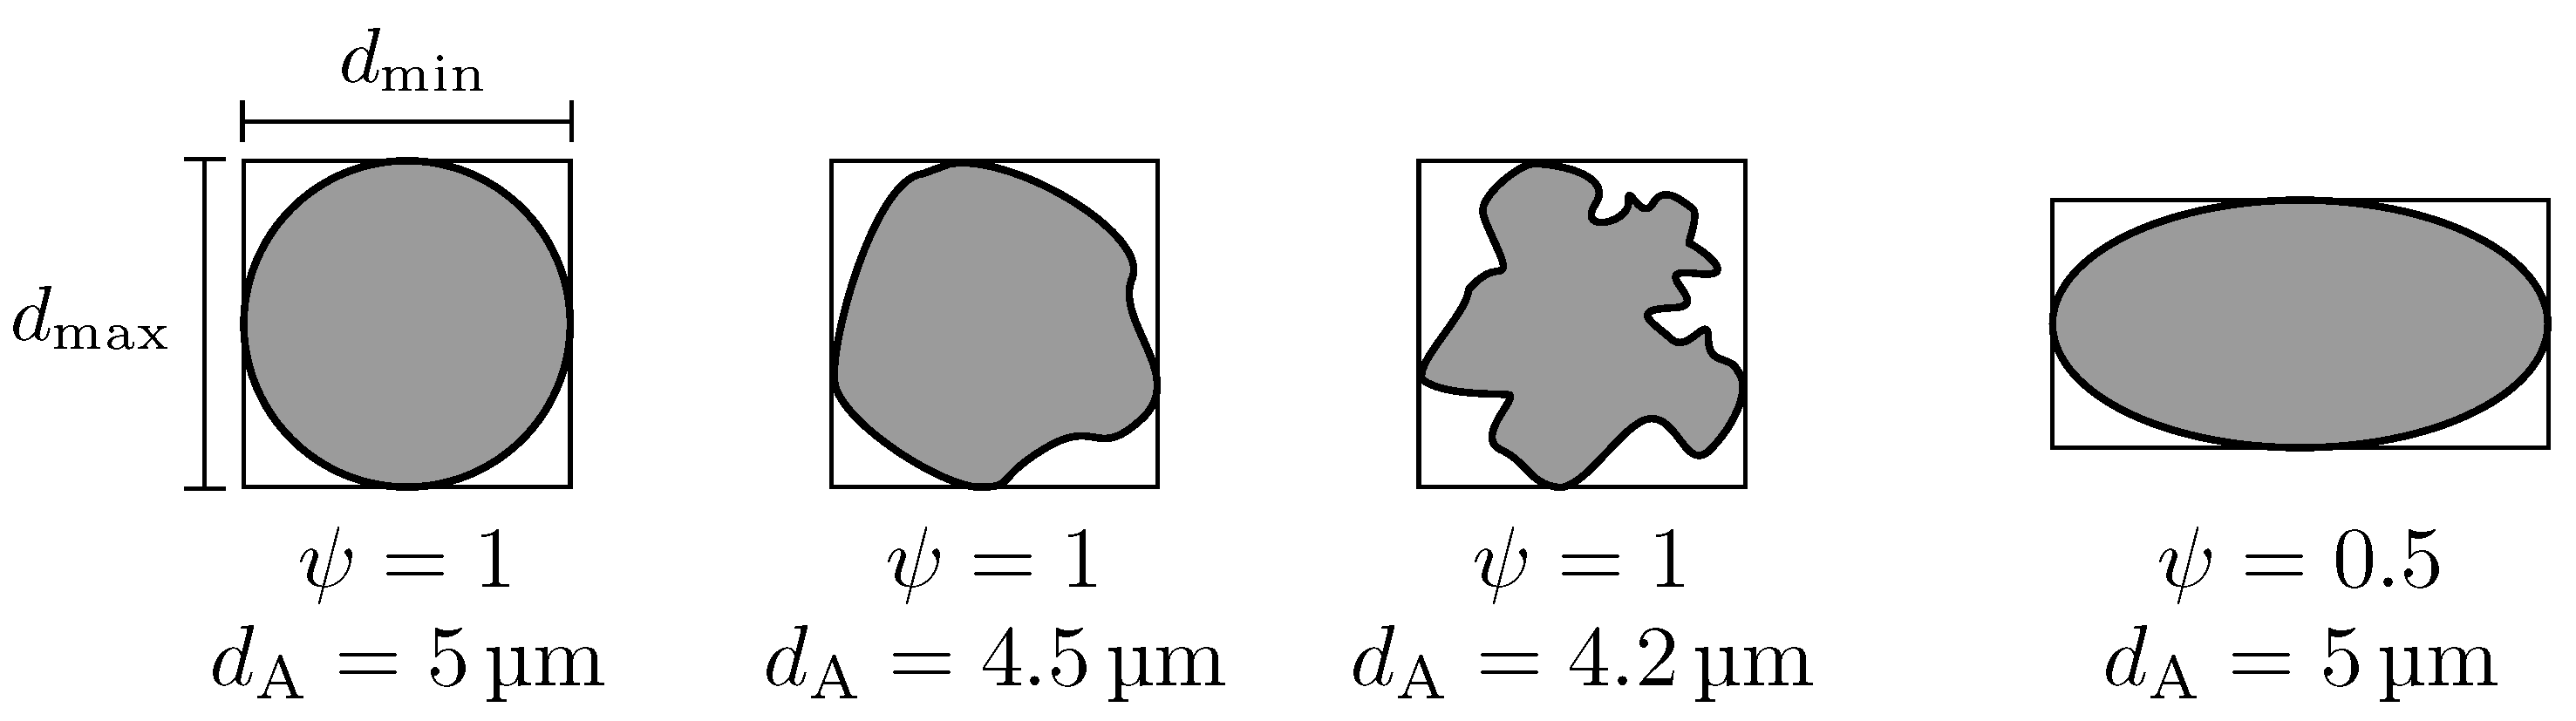
2.5. Characterization of Particles by Means of Size and Shape Descriptors

For particles observed in a planar section of a three-dimensional particle system, it is possible to compute various size and shape descriptors using the particle-wise segmentation of 2D images obtained by MLA measurements within some sampling window W Z 2 , see Section 2.3. The size and shape descriptors used in the present paper are adopted from [32].
In order to characterize the size of a particle’s cross-section P observed within the sampling window W, the area-equivalent diameter d A ( P ) of P was determined, which is given by
d A ( P ) = 2 A ( P ) π ,
where A ( P ) denotes the area of P. Note that A ( P ) is computed from image data by counting the number of pixels belonging to the correspondingly discretized particle cross-section P W . Recall that in the present study, particles with an area-equivalent-diameter smaller than 1   μ m are excluded from the analysis of image measurements due to limitations in the resolution of MLA.
Furthermore, the so-called minimum and maximum Feret diameters d min ( P ) and d max ( P ) of P are determined by deploying the algorithm given in [48]. More precisely, d min ( P ) and d max ( P ) are the smallest and largest edge lengths of a minimum rectangular bounding box B ( x , y , α , β , θ ) of P. Such a bounding box can be determined by solving the minimization problem
( x , y , α , β , θ ) = arg min ( x , y , α , β , θ ) R 4 × [ 0 , π ) , 0 < α β , P B ( x , y , α , β , θ ) α · β ,
where B ( x , y , α , β , θ ) denotes a rectangle with edge lengths α , β > 0 such that α β , which is rotated by θ [ 0 , π ) around its center ( x , y ) R 2 . Then, the minimum and maximum Feret diameters of P are given by d min ( P ) = α and d max ( P ) = β , respectively. This provides the aspect ratio ψ ( P ) of P, which is given by
ψ ( P ) = d min ( P ) d max ( P ) .
Note that the aspect ratio ψ defined in Equation (3) is a shape descriptor that allows us to distinguish between elongated ( ψ ( P ) 1 ) and non-elongated particles ( ψ ( P ) 1 ) and is dimensionless. Analogously to the computation of the area of a particle cross-section from image data, the minimum and maximum Feret diameters d min ( P ) and d max ( P ) of P are determined by rescaling their values with the pixel size.

2.6. Stochastic Modeling of Particle Descriptor Vectors for the Computation of Multivariate Tromp Functions

A system of particles, observed by image measurements and extracted by particle-based segmentation, can be described by a set of descriptor vectors. In this context, MLA images provide a planar section of a three-dimensional particle system within a certain sampling window W Z 2 . In the present paper, based on the particle-wise segmentation of 2D images, each particle is represented by a 2-dimensional descriptor vector x = ( x 1 , x 2 ) R 2 , where the first entry x 1 of x denotes the particle’s size, while the second entry x 2 characterizes the particle’s shape. In order to evaluate the separation behavior of particle systems in separation experiments, the entirety of particle descriptor vectors associated with particles of the feed material and of the concentrate were modeled by number-weighted bivariate probability densities f f : R 2 [ 0 , ) and f c : R 2 [ 0 , ) , respectively. This allows for the computation of the number-weighted bivariate Tromp function T : R 2 [ 0 , 1 ] [32,33], given by
T ( x ) = n c n f f c ( x ) f f ( x ) , if f f ( x ) > 0 , 0 , if f f ( x ) = 0 ,
for each x R 2 , where n c and n f denote the number of particles in the concentrate and the feed, respectively. The value T ( x ) of the Tromp function can be interpreted as the probability of a particle with descriptor vector x, to be separated into the concentrate.
In Section 2.6.1 and Section 2.6.2, a more detailed description of the parametric methods for modeling the distribution of single particle descriptors by univariate probability densities and the distribution of pairs of descriptors by means of a parametric copula-based procedure are discussed.

2.6.1. Univariate Stochastic Modeling of Single Particle Descriptors

The particle system observed in image measurements after a particle-wise segmentation can be characterized by a sample of particle descriptor vectors, where each descriptor vector is assigned to a single particle cross-section P i W for i = 1 , 2 , , N . Here, N > 0 denotes the number of particle cross-sections in W. Each descriptor vector contains the particle size and shape descriptors as introduced in Section 2.5. Thus, in this study, the focus lies on determining two-dimensional descriptor vectors x ( 1 ) , , x ( N ) R 2 . As already mentioned above, the first entry of these descriptor vectors is the area-equivalent diameter of the corresponding particle cross-section, while the second entry describes the particle’s shape using the aspect ratio of its planar cross-section. Thus, formally, the descriptor vectors of particle cross-sections are given by x ( i ) = ( d A ( P i ) , ψ ( P i ) ) for i = 1 , , N .
A univariate probability density is fitted from a parametric family { f θ : θ Θ } of probability densities f θ : R [ 0 , ) to each entry of the particle descriptor vectors (e.g., densities of normal, log-normal, gamma, or beta distributions), where Θ is the set of admissible parameters; see Table A2 in Appendix A.2. The best fitting density and the corresponding parameters are chosen by means of the maximum likelihood method [49].
Analogously to [32], the characterization of the particle systems presented in this paper involves the consideration of bimodal probability densities as a convex combination f θ 1 , θ 2 , w = w f θ 1 + ( 1 w ) f θ 2 of unimodal probability densities f θ 1 , f θ 2 : R ( 0 , ) for some θ 1 , θ 2 Θ , where w ( 0 , 1 ) is a mixing parameter. Introducing such bimodal densities allows for improved fits, albeit at the expense of increasing the number of model parameters. The best fitting distribution was selected according to the Akaike information criterion [50].

2.6.2. Bivariate Stochastic Modeling of Pairs of Particle Descriptors Using Archimedean Copulas

The approach for modeling the distribution of individual particle descriptors, as explained in Section 2.6.1, does not account for the correlation between these descriptors. To obtain a more comprehensive probabilistic representation of the observed particle system, bivariate probability densities were fitted to the dataset of pairs of two-dimensional descriptor vectors, which were computed as described in Section 2.5.
In this study, the focus lies specifically on parametric families of Archimedean copulas, analogously to the approach considered in [32]. These families include the Clayton, Frank, Gumbel and Joe copulas, as well as rotated versions of these copula families [51,52]; see Table A3 in Appendix A.2. The bivariate probability density f : R 2 [ 0 , ) of a two-dimensional particle descriptor vector can be written in the form
f ( x ) = f 1 ( x 1 ) f 2 ( x 2 ) c ( F 1 ( x 1 ) , F 2 ( x 2 ) ) for   each   x = ( x 1 , x 2 ) R 2 ,
where f 1 , f 2 : R [ 0 , ) denote the (univariate) marginal densities corresponding to f and c : [ 0 , 1 ] 2 [ 0 , ) is a bivariate copula density, i.e., a bivariate probability density with uniform marginal distributions on the unit interval [ 0 , 1 ] ; see, e.g., [51]. The best fitting bivariate density f for a sample of particle descriptor vectors obtained from image measurements is determined using maximum likelihood estimation and the Akaike information criterion. This approach has been applied for parametric stochastic modeling of similar types of particle-discrete image data in [31,53].
The bivariate probability densities of pairs of particle descriptors, namely the area-equivalent diameter and the aspect ratio given by means of Equations (1) and (3), are visualized in Figure 3 for the materials considered in the flotation separation experiments.

2.7. Computation of Yield

In order to compute bivariate Tromp functions as given in Equation (4), it is essential to determine the yield, which is the ratio n c n f of the number of particles in the concentrate ( n c ) to the number of particles in the feed ( n f ). Note that this ratio cannot be directly obtained from image measurements as these measurements only provide a statistically representative sample of the particle system. Therefore, the total mass m f of particles in the feed is utilized, which can be approximated by the number of particles n f times the expected mass of a particle in the feed, which is given by R 2 m ( x ) f f ( x ) d x , i.e., m f n f R 2 m ( x ) f f ( x ) d x . Here, m : R 2 [ 0 , ) is a function that maps descriptor vector x R 2 of particle cross-sections onto the particle mass m ( x ) ; see, e.g., [54]. Analogously, for the concentrate, one obtains m c n c R 2 m ( x ) f c ( x ) d x . Using these approximations of the total masses of particles, it is obtained that
n c n f m c m f R 2 m ( x ) f f ( x ) d x R 2 m ( x ) f c ( x ) d x = m c m f V ¯ f ρ V ¯ c ρ ,
where the expected masses of particles in feed and concentrate can be computed by the product of the mass density ρ of particles and their expected volume, denoted by V ¯ f for feed and V ¯ c for concentrate. Note that the total mass ratio m c / m f and the mass density ρ of particles are provided by the experimental setup. In addition, the expected volume of particles in the feed and concentrate is obtained from image measurements. The volume of a single particle is considered to be equal to the volume of a sphere experiencing the same area-equivalent diameter as the particle under consideration. The expected volume of the particle system in question is determined by computing the mean volume across all particles under consideration.

2.8. Probability Densities of Descriptor Vectors Associated with Particles in the Feed and Concentrate

In flotation separation processes, the concentrate is often composed of multiple concentrate streams, as described in Section 2.2. To obtain information on the entire concentrate, it is necessary to combine the information from all of these individual concentrate streams. This means that the probability density f c of descriptor vectors associated with particles in the concentrate is expressed as a convex combination of the probability densities of particle descriptor vectors obtained from image measurements of each individual concentrate stream. In this case, the concentrate consists of five different concentrate streams. For each of these concentrate streams, the probability density f i c : R 2 [ 0 , ) of descriptor vectors associated with the particles in the respective concentrate stream is computed, where i = 1 , 2 , , 5 . This computation is performed using the methods described in Section 2.6.1 and Section 2.6.2. The probability density f c : R 2 [ 0 , ) is then given by
f c ( x ) = λ 1 f 1 c ( x ) + + λ 5 f 5 c ( x ) for each   x R 2 .
The coefficients λ 1 , , λ 5 [ 0 , 1 ] are given by
λ i = n i c n c for   i { 1 , , 5 } ,
where n i c is the number of particles in the i-th concentrate and n c = i = 1 5 n i c . Note that n i c is approximated by dividing the total mass of particles in the i-th concentrate by the expected mass of particles, analogously to the computation of the yield in Section 2.7.
The computation of the probability density f f of descriptor vectors associated with particles in the feed is performed as outlined in [32]. More precisely, the particle systems of the entire concentrate and the tailings need to be characterized in order to compute f f as a convex combination of the probability densities f c and f t , where f t denotes the density of descriptor vectors associated with the particles in the tailings [55]. In other words, f f is given by
f f ( x ) = n c n f f c ( x ) + ( 1 n c n f ) f t ( x ) for each   x R 2 .
This approach is used to avoid numerical instabilities that can arise when computing Tromp functions by means of Equation (4) and using f f obtained from image measurements of the feed. These instabilities are due to the sensitivity of the Tromp function when computing denominator values in Equation (4) being close to zero. Note that this problem occurs when there are relatively few particles with certain descriptor vectors within the feed, yet such particles are enriched within the concentrate.

2.9. Tromp Functions Conditioned on Particle Size and Shape Classes

To gain a deeper understanding of how particle morphology affects the separation behavior of particles, conditional univariate Tromp functions were computed in addition to the unconditioned bivariate Tromp functions considered in Equation (4). This allows us to analyze the influence of specific shape factors on the separation behavior across different size classes, e.g., how the aspect ratio of particles influences the separation behavior of small particles compared with that of larger ones. Additionally, studying the separation behavior of particles with respect to their size conditioned on specific shape classes, such as highly elongated particles compared with less elongated ones, provides even further insights into the particle separation process. In the following, it is described how the univariate Tromp function, conditioned on particle size classes, can be computed. Using a similar approach, it is also possible to compute univariate Tromp functions conditioned on particle shape classes.

2.9.1. Conditional Univariate Probability Densities

The computation of conditional univariate Tromp functions involves the need to determine conditional probability densities [56]. For that purpose, the planar cross-section of a particle taken at random from a particle system (either concentrate or tailings) is represented by a random vector ( D A , Ψ ) with values in [ 0 , ) × [ 0 , 1 ] , where D A denotes its random area-equivalent diameter and Ψ its random aspect ratio, with probability densities of f D A and f Ψ , respectively. The joint probability density of ( D A , Ψ ) is denoted by f D A , Ψ : R 2 [ 0 , ) .
The conditional probability density f Ψ | D A [ a , b ] : [ 0 , 1 ] [ 0 , ) of Ψ , provided that D A [ a , b ] for some a , b 0 with a < b and P ( D A [ a , b ] ) > 0 , is then given by
f Ψ | D A [ a , b ] ( ψ ) = a b f D A , Ψ ( d A , ψ ) d d A a b f D A ( d A ) d d A , for each   ψ [ 0 , 1 ] .

2.9.2. Conditional Univariate Tromp Functions

Subsequently, the conditional univariate Tromp function T Ψ | D A [ a , b ] : [ 0 , 1 ] [ 0 , 1 ] with respect to the random particle descriptor Ψ , provided that D A [ a , b ] , is given by
T Ψ | D A [ a , b ] ( ψ ) = n | D A [ a , b ] c n | D A [ a , b ] f f Ψ | D A [ a , b ] c ( ψ ) f Ψ | D A [ a , b ] f ( ψ ) , if f Ψ | D A [ a , b ] f ( ψ ) > 0 , 0 , if f Ψ | D A [ a , b ] f ( ψ ) = 0 ,
for each ψ [ 0 , 1 ] , where n | D A [ a , b ] c and n | D A [ a , b ] f denote the number of particles in the concentrate and feed with area-equivalent diameter in the interval of [ a , b ] , and f Ψ | D A [ a , b ] f and f Ψ | D A [ a , b ] c are the conditional probability densities of Ψ , provided that D A [ a , b ] for particles in the feed and concentrate, respectively. Here, both conditional densities f Ψ | D A [ a , b ] f and f Ψ | D A [ a , b ] c are computed according to the formula given in Equation (9). Note that the first factor on the right-hand side of Equation (10), i.e., the ratio of the number of particles in the concentrate and feed, conditioned on size or shape classes, cannot be directly obtained just like the yield in Equation (6) for unconditional bivariate Tromp functions. There is a lack of information on the mass of particles in different size or shape classes, making it challenging to directly compute the yield for conditional univariate Tromp functions. To address this problem, in Appendix A.3, a more detailed explanation on how to determine conditional univariate Tromp functions is provided.

3. Results and Discussion

The results, which have been obtained by means of the methods described, are presented in the following sections. First, in Section 3.1, typical flotation results in terms of grade and recovery as well as the mass and water pull are presented for the flotation experiments performed with the MultiDimFlot separation apparatus. Then, Section 3.2 and Section 3.3 deal with bivariate Tromp functions to investigate the combined effects of particle size and shape on the separation. Finally, in Section 3.4, the use of the MLA is discussed for determining the particle descriptors in the case of the ultrafine particle fractions considered in this study. Generally, it is assumed that there is no true flotation for hydrophilic particles, which in this case would apply to the completely hydrophilic systems ( C 0 ) consisting of either pristine glass spheres or fragments mixed with magnetite, where recovery is expected to occur via entrainment only. Therefore, flotation of the hydrophilic particle systems helps study the influence of particle size and shape on their entrainment. Magnetite has a higher mass density, which results in a faster settling velocity compared with glass particles. Therefore, for the hydrophilic systems, it is expected that the recovery of glass particles by entrainment is higher as the magnetite is drained back into the pulp more easily. The interaction of the gas bubbles and the glass fractions with increased hydrophobicity ( C 6 and C 10 ) should result in more stable particle–bubble aggregates; hence, they are recovered predominantly by true flotation, although due to the fine particle sizes, a certain degree of entrainment is expected for all particles.

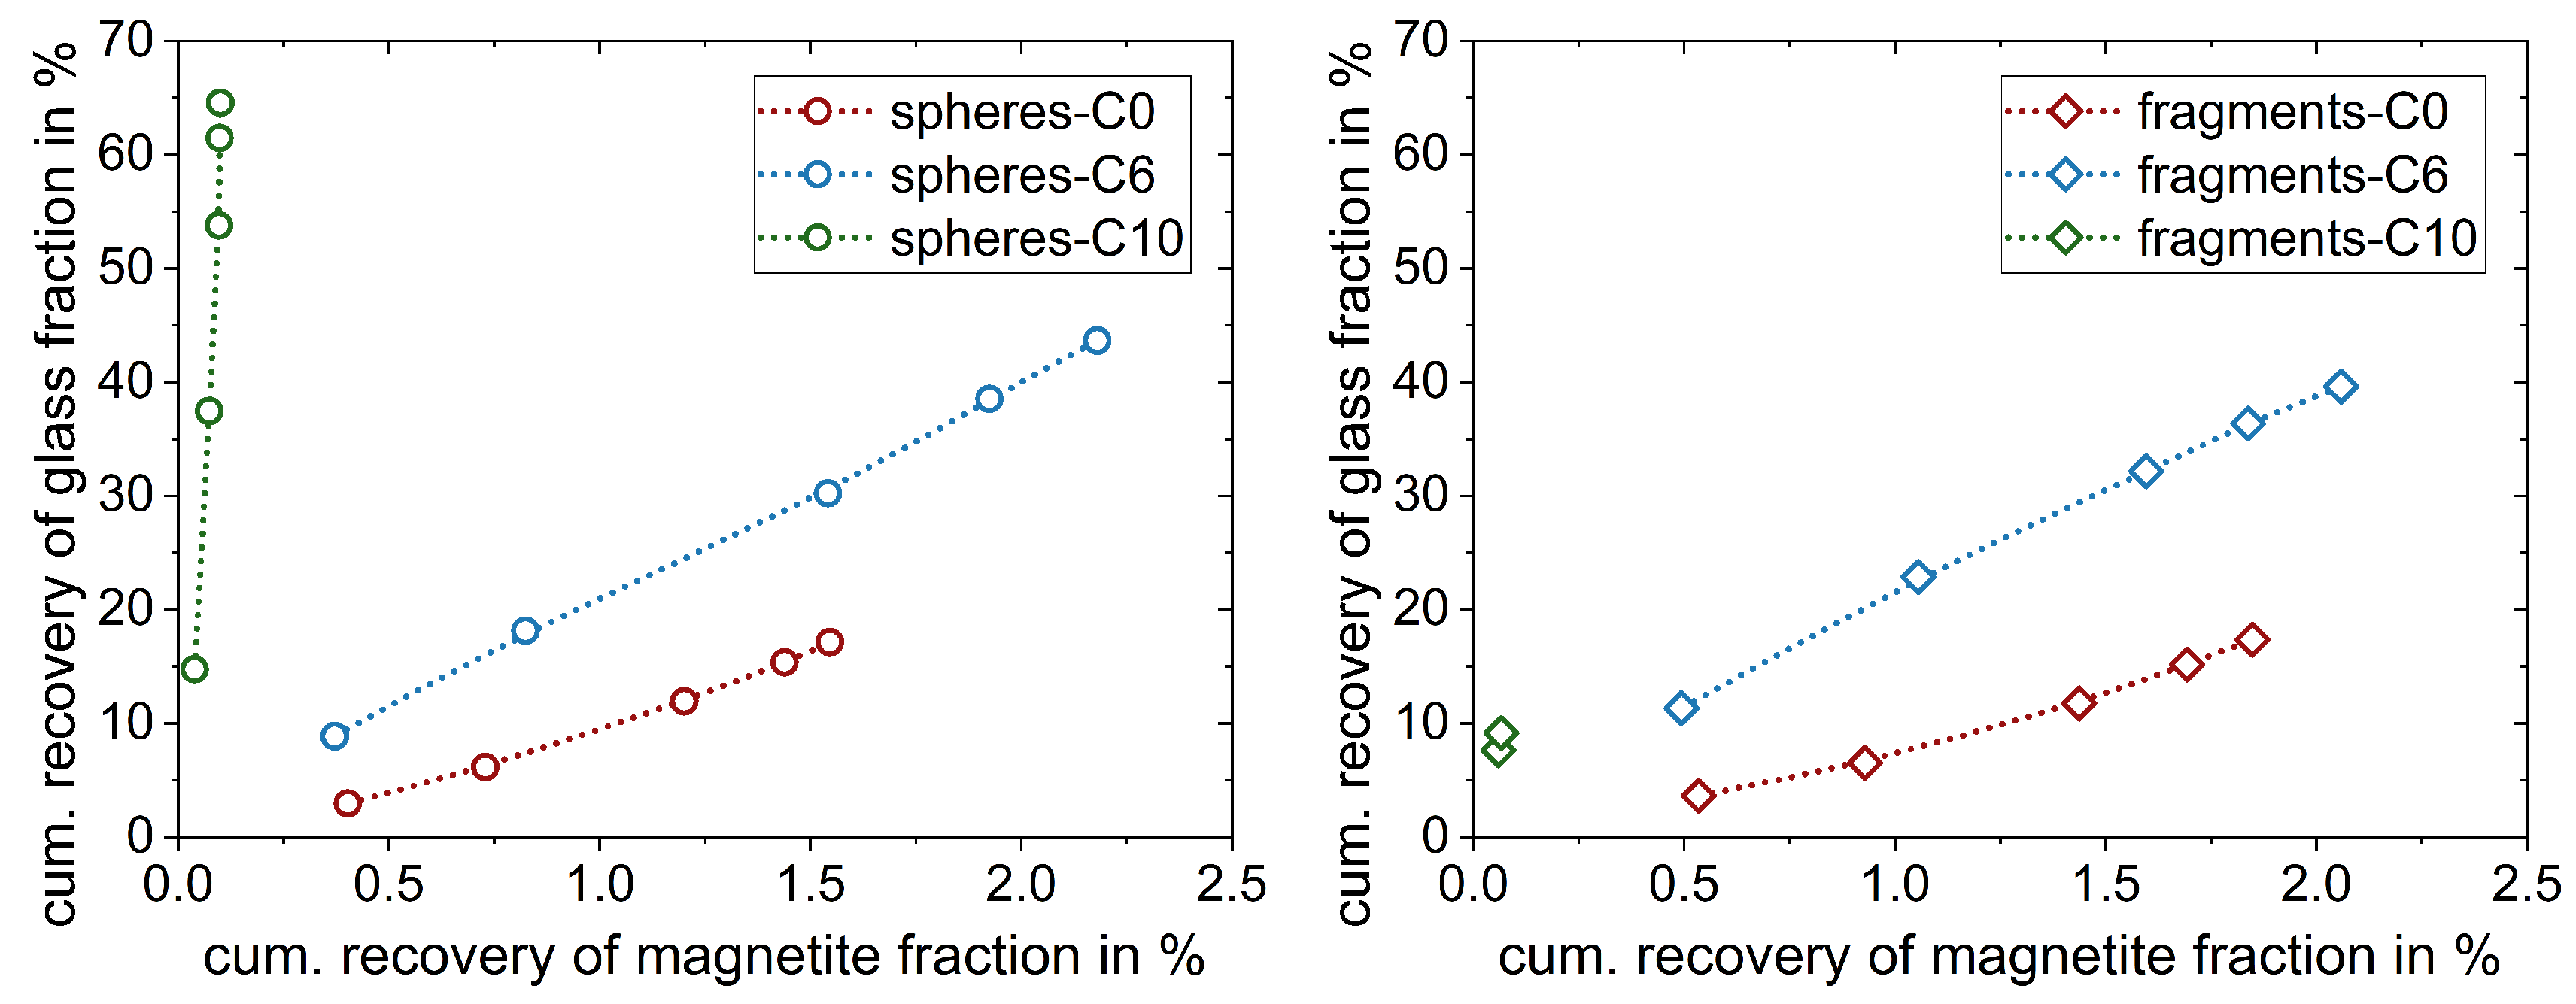
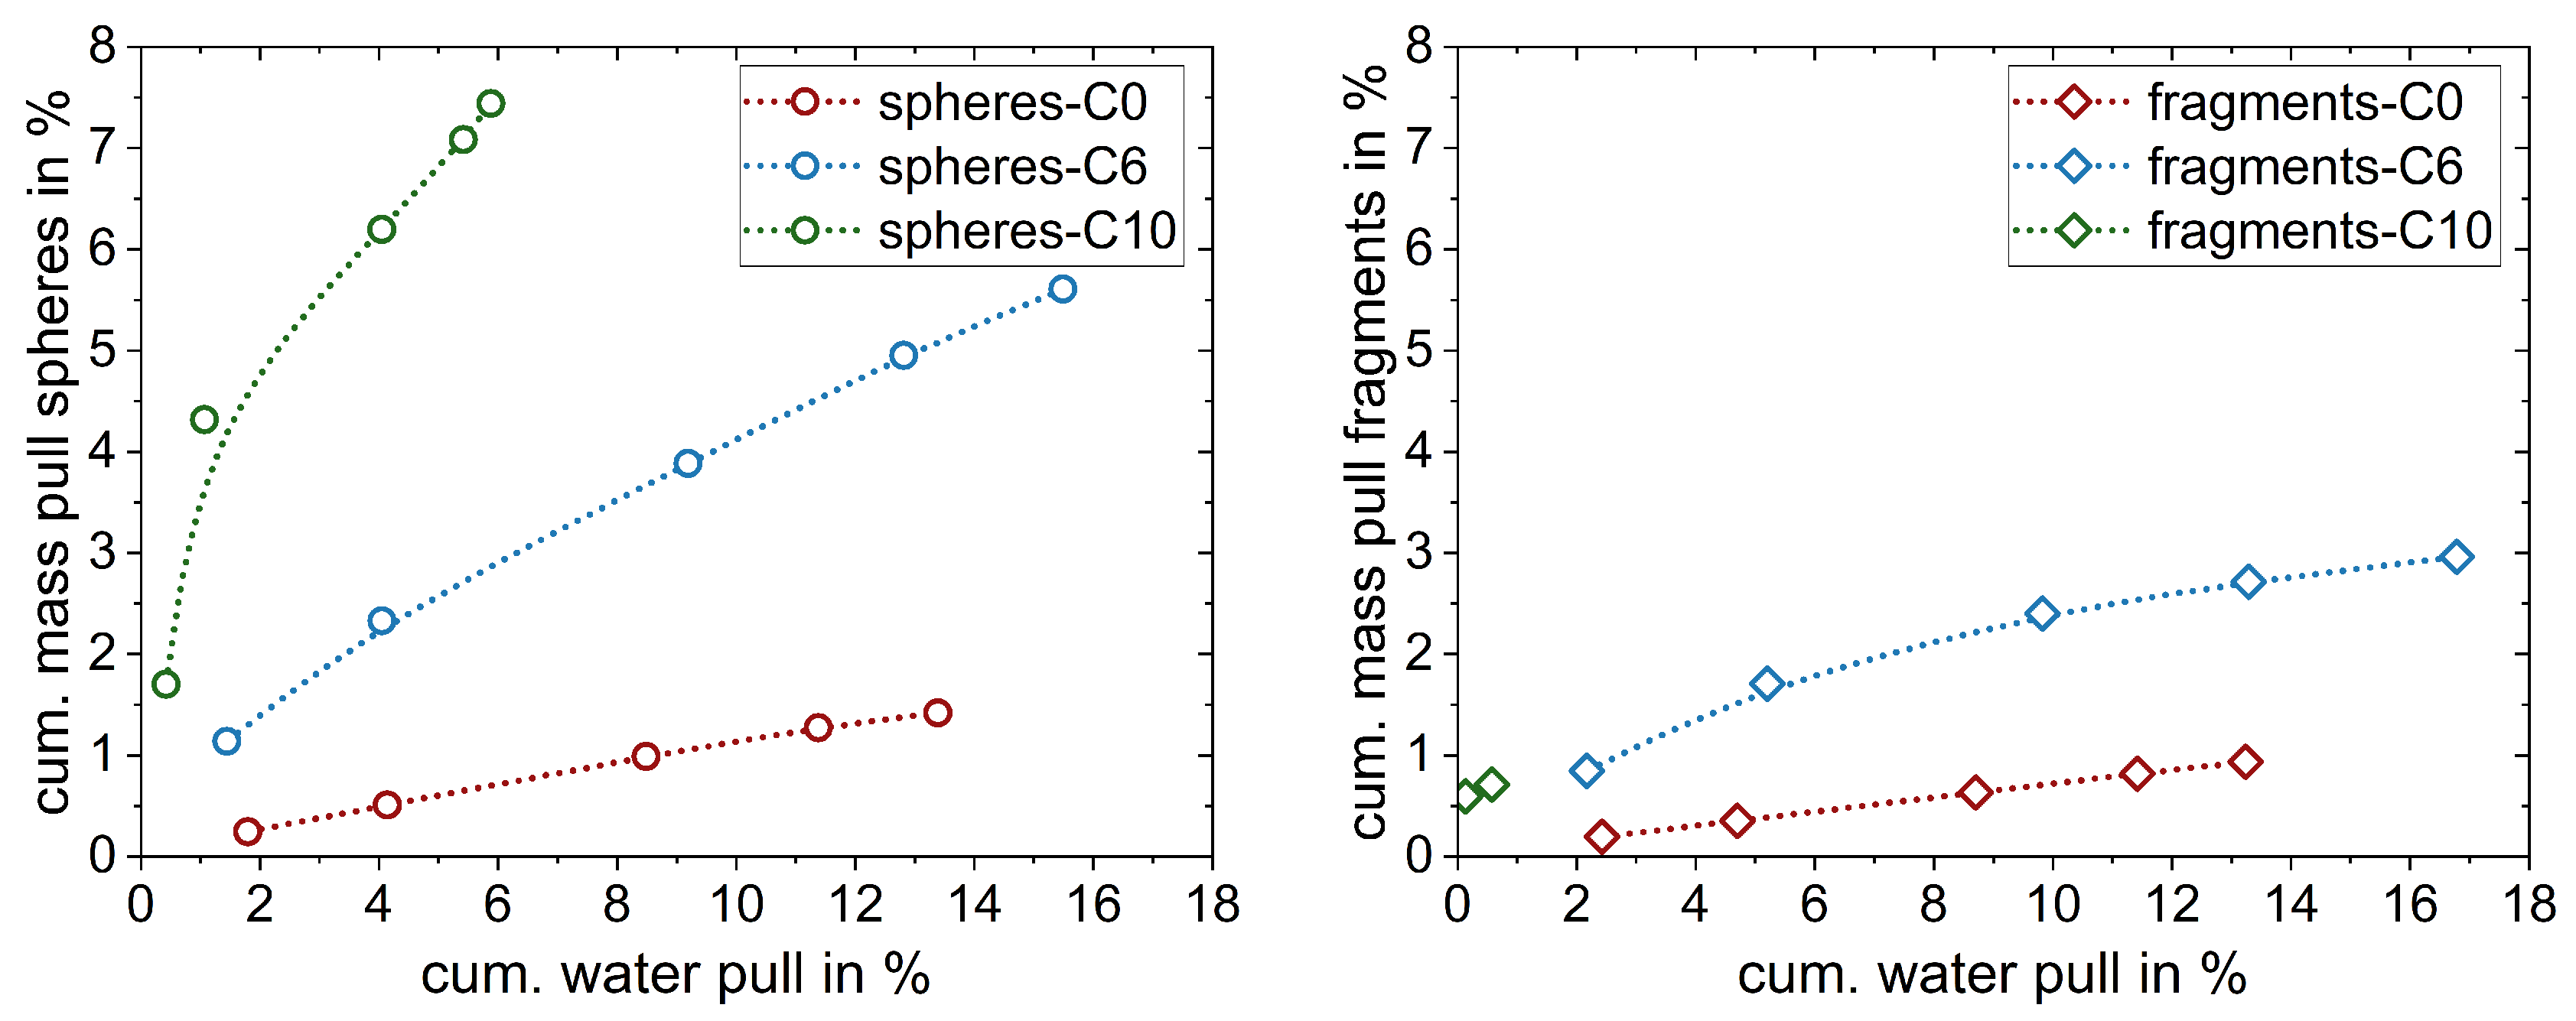
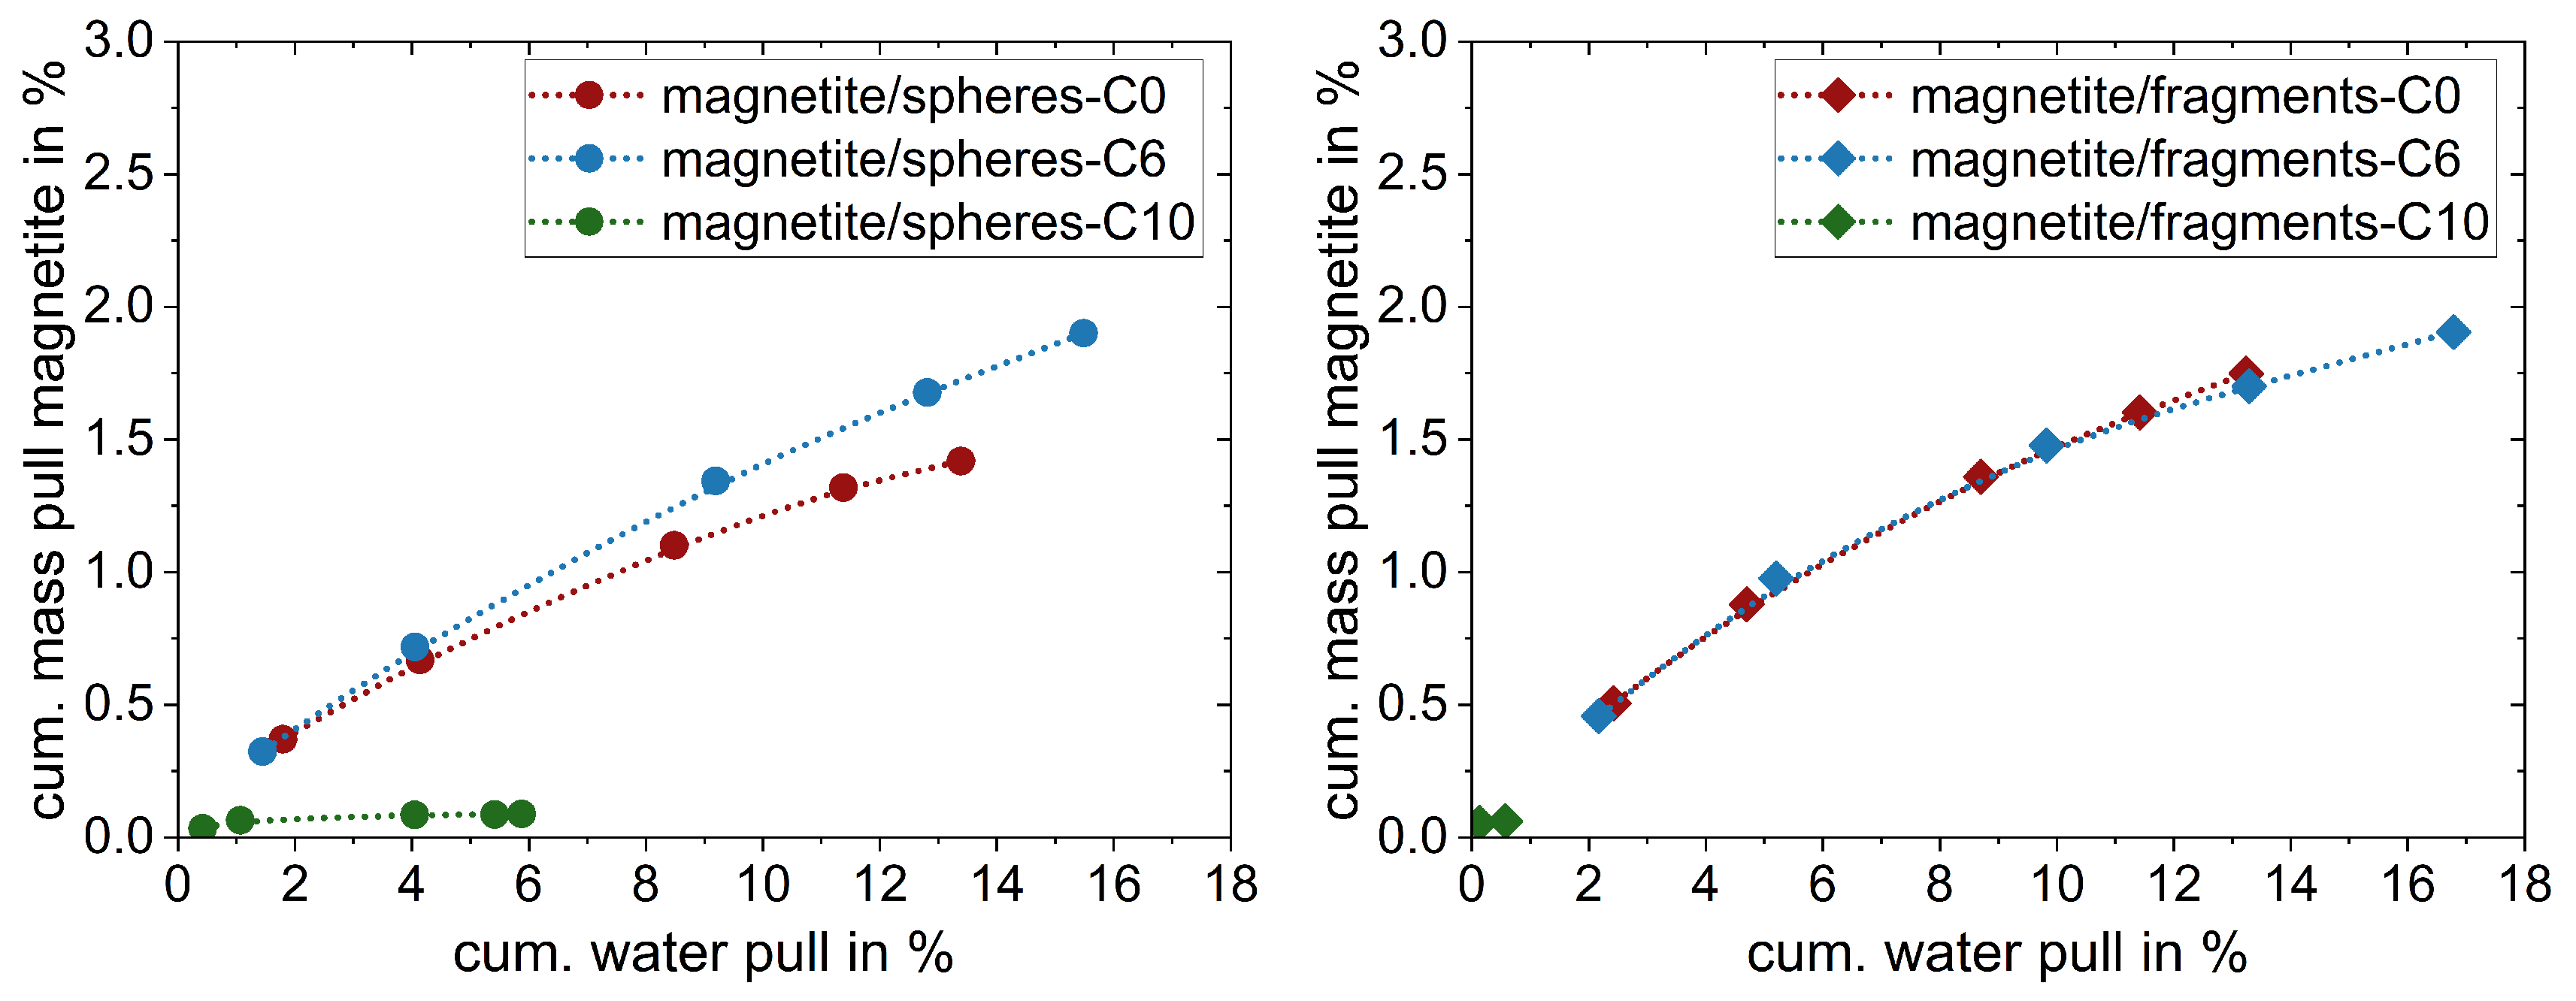
3.1. Classic Flotation Results

The results of the flotation experiments are presented in Figure 4 as Fuerstenau plots showing the cumulative recovery of the glass fractions versus the cumulative recovery of the magnetite fraction for the individual experiments using glass spheres and fragments with different wettability states.
For all experiments, it is apparent that the recovery of glass particles increases along with an increase in their hydrophobicity (from C 0 via C 6 to C 10 ), and the glass particle recovery is much higher than that of magnetite, even for the hydrophilic ( C 0 ) fractions, where the effect of the particle mass density on the entrainment is visible. However, an influence of the particle shape on the entrainment cannot be observed, as the same amount of spheres and fragments (both 17 % ) is entrained. Figure 5 displays the cumulative mass and water pull for the glass particles only, where a linear correlation is observed for both C 0 glass fractions, which additionally indicates a recovery via entrainment. Similar values for the mass and water pull are obtained for both particle systems (mass pull spheres = 1.4%, mass pull fragments = 1%, water pull spheres = 13%, water pull fragments = 13%). These results are unexpected, as other studies showed that shape does have an effect on the particle entrainment, although the basis of comparison is not too high and the results of said studies are diverse. While Little et al. [18] and Kupka et al. [19] showed that the entrainment is higher for round particles, Wiese et al. [20] reported the opposite for their particle system.
In comparison with the completely hydrophilic particle systems, the recovery of the moderately hydrophobic glass fractions ( C 6 ) is much higher because they are supposed to be recovered mainly by true flotation, while the recovery of magnetite is not significantly increased. The recovery of spheres is slightly higher than that of fragments (recovery spheres = 44 % vs. recovery fragments = 40 % ), which is opposite to what would have been expected according to previous studies that observe higher recoveries for edgy and rough particles. The supposed reason for this is that rough particles rupture the liquid film, separating the bubble and the particle, more easily than spherical particles with a smooth surface and therefore show higher probabilities of attachment and consequently higher recoveries [10,11,12,13,57]. The opposite behavior is most probably due to two reasons that have been discussed by Sygusch et al. [17]: First, the setup of the MultiDimFlot separation apparatus with a combination of a turbulent pulp with a deep froth zone plays an important role. The froth zone especially has a strong impact on the separation; however, most of the investigations regarding particle shape effects were conducted in setups where there was little to no froth and the recovery was dominated by effects in the pulp zone. Second, the investigated particle size fractions used in most studies are much coarser than the ultrafine particles used in the present study, and it has been shown before that particle size significantly affects the flotation kinetics and the impact of particle shape (shape is more dominating for coarser particles, while roughness is more dominating for finer particles) [58]. Interestingly, the mass pull of the spheres- C 6 is much higher than that of the fragments- C 6 ( 5.5 % and 2.8 %, respectively, for a water pull of around 15%), and the shape of the curve is also different. While the mass–water pull curve for the fragments has an actual curvature, indicating their recovery by true flotation, for the spheres, the level of curvature is noticeably less, indicating that the particles are recovered not only by true flotation, but also by entrainment. The mass pull of magnetite seems to not be affected significantly by the change of wettability from C 0 to C 6 , as similar values and correlations are obtained, as displayed in Figure 6.
The different results observed for the values and curve progressions of the mass and water pull of the spheres and fragments with medium hydrophobicity already point out the influence of the particle properties on the resulting froth characteristics. This effect is observed to an even larger extent for the particle systems with strongly hydrophobic glass particles ( C 10 ). Here, the recovery of the spheres is up to 65 % , whereas only around 9 % of fragments are recovered. During the flotation of strongly hydrophobic fragments, extremely large coalescing bubbles were observed, which complicated the scraping of the froth and finally resulted in a complete froth collapse after 2 min of flotation so that only two concentrates could be obtained, hence the low recovery for this case (experiments were repeated but were similar or even worse in outcome). Therefore, the results of the flotation experiments using strongly hydrophobic fragments cannot be compared directly with that of the others, but it does show the complexity of the flotation process, as minor changes in the particle properties can have significant effects on the separation, as the only difference between the strongly hydrophobic spheres and fragments is their shape. Dipenaar [26] reported that non-spherical particles can rupture the liquid film at smaller contact angles compared with spherical particles. Furthermore, Johansson et al. [23] and Schwarz et al. [59] suggested that there might be an optimum contact angle not only for certain size fractions, but also for certain shapes, as further discussed by Sygusch et al. [17].

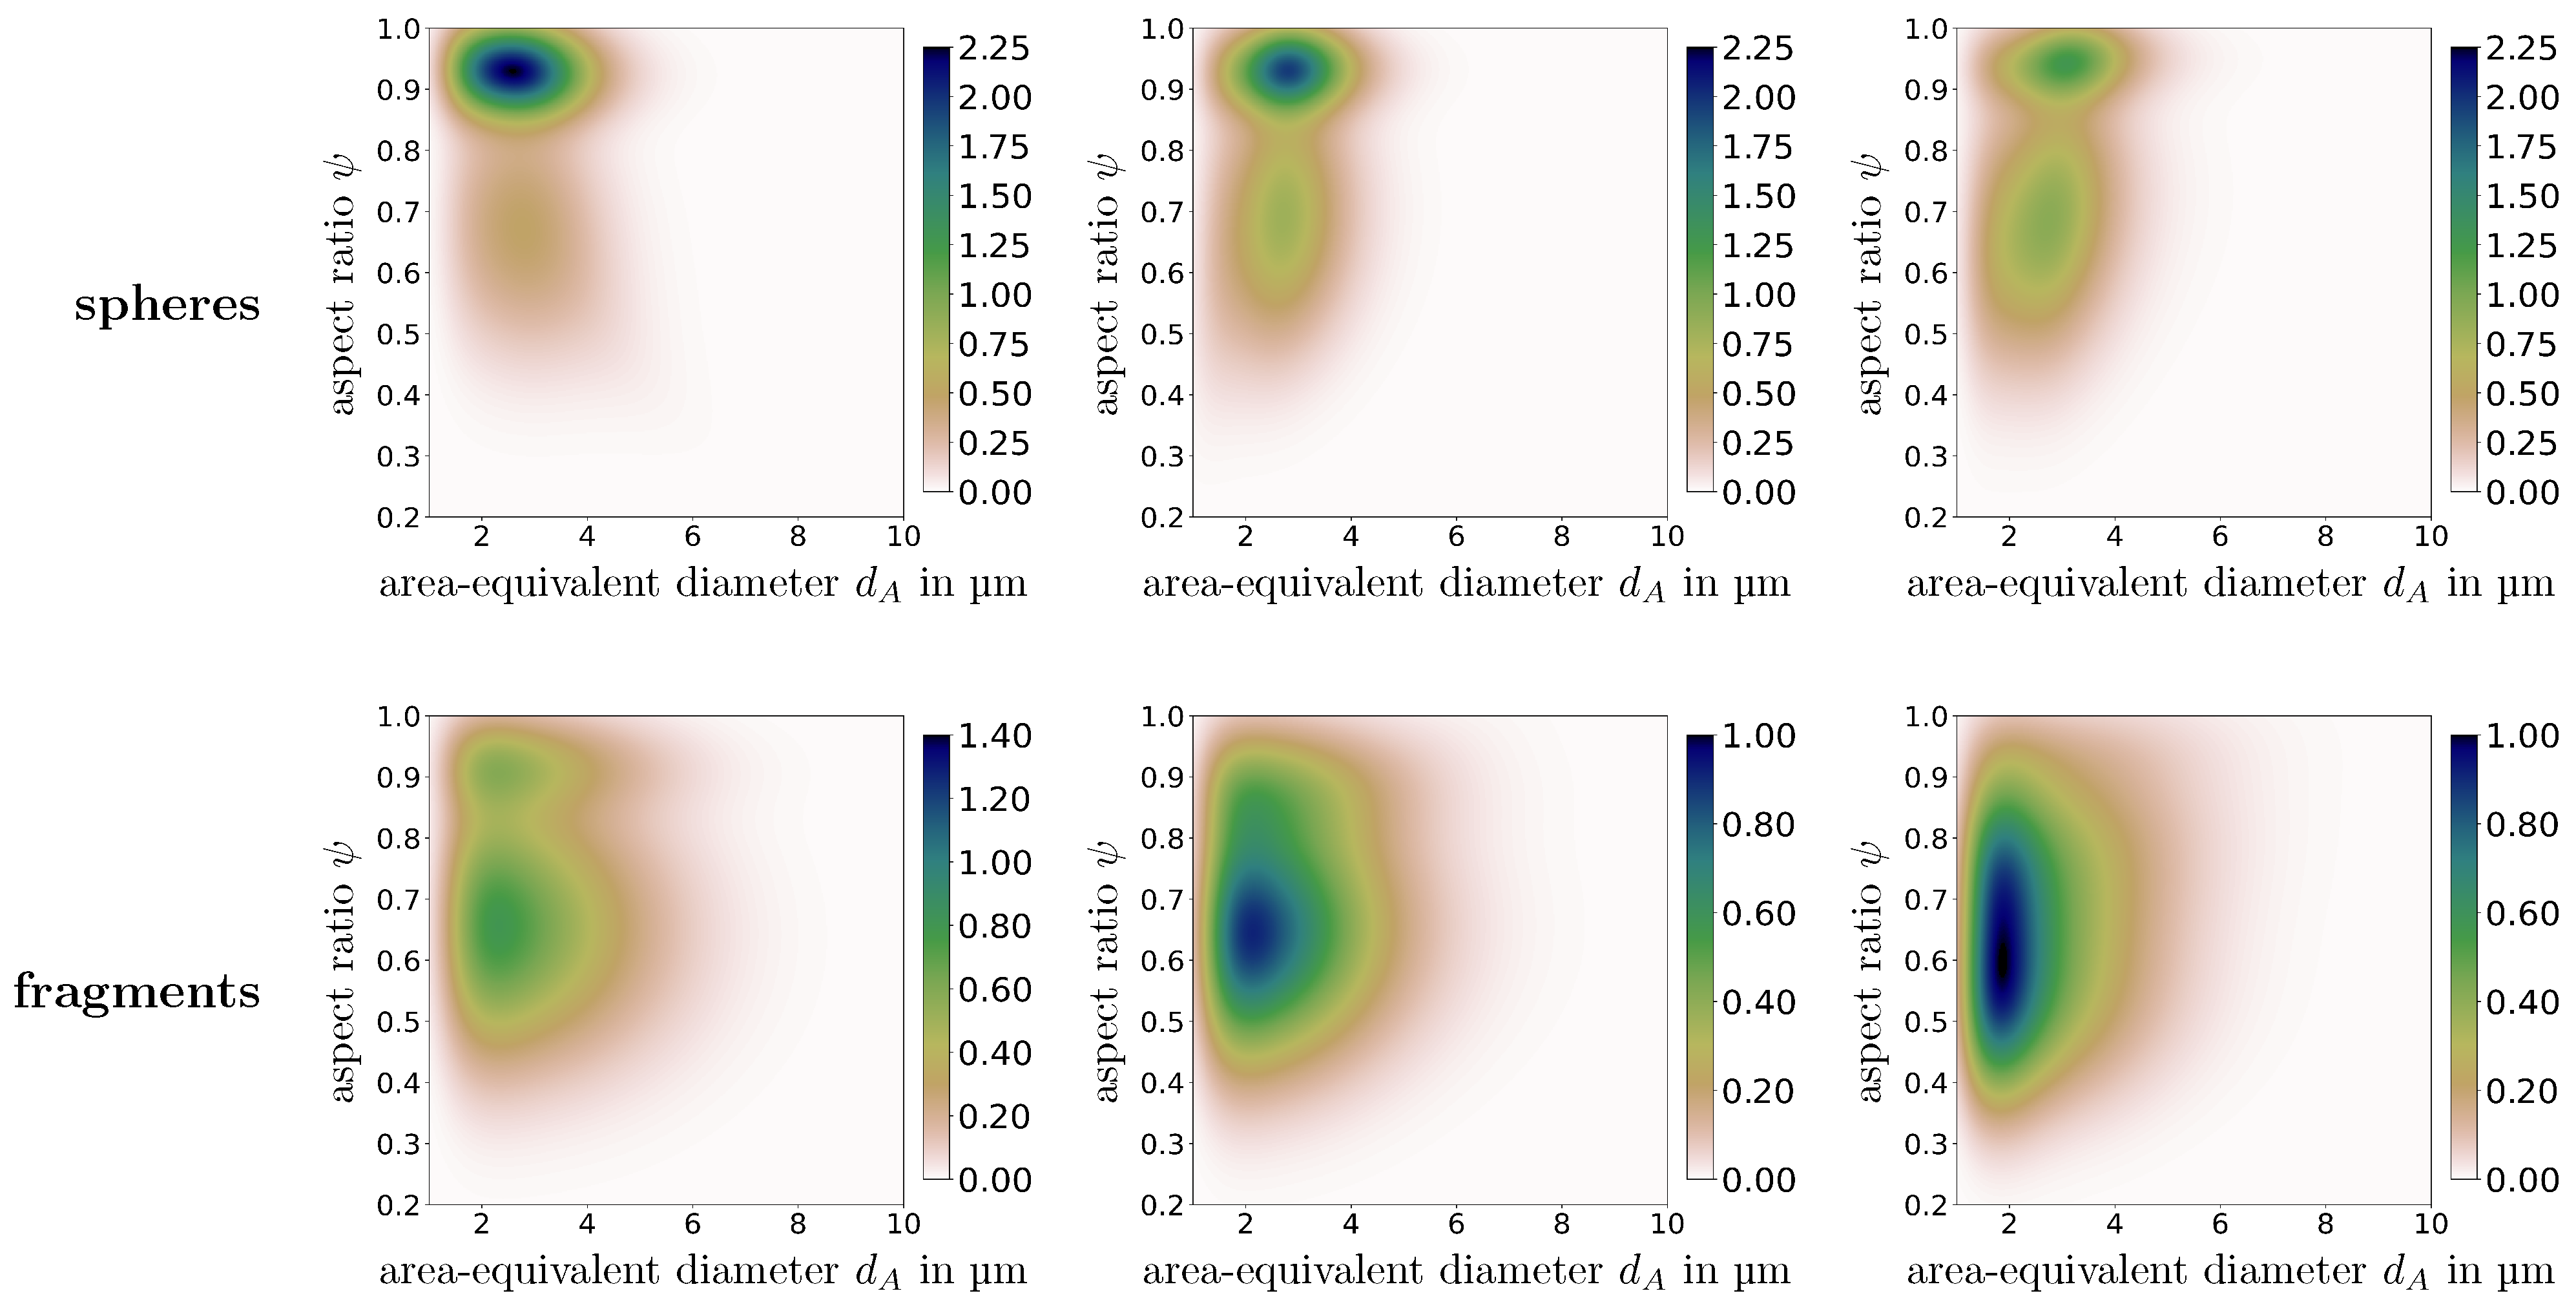
3.2. Influence of Particle Size and Shape on the Entrainment of Ultrafine Particles

Flotation experiments with purely hydrophilic particle systems allow for analyzing the influence of particle (size and shape) descriptor vectors on the entrainment behavior of ultrafine particles. In the following, this kind of separation behavior of glass and magnetite particles was studied in order to gain a deeper understanding of the individual behavior of glass and magnetite, although the flotation experiments were carried out using a mixture of glass (either spheres or fragments) and magnetite. First, bivariate Tromp functions regarding area-equivalent diameter and aspect ratio of planar cross-sections of differently shaped glass particles (spheres and fragments) are computed as described in Section 2.6; see Figure 7 (middle column). Colors ranging from yellow via red to pink indicate that particles in the feed with corresponding area-equivalent diameter and aspect ratio are more likely to be separated into the concentrate (i.e., with a probability larger than 0.5 ), while colors ranging from dark green via blue to light green indicate that a particle with the corresponding descriptor vector is more likely to be separated into the tailings (i.e., particles with such particle descriptors have a probability smaller than 0.5 to be separated into the concentrate). To provide a more meaningful interpretation of the probability that a particle is separated into the concentrate or the tailings, the bivariate Tromp functions are only computed for pairs ( d A , ψ ) of descriptor vectors corresponding to particles that are likely to be observed in the feed. The pairs ( d A , ψ ) , which are unlikely to be observed in the feed are indicated in white color in Figure 7; see also [32].
Additionally, conditional univariate Tromp functions of particle descriptors assigned to glass particles and conditioned on size and shape classes are determined by means of Equation (10). These Tromp functions are visualized in Figure 7 (left and right columns, solid lines). The corresponding conditional univariate probability densities f D A | Ψ [ c , d ] f and f Ψ | D A [ a , b ] f of the area-equivalent diameter and aspect ratio assigned to planar cross-sections of either spheres or fragments are visualized by dashed lines for various intervals [ a , b ] and [ c , d ] , which define size or shape classes on which the probability densities are conditioned.
For computing conditional univariate Tromp functions, particles are classified into three size classes: very fine particles with area-equivalent diameters ranging between 1 and 2   μ m , medium-sized particles with area-equivalent diameters between 2 and 4   μ m and large particles with area-equivalent diameters between 4 and 10   μ m . Similarly, particles are classified into three shape classes: highly elongated particles with aspect ratios in the range between 0.2 and 0.7, medium-elongated particles with aspect ratios between 0.7 and 0.9, and almost non-elongated particles with aspect ratios larger than 0.9 .
Large variations are observed in the recovery probability of hydrophilic glass particles ( C 0 ) in Figure 7 depending on their descriptor vectors. Furthermore, the bivariate Tromp functions display that differently shaped glass particle systems exhibit different separation behaviors (spheres vs. fragments). For glass spheres, predominantly very fine particles with area-equivalent diameters of about 1– 2   μ m have a higher probability of reporting to the concentrate than coarser ones. This is observed over a wide range of aspect ratios for this size fraction, with slightly higher probabilities occurring for smaller aspect ratios. On the other hand, for coarser particles, those with larger aspect ratios are more likely to be recovered. This is also observable in the univariate Tromp functions conditioned on size classes (Figure 7, spheres, left-hand side), as the conditional univariate Tromp function for particles in the small particle class (1– 2   μ m ) takes larger values for spheres with smaller aspect ratios, while for larger aspect ratios, the probability is higher for coarser particle fractions. Similar results can be observed in the univariate Tromp functions conditioned on shape classes, as higher separation probabilities are reported for particles below 2   μ m with low aspect ratios (0.2–0.7), whereas for coarser particles, the conditional univariate Tromp function takes larger values for higher aspect ratios (0.9–1). Nevertheless, the Tromp functions show that the impact of particle size is more pronounced than that of particle shape for the case of ultrafine glass spheres. This behavior follows what has been reported in the literature cited above, i.e., entrainment increases with decreasing particle size, as the particles are more likely to be entrained in the froth lamella due to their low settling velocity.
In the case of glass fragments, a different outcome in the separation behavior is found. For this particle system, coarser fragments are more likely to be recovered than finer ones, which is contrary to what has been observed for glass spheres and what is reported in the literature. This can be seen in both the bivariate Tromp functions (Figure 7, fragments, middle) and the univariate Tromp functions conditioned on shape classes (Figure 7, fragments, right-hand side). Across all shape classes, the conditional univariate Tromp functions for fragments with a small area-equivalent diameter take smaller values compared with those for similarly sized spheres. Furthermore, while the recovery probability for the spheres generally decreases with increasing size, for the fragments, it increases along with the particle size for all shape classes. Additionally, the values of univariate Tromp functions conditioned on size classes for fragments show variations for all size classes depending on the considered aspect ratio, where the highest values are observed for very small and very large aspect ratios. This indicates that the influence of the particle shape on the separation behavior of the fragments is more significant than is the case for the spheres. The observed differences in the recovery probabilities of spheres and fragments are particularly intriguing, as their cumulative recovery as well as associated mass and water pull are quite comparable; see Section 3.1. Hence, an explanation for this behavior cannot be drawn from the classic non-particle-specific flotation evaluations.
Similar to the analysis of the influence of particle shape and size on the entrainment behavior for the hydrophilic glass fraction, the entrainment behavior of magnetite, as the non-floatable fraction, is investigated. Figure 8 displays univariate as well as bivariate Tromp functions regarding area-equivalent diameter and aspect ratio of magnetite particles individually, but separated in a mixture with spherical (top row) and fragmented glass particles (bottom row).
It can be observed from Figure 8 that the behavior of the magnetite particles significantly differs when mixed with spheres compared with fragments. If magnetite is mixed with glass spheres, almost only magnetite with an area-equivalent diameter of about 1– 2   μ m is entrained, whereas only coarser magnetite particles with an area-equivalent diameter of about 3– 7   μ m are recovered when mixed with glass fragments. This strong dependency on the particle size is also observed in the univariate Tromp functions conditioned on shape classes (Figure 8, right-hand side) as these conditional Tromp functions significantly differ depending on which glass particle system magnetite is mixed with. On the other hand, the shape of magnetite does not significantly influence the separation behavior, as only minor variations in univariate Tromp functions for different values of aspect ratios conditioned on size classes for magnetite (Figure 8, left-hand side) are visible.
Based on these results, one could conclude that the differently shaped ultrafine particle fractions (spheres vs. fragments) show a significantly different entrainment behavior. Furthermore, a significant correlation between the behavior of magnetite and the hydrophilic glass particles is observed, as the magnetite behavior is strongly influenced by the particle fraction it is mixed with. However, one has to question the meaningfulness of the results. Therefore, the results obtained from image analysis are cross-checked via laser diffraction [60,61], though only the particle size can be evaluated with this technique. To compare both measurement methods, the probability densities derived from image measurements are transformed into volume-weighted probability densities of particle descriptor vectors. A comprehensive description of this transformation can be found in [32]. Laser diffraction measurements only provide probability densities of descriptor vectors associated with particles in mixtures of glass and magnetite. Without further assumptions, it is not possible to distinguish between glass and magnetite particles based on laser diffraction alone. In contrast, MLA measurements can distinguish between particles composed of different materials. To compare both measurement methods, the information on glass and magnetite particles obtained from image analysis is combined to derive volume-equivalent probability densities of area-equivalent diameter for the mixed particle fractions.
Figure 9 shows the probability densities of area-equivalent diameters associated with mixtures of glass and magnetite, obtained using image analysis for the left and laser diffraction for the right. The resulting univariate Tromp functions computed from volume-weighted probability densities from image analysis of the mixture of glass spheres and magnetite match those of the number-weighed ones shown in Figure 7 and Figure 8, as rather fine particles are recovered more preferably than coarser ones. In the separation experiment with glass fragments, lower recovery probabilities for fine particles can be observed; however the increasing probability for coarser fragments is not as prominent in the volume-weighted probability densities.
On the other hand, the univariate Tromp functions determined by means of laser diffraction measurements reveal a similar behavior for both mixtures, and no clear influence of the particle size on the separation behavior is observed. The comparison of the univariate Tromp functions obtained from laser diffraction with those obtained from image analysis shows that there are some discrepancies between the results from different measurement techniques. This could be due to various reasons. First of all, the techniques themselves work in different ways. Particle size information obtained via laser diffraction refers to the sphere equivalent scattering intensities. On the other hand, image analysis offers insights into particle sizes via the subsequent computation of particle descriptors from said images, i.e., planar surface sections (2D information), which usually leads to underestimated particle sizes. This would indeed result in slightly different results for particle sizes, but at least the resulting trend should be rather similar, which is not the case here. Possible errors could also come from the MLA approach, which includes representative sampling, the sample preparation (embedding the particles into an epoxy resin) and the measurement itself (with special focus on the limitation in resolution), as well as the final computation of the particle descriptors from these images, from which the univariate Tromp functions are derived. Another aspect that has to be considered is the statistical representativness, i.e., determining meaningful areas in the property space of the univariate Tromp function for which a sufficient number of particles with such properties is available. An indication of meaningful areas in separation functions can be obtained by examining conditional probability densities, such as those displayed in Figure 7 and Figure 8. A reliable interpretation of the separation behavior can only be made for regions in which conditional probability densities have significantly large values for specific size and shape classes. For example, in the case of fragments, the probability densities of the feed show that particles with an area-equivalent diameter of around 1.5– 3   μ m and an aspect ratio of around 0.4–0.9 are observed with large frequency and are therefore sufficiently relevant, whereas particles with properties outside of this range are not so frequently found, which introduces uncertainties for the interpretation. For glass spheres, only particles in the feed with an area-equivalent diameter of around 2– 4   μ m and an aspect ratio of around 0.5–0.8 and 0.9–1, see Figure 7 top row, are observed with a sufficient frequency. Therefore, the values of Tromp functions can be considered meaningful in such areas in the property space. In conclusion, it is not called for to come up with a physical explanation of the phenomena right away, especially due to the fact that both hydrophilic components, i.e., glass ( C 0 ) and magnetite, follow order and both show the distinct discrepancy in behavior comparing the glass sphere and the glass fragment system and their Tromp functions regrading size. However, due to the promising possibilities of the multivariate approach, the decision was made to report on those findings here, even though a conclusive explanation cannot be offered, which should be pursued in future research.

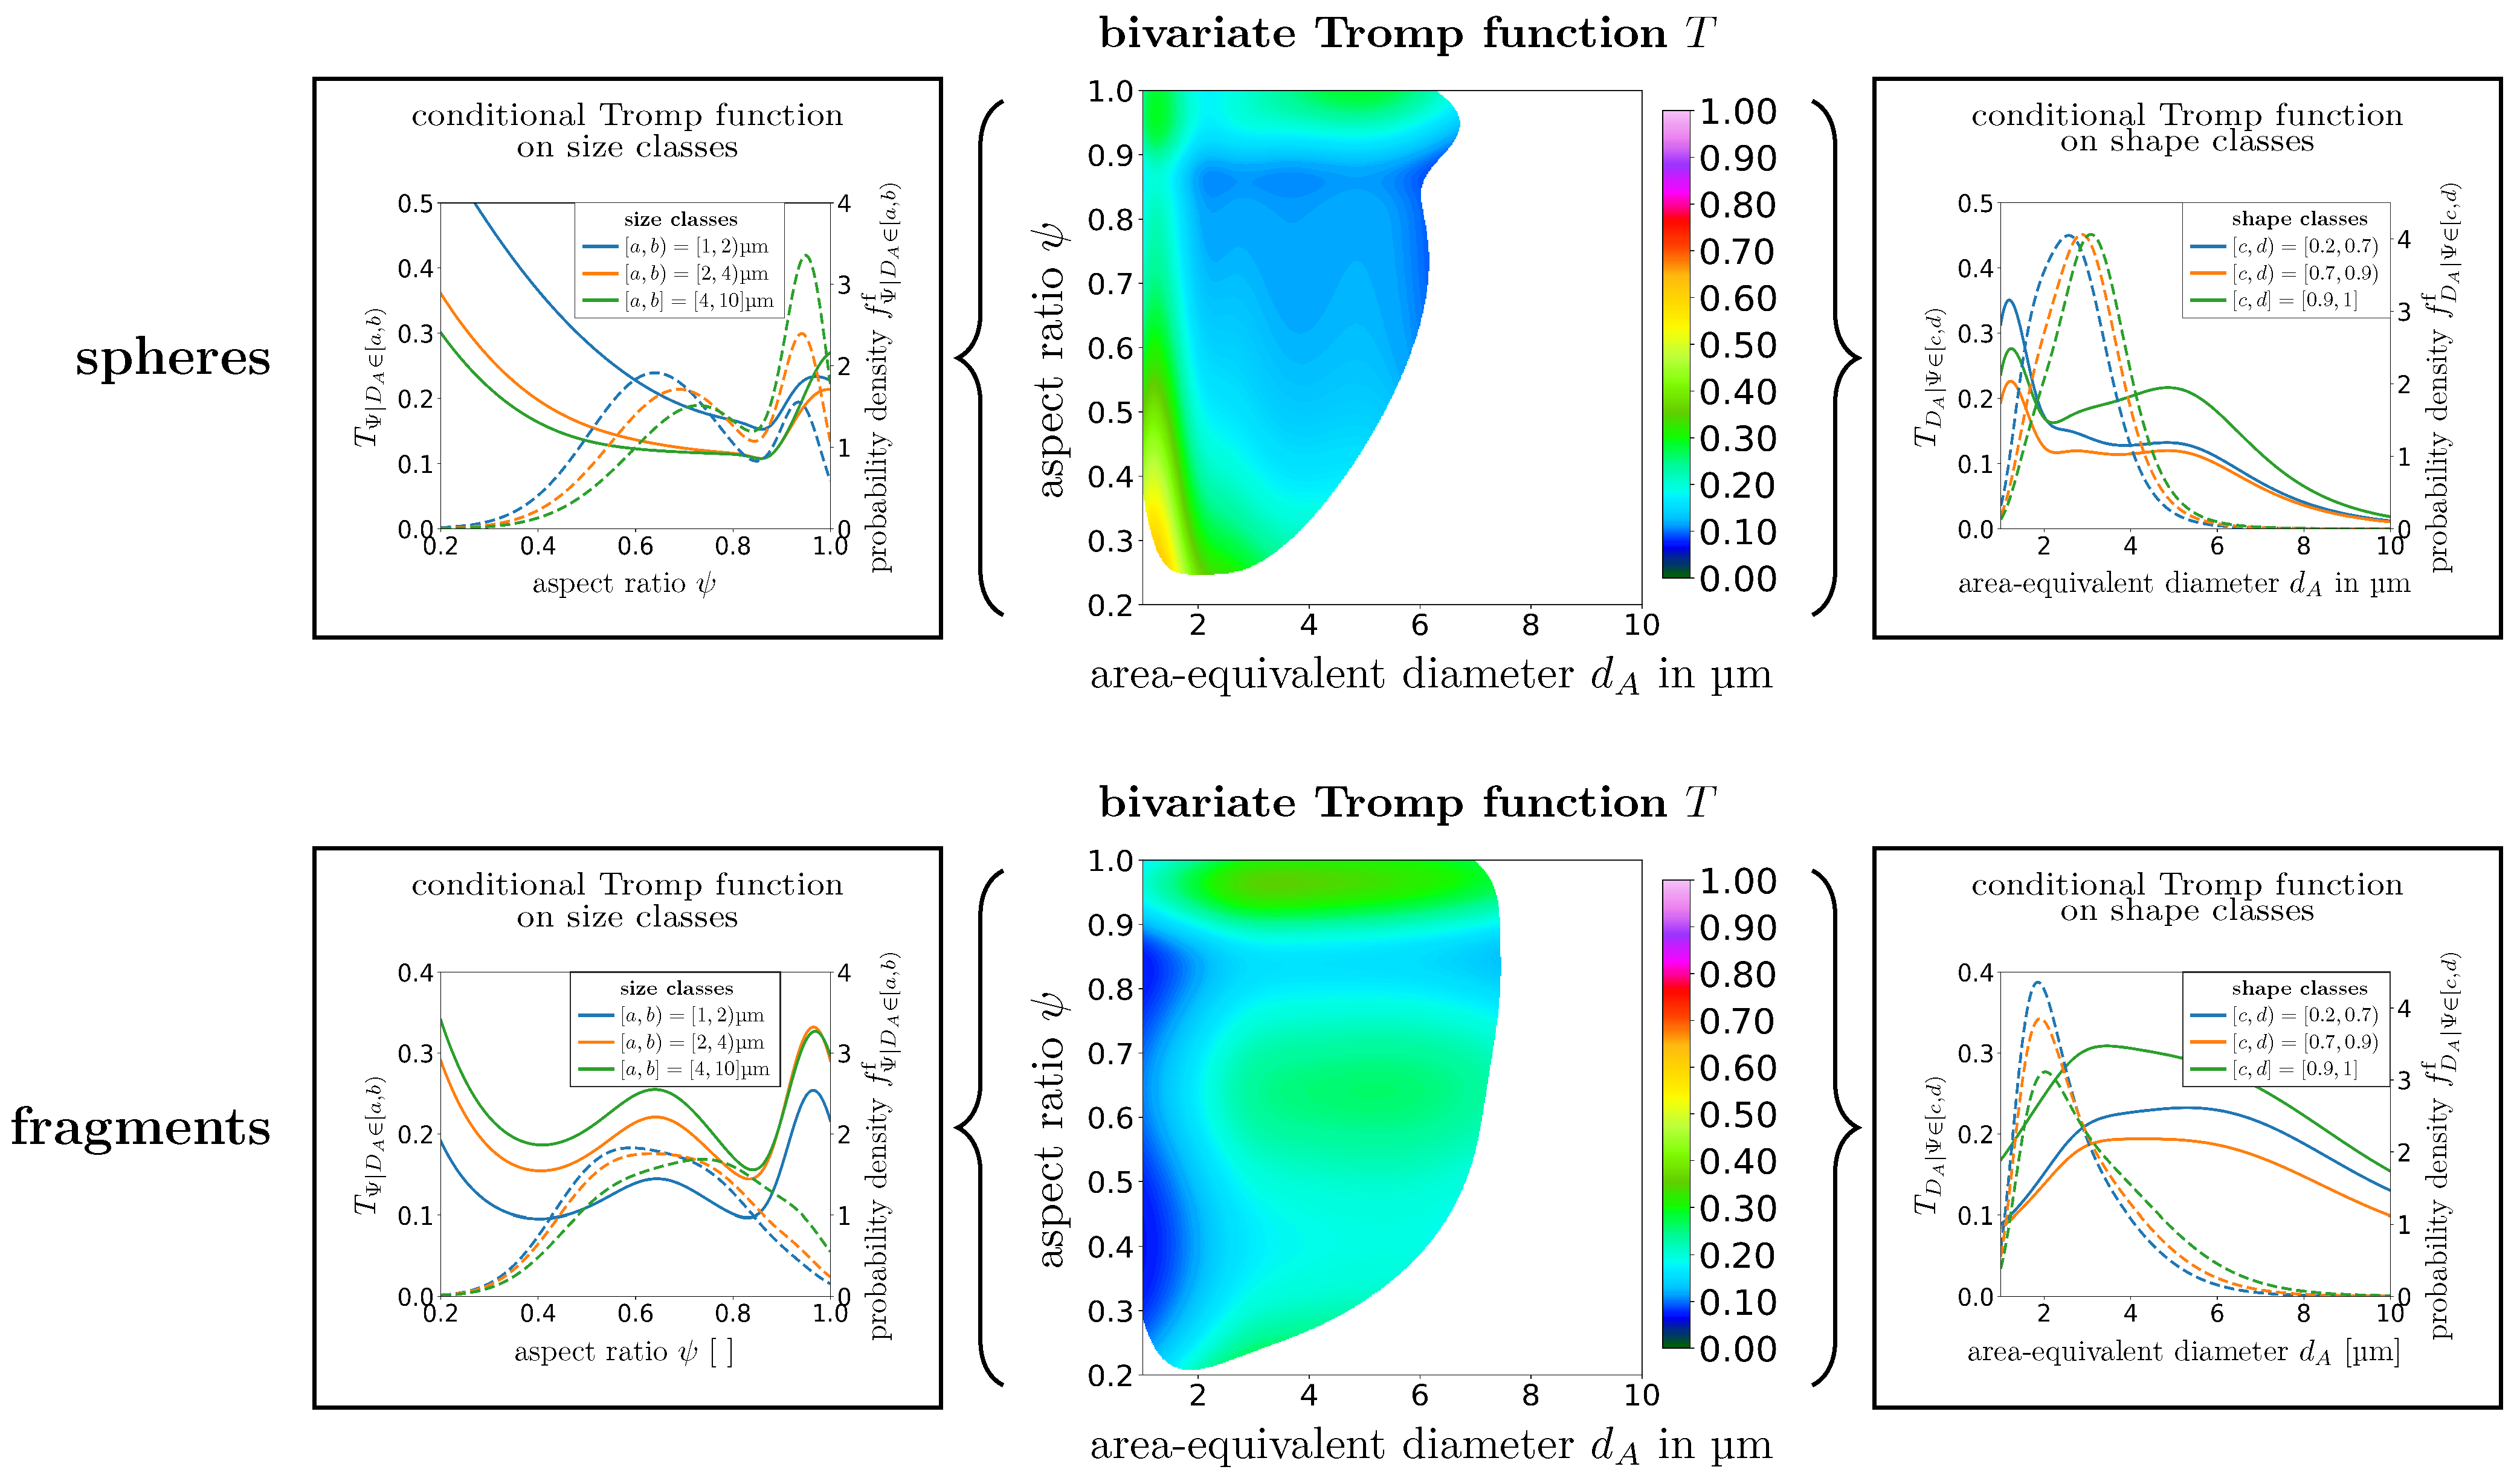
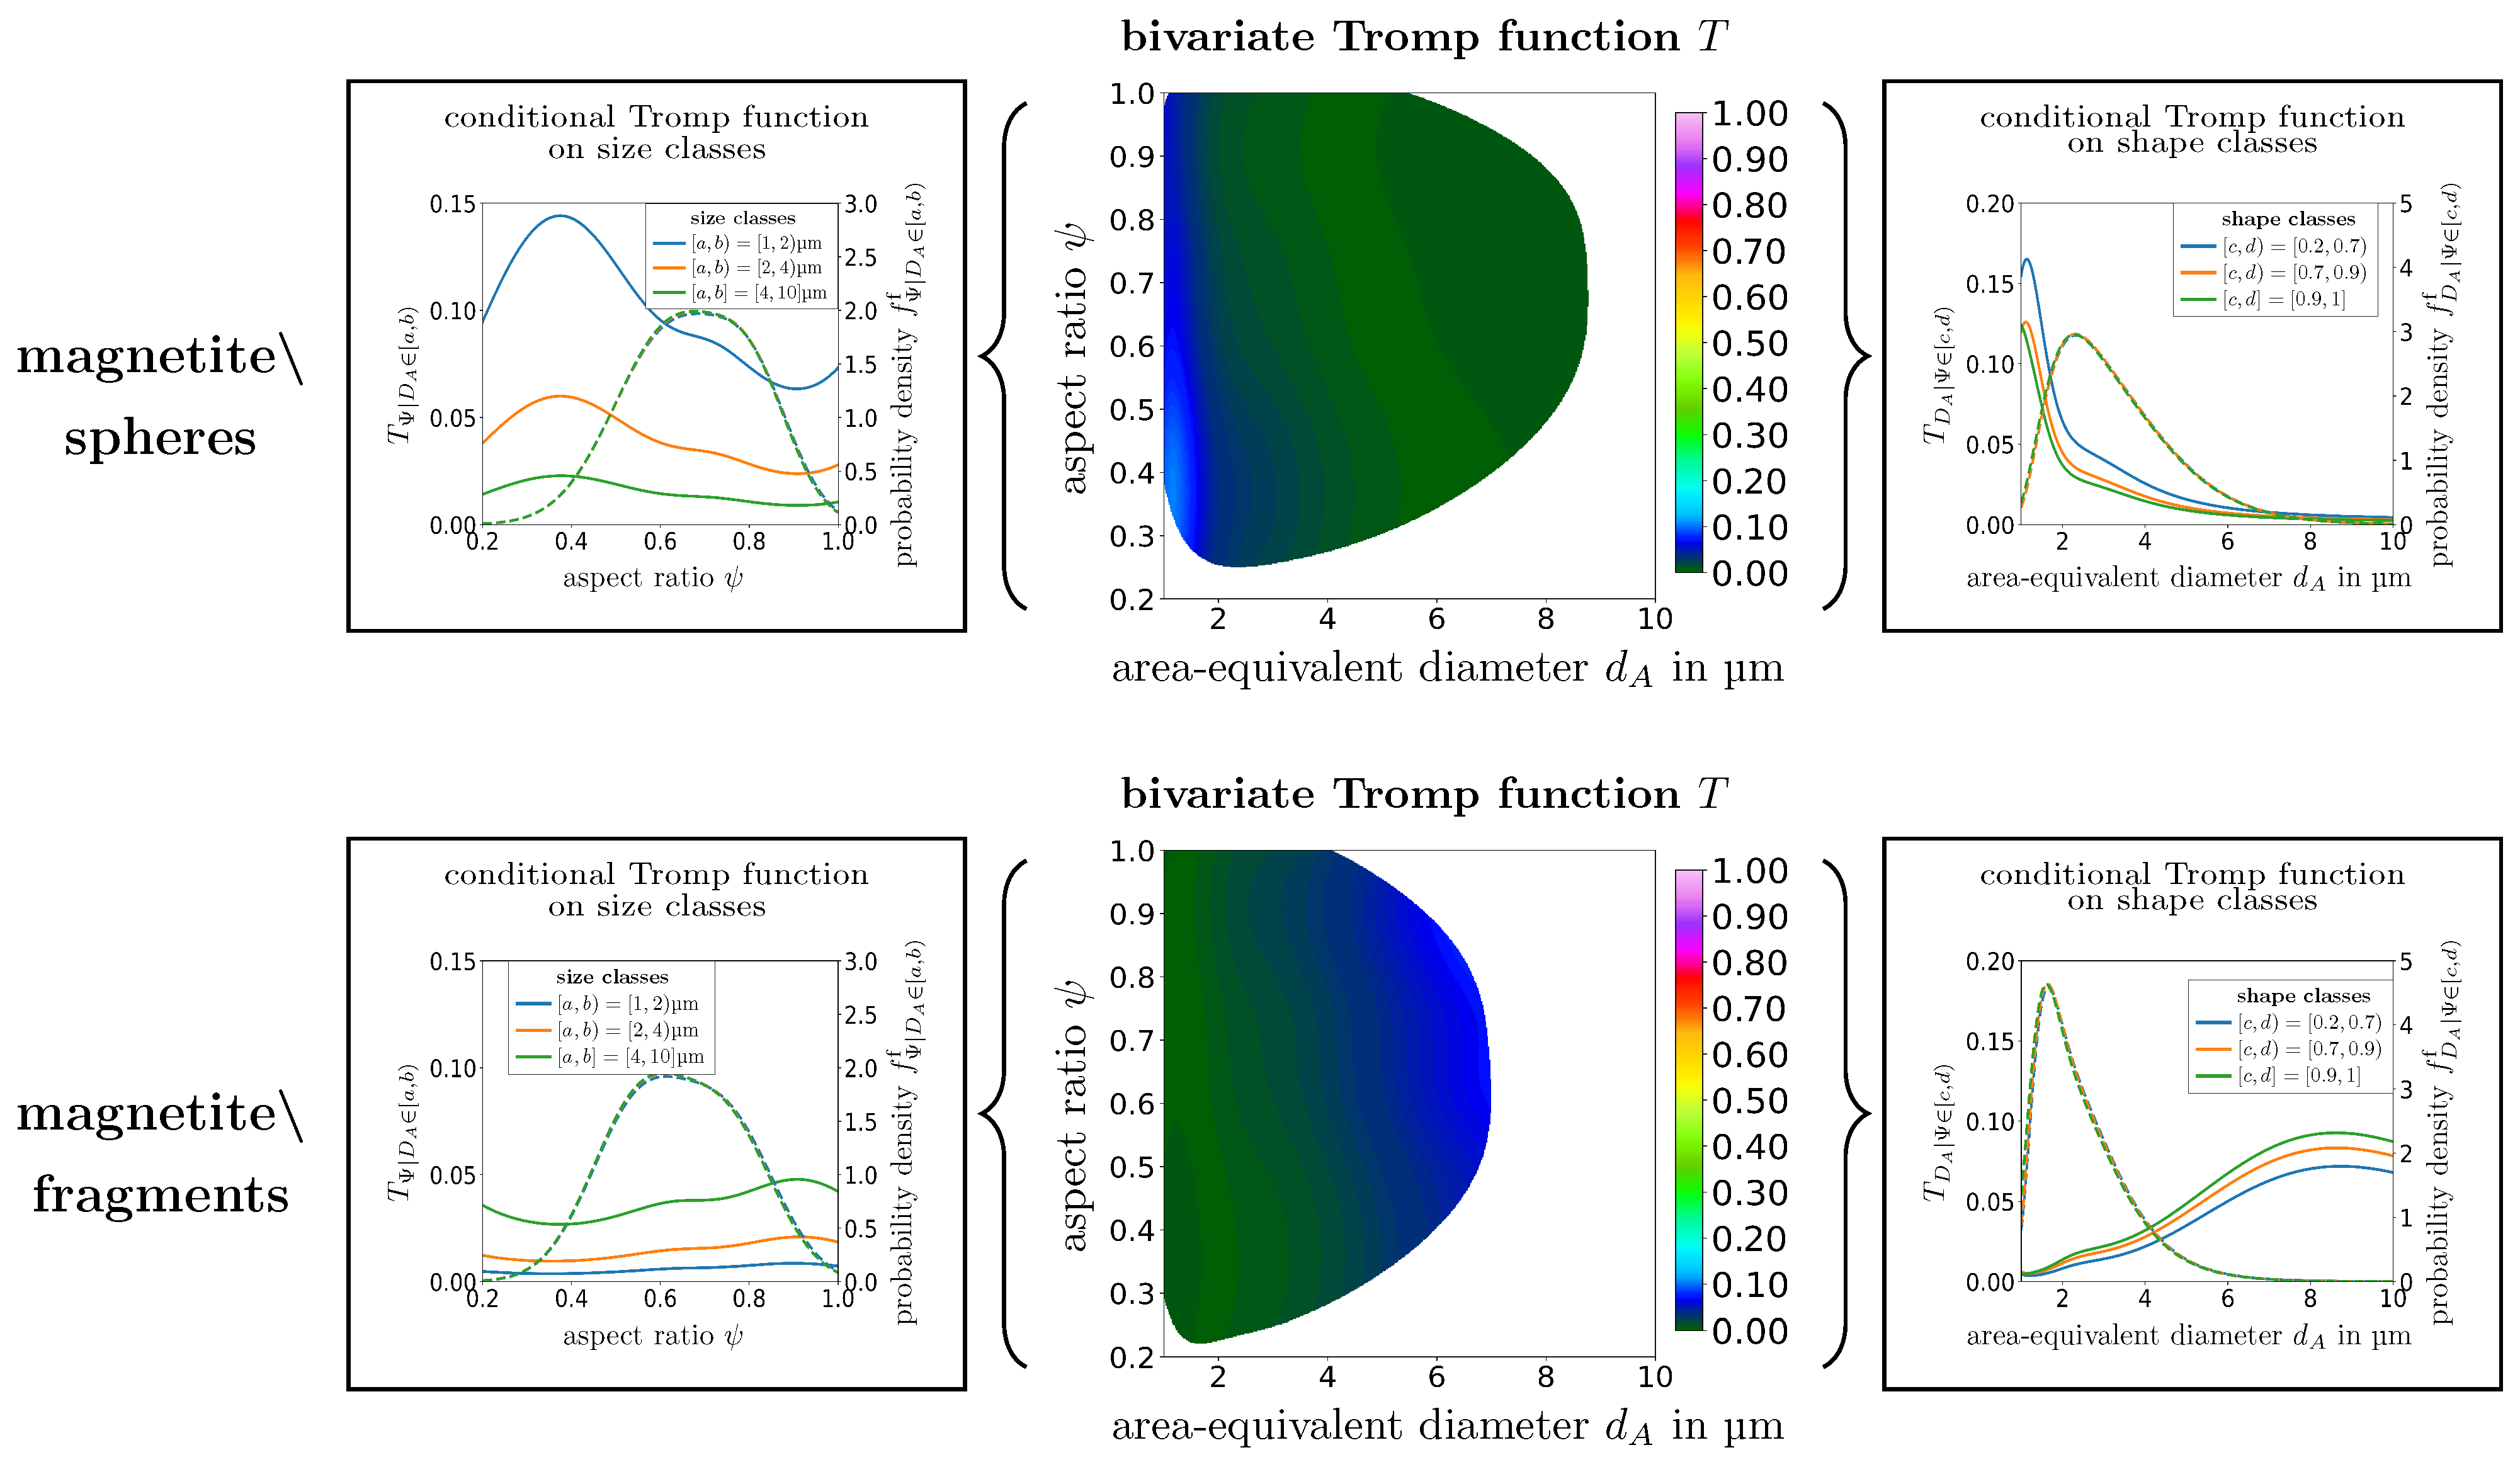
3.3. Influence of Particle Size, Shape and Wettability on the Separation Behavior of Ultrafine Particles

In addition to flotation experiments with purely hydrophilic particle systems, further experiments were conducted with glass particles for which the wettability has been altered; i.e., the particles have been hydrophobized using two different n-alcohols to obtain different hydrophobicity states. In this way, not only the influence of shape and size can be investigated, but also the influence of wettability. The respective bivariate Tromp functions are visualized in Figure 10, showing the results for glass particles only (spheres in the upper row and fragments in the lower row), with hydrophobicity increasing from left to right, i.e., hydrophilic glass particles (left), moderately hydrophobic particles (middle) and strongly hydrophobic particles (right).
From the bivariate Tromp functions in Figure 10, it can be seen that a change in wettability, i.e., an increase in hydrophobicity, influences the resulting recovery probabilities for both glass particle shapes, whereby the effect is observed to a larger extent for glass spheres (significantly larger values of bivariate Tromp functions). Here, the increase in hydrophobicity significantly increases the probability that the glass spheres are recovered in the concentrate, with the highest probabilities of up to 85% being observed for glass spheres- C 6 with an aspect ratio of around 0.3–0.7 and an area-equivalent diameter of around 3– 6   μ m . If the hydrophobicity is increased further, the individual particle properties have a smaller impact on the separation behavior, and the wettability is the dominating separation property. For both hydrophobic fractions of glass spheres, recovery probabilities are higher for coarser particles. This would follow the expected behavior according to the literature cited above [1,2,3], as hydrophobic particles are expected to be recovered via true flotation, i.e., they actually attach to the bubble and are recovered as a particle–bubble aggregate in the froth, which is more efficient for coarser particles. However, a certain degree of entrainment is still expected for these ultrafine particle systems, which might account for the recovery probability of around 30% for the very fine glass spheres (below 2   μ m ), which is similar to that of the purely hydrophilic particle systems.
In the case of glass fragments, the bivariate Tromp functions display a different outcome. While the entrainment probability of hydrophilic fragments is higher for coarser particles, the recovery probability for moderately hydrophobic fragments is slightly higher for finer particles than for coarser ones. Furthermore, no significant influence of the aspect ratio is observed for moderately hydrophobic fragments. Just as for their entrainment behavior (Section 3.2), this is once more not in line with results from the literature [1,2,3], as the recovery by true flotation should be more efficient for coarser particles, which in turn should result in higher probabilities in the bivariate Tromp functions for particles with a larger area-equivalent diameter. One reason for the higher recovery probability of fines could be that the water pull, which correlates positively with the entrainment, of the moderately hydrophobic fragments is much higher than that of the moderately hydrophobic spheres ( 17 % vs. 8 % , respectively at a mass pull of 5 % ). However, the water pull for hydrophilic fragments is even higher, but the bivariate Tromp functions show larger values for coarser particles, which is why this cannot be the sole reason. As already discussed in Section 3.1, the results for the strongly hydrophobic glass fragments do not have the same basis of comparison, as very little mass pull was obtained due to the froth collapse. Here, the bivariate Tromp function shows very low separation probabilities for almost all particles, with slightly higher probabilities for fragments with a very high aspect ratio.
Additionally to the results of glass particles, bivariate Tromp functions regarding area-equivalent diameter and aspect ratio are computed for the hydrophilic magnetite particles, see Figure 11, to investigate if their entrainment behavior is affected by the wettability variations of the glass particles they are mixed with. Here, it has to be kept in mind that only the wettability of the glass particles is changed, whereas the properties of magnetite are not modified in any way, i.e., any changes observed should be due to external factors.
Figure 11 shows that the entrainment probability of magnetite is generally rather low, and its behavior is influenced by changes in the hydrophobicity of the glass particles. The most probable reason for this would be the different froth characteristics, which are strongly influenced by the properties of the particle system. This can be observed, for example, in the water pull, which changes significantly with the feed used, as presented in Section 3.1. While there is a certain influence of the particle size for the purely hydrophilic systems, when the magnetite is mixed with moderately hydrophobic glass spheres or fragments, this influence is not observed anymore as the entrainment probability is more or less the same across all ranges of the considered particle properties. If the magnetite is mixed with strongly hydrophobic glass particles, its entrainment probability is reduced to almost zero, which is most probably a result of the dry froth, i.e., a very low water pull, as less water is available that could drag along the ultrafine magnetite particles.

3.4. Usability of MLA Measurements to Determine Particle-Discrete Descriptor Vectors

This section discusses the usability of MLA measurements as a tool for evaluating particle separation by flotation. In particular, the challenges and limitations of extracting particle shape and size for ultrafine particles from 2D images are addressed.
First, it is important to note that the particle size and shape descriptors (area-equivalent diameter, aspect ratio) utilized in this study may not accurately represent the true 3D structure of the particles, as certain effects are not observable in 2D image data obtained by MLA. For instance, the aspect ratio of some particles can exhibit significant variations depending on the orientation of the particle with respect to the planar section imaged by MLA, introducing a potential bias for the distribution of aspect ratios determined from 2D data. Despite this limitation, these descriptors still provide a level of quantitative structural evaluation for assessing the impact of particle shape and size on their separation behavior. Figure 12 schematically visualizes the size and shape descriptors considered in this paper.
The limitations of using the aspect ratio as a particle descriptor become apparent when examining the structural details of particles, as exemplified in Figure 12 by the third particle from the left. This particular particle, despite having the same aspect ratio as the spherical particle, exhibits significant differences in surface roughness. Such structural nuances could play a crucial role in the attachment behavior of glass particles. Descriptors like the sphericity factor, roundness or angularity [31,62,63,64] might offer a more suitable assessment of particle shape. However, these descriptors are not applicable in the present study due to the inability to accurately compute them from the available image data. Especially, for ultrafine particles involved in the present flotation separation experiments, obtaining the necessary high resolution for assessing shape descriptors poses a significant challenge using MLA measurements. Nevertheless, the elongation of particles should be considered when studying the influence of particle shape on separation behavior, as the particle systems of glass spheres and fragments significantly differ in particle aspect ratio and separation behavior, as discussed in Section 3.2.
Furthermore, the challenge of accurately characterizing the shape of particles, which could capture other structural nuances beyond elongation, is highlighted in Figure 13. Here, a cutout is shown featuring labeled regions of ultrafine glass fragments used in this study and imaged via MLA. Visual inspection already emphasizes the challenge of capturing fine nuances of particle shape beyond elongation. The corresponding size and shape descriptors of each particle are depicted. This offers a visual impression on different particle descriptor values extracted from image data, where it is important to note that particles with an area-equivalent diameter smaller than 1   μ m are excluded from the analysis of MLA images.
Further limitations arise when working with images of ultrafine particles, particularly when extracting particles by the particle-based segmentation procedure described in Section 2.4 and consequently computing probability densities of particle descriptor vectors obtained from these segmentation results, as described in Section 2.6. In Figure 14, bivariate probability densities of area-equivalent diameter and aspect ratio for glass spheres and fragments are presented that have been computed in three different ways. In particular, Figure 14 (left column) shows the probability densities for glass particles obtained from analyzing individual fractions of said particles, i.e., glass particles prior to mixing with magnetite and the subsequent flotation experiments. On the other hand, Figure 14 (middle column) displays the results obtained from analyzing the feed, i.e., by computing a bivariate probability density of descriptor vectors associated with glass particles observed in the MLA data of glass–magnetite mixtures. Recall the numerical issues mentioned in Section 2.8 for computing bivariate Tromp functions with probability densities computed by these methods. Therefore, the probability densities corresponding to the reconstructed feed are computed as a convex combination of probability densities of descriptor vectors associated with glass particles in the concentrate and tailings by means of Equation (8), as detailed in Section 2.8. These probability densities for glass spheres and fragments are visualized in the right column of Figure 14. For both types of glass particles (spheres, fragments), it can be observed that the resulting probability densities of particle descriptor vectors differ for all three procedures, with the largest variations being observed for the individual fractions.
When analyzing the marginal probability densities of area-equivalent diameter and the aspect ratio of the particle systems obtained by MLA data, these differences become even more evident; see Figure 15. This shows that the results obtained from the MLA images depend not only on the mathematical operations applied, but also on the particle system itself. Utilizing image measurements introduces a potential bias due to particles interacting with each other, possibly leading to the agglomeration of particles of different materials and thus the misclassification of particle shapes. This requires additional pre-processing steps for image data to reduce the potential for errors in distinguishing between agglomerates and single particles, especially in ultrafine particle systems. Particularly, when applying a particle-based segmentation as described in Section 2.4 to a specific material without considering other materials, agglomeration between different materials is not taken into account. On the other hand, directly applying a particle-based segmentation to MLA measurements without first obtaining a phase-based segmentation results in a much larger amount of agglomerates being observed in the image data. Segmentation of ultrafine particles within agglomerates poses a significant challenge, which is addressed in Section 2.4, but it could be further improved to apply more advanced image pre-processing and segmentation tools. This indicates that the MLA measurements considered in this study may not accurately represent the particle systems, introducing a potential bias in the results regarding the analysis of separation behavior determined from image data in the case of ultrafine particles. Nevertheless, the results presented in this paper allow for a quantitative characterization of flotation results and could serve as a starting point for further investigations regarding the influence of particle morphology on the separation behavior.

4. Conclusions

This study addresses the application of bivariate Tromp functions as a tool for investigating the influence of particle descriptor vectors of size, shape and wettability on the separation of ultrafine particles via froth flotation. Six different ultrafine feed systems were used in the separation experiments, in which the floatable fraction was either glass spheres or glass fragments with different levels of wettability, mixed with hydrophilic magnetite as the gangue material. Bivariate Tromp functions were computed based on MLA images of the feed, and the flotation products and reveal quite some variations in the resulting recovery probabilities depending on the particle system used. The bivariate Tromp functions for glass spheres seem to be rather sensitive with respect to the investigated descriptors of particle size and shape as well as the induced change of hydrophobicity. On the other hand, the bivariate Tromp functions obtained for glass fragments show a rather different behavior. This is quite unexpected, as the results for grade and recovery as well as mass and water pull do not exhibit these kinds of variations. Investigations regarding the influence on the entrainment behavior of the hydrophilic glass systems show that the spheres follow the behavior commonly described in the literature, as their entrainment probability increases with decreasing particle size. Hydrophilic fragments, however, follow the opposite trend. The use of laser diffraction to double-check the results obtained regarding the particle size influence did not confirm those obtained from MLA images. Reasons for this could be errors in the MLA measurement procedure, the 2D limitation of MLA on imaging planar sections of particles or the computation of the considered particle descriptor vectors from these images. The latter is especially challenging in the case of ultrafine particle systems, as the MLA has limitations regarding the resolution. This also limits the accessibility of certain particle descriptors, which might be more meaningful to investigate regarding their effect on flotation. One way to overcome the 2D limitation of MLA measurements is to use 3D computed tomography to obtain 3D particle information. However, this method also has some drawbacks when analyzing large datasets, such as the small field of view and the associated high measurement effort. Therefore, the determination of geometric properties of 3D structures from 2D image data, e.g., by applying machine learning methods based on so-called GANs [65,66], will be addressed in future work. Although the MLA might not be the most suitable method for analyzing ultrafine particles, the application of bivariate Tromp functions for the multidimensional evaluation of separation processes provides an innovative approach that helps to gain deeper insights into the particle behavior in complex separation processes such as froth flotation.

Author Contributions

Conceptualization, J.S., T.W., O.F., M.R. and V.S.; methodology, J.S. and T.W.; software, T.W.; data curation, J.S. and K.B.; writing—original draft preparation, J.S., T.W. and O.F.; writing—review and editing, J.S., T.W., O.F., K.B., M.R. and V.S.; visualization, J.S. and T.W.; supervision, O.F., M.R. and V.S.; project administration, M.R. and V.S.; funding acquisition, M.R. and V.S. All authors have read and agreed to the published version of the manuscript.

Funding

This research is partially funded by the German Research Foundation (DFG) via the research projects RU 2184/1-2, SCHM 997/27-2 and SCHM 997/45-1 within the priority programs SPP 2045, “Highly specific and multidimensional fractionation of fine particle systems with technical relevance”, and SPP 2315, “Engineered artificial minerals (EnAM)—A geo-metallurgical tool to recycle critical elements from waste streams”.

Informed Consent Statement

Not applicable.

Data Availability Statement

The datasets generated and/or analyzed during the current study are available from the corresponding authors upon reasonable request.

Acknowledgments

The authors would like to thank Nora Stefenelli for conducting flotation experiments as part of her Bachelor thesis at the processing department, as well as Robert Möckel and Doreen Ebert of the Helmholtz Institute Freiberg for resource technology for XRD analysis.

Conflicts of Interest

The authors declare no conflicts of interest. The funders had no role in the design of the study; in the collection, analyses, or interpretation of data; in the writing of the manuscript; or in the decision to publish the results.

Abbreviations

The following abbreviations are used in this manuscript:
C 0 Pristine, unesterified hydrophilic particles
C 6 Hydrophobized particles using the primary alcohol 1-hexanol
C 10 Hydrophobized particles using the primary alcohol 1-decanol
m k g Mass function
ρ k g / m 3Mass density of particles
V ¯ m 3 Expected volume of particles
n Number of particles
W Sampling window of image data
P Two-dimensional cross-section of a particle
d A m Area-equivalent particle diameter
D A m Random area-equivalent particle diameter
d min m Minimum Feret particle diameter
d max m Maximum Feret particle diameter
A m 2 Area
B Bounding box of a 2D particle cross-section
ψ Particle aspect ratio
Ψ Random particle aspect ratio
f Number-weighted probability density function
w Mixing parameter of a bimodal probability density function
F Number-weighted cumulative distribution function of f
f D A Univariate number-weighted probability density function of D A
f Ψ Univariate number-weighted probability density function of Ψ
f D A , Ψ Bivariate probability density function of D A and Ψ
f Ψ | D A Conditional probability density function of Ψ given D A
T Tromp function
T Ψ | D A Conditional Tromp function of D A given Ψ
n | D A [ a , b ] Number of particles given that D A [ a , b ]
f Feed
c Concentrate
t Tailing

Appendix A

Appendix A.1. Additional Information on Particle-Wise Segmentation

Table A1. The number of particles observed in the MLA images for various particle systems, different wettability experiments ( C 0 , C 6 , C 10 ) and for concentrate or tailings. The corresponding number of particles excluded after particle-based segmentation (where the area-equivalent diameter of the particles is smaller than 1   μ m or larger than 10   μ m ) is provided in brackets.
Wettability Experiment
Particle System C 0 C 6 C 10
spheresconcentrate:252,522 (3128)402,105 (3877)366,878 (3015)
tailing:18,223 (163)5715 (80)3114 (96)
fragmentsconcentrate:299,724 (2131)463,711 (3017)139,505 (847)
tailing:12,677 (220)15,593 (158)22,623 (200)
magnetite\spheresconcentrate:263,301 (11,831)137,235 (6756)20,252 (1102)
tailing:220,400 (3302)118,529 (4292)130,600 (4443)
magnetite\fragmentsconcentrate:565,991 (8426)326,359 (7847)28,028 (896)
tailing:121,782 (4646)196,805 (2892)236,174 (3575)

Appendix A.2. Parametric Families of Probability Densities and Copulas Used for the Parametric Modeling Approach

Table A2. Parametric families of univariate probability densities f θ : R [ 0 , ) used later on in Section 3.2 and Section 3.3 for the fitting of bivariate densities.
Parametric FamilyProbability Density
normal f θ ( x ) = 1 2 π σ 2 e ( x μ ) 2 2 σ 2 , θ = ( μ , σ ) R × ( 0 , )
log-normal f θ ( x ) = 1 2 π σ 2 x 2 e ( log ( x ) log ( μ ) ) 2 2 σ 2 1 ( 0 , ) ( x ) , θ = ( μ , σ ) R × ( 0 , )
gamma f θ ( x ) = 1 b k Γ ( k ) x k 1 e x b 1 ( 0 , ) ( x ) , θ = ( k , b ) ( 0 , ) 2
beta f θ ( x ) = Γ ( α + β ) Γ ( α ) Γ ( β ) x α 1 ( 1 x ) β 1 1 ( 0 , 1 ) ( x ) , θ = ( α , β ) ( 0 , ) 2
Table A3. Parametric copula families used later on in Section 3.2 and Section 3.3 for fitting the bivariate probability densities.
Parametric FamilyCopula Density
Clayton c θ ( u 1 , u 2 ) = ( θ + 1 ) ( u 1 u 2 ) ( θ 1 ) ( u 1 θ + u 2 θ 1 ) 2 θ + 1 θ , θ ( 0 , )
Frank c θ ( u 1 , u 2 ) = θ ( 1 e θ ) e θ ( u 1 + u 2 ) 1 e θ ( 1 e θ u 1 ) ( 1 e θ u 2 ) , θ ( 0 , )
Gumbel c θ ( u 1 , u 2 ) = 2 u 1 u 2 e ( ( log ( u 1 ) ) θ + ( log ( u 2 ) ) θ ) 1 θ , θ ( 1 , )
Joe c θ ( u 1 , u 2 ) = 1 ( 1 ( 1 ( 1 u 1 ) θ ( 1 ( 1 u 2 ) θ ) ) ) 1 θ , θ [ 1 , )

Appendix A.3. Computation of Conditional Univariate Tromp Functions

As discussed in Section 2.9, the conditional univariate Tromp function T Ψ | D A [ a , b ] : [ 0 , 1 ] [ 0 , 1 ] with respect to the random particle descriptor Ψ , provided that D A [ a , b ] , is given by
T Ψ | D A [ a , b ] ( ψ ) = n | D A [ a , b ] c n | D A [ a , b ] f f Ψ | D A [ a , b ] c ( ψ ) f Ψ | D A [ a , b ] f ( ψ ) , if f Ψ | D A [ a , b ] f ( ψ ) > 0 , 0 , if f Ψ | D A [ a , b ] f ( ψ ) = 0 ,
for each ψ [ 0 , 1 ] . The problem in application is that the ratio of the number of particles in the concentrate and feed, conditioned on the size or shape classes, cannot be directly obtained just like the yield in Equation (6) for unconditional bivariate Tromp functions. There is a lack of information on the mass of particles in different size or shape classes, which cannot be computed directly from image data, making it challenging to directly compute the yield for conditional univariate Tromp functions. To address this problem, recall that n c denotes the number of particles in the concentrate and that the probability that the cross-section of a random particle in the concentrate has an area-equivalent diameter D A in the interval [ a , b ] can be approximated by a b f D A c ( d A ) d d A , where f D A c denotes the corresponding probability density of particles in the concentrate. Then, the number of particles n | D A [ a , b ] c in the concentrate can be approximated, whose cross-sections have an area-equivalent diameter in the interval [ a , b ] by n | D A [ a , b ] c n c a b f D A c ( d A ) d d A . Analogously for the feed, one obtains n | D A [ a , b ] f n f a b f D A f ( d A ) d d A . Using these approximations, it is obtained that
n | D A [ a , b ] c n | D A [ a , b ] f n c n f a b f D A c ( d A ) d d A a b f D A f ( d A ) d d A ,
where the yield n c / n f is determined by means of Equation (6) and the values of the integrals on the right-hand side of (A2) can be computed by numerical integration of the marginal probability densities f D A c and f D A f , obtained from fitting these probability densities to image measurements as described in Section 2.6.1.
Taking into account the results, which have been obtained in (9) and (A2), leads to an approximation for the conditional Tromp function T Ψ | D A [ a , b ] considered in Equation (A1), i.e.,
T Ψ | D A [ a , b ] ( ψ ) n c n f a b f D A , Ψ c ( d A , ψ ) d d A a b f D A , Ψ f ( d A , ψ ) d d A , if a b f D A , Ψ f ( d A , ψ ) d d A > 0 , 0 , if a b f D A , Ψ f ( d A , ψ ) d d A = 0 ,
for each ψ [ 0 , 1 ] , where the bivariate probability densities f D A , Ψ f and f D A , Ψ c of particle descriptor vectors associated with particles in the feed and concentrate are computed as described in Section 2.8. Therefore, in applications, conditional univariate Tromp functions can be computed utilizing Equation (A3).

References

  1. Trahar, W.J. A rational interpretation of the role of particle size in flotation. Int. J. Miner. Process. 1981, 8, 289–327. [Google Scholar] [CrossRef]
  2. Schubert, H. Aufbereitung fester Stoffe, Band II: Sortierprozesse; Deutscher Verlag für Grundstoffindustrie: Stuttgart, Germany, 1996. [Google Scholar]
  3. Wills, B.A.; Finch, J.A. Wills’ Mineral Processing Technology: An Introduction to the Practical Aspects of Ore Treatment and Mineral Recovery; Butterworth-Heinemann: Boston, MA, USA, 2016. [Google Scholar]
  4. Trahar, W.J.; Warren, L.J. The flotability of very fine particles—A review. Int. J. Miner. Process. 1976, 3, 103–131. [Google Scholar] [CrossRef]
  5. Miettinen, T.; Ralston, J.; Fornasiero, D. The limits of fine particle flotation. Miner. Eng. 2010, 23, 420–437. [Google Scholar] [CrossRef]
  6. De Gontijo, C.F.; Fornasiero, D.; Ralston, J. The limits of fine and coarse particle flotation. J. Chem. Eng. 2007, 85, 739–747. [Google Scholar] [CrossRef]
  7. Konopacka, Z.; Drzymala, J. Types of particles recovery—Water recovery entrainment plots useful in flotation research. Adsorption 2010, 16, 313–320. [Google Scholar] [CrossRef]
  8. Leistner, T.; Peuker, U.A.; Rudolph, M. How gangue particle size can affect the recovery of ultrafine and fine particles during froth flotation. Miner. Eng. 2017, 109, 1–9. [Google Scholar] [CrossRef]
  9. Dai, Z.; Fornasiero, D.; Ralston, J. Particle-bubble collision models—A review. Adv. Colloid Interface Sci. 2000, 85, 231–256. [Google Scholar] [CrossRef]
  10. Koh, P.T.L.; Hao, F.P.; Smith, L.K.; Chau, T.T.; Bruckard, W.J. The effect of particle shape and hydrophobicity in flotation. Int. J. Miner. Process. 2009, 93, 128–134. [Google Scholar] [CrossRef]
  11. Vaziri Hassas, B.; Caliskan, H.; Guven, O.; Karakas, F.; Cinar, M.; Celik, M.S. Effect of roughness and shape factor on flotation characteristics of glass beads. Colloids Surfaces Physicochem. Eng. Asp. 2016, 492, 88–99. [Google Scholar] [CrossRef]
  12. Verrelli, D.I.; Bruckard, W.J.; Koh, P.T.L.; Schwarz, M.P.; Follink, B. Particle shape effects in flotation. Part 1: Microscale experimental observations. Miner. Eng. 2014, 58, 80–89. [Google Scholar] [CrossRef]
  13. Xia, W. Role of particle shape in the floatability of mineral particle: An overview of recent advances. Powder Technol. 2017, 317, 104–116. [Google Scholar] [CrossRef]
  14. Lu, S.; Pugh, R.J.; Forssberg, E. Interfacial Separation of Particles; Elsevier: Amsterdam, The Netherlands, 2005. [Google Scholar]
  15. Chen, Y.; Zhuang, L.; Zhang, Z. Effect of particle shape on particle-bubble interaction behavior: A computational study using discrete element method. Colloids Surfaces A Physicochem. Eng. Asp. 2022, 653, 13003. [Google Scholar] [CrossRef]
  16. Kursun, H.; Ulusoy, U. Influence of shape characteristics of talc mineral on the column flotation behavior. Int. J. Miner. Process. 2006, 78, 262–268. [Google Scholar] [CrossRef]
  17. Sygusch, J.; Stefenelli, N.; Rudolph, M. Ultrafine particle flotation in a concept flotation cell combining turbulent mixing zone and deep froth fractionation with a special focus on the property vector of particles. Minerals 2023, 13, 1099. [Google Scholar] [CrossRef]
  18. Little, L.; Wiese, J.; Becker, M.; Mainza, A.; Ross, V. Investigating the effects of particle shape on chromite entrainment at a platinum concentrator. Miner. Eng. 2016, 96–97, 46–52. [Google Scholar] [CrossRef]
  19. Kupka, N.; Tolosana-Delgado, R.; Schach, E.; Bachmann, K.; Heinig, T.; Rudolph, M. R as an environment for data mining of process mineralogy data: A case study of an industrial rougher flotation bank. Miner. Eng. 2020, 146, 106111. [Google Scholar] [CrossRef]
  20. Wiese, J.; Becker, M.; Yorath, G.; O’Connor, C. An investigation into the relationship between particle shape and entrainment. Miner. Eng. 2015, 83, 211–216. [Google Scholar] [CrossRef]
  21. Albijanic, B.; Ozdemir, O.; Nguyen, A.V.; Bradshaw, D. A review of induction and attachment times of wetting thin films between air bubbles and particles and its relevance in the separation of particles by flotation. Adv. Colloid Interface Sci. 2010, 159, 1–21. [Google Scholar] [CrossRef]
  22. Drelich, J.W.; Marmur, A. Meaningful contact angles in flotation systems: Critical analysis and recommendations. Surf. Innov. 2017, 6, 19–30. [Google Scholar] [CrossRef]
  23. Johansson, G.; Pugh, R.J. The influence of particle size and hydrophobicity on the stability of mineralized froths. Int. J. Miner. Process. 1992, 9, 1–21. [Google Scholar] [CrossRef]
  24. Ata, S.; Ahmed, N.; Jameson, G.J. A study of bubble coalescence in flotation froths. Int. J. Miner. Process. 2003, 72, 255–266. [Google Scholar] [CrossRef]
  25. Aveyard, R.; Binks, B.P.; Fletcher, P.D.I.; Peck, T.G.; Rutherford, C.E. Aspects of aqueous foam stability in the presence of hydrocarbon oils and solid particles. Adv. Colloid Interface Sci. 1994, 48, 93–120. [Google Scholar] [CrossRef]
  26. Dippenaar, A. The destabilization of froth by solids. I. The mechanism of film rupture. Int. J. Miner. Process. 1982, 9, 1–14. [Google Scholar] [CrossRef]
  27. Ata, S. Phenomena in the froth phase of flotation—A review. Int. J. Miner. Process. 2012, 102–103, 1–12. [Google Scholar] [CrossRef]
  28. Farrokhpay, S. The significance of froth stability in mineral flotation—A review. Adv. Colloid Interface Sci. 2011, 166, 1–7. [Google Scholar] [CrossRef] [PubMed]
  29. Kaptay, G. On the optimum contact angle of stability of foams by particles. Adv. Colloid Interface Sci. 2012, 170, 87–88. [Google Scholar] [CrossRef] [PubMed]
  30. Ata, S.; Ahmed, N.; Jameson, G.J. The effect of hydrophobicity on the drainage of gangue minerals in flotation froths. Miner. Eng. 2004, 17, 897–901. [Google Scholar] [CrossRef]
  31. Furat, O.; Leißner, T.; Bachmann, K.; Gutzmer, J.; Peuker, U.A.; Schmidt, V. Stochastic modeling of multidimensional particle characteristics using parametric copulas. Microsc. Microanal. 2019, 25, 720–734. [Google Scholar] [CrossRef] [PubMed]
  32. Wilhelm, T.; Sygusch, J.; Furat, O.; Bachmann, K.; Rudolph, M.; Schmidt, V. Parametric stochastic modeling of particle descriptor vectors for studying the influence of ultrafine particle wettability and morphology on flotation-based separation behavior. Powders 2023, 2, 353–371. [Google Scholar] [CrossRef]
  33. Schach, E.; Buchmann, M.; Tolosana-Delgado, R.; Leißner, T.; Kern, M.; van den Boogaart, K.G.; Rudolph, M.; Peuker, U.A. Multidimensional characterization of separation processes–Part 1: Introducing kernel methods and entropy in the context of mineral processing using SEM-based image analysis. Miner. Eng. 2019, 137, 78–86. [Google Scholar] [CrossRef]
  34. Leißner, T.; Bachmann, K.; Gutzmer, J.; Peuker, U.A. MLA-based partition curves for magnetic separation. Miner. Eng. 2016, 94, 94–103. [Google Scholar] [CrossRef]
  35. Pereira, L.; Frenzel, M.; Hoang, D.H.; Tolosana-Delgado, R.; Rudolph, M.; Gutzmer, J. Computing single-particle flotation kinetics using automated mineralogy data and machine learning. Miner. Eng. 2021, 170, 107054. [Google Scholar] [CrossRef]
  36. Pereira, L.; Frenzel, M.; Khodadadzadeh, M.; Tolosana-Delgado, R.; Gutzmer, J. A self-adaptive particle-tracking method for minerals processing. J. Clean. Prod. 2021, 279, 123711. [Google Scholar] [CrossRef]
  37. Scott, D.W. Multivariate Density Estimation: Theory, Practice, and Visualization; J. Wiley & Sons: Hoboken, NJ, USA, 2015. [Google Scholar]
  38. Schubert, H. Aufbereitung Fester Mineralischer Rohstoffe, Band I; Deutscher Verlag für Grundstoffindustrie: Stuttgart, Germany, 1989. [Google Scholar]
  39. Sygusch, J.; Rudolph, M. A contribution to wettability and wetting characterisation of ultrafine particles with varying shape and degree of hydrophobization. Appl. Surf. Sci. 2021, 566, 150725. [Google Scholar] [CrossRef]
  40. Heinig, T.; Bachmann, K.; Tolosana-Delgado, R.; van den Boogaart, K.; Gutzmer, J. Monitoring gravitational and particle shape settling effects on MLA sample preparation. In Proceedings of the 17th annual conference of the International Association of Mathematical Geosciences, Freiberg, Germany, 5–13 September 2015; pp. 200–206. [Google Scholar]
  41. Fandrich, R.; Gu, Y.; Burrows, D.; Moeller, K. Modern SEM-based mineral liberation analysis. Int. J. Miner. Process. 2007, 84, 310–320. [Google Scholar] [CrossRef]
  42. Schulz, B.; Sandmann, D.; Gilbricht, S. SEM-based automated mineralogy and its application in geo- and material sciences. Minerals 2020, 10, 1004. [Google Scholar] [CrossRef]
  43. Bachmann, K.; Frenzel, M.; Krause, J.; Gutzmer, J. Advanced identification and quantification of in-bearing minerals by scanning electron microscope-based image analysis. Microsc. Microanal. 2017, 23, 527–537. [Google Scholar] [CrossRef]
  44. Roerdink, J.B.T.M.; Meijster, A. The watershed transform: Definitions, algorithms and parallelization strategies. Fundam. Informaticae 2001, 41, 187–228. [Google Scholar] [CrossRef]
  45. Soille, P. Morphological Image Analysis: Principles and Applications; Springer: Berlin/Heidelberg, Germany, 2003. [Google Scholar]
  46. Chiu, S.N.; Stoyan, D.; Kendall, W.S.; Mecke, J. Stochastic Geometry and its Applications; J. Wiley & Sons: Hoboken, NJ, USA, 2013. [Google Scholar]
  47. Furat, O.; Leissner, T.; Ditscherlein, R.; Ondřej, S.; Weber, M.; Bachmann, K.; Gutzmer, J.; Peuker, U.A.; Schmidt, V. Description of ore particles from X-Ray microtomography (XMT) images, supported by scanning electron microscope (SEM)-based image analysis. Microsc. Microanal. 2018, 24, 461–470. [Google Scholar] [CrossRef]
  48. VolkerH/feret_diameter.py. Available online: https://gist.github.com/VolkerH/0d07d05d5cb189b56362e8ee41882abf (accessed on 16 August 2022).
  49. Held, L.; Bové, D.S. Applied Statistical Inference: Likelihood and Bayes; Springer: Berlin/Heidelberg, Germany, 2014. [Google Scholar]
  50. Akaike, H. Information theory and an extension of the maximum likelihood principle. In Selected Papers of Hirotugu Akaike; Springer: Berlin/Heidelberg, Germany, 1998; pp. 199–213. [Google Scholar]
  51. Nelsen, R. An Introduction to Copulas; Springer: Berlin/Heidelberg, Germany, 2006. [Google Scholar]
  52. Joe, H. Dependence Modeling with Copulas; CRC Press: Boca Raton, FL, USA, 2014. [Google Scholar]
  53. Ditscherlein, R.; Furat, O.; de Langlard, M.; de Souza e Silva, J.M.; Sygusch, J.; Rudolph, M.; Leißner, T.; Schmidt, V.; Peuker, U.A. Multi-scale tomographic analysis for micron-sized particulate samples. Microsc. Microanal. 2020, 26, 676–688. [Google Scholar] [CrossRef]
  54. Frank, U.; Wawra, S.E.; Pflug, L.; Peukert, W. Multidimensional particle size distributions and their application to nonspherical particle systems in two dimensions. Part. Part. Syst. Charact. 2019, 36, 1800554. [Google Scholar] [CrossRef]
  55. Buchmann, M.; Schach, E.; Tolosana-Delgado, R.; Leißner, T.; Astoveza, J.; Möckel, R.; Ebert, D.; Rudolph, M.; van de Boogaart, K.G.; Peuker, U.A. Evaluation of magnetic separation efficiency on a Cassiterite-Bearing Skarn ore by means of integrative SEM-based image and XRF–XRD data analysis. Minerals 2018, 8, 390. [Google Scholar] [CrossRef]
  56. Kun, P., II. Fundamentals of Probability and Stochastic Processes with Applications to Communications; Springer: Berlin/Heidelberg, Germany, 2017. [Google Scholar]
  57. Szczerkowska, S.; Wiertel-Pochopien, A.; Zawala, J.; Larsen, E.; Kowalczuk, P.B. Kinetics of froth flotation of naturally hydrophobic solids with different shapes. Miner. Eng. 2018, 121, 90–99. [Google Scholar] [CrossRef]
  58. Rahimi, M.; Dehghani, F.; Rezai, B.; Aslani, M.R. Influence of the roughness and shape of quartz particles on their flotation kinetics. Int. J. Miner. Process. 2012, 19, 284–289. [Google Scholar] [CrossRef]
  59. Schwarz, S.; Grano, S. Effect of particle hydrophobicity on particle and water transport across a flotation froth. Colloids Surfaces A Physicochem. Eng. Asp. 2005, 256, 157–164. [Google Scholar] [CrossRef]
  60. Xu, R. Particle Characterization: Light Scattering Methods; Springer: Berlin/Heidelberg, Germany, 2001. [Google Scholar]
  61. Merkus, H.G. Particle Size Measurements: Fundamentals, Practice, Quality; Springer: Berlin/Heidelberg, Germany, 2009. [Google Scholar]
  62. Zheng, J.; Hryciw, R. Traditional soil particle sphericity, roundness and surface roughness by computational geometry. Geotechnique 2015, 65, 494–506. [Google Scholar] [CrossRef]
  63. Tafesse, S.; Fernlund, J.M.R.; Sun, W.; Bergholm, F. Evaluation of image analysis methods used for quantification of particle angularity. Sedimentology 2013, 60, 1100–1110. [Google Scholar] [CrossRef]
  64. Stachowiak, G.W. Particle angularity and its relationship to abrasive and erosive wear. Wear 2000, 241, 214–219. [Google Scholar] [CrossRef]
  65. Kench, S.; Cooper, S.J. Generating three-dimensional structures from a two-dimensional slice with generative adversarial network-based dimensionality expansion. Nat. Mach. Intell. 2021, 3, 299–305. [Google Scholar] [CrossRef]
  66. Fuchs, L.; Kirstein, T.; Mahr, C.; Furat, O.; Baric, V.; Rosenauer, A.; Maedler, L.; Schmidt, V. Using convolutional neural networks for stereological characterization of 3D hetero-aggregates based on synthetic STEM data. arXiv 2023, arXiv:2310.18523. [Google Scholar] [CrossRef]
Figure 1. SEM images of glass spheres (left), glass fragments (middle) and magnetite (right).
Powders 03 00020 g001
Figure 2. Schematic diagram (left) and actual lab setup (right) of the MultiDimFlot separation apparatus used for the flotation experiments in this study.
Powders 03 00020 g002
Figure 3. Bivariate probability densities representing particle descriptors of shape (aspect ratio) and size (area-equivalent diameter) for glass spheres (left), glass fragments (middle) and magnetite (right).
Powders 03 00020 g003
Figure 4. Fuerstenau upgrading curves showing the cumulative recovery of ultrafine glass particles against the cumulative recovery of ultrafine magnetite for the flotation experiments with MultiDimFlot using glass spheres (left) and fragments (right) with the three different wettability states: hydrophilic, C 0 (red), moderately hydrophobic, C 6 (blue), and strongly hydrophobic, C 10 (green). The recovery is defined as the amount of recovered material in the concentrate in relation to its amount in the feed and is presented cumulatively over all concentrates.
Powders 03 00020 g004
Figure 5. Cumulative mass of the glass particle fractions versus water pull diagrams for the flotation experiments with MultiDimFlot using glass spheres (left) and fragments (right) as the floatable fraction with the three different wettability states: hydrophilic, C 0 (red), moderately hydrophobic, C 6 (blue), and strongly hydrophobic, C 10 (green). Ultrafine magnetite was used as the non-floatable fraction for all flotation experiments. The results are presented cumulatively over all concentrates. A linear trend between mass and water pull can indicate a recovery by entrainment (e.g., for spheres- C 0 ), whereas a non-linear trend as the one observed for spheres- C 10 (green line) can indicate a recovery by true flotation.
Powders 03 00020 g005
Figure 6. Cumulative mass pull of the magnetite fraction versus water pull diagrams for the flotation experiments with MultiDimFlot using glass spheres (left) and fragments (right) as the floatable fraction with the three different wettability states: hydrophilic, C 0 (red), moderately hydrophobic, C 6 (blue), and strongly hydrophobic, C 10 (green), all mixed with ultrafine magnetite as the non-floatable fraction. The results are presented cumulatively over all concentrates.
Powders 03 00020 g006
Figure 7. Bivariate Tromp functions for unesterified hydrophilic spherical (upper row) and fragmented (lower row) glass particles (mixed with magnetite as feed for flotation experiments). Univariate Tromp functions conditioned on size and shape classes are visualized to the left and right of the corresponding bivariate Tromp function by solid lines. Univariate probability densities of area-equivalent diameter f D A | Ψ [ c , d ] f and the aspect ratio f Ψ | D A [ a , b ] f conditioned on shape and size classes of glass particles in the feed, e.g., for small particles with area-equivalent diameter in the range of [ a , b ) = [ 1 , 2 )   μ m or non-elongated particles with an aspect ratio in the range of [ c , d ] = [ 0.9 , 1 ] , are illustrated by dashed lines, respectively.
Powders 03 00020 g007
Figure 8. Bivariate Tromp functions for magnetite particles, mixed with unesterified spherical (upper row) and fragmented (lower row) glass particles as feed. The most apparent dark green color corresponds to a probability of T = 0 . Univariate Tromp functions conditioned on size and shape classes are visualized to the left and right of the corresponding bivariate Tromp function by solid lines. The univariate probability densities f D A | Ψ [ c , d ] f and f Ψ | D A [ a , b ] f of the area-equivalent diameter and aspect ratio, conditioned based on the shape and size classes of magnetite particles in the feed, e.g., for small particles with area-equivalent diameter in the range of [ a , b ) = [ 1 , 2 )   μ m or non-elongated particles with an aspect ratio in the range of [ c , d ] = [ 0.9 , 1 ] , are visualized by dashed lines.
Powders 03 00020 g008
Figure 9. Univariate Tromp functions (blue) and volume-weighted probability densities of area-equivalent diameter for feed (red), concentrate (orange) and tailings (green), determined by means of image analysis (left) and laser diffraction (right) for mixtures of differently shaped glass particles (spheres and fragments) with magnetite. Solid lines represent results obtained for mixtures of fragments with magnetite; while dashed lines represent results determined for mixtures of spheres with magnetite.
Powders 03 00020 g009
Figure 10. Bivariate Tromp functions for spherical (upper row) and fragmented (lower row) glass particles with different wettability states: unesterified hydrophilic ( C 0 , left column), moderately hydrophobic ( C 6 , middle column) and strongly hydrophobic ( C 10 , right column) glass particles.
Powders 03 00020 g010
Figure 11. Bivariate Tromp functions for magnetite mixed with spherical (upper row) and fragmented (lower row) glass particles with different wettability states: unesterified hydrophilic ( C 0 , left column), moderately hydrophobic ( C 6 , middle column) and strongly hydrophobic ( C 10 , right column) glass particles. The most apparent dark green color corresponds to a separation probability of T ( x ) = 0 for a descriptor vector x [ 0 , ) × [ 0 , 1 ] .
Powders 03 00020 g011
Figure 12. Illustration of size and shape descriptors. The area-equivalent diameter d A and aspect ratio ψ of four different particles observed in planar sections are computed. Recall that the area-equivalent diameter d A of a particle’s cross-section corresponds to the diameter of a circle with the same area, whereas the aspect ratio ψ measures the elongation of the particle. In particular, small values of ψ indicate elongated particles, whereas particles with an aspect ratio close to 1 are non-elongated.
Powders 03 00020 g012
Figure 13. False color cutouts of MLA measurements for glass fragments, which depict labeled regions that correspond to observed particles in the image data. For each particle, its respective aspect ratio (left) and area-equivalent diameter (right) are highlighted. Particles with an area-equivalent diameter smaller than 1   μ m are excluded in the analysis of MLA measurements.
Powders 03 00020 g013
Figure 14. Bivariate probability densities of particle descriptor vectors consisting of area-equivalent diameter and aspect ratio associated with differently shaped glass particles (top: spheres; bottom: fragments). These densities are computed from MLA measurements of the individual fraction (left column) and the feed as mixed with magnetite (middle column), as well as being recomputed from concentrate and tailings (right column), as detailed in Section 2.8.
Powders 03 00020 g014
Figure 15. Marginal probability densities of area-equivalent diameter (left column) and aspect ratio (right column) associated with differently shaped glass particles (top: spheres, bottom: fragments). The densities are computed from MLA measurements of the individual glass fraction (blue line), the feed as mixed with magnetite obtained from image measurements (orange line) and recomputed from concentrate and tailings (green line), as detailed in Section 2.8.
Powders 03 00020 g015
Table 1. Static contact angles with the accompanying 95 % confidence intervals of glass slides in their pristine unesterified state ( C 0 ) and esterified with 1-hexanol ( C 6 ) and 1-decanol ( C 10 ), measured via the sessile drop method using water. The glass slides have the same chemical composition as the glass particles and were treated identically.
Wettability ExperimentContact Angle in °
C 0 38.3 ± 0.6
C 6 87.3 ± 1.2
C 10 105.3 ± 0.4
Disclaimer/Publisher’s Note: The statements, opinions and data contained in all publications are solely those of the individual author(s) and contributor(s) and not of MDPI and/or the editor(s). MDPI and/or the editor(s) disclaim responsibility for any injury to people or property resulting from any ideas, methods, instructions or products referred to in the content.

