1. Introduction
Filtration using depth filters is a commonly used process in gas particle technology for separating a dispersed phase from a continuous phase. It is used in a wide variety of applications, such as air conditioning and process gas purification. The separation efficiency as well as the pressure drop are key values for the evaluation of the operation. The latter is an indicator of the energy consumption of the filtration process. The pressure drop over the filter rises when particle material is deposits on the individual fibers of the filter. As the filtration process progresses, a gradient of deposited particulate material appears, as particles tend to deposit in the upper layers of the filter and in the interstices at the beginning of the filtration process, blocking the path for particles later in the filtration process. As the deposition of particulate material on the surface of the filter increases because the area through which the aerosol can flow is reduced, the pressure drop massively increases. Once the pressure drop reaches a critical point, the filter must be replaced. In the field of depth filtration, the cleaning or re-cleaning of used filter media is not common. As such, it is desirable to design a filtration process that maximizes the duration of energy-efficient and low-waste operation while maintaining a high degree of separation. In filtration, as in many other areas of technology and society, the desire for greater sustainability has led to a growing need to improve existing processes with regard to the use of resources such as filter media and filter life. To accomplish this, it has been suggested that a more homogeneous loading of the filter with particulate material can be achieved by transferring particulate material from the upper to the lower layers. The fibers in the matrix are to be stretched, resulting in weakened particle structures that can be easily transferred to the deeper, free filter layers. Understanding the mechanisms involved in the process is crucial to effectively apply these novel process approaches and ideas. Specifically, in the context of detaching previously deposited particulate material through stretching of the substrate (collector), knowledge of micromechanics and factors that promote or hinder filtration are necessary.
The feasibility of detaching particle structures in the filtration-relevant inflow area has been demonstrated in experimental studies conducted by Poggemann et al. [
1]. In contrast to Löffler’s study, detachment was initiated by stretching the collector [
2] followed by an air stream in the velocity range of a filtration process. Further studies tackled the impact of inflow velocity, particle loading level, and stretching velocity on the rearrangement and detachment of particle material [
1,
3]. The experiments demonstrated that particles exhibit a distinct breakup behavior on the fiber and particle detachment depends heavily on inflow velocity. Additionally, it was demonstrated that fiber stretching effectively serves as an initiator for the rearrangement and detachment of separated particle structures.
The aim of this study is to focus on the possible influence of the moving collector (stretched fiber) on the fundamental processes within the deposited particle arrangement. The idea of a moving active collector (substrate) is a groundbreaking notion and has not yet been investigated in this manner using a discrete element method (DEM) simulation. Based on the experimental observations and results obtained from the stretching of a particle-loaded single fiber, the DEM simulations and subsequent post-processing analysis promise to provide a detailed understanding of micromechanical processes such as the emerging of cracks (crack distance) and detachment (numbers of contacts) of particles occurring within the particle structure.
For the sake of completeness, an external computational fluid dynamic (CFD) coupling has been established to simulate the impact of an external force in the form of a continuous air flow on particle structure in advanced designs. This coupling roughly demonstrates the effect on the detachment of particles of this shape. The overall objective is to develop a filtration process that maintains high separation efficiency while maximizing the duration of energy-efficient operation. This will be achieved by understanding the mechanisms of particle rearrangement and detachment within a depth filter, supported by simulations based on the DEM.
The DEM simulation, like most numerical methods, thus eliminates some of the disadvantages of the experimental studies. In the performed stretching experiments, deviations from uniform and distinct behavior can result from uncertainties in the stretching or loading experiment. Micromechanical processes or tasks cannot always be realized or observed due to their size, as well as due to the enormous financial or material effort. In the case of break-up or detachment of the particle structure, there may be unknown influences due to the polydisperse particle material, defects in the particle loading, unwanted charging effects, and defects due to non-uniform strain. Remedies in these cases can usually be model–theoretical approaches that use DEM to simulate the observed effects in experiments based on physical principles. Such simulations allow for an in-depth analysis of microscopic processes, granting unfettered entry to a broad spectrum of quantities, including distributions of forces and contacts within the particle structure, without requiring expensive measurement techniques. However, to accurately represent the relevant mechanisms of the breakage processes due to stretching, thorough consideration must be given to the applied models, assumptions, and boundary conditions in the DEM simulation. This critical aspect will continually be emphasized within the context of this article. In the field of particle structure separation and detachment, there are relatively few studies utilizing only the DEM method. This is partly due to the previous sole focus on the CFD analysis of the filtration process and on the separation of particles on the filter fiber. The primary aim of previous studies was the prediction and evaluation of the functional performance of fiber arrangements and the filtration efficiency in detail.
Therefore, Lehmann et al. [
4] and Braschke et al. [
5] only used CFD simulations to describe these fundamental deposition processes. In addition to experimental studies of deposition, Lehmann et al. modeled the buildup of the particle structure on single fibers using only CFD simulations. They restricted themselves exclusively to deposition in the inertial range and the aid of the barrier effect at a Stokes number greater than 0.5 and a single fiber diameter of 30 μm. The authors found in their simulations that the deposition efficiency, taking into account the rebound and the effects of the particle structures on the flow, only initially changes with the deposited particle mass and remains constant thereafter [
4]. Braschke et al. utilized a comparable technique that integrated an in-house-developed immersed boundary method, representing deposited particles as arbitrarily shaped STL geometries, with CFD [
5]. Their research concentrated on estimating the detachment velocity as a function of the porosity and contact distance of the deposits. Moreover, various advantages of DEM have led to extensive research in both the literature and experimentation on the deposition of particles onto individual fibers [
5].
Schilling’s work conducted simulations of particle deposition on individual fibers. By applying the Euler–Lagrange method in CFD as well as a combination of CFD and DEM simulations, the researcher observed the movement of particles in structures that had already been deposited [
6]. To understand in detail what happens in the structure during deposition and agglomeration, the DEM is suitable because it can be used to model different types of particle contacts and movement.
Li et al. discussed the advancements in the DEM to describe the motion, deposition, and agglomeration of many adherent spherical particles in flows, commonly referred to as adherent particulate flow [
7]. The study compared various models of motion, including Lagrangian particle methods such as molecular dynamics or Brownian motion. It examined models for adhesive contact forces and torques under various adhesive effects such as van der Waals forces and fluid bridges. Various types of particle–field interactions were discussed, including fluid forces and electric field forces. In addition, application examples such as the relevant deposition pattern (morphology) of particle structures on a fiber were discussed [
7].
In further studies, Li et al., employed the DEM in 3D simulations to study the deposition and aggregation of microparticles on a single fiber of an array [
8]. The simulation considered the JKR theory of elastic adhesive contacts [
9].
Their simulations predicted dendrite formation and identified three stages: initial trapping, trapping at the fiber, and full dendrite trapping. A dimensionless adhesion parameter significantly affected the predicted particle deposition rate. A reduction in the viscosity or velocity of the fluid enhanced particle capture, although the effect of changes in the Reynolds number of the flow was dependent on other parameters [
8].
In the aforementioned literature, the collector is always idealized by one or more cylindrical fibers with a fix distance of several hundred microns. In real applications, however, the fibers are not ordered as a perfect matrix, which is why Hesse et al. focused their studies on the interaction and influence of the properties of the particle material on the state of the collector [
10]. The authors used a new approach in their DEM simulations, which only required measurable material properties to implement the elastic and plastic properties for particle deformation without the need for any adjustment in the simulation. In a second part, the DEM model was coupled with a CFD simulation to explore the packing density, fluid pressure, and contact forces within a clogged filter cake of cellulose–lactose pellets [
10]. Due to the plastic deformation of the filter cake, a strong increase in pressure on the filtration membrane beneath it was shown.
The listed studies demonstrate the advantages of using DEM and CFD simulations to investigate the micromechanical processes of particle deposition and detachment. Therefore, the focus of this work is to utilize this potential to describe the dominant effects of the stretching-induced break-up of separated particle structures on a filtration fiber and perform a detailed analysis of cracks for the first time.
2. Materials and Methods
2.1. Filter Fiber and Particulate Material
In previous investigations, experiments concerning the behavior of separation and detachment were conducted on a single fiber [
1,
3]. Also in this study, a single particle loading on a single fiber was used comparatively with the simulations. The fiber was composed of polyurethane and had a diameter of 82 μm in the unstretched state. The material of the fiber allowed for stretching up to 75%. A constriction was given with a Poisson’s ratio of 0.327. Prior to clamping, the fibers were in a crimped state. The clamped length of the fiber was 53 mm, of which only 16 mm were loaded with particle material in the loading process. The fiber clamping device incl. the fiber was cleaned with isopropanol and compressed air. Any contamination by fat or particulate material was avoided.
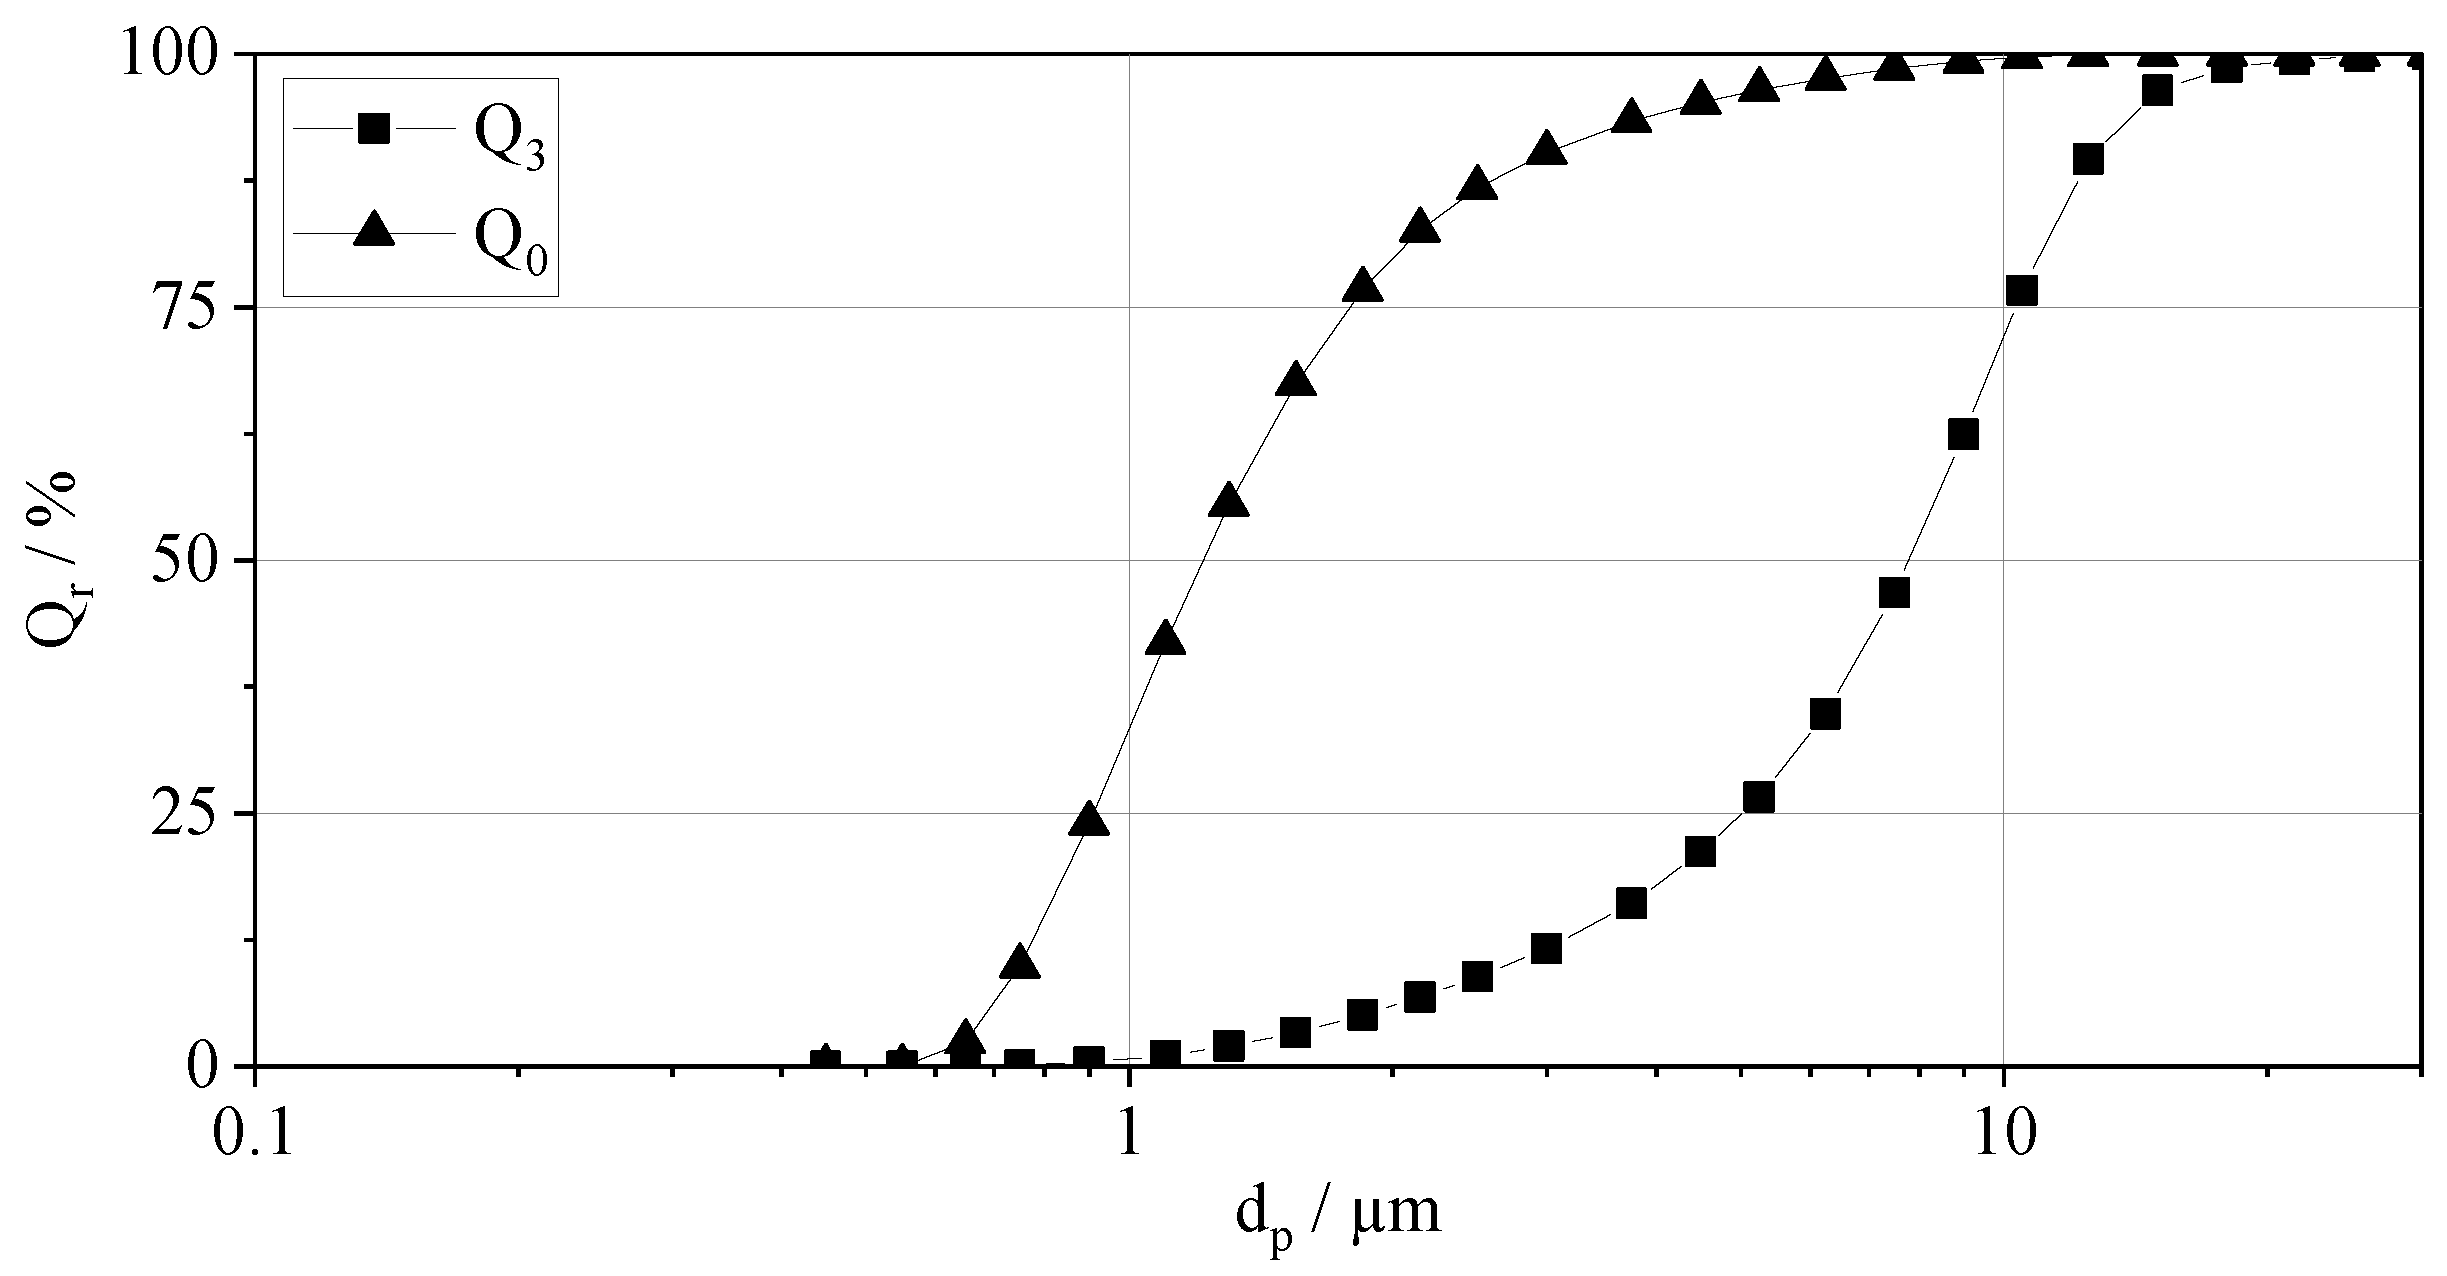
Inert and polydisperse Spheriglass5000CP00 (Potters Industries LLC, Malvern, PA, USA), was used as the particle material. The glass particles have a refractive index of
= 1.51. The same material was used by Zoller et al. and Poggemann et al. in previous studies [
1,
11]. The particle size distribution was measured externally with a laser-scattering device and can be seen in
Figure 1. The volume-based median diameter
=
μm was quoted for the calculation of the characteristic ratios.
2.2. Loading Procedure
Figure 2 illustrates a schematic of the loading procedure of the fiber array. An aerosol with a volumetric flow rate of
L/min, referred to as the feed flow, was generated by employing the SAG 410/U apparatus manufactured by Topas. This aerosol generator has been previously used in investigations performed by Zoller et al. [
11], Wang et al. [
12], and Papapostolou et al. [
13].
To achieve uniform particle dispersion, particulate matter was extracted from a steel ring using a venturi nozzle. It is necessary to maintain continuous monitoring and a consistent scraper height to prevent any interruptions or irregularities in the particle loading process. Additionally, the aerosol underwent neutralization via a 85Kr-neutralizer.
Subsequently, a loading flow was extracted from the feed flow, while the excess flow was discharged. The particulate material was removed by a high-efficiency particulate air (HEPA) filter. The loading flow was then directed through an inlet pipe (inner diameter 16 mm) passing through a flow rectifier (tube bundle). This flow was subsequently introduced into the loading chamber in free jet flow, where it separated on the fiber. Downstream of the loading chamber, a HEPA filter was used to catch any remaining particulate material. Precise control of the loading flow rate was accomplished using a mass flow controller (MFC).
Table 1 presents a comprehensive summary of key parameters, including the volume flow for the corresponding air flow velocity, as well as important dimensionless numbers such as Reynolds (
), Stokes (
), and Péclet (
) parameters, the interception parameter (
R), and the bounce parameter (
). Within the experimental context, the initial formation of a compact particle structure at the upstream fiber’s zenith was successfully attained. Furthermore, visual inspection of the separated structure revealed a progressive dispersion of this particle structure along the lateral surface of the fiber (see
Figure 3).
A particle structure was formed on the zenith of the fiber. The size of the particle structure is a function of the duration of the loading procedure (at a constant concentration in the loading flow). The data in
Table 1 reveal a resulting compact structure on the fiber. As described in [
14], the morphology of a compact structure is characterized by the position close to the fiber’s stagnation point. Furthermore, the structure grows vertically in the direction of the air flow. Consequently, when viewed sideways, the height of the structure becomes the key parameter for assessing its development and condition.
Determining the exact mass of deposited particles is challenging due to limited quantity and potential disturbances, such as the deposition of particle material on the fiber clamping device. However, a successful gravimetric evaluation of the deposited particle mass evolution was achieved when considering an array of fibers, as shown in [
15].
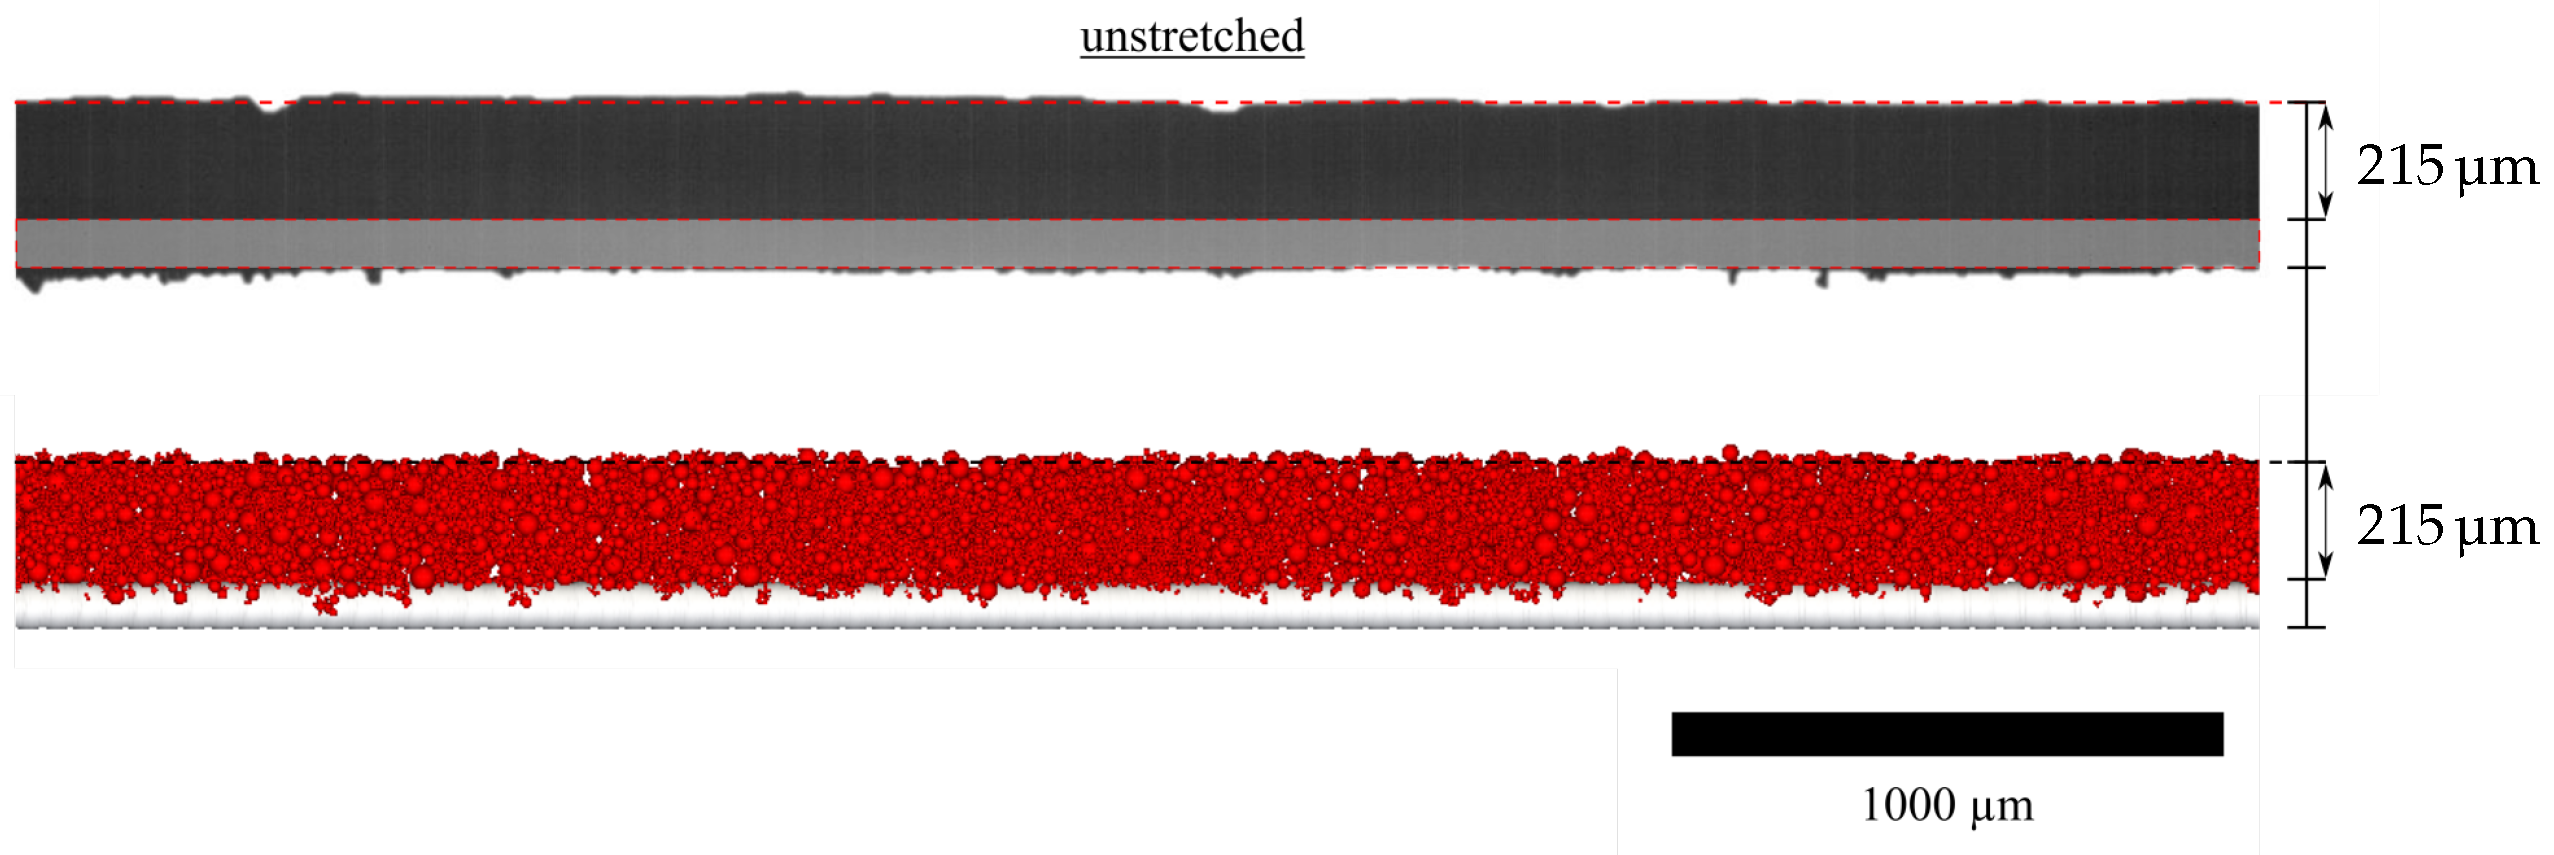
In our experimental setup, we observed the height of the particle structure using sideways cameras (
Figure 3 top). This measurement is calculated as the distance between the top edge of the fiber in its unloaded state and the top edge of the particle structure before the stretching process. This measurement can be converted into a metric value using a scale, akin to crack spacing. Because we employed a single deposition condition in this study, we assumed its constancy. The initial mean height obtained from the deposition conditions listed in
Table 1 was in the range of 200 μm to 220 μm. We subsequently incorporated this experimental height into the simulation using an iterative process to consider its potential influence on crack formation.
2.3. Stretching Process, Experimental Observation, and Detection of Cracks
The fiber stretching process employed the fiber mounting device described in [
1] and shown in
Figure 4. The fiber mounting device uses piezo motors to ensure a uniform acceleration and elongation of the fiber. In the experiments, the fiber was stretched at a stretching velocity of 12 mm/s (based on the information of PI (Physik Instrumente (PI) GmbH & Co. KG, Karlsruhe, Germany). The elongation distance on each side of the fiber was set to 11 mm, resulting in a maximum relative elongation of max. 39.3% with the length clamped. During elongation, the fiber was exposed to particle-free air, although we also conducted tests without this exposure. In the experiment with an air flow, the flow approached the fiber during the entire stretching cycle. The stretching and air flow intake occurred in a dedicated chamber, allowing observations from the side and providing uniform backlighting (see
Figure 4). Each stretching experiment was conducted in triplicate, and we replaced the fiber after 45 stretching cycles, a number that was based on tensile test results. There were no observable macroscopic changes in the fibers before and after multiple particle loading.
The influence of the onset of fiber elongation is most importantly reflected in the formation of cracks in the deposited structure. Due to the fact that the loaded fiber is illuminated from the back side, a shadow image of the structure with fiber is formed. The fiber image was captured with a high-speed camera (AOS Technologies AG, S-MOTION) and a standard resolution of 1280 × 1024 pixel and frame rate of up to 500 fps. Due to the resolution of the camera chip and the magnification optics of Navitar (Navitar 1-60135, 1-61387, 1-60110, 1-6010), a fiber section can be seen.
Using binarization, each frame of the video was converted to a black-and-white image to more clearly detect incipient cracking. A crack is characterized here by a growing indentation in the structure. A distinction is made between cracking from the fiber (i.e., from below) and cracking from above (against the direction of loading). If a crack develops, it is marked in each subsequent frame. If there are several cracks in the particle structure, the distance to the next mark on the right and left of it is determined in the image. The distance of the cracks is the horizontal length between two markers, as can be seen in the bottom of
Figure 4. The real distance of the cracks is obtained with the help of the scale, which allows for a comparison with the simulation. Unfortunately, for the cracks at the edge of the observed area (nearest crack from the right and left edges of the image), no distance to the next crack can be determined. For each frame, the corresponding number of cracks and the corresponding distance is determined. By a manual recheck, the respective particle agglomerate on the fiber between the cracks can be tracked. As soon as a rotation of the fiber starts or the particle structures are detached from the fiber, the number of cracks is reduced.
2.4. Stress within a Particle Structure
The tensile strength
within an agglomerate or particle structure is determined using Rumpf’s equations, which are based on a model involving the separation of two spheres with the same diameter
x [
16].
Rumpf’s equation for calculating tensile strength is as follows:
In this equation,
k represents the number of contact points with neighboring spheres,
is the adhesive force at those contact points, and
accounts for the porosity of the packing. The tensile strength acts normal to a large surface element of the agglomerate. For brittle agglomerates, fracture occurs when the local tensile strength of the agglomerate is exceeded. This strength can be diminished by the presence of cracks in the agglomerate [
17]. A fracture in the agglomerate can be visually detected or measured, and the fracture surface is perpendicular to the direction of tensile stress. In cases where the agglomerate is not subjected to high external contact pressure, fractures can close due to van der Waals forces. Schubert and Wibowo (1975) provided an experimental method for determining the tensile strength [
18].
Schubert’s work suggests that, for equigrain agglomerates, both
k and
depend on the agglomerate’s porosity (particle structure). This leads to a simplified equation for monodisperse particles:
The tensile strength of agglomerates is influenced by the size distribution of particles, denoted as , which results in an average adhesive force in the agglomerate. The calculation is similar to the case of uniform particle sizes (Equation (2)). The adhesive force, , depends on both particle size (x) and the number of contact partners, based on a horizontal plane through the agglomerate.
To determine the number of cut particles per unit area in a plane, which depends on the particle size distribution
(number distribution density), we use the following equation:
Rumpf presents two methods for calculating the tensile strength of agglomerates with different-sized particles [
16]. The first one involves estimating and combining single-grain calculations with those for uniform-grain agglomerates. The second method uses a derived equation (Equation (4)) based on dimensional analysis. The calculation includes a reference value
and requires determining the dependence of porosity on the particle size distribution, denoted as
.
The calculation assumes force transmission at a single point perpendicular to the agglomerate. However, in reality, during agglomerate breakage, multidimensional force inputs at multiple points must be considered, which depend on the arrangement and number of neighboring spheres or objects.
External forces exceeding the agglomerate’s tensile strength at local points are the primary cause of agglomerate breakage. These forces can result from drag forces in an air flow or mechanical actions like compression and tensile forces during milling [
16].
2.5. Simulation Model
2.5.1. Equations Governing the Particles
The DEM was introduced by Cundall in 1971 [
19] and has been continuously improved and applied to various particle-based problems since then. The DEM first treats a particle as a perfectly spherical element with a mass
m, radius
r, and moment of inertia
I. Its translational and rotational accelerations
and
are given by Newton’s equations as the sum of all forces
and moments
acting on the particles’ center of gravity. The translational and angular velocities are obtained by integration over a short time step Δ
:
The dominant forces in DEM include contact forces
and adhesion forces
. The contact forces arise from the physical interaction of two particles and are based on the elastic–plastic normal contact model by Walton and Braun [
20]:
where
and
are the normal elastic–plastic contact forces at the current time
t and at the previous time
, respectively. The change in contact normal overlap
is the difference in current contact normal overlap
and previous contact normal overlap
, and it is considered to be positive as particles approach each other and negative as they separate. The default value for the constant damping coefficient
is set to 1 · 10
−3 and ensures that
returns to 0 as unloading reaches
. The contact loading stiffness
and unloading stiffness
result from the stiffnesses of interacting objects
i and
j:
where the object contact loading stiffness
depends on its Young’s modulus
E and its size
L. The coefficient of restitution
governs the ratio of loading and unloading stiffness. In comparison with the model according to Rumpf (
Section 2.4), the strength of the agglomerates results from existing contacts within the particulate structure and the adhesive forces acting in them.
2.5.2. Model for the Adhesive Force Calculation
The adhesion force was modeled using the linear adhesive force model:
This model implements a stiffness fraction as a ratio of the adhesive stiffness to the contact normal loading stiffness if the distance between particles is less than a constant threshold .
A particular challenge of DEM is the high computational costs for large numbers of particles and small computational time steps as particle size decreases. A major advantage is provided by the computation on graphics cards, which has been implemented for several years. These offer the possibility to distribute the many calculations of individual particle contacts to many graphic processing units (GPUs) and thus parallelize the very numerous calculations. The results presented in this paper were performed with the software Ansys Rocky. The NVIDIA Tesla V100 model of the bwUniCluster of the Karlsruhe Institute of Technology (KIT) provided the necessary calculation speed for such microscale simulations. In particular, for large applications with especially small particles in the nano and micrometer ranges, simulations require not only powerful computers, but also simplifications and assumptions to keep the computation times within a comfortable range. First, the total number is reduced by only representing a part of the fiber. This is based on the assumption of similar breakage behavior along the fiber. This is also reflected in the assumption of a constant elongation rate along the fiber. The assumption of similar breakage behavior allows us to represent the whole fiber via a short segment, therefore reducing the number of particles and accelerating the calculation pace. The coarse grain method further increases the stable time step. It reduces the total number of particles by using larger particles, which represent a group of original-sized particles. The scaling laws are derived in the literature by means of dimensional analysis [
21,
22]. The coarse grain factor is set to 2 to maintain realistic behavior within the particle structure.
2.5.3. Material Parameter
The necessary material parameters for DEM simulations include the coefficients of friction
, coefficient of restitution
e and adhesive stiffness fraction
. In the presented case, the latter has the most significant impact on simulation results as the dominant effects are the aggregation of placed particles on the fiber surface rather than powder flow. Hence, the coefficients of friction can be approximated from the simple angle of repose experiments to 0.7 and 0.3, respectively. The coefficients of friction between particle and fiber were artificially increased to benefit the initial loading prior to fiber stretching. Further material parameters are given in
Table 2.
2.5.4. Implementation/Calibration of the Adhesive Force
The calibration of the adhesive force was concluded by simulating a single particle contact and adjusting the adhesive stiffness fraction
in order to fit the experimental data. The calibration of the fiber–particle contact was performed by a simple calibration method. In the calibration method, a particle is placed onto the fiber surface or a “frozen” particle. A funnel allows for the controlled positioning of the particle. To set the appropriate adhesion force between particle and fiber, the funnel is slowly lifted, thereby applying a pull on the inserted particle (
Figure 5). The adhesive force is recorded during the simulation until a contact rupture criterion is met and the contact is regarded as broken. The terminal recorded adhesive force is then compared with the experimental data, the
value is corrected accordingly, and the simulation resets. When the relative error between the simulated and measured adhesive force falls below 10%, the iteration is aborted.
The calibrated values for
as well as the resulting forces in the DEM simulation
in comparison with the experimental measurements
are shown in
Table 3.
However, in initial simulations of the stretching process, the particle–particle adhesive forces resulting from calibrated parameters (see
Table 3) were found to be too high as no cracks formed within the particle structure. The adhesive stiffness factor
was then gradually reduced to 0.01, where a fracture behavior similar to the experiments was achieved. Possible reasons for this may lie in the differences between the experimental calibration setup and the simulation. While in the experiment the particles were actively pressed together, in the simulation, the contact was the result of passive settling of an individual particle onto a ‘frozen’ particle. Therefore, the initial adhesion could be different as it is a function of the contact distance and area. In addition, humidity and temperature can be a factor that increases the measured adhesive force.
2.5.5. Implementation of Fiber Surface
A realistic representation of the fiber strain in the DEM simulation is a special challenge. First, the stretching is to be considered as a velocity gradient, described by the strain rate
, along the stretching direction of a fiber segment with initial length
. In order to transfer the effect of the strain to the deposited particles, the fiber section was first discretized into individual periodic segments. The velocity
applied to a segment is given by the product of its position
and the strain rate
, which results in relative stretch
after a stretching time
t:
The first attempt to transfer the applied velocity to the particles as a surface velocity similar to a conveyor belt failed to form any cracks, as the particles merely slid and rolled on the fiber. Even an increase in the friction coefficients and introduction of a rolling resistance could not negate this effect. For this reason, the individual segments were physically separated with their individual velocity
.
To create a more realistic description of the interactions between the fiber surface and individual particles with regard to the number of contact points, the fiber surface height profile was projected on the cylindrical fiber elements. These cylindrical elements were then used in the simulation. These height profile data were extracted from (white-light interferometry (WLI)) images and atomic force microscopy (AFM) images that have been gathered in [
24]. The projection and translation of the elevation profile onto the cylindrical elements were executed using the graphic software Blender (4.1.1). In this process, the grayscale values from the surface images (cutouts) were transformed into an elevation profile with corresponding boundary values. Subsequently, this resulting topographical profile was impressed onto a perfectly smooth cylinder, matching the segment’s length. The images from the cylindrical scan facilitated this transformation. Characteristic topographic profiles were compared by contrasting theactual profile (WLI and AFM images) with the simulated fiber segment.
Figure 6 provides a visual representation of a single segment of the polyurethane fiber surface featuring the surface profile imprint. It should be emphasized that the irregularities in surface roughness observed in the investigation conducted by Poggemann et al. [
24] were intentionally omitted from this specific surface design. The depicted surface profile segments accurately represent the unstretched condition of the fiber. To integrate the fiber element into the simulation, the completed element was exported as an .stl file.
2.5.6. Implementation of Flow Field
To simulate the impact of an air flow, as in the experiment, a one-dimensional constant flow field (external force) using the ANSYS/ROCKY software (2022 R2) suite was implemented in the case of simulation. This flow field exerts a constant force, acting upon the center of mass of the particles within the simulation. The interaction between the air and the particle is based on a one-way coupling, where the flow just affects the particle. In the simulation, the fluid was assigned a viscosity of μPa s and density of kg/.
As in the experimental setup, two flow velocities of m/s and m/s were assigned to the flow. The applied flow is one-dimensional in the negative direction of the y-axis. Simulation of flow starts as soon as the particle loading of the fiber is finished. This staggered start of the fluid flow prevents an unintended interaction of the different process parameters during the loading procedure. The implementation of a flow results in a constant force regardless of its particle size. The system is unresolved and in the steady state. The corresponding lift, virtual mass, and drag forces are calculated using the laws stored in the DEM.
2.5.7. Assumptions and Constraints
As shown by Poggemann et al. and Ophal et al., the microstructure of the fiber surface changes with a uniaxial stretching of the polymer [
24,
25]. This effect results in an increase in the root mean square (RMS) for surface roughness. Subsequently, there is a minimal reduction in the adhesive force. The number of contact points is assumed to change. During the simulation, it is not possible to replace the fiber elements for each corresponding state of elongation and surface state. Therefore, the change in the fiber surface structure is neglected in the simulation. Throughout the stretching process, an abstracted surface is used, as it was measured in the initial state, i.e., at 0% stretch.
In addition to the change in the fiber surface during stretching, there is also a rotation or a release of the internal contortion, which is visible by a tilting of the structure on the fiber. The causal crimping and rotation of the fibers is due to the manufacturing process. This contortion and deformation of the fiber during stretching is not represented in the simulation. This is due to the fact that no reliable data are available to describe this effect quantitatively. Thus, the stress on the adhesive contacts is reduced to a normal force. However, a contortion of the fiber would result in an additional tangential component of the stress, which might lead to an earlier crack formation and a slightly different rearrangement of particle contacts during stretching.
In the case of single-fiber experiments, rotation of the fiber results in the rearrangement and rotation of the fiber, which can lead to a change in the face area, as described by Poggemann et al. [
3]. Mostly, this is an increase in the face area, as in the compact structure it is initially placed close to the stagnation point of the fiber. If the fiber rotates around its own axis, the particle structure follows. The position of the stagnation point on the fiber changes, as can be seen in
Figure 7. This change in the face area is essential for the introduction of a detaching force and ultimately for detachment. This is because the direction of the air flow does not change.
The loading of the fiber in the simulation is realized in three steps. First, the required particle mass is generated in a volume above the fiber. A distance between the particles of the order of one particle diameter prevents agglomeration of the particles during generation and settling. The particles then sink under the influence of gravity and settle on the fiber. Subsequent elongation begins only after a resting phase, during which the particle contacts are established and a static state was reached. Although this method does not ideally reproduce the loading in the experiment, it allows for the formation of a similar particle structure with significantly reduced computation times. This reduction in loading times is particularly unavoidable due to the small time steps required for discrete element method (DEM) simulations at this scale. Because the mass loading for a particle structure on a single fiber cannot be determined from the experimental data, the particle mass was set iteratively in the simulation. The reference value was the loading height obtained from the image analysis of the experimental studies (see
Section 2.2). The number of particles is defined by the length of the represented section of the fiber. It is also essential to decrease the number of particles as much as possible to keep computational times within a reasonable range. However, the represented section of the fiber must be extensive enough to display a variety of appearing cracks, resulting in a reliable picture of crack formation during stretching.
3. Results and Discussion
3.1. Spacing of Cracks
In the first calculation/simulation, it was observed that cracks form preferentially over the gaps between two segments. This is due to the fact that the particles that are placed above one segment move in clusters with almost the same speed. This is a classical problem of discretization, which can be tackled with a finer resolution of the fiber segments.
Figure 8 shows a particle-loaded fiber before and after a certain time of stretching.
The total fiber consists of fiber elements with a length of 400 μ. Before and after 0.09 s stretching, the particle structure is evenly distributed at the stagnation point of the fiber. The crack formation at the interface of the fiber elements is due to the large linear movement of the individual elements but also due to the fact that the adhesive forces between particles and fibers exceed the interparticle forces many times over. In numerous instances, the surfaces of the cracks within the structure possess a modest bevel or bulge.
Figure 9 shows the development of cracks within the particle structure on a fiber segment consisting of fiber elements with a length of 100 μ
. After 0.0676 s of stretching, the first cracks appear in the structure and originate from the upper side of the particle loading. As the fiber elements continue to move apart, the cracks begin to grow downward from top to bottom. In addition, cracks can be observed as originating directly at the interface between the particle material and the fiber. If the movement process of the fiber elements continues, the cracks enlarge and continue to grow from top to bottom and vice versa. It is noticeable in both cases that the cracks grow partially at an angle, similar to the observations in the experiments. The snapshot of the simulation, displayed in
Figure 10, reveals the formation of cracks in the particle structure after 0.09 s in detail. Furthermore, the gaps between the fiber elements due to movement (stretching) become visible.
However, in contrast to the simulations with 400 μ
length, the cracks do not form predominantly at the interfaces between the individual fiber elements. As shown in
Figure 9, the crack formation can also be clearly seen all over the whole fiber length. The further the movement of the individual fiber elements and thus the elongation progresses, the more cracks form between the particle structures. In a simple analysis of the distance between the cracks, this is between 150 and 800 μ
.
However, despite the cracking, no discernible detachment of particle material occurred, unlike in the experiments [
3]. In contrast to the experiment, no tilting of the structures on the fiber is observed in the tests after a stretching of 5/s. As stated in
Section 2.5.7, the DEM simulations did not consider fiber rotation during stretching, which could potentially explain the differences between the simulation and experimental results. The tilting of the particle structure induces additional stress on the particulate structure, which facilitates the formation and propagation of cracks. Furthermore, rotation favors the tilting away of the fracture segments, further increasing stress and inducing the detachment of individual structures.
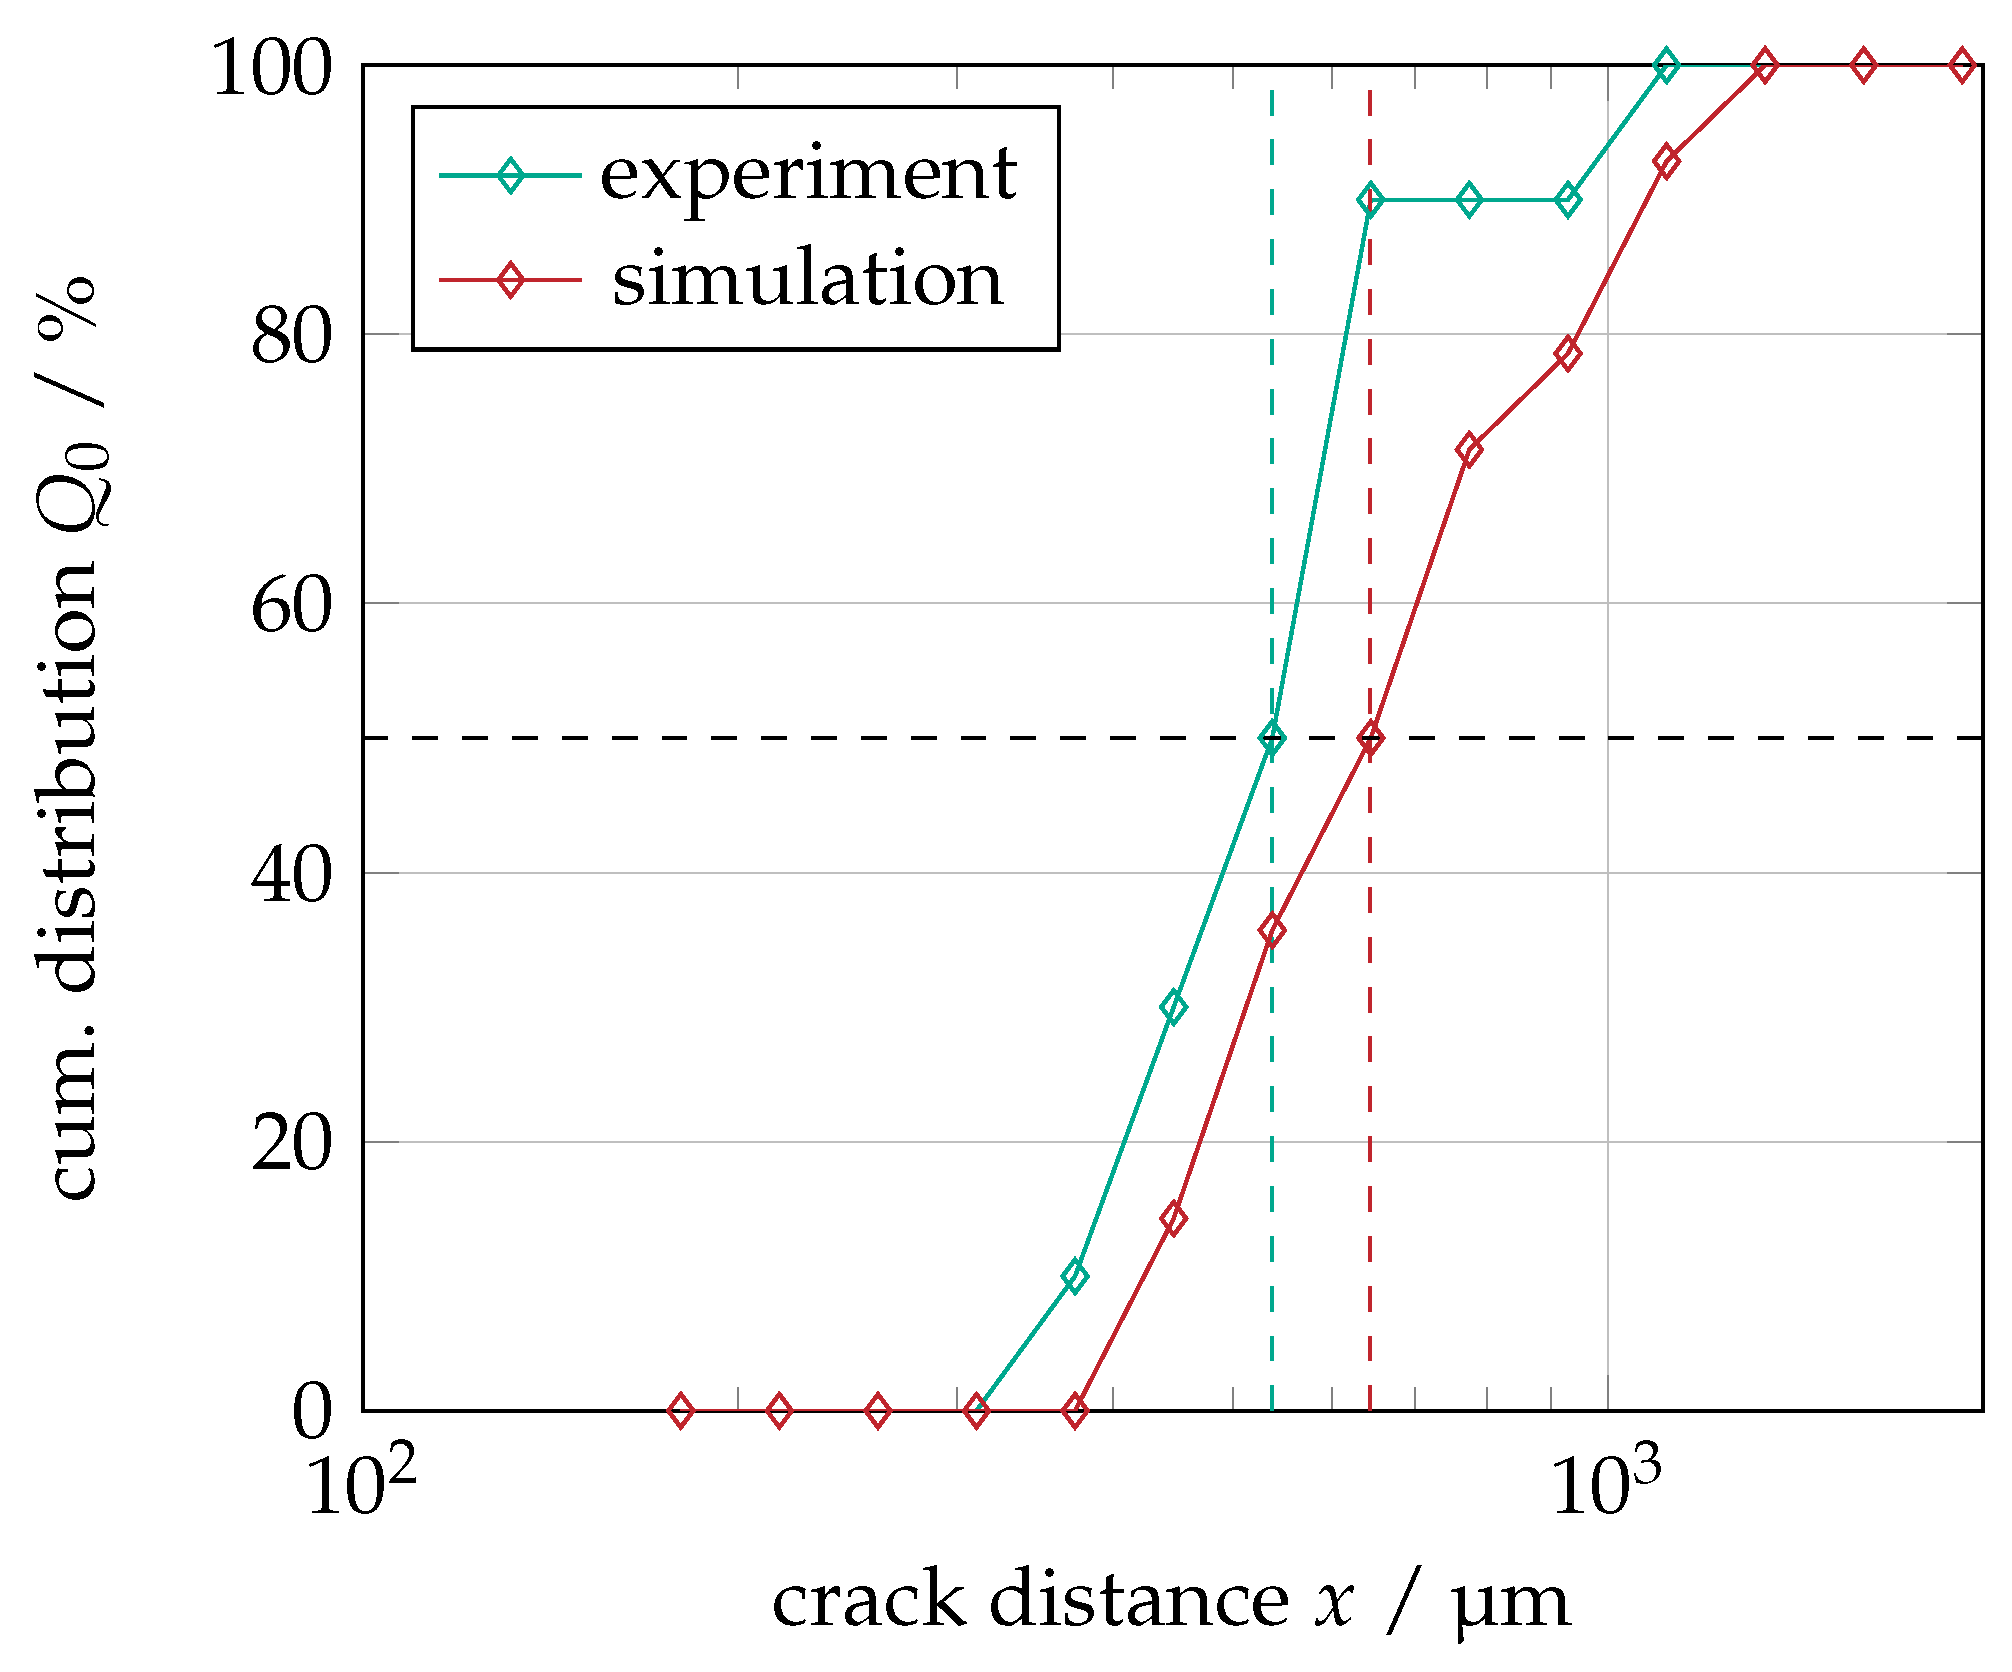
A comparison between the experimental results and the simulation with a segment size of 50 nm (see Figure 13c) is provided by manually analyzing the distributions of the crack spacing. The distributions are presented as number-based cumulative distributions (
) in
Figure 11. The experimental data show a narrow distribution with an
at approximately 537 μ
. The span of the distribution is calculated as
with
373 μ
and
928 μ
to 1.03. The experimental data were obtained by analyzing images of a fiber section approximately 5 mm in length covering a total of 11 cracks.
The data from DEM simulations was obtained by analyzing images of a fiber section with a length of 8 mm. Compared with experimental data, the distribution is slightly shifted to the right with a median at 644 μ and a span of 1.01 resulting from 425 μ and 1077 μ.
The relative difference in the values is very small at around 10%. The reason for the difference in span may be due to the simplified loading process. The DEM algorithm is optimized for random particle placement. This results in a homogeneous particle size and particle contact distribution within the particle layer.
During an experimental particle loading process of a filter or single fiber with polydisperse material, the structure and site of separation varies as a function of the particle diameter, assuming that other variables such as air flow velocity remain constant during the experiment [
11,
26,
27,
28,
29]. The location of particle separation is influenced by the kinetic energy of the particle, which is determined by the particle size. Separation can occur either directly on the fiber (zenith or side) as well as on the previously separated particle structure [
28]. Due to a significant increase in kinetic energy, some particle fractions in a polydisperse particle distribution may bounce off during the separation process.
Figure 12 shows the full length of the loaded fiber with a length of 8 mm; as conducted above, the individual fiber elements are implemented here with a length of 100 μ
. The particles are evenly distributed on the fiber and around the stagnation point of the fiber, forming a compact structure similar to the one in the simulation with a strain rate of 5/s (see
Figure 9). In this case, the strain rate is set as 2.5/s.
As described in
Section 2.3, when stretching is initiated, the individual fiber elements begin to move apart linearly according to the magnitude of the applied stretching rate. As in the previous case, a clear crack formation can be seen from a simulation time of
s. This is significantly intensified by further elongation up to
s.
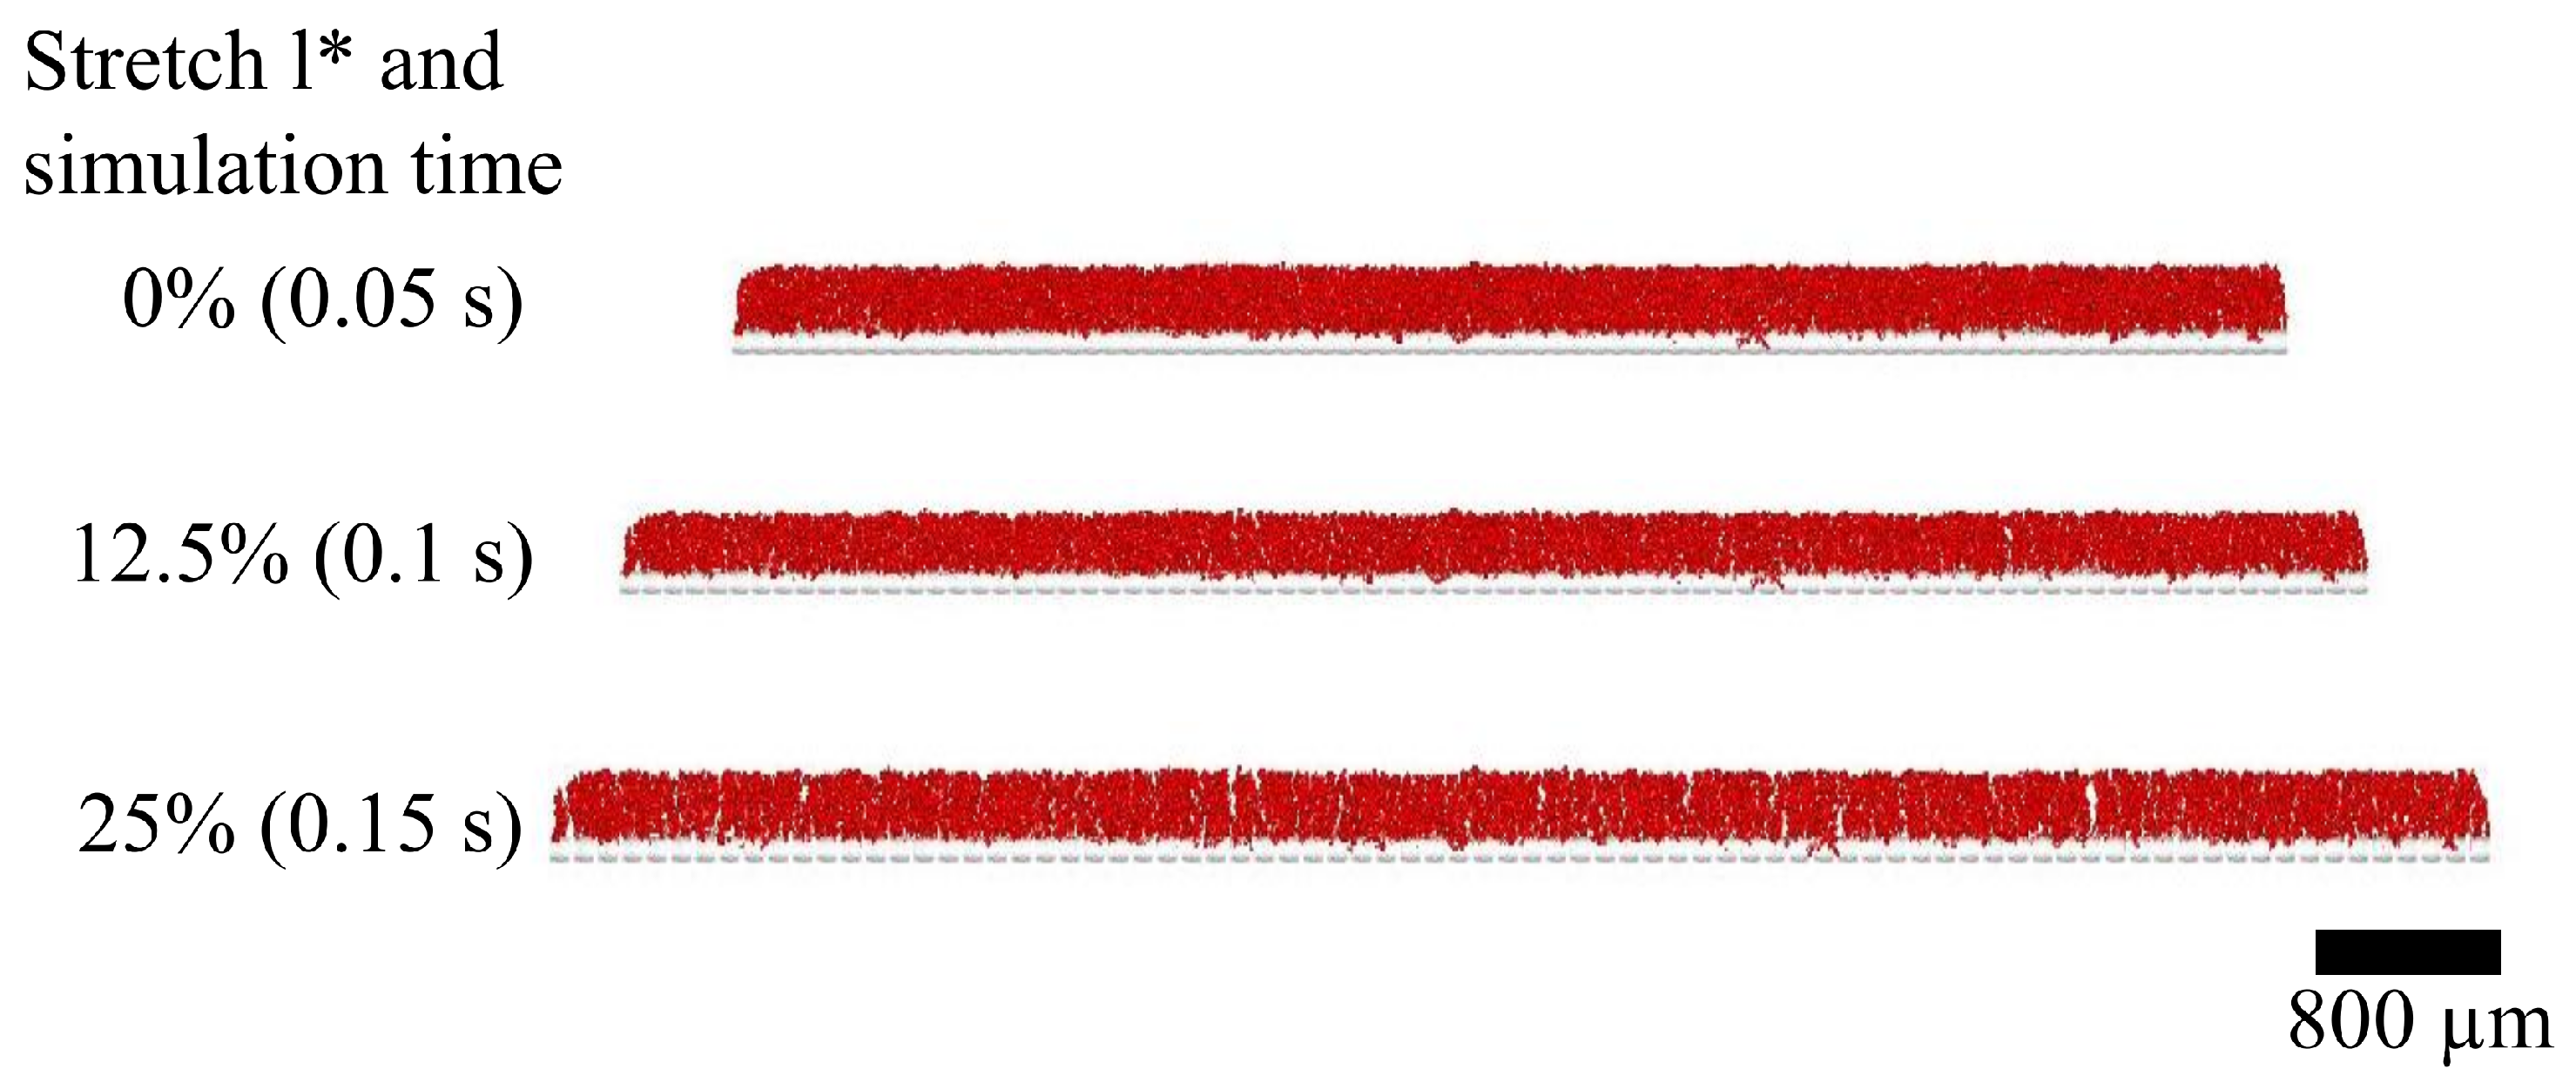
Figure 13 highlights the formation and propagation of cracks at a strain rate of 2.5/s and 5/s for different fiber element lengths. The particle load was discretized using Euler statistics and binarized with a threshold value of 12.5% solids content to improve contrast and visualize the emerging cracks due to fiber stretching. To ensure comparability between cases of different strain rates
, the analysis was conducted at varying values for
. Notably, cracks occur almost exclusively between fiber elements for element lengths of 400 μ
, resulting in equal crack spacing. This effect is already noticeable at a stretch of 12.5% (
Figure 13b) and obvious at 25% (
Figure 13c). For element lengths of 100 μ
and 50 μ
, the pattern of crack formation is less homogeneous and randomly distributed, as seen in the experiments conducted by Poggemann et al. [
1,
3]. Cracks occur regardless of their position on the fiber, as the initial particle structure is not equal for all discretization levels. This indicates sufficient discretization of the fiber and a possible dependence between local microstructure and crack formation. It can therefore be assumed that the length of the fiber elements is sufficiently small to show the formation of cracks and the rearrangement of the individual particles in accordance with the calibrated adhesive forces. Furthermore, the appearance of a crack is independent from the applied stretching rate.
3.2. Development of Inter Particle Contacts
The development of the interparticle contacts is a quantity for which, in the first consideration, a clear change is expected due to the rearrangement and breakup of the particle structure. The origin of this consideration is that with the onset of elongation in the experiment by Pogemann et al., a clear trend of contact reduction becomes visible because the individual particles move away from each other, and finally, cracks appear in the structure as seen in
Section 3.1. However, the exact number of contacts to neighboring particles or to the fiber cannot be determined in the experiment, as no insight into the structure is possible. However, firstly, as already observed in the experiments, the stretching process is somewhat smaller in step size. As the fiber begins to stretch, there is a slight rearrangement movement of the particles on the fiber [
1]. The particles that are directly on the fiber move with the fiber. Due to the contacts between the particles, the other particles in the particle structure move with the movement of the particles below. In addition, a kind of stretching of the structure occurs in the simulation, which can be explained by the contact model used (linear spring model). At a contact point of two particles, there is initially a movement of the particles in the area of the overlap of the particles which, according to the soft sphere approach, exists despite the contact of the particles with each other.
With the start of the stretching at
s,
Figure 14 obtains the increase in the relative number of contacts between particles regardless of the stretching rate. In all experiments, the particles above the lowest layer on the fiber rearrange, which can also be seen by continuous small movements of the structure and particles in the video image. Rearrangements in the structure occur, and so it is more likely to conclude from the increasing total number of contacts that more contacts are produced between particles. The curves from the individual tests are all within a small range of each other, indicating that the rearrangement processes are not affected by the strain rate and fiber element size over the range of values considered. The curves steadily increase over the entire stretching experiments. The relative number of contacts in the simulation with a strain rate of 2.5/s and a fiber element size of 100 μ
is always at the highest level. In contrast, the simulations with a fiber element size of 50 μ
show the lowest real number of contacts. Despite the crack formation over the entire fiber length shown earlier (see snapshots in
Figure 13), there is no overall reduction in relative contact numbers in the simulations using the current discretization of fiber elements. Except for small dents, the relative number of contacts steadily increases. For a more detailed resolution and view of the lost contacts, the section of the particle load can be seen in
Figure 15, where the number of lost contacts is color-coded. The particle structure is the same as in the single-fiber experiment with an approximated height of 210 μ
. In the stretched state after
, clearly formed cracks can be seen in the particle structure. In addition, further small crack tips can be seen both on the top surface and also directly in the particle structure in contact with the fiber. Looking at the lost contacts of each visible particle, clear changes can be observed. In most cases, larger particles within the particle structure have gained particle contacts due to stretching. This can be clearly seen in the mint- and blue-colored particles. Many particles with 2–3 gained contacts can be seen. Especially large particles show a strikingly high number of gained contacts at up to five. This impression, as well as the crack formation, intensifies as the simulation continues and stretches up to a stretch of
. Occasionally, small particles with a gain of one contact can be seen in the particle structure. Surprisingly, there is no clear evidence of a reduction in particle–particle contacts on the crack surfaces within the particle structure. The increasing number of contacts, despite the visible formation and propagation of cracks, indicates the presence of two opposing effects. Firstly, individual particle contacts become detached during crack formation and propagation. Secondly, the rearrangements of small particles to large particles, as described above, occur within the particle structure and result in a gain of contacts. However, the latter results in a significantly larger number of new particle contacts in absolute terms, which may obscure the influence of crack formation and growth on the total number of contacts.
3.3. Influence of Flow on the Separated Particle Structure on a Single Fiber and Fiber Array
As already explained in
Section 2.5.6, it is possible to perform the stretching of a loaded single fiber considering a one-way coupling air flow. The particle material deposited on the fiber shows the same porosity and mass as in the simulation experiments without air flow. Both fiber elongation and an air flow of
m/s are started at the same time in the simulation. The air flow approaches the particle-loaded fiber from the top.
Figure 16 illustrates a section of the fiber segment at different times (stretch) during the simulation. The color scale indicates the number of lost contacts for each particle at the corresponding points of simulation time. In the uppermost image, a compact particle structure can be seen, similar to that in the simulations without air flow, which is located on the upper side of the fiber and partially has lateral dendrites. Within this structure, isolated particles are already visible, which have lost contacts in the course of the simulation time during elongation and simultaneous air flow.
In the following image, recorded with a time stamp of s, the first separation of a particle structure consisting of several particles is visible. In a subsequent snapshot, at s, the second detachment of a particle structure occurs. Interestingly, the detachment of this particle structure occurs immediately from the densely populated overall structure, leading to the dissolution or disruption of numerous connections to neighboring particles. This is evident from the brief discoloration of the adjacent particles with respect to lost contacts during the simulation. The particles immediately rearrange and make fresh connections after realignment in both cases of detachment. This effect can be described by the fact that contact forces in DEM are regarded as spring–damper systems. The sudden loss of one contact disrupts the equilibrium of all applied forces on the particle. This causes the particle to be pulled towards the remaining contacts, very likely to collide and create new contacts with nearby particles.
In both observed events of detachment, the actual detachment and exit from the simulation area occurs in only two time steps. It is noteworthy that no visible changes in particle contacts can be detected in the underlying color scale. In real experiments, the observation of this type of detachment turns out to be challenging, as the size of the detached agglomerate here is about less than 50 μ
[
3]. After the particle detachment, the remaining particle structure on the fiber continuous to re-arrange. Invariably, irrespective of the simulation time step, it becomes evident that larger particles predominantly lost contact with their neighboring particles through rearrangement before undergoing detachment.
Similar detachment processes due to simultaneous flow and elongation in the simulation of a single particle-loaded fiber can also be observed in the simulation of a particle-loaded fiber array. In another preliminary study, a fiber array was considered as a collector to investigate the effects of an additional air flow and stretching on a compact particle structure and its clogged structure in between. The fiber array is composed of five single fibers, each composed of fiber elements with a length of 100 μ. Similar to the single-fiber studies, the fiber elements simulate the strain through relative linear movement, and a particle structure is deposited onto the fiber array prior to stretching.
Figure 17 illustrates the array of five fibers with fiber elements of 100 μ
and the particle load at various stages of the stretching process. The particle structure on the fiber extends over the five adjacent fibers, creating a bridge between them. In the snapshots from the simulations in
Figure 17, each particle is color-coded to indicate the number of contacts lost. Consistent with the data from single-fiber simulations, it is evident that larger particles in particular have gained additional contacts. However, some small particles also suffer from contact loss. One explanation for this phenomenon may be that larger particles, due to their large surface area, can make additional contacts during rearrangement within the structure.
In principle, the relative number of particle–particle contacts can be analyzed for the two presented cases and also for two other simulations with a lower flow rate of
m/s. The evolution of the relative number of particle–particle contacts should show to what extent the detachment of particle structures can possibly confirm the hypothesis regarding the reduction of particle contacts. The relative number of contacts in the two experiments with a single fiber compared with the data from the simulation experiment with a loaded array subjected to an air flow while stretching the fibers at 2.5/s are shown in
Figure 18. As in the simulation without air flow, the stretching starts at a simulation time of
s. The simulation of a single fiber and an array with an air flow of
m/s exhibit an immediate densification and result in an increase in the relative number of contacts. Such a sudden rise is not apparent with an inflow of
m/s. The hard increase in the relative number of contacts is followed by decreases due to a strong detachment of particle structures, as displayed in
Figure 17 at the simulation time of
s and
Figure 16 at the simulation time of
s. Subsequently, the number of contacts continuously increases. With the increased formation of cracks in the structure on the array (see
Figure 17), there is a detachment of particle material combined with a significant decrease in the relative number of contacts that can be seen again in the simulation with an inflow velocity of
m/s in the test with an array (see simulation time
s). However, the slope of the increase in the relative number of contacts is equal in all simulations, regardless of the flow velocity.
In the case of the simulation with a single fiber and an applied air flow of
m/s, there is a rather small reduction, which can be attributed to the detachment of particle structures (see
Figure 16). In the end, the relative number of particle–particle contacts is reduced further and further by this repeated detachment of particle structures and is reduced below the value of the test with the single fiber and an air flow velocity of
m/s.
The results of the simulations with a single fiber and a fiber array at a flow velocity of
m/s can also be found in
Figure 18.
A slight increase in the values for the relative number of contacts can also be seen at the beginning of the tests with the single fiber in flow. In the case of the array, a very slight decrease can be observed which, as in the case of the array and the single fiber with an incident flow of m/s, is due to compaction. After that, the relative number of contacts starts to steadily increase with a similar gradient as in the other tests. For the test with an array and an air flow of m/s, a steady increase is observed from the beginning. Towards the end of the test, the values for both the array and the individual fibers tend to follow the same trajectory. No dips or drops due to detachment or large rearrangement of particle structures are observed in either the single-fiber or array experiments.
Overall, the simulation of the array with an air flow velocity of m/s results in a lower relative number of contacts than the simulation on the single fiber with the same approaching air flow. This may be due to particle detachment in the region of the particle bridges between the fibers. However, the relative number of contacts in the single fiber tests with an inflow velocity of m/s is also significantly lower than in the tests with an inflow velocity of m/s due to the detachment at the end of the tests. In the case of the tests with an inflow velocity of m/s, it is interesting to see how similar the number of relative contacts of single fibers and arrays develop in the tests.
5. Outlook
For the future advancement of our research, there is the potential to implement a four-way coupling scheme. This will incorporate fluid–particle and fluid–fiber interactions. This will correct the direction of the fluid-induced force and improve the accuracy of the simulation. In a four-way coupling scenario, this would involve modeling interactions among particles themselves, as well as between particles and the surrounding fluid and between particles and the fiber surface.
In this advanced approach, the discrete element method (DEM) would be employed to simulate the granular particle phase, while computational fluid dynamic (CFD) analysis would be necessary to model the fluid flow by solving the volume-averaged Navier–Stokes equations. This integration could yield a comprehensive 3D model, capturing the dynamics of the fluidized particle structure adhering to the fiber. Moreover, it would allow us to explore the complex interaction between the stretchable fiber and the particle structure during the stretching process. As observed in the studies with air flow, this would especially apply to the fluid force-induced detachment of the particulate structures.
As evident from the analysis of particle contacts in the results, there is an initial increase in the number of contacts as elongation progresses. One important factor that has not been addressed yet is the particle size distribution within the particle structure. The particle size distribution has a significant influence on the packing of particles and consequently plays an important role for the determination of the number of contact points between an individual particle and the fiber. For a monodisperse particle size distribution, there is an optimal simple cubic packing. In this case, the number of contact points with other spherical particles would be six for each particle. If particles of different sizes are represented in the packing, the number of contact points is increased as much smaller particles can adhere to one large particle. At the equal size surface of a large particle, a larger number of small particles can establish a contact than would be the case with a monodisperse distribution. It can be assumed that a wider particle size distribution results in a wider distribution of the number of contacts. A clear and quantitative resolution of contacts per particle according to its size is influenced by the coarse grain approach and is subsequently not part of these simulations.
Another aspect that requires improvement is the fiber loading in the DEM simulation. The particulate structure resulting from this process may differ from that observed in experiments in porosity and particle distribution around the fiber. A possible solution is to collaborate with research groups that simulate the fiber loading process and use the final state of their loading simulation as an initial condition. This may lead to more realistic behavior during the simulation of the stretching.
Nevertheless, when the structure breaks up and cracks, it is evident that the large particles gain more contacts than the small particles. Regardless of the influence of this aspect, the testing of polydisperse particle material in the simulations is a step towards a realistic implementation. Still, due to the different sizes of the particles, problems arise again in the generalization for model–theoretical considerations with regard to the number of contact points.


