
Particulate Matter Characterization in a Hospital’s Underground Car Park

 ,
,  , , and
Abstract
1. Introduction
2. Materials and Methods
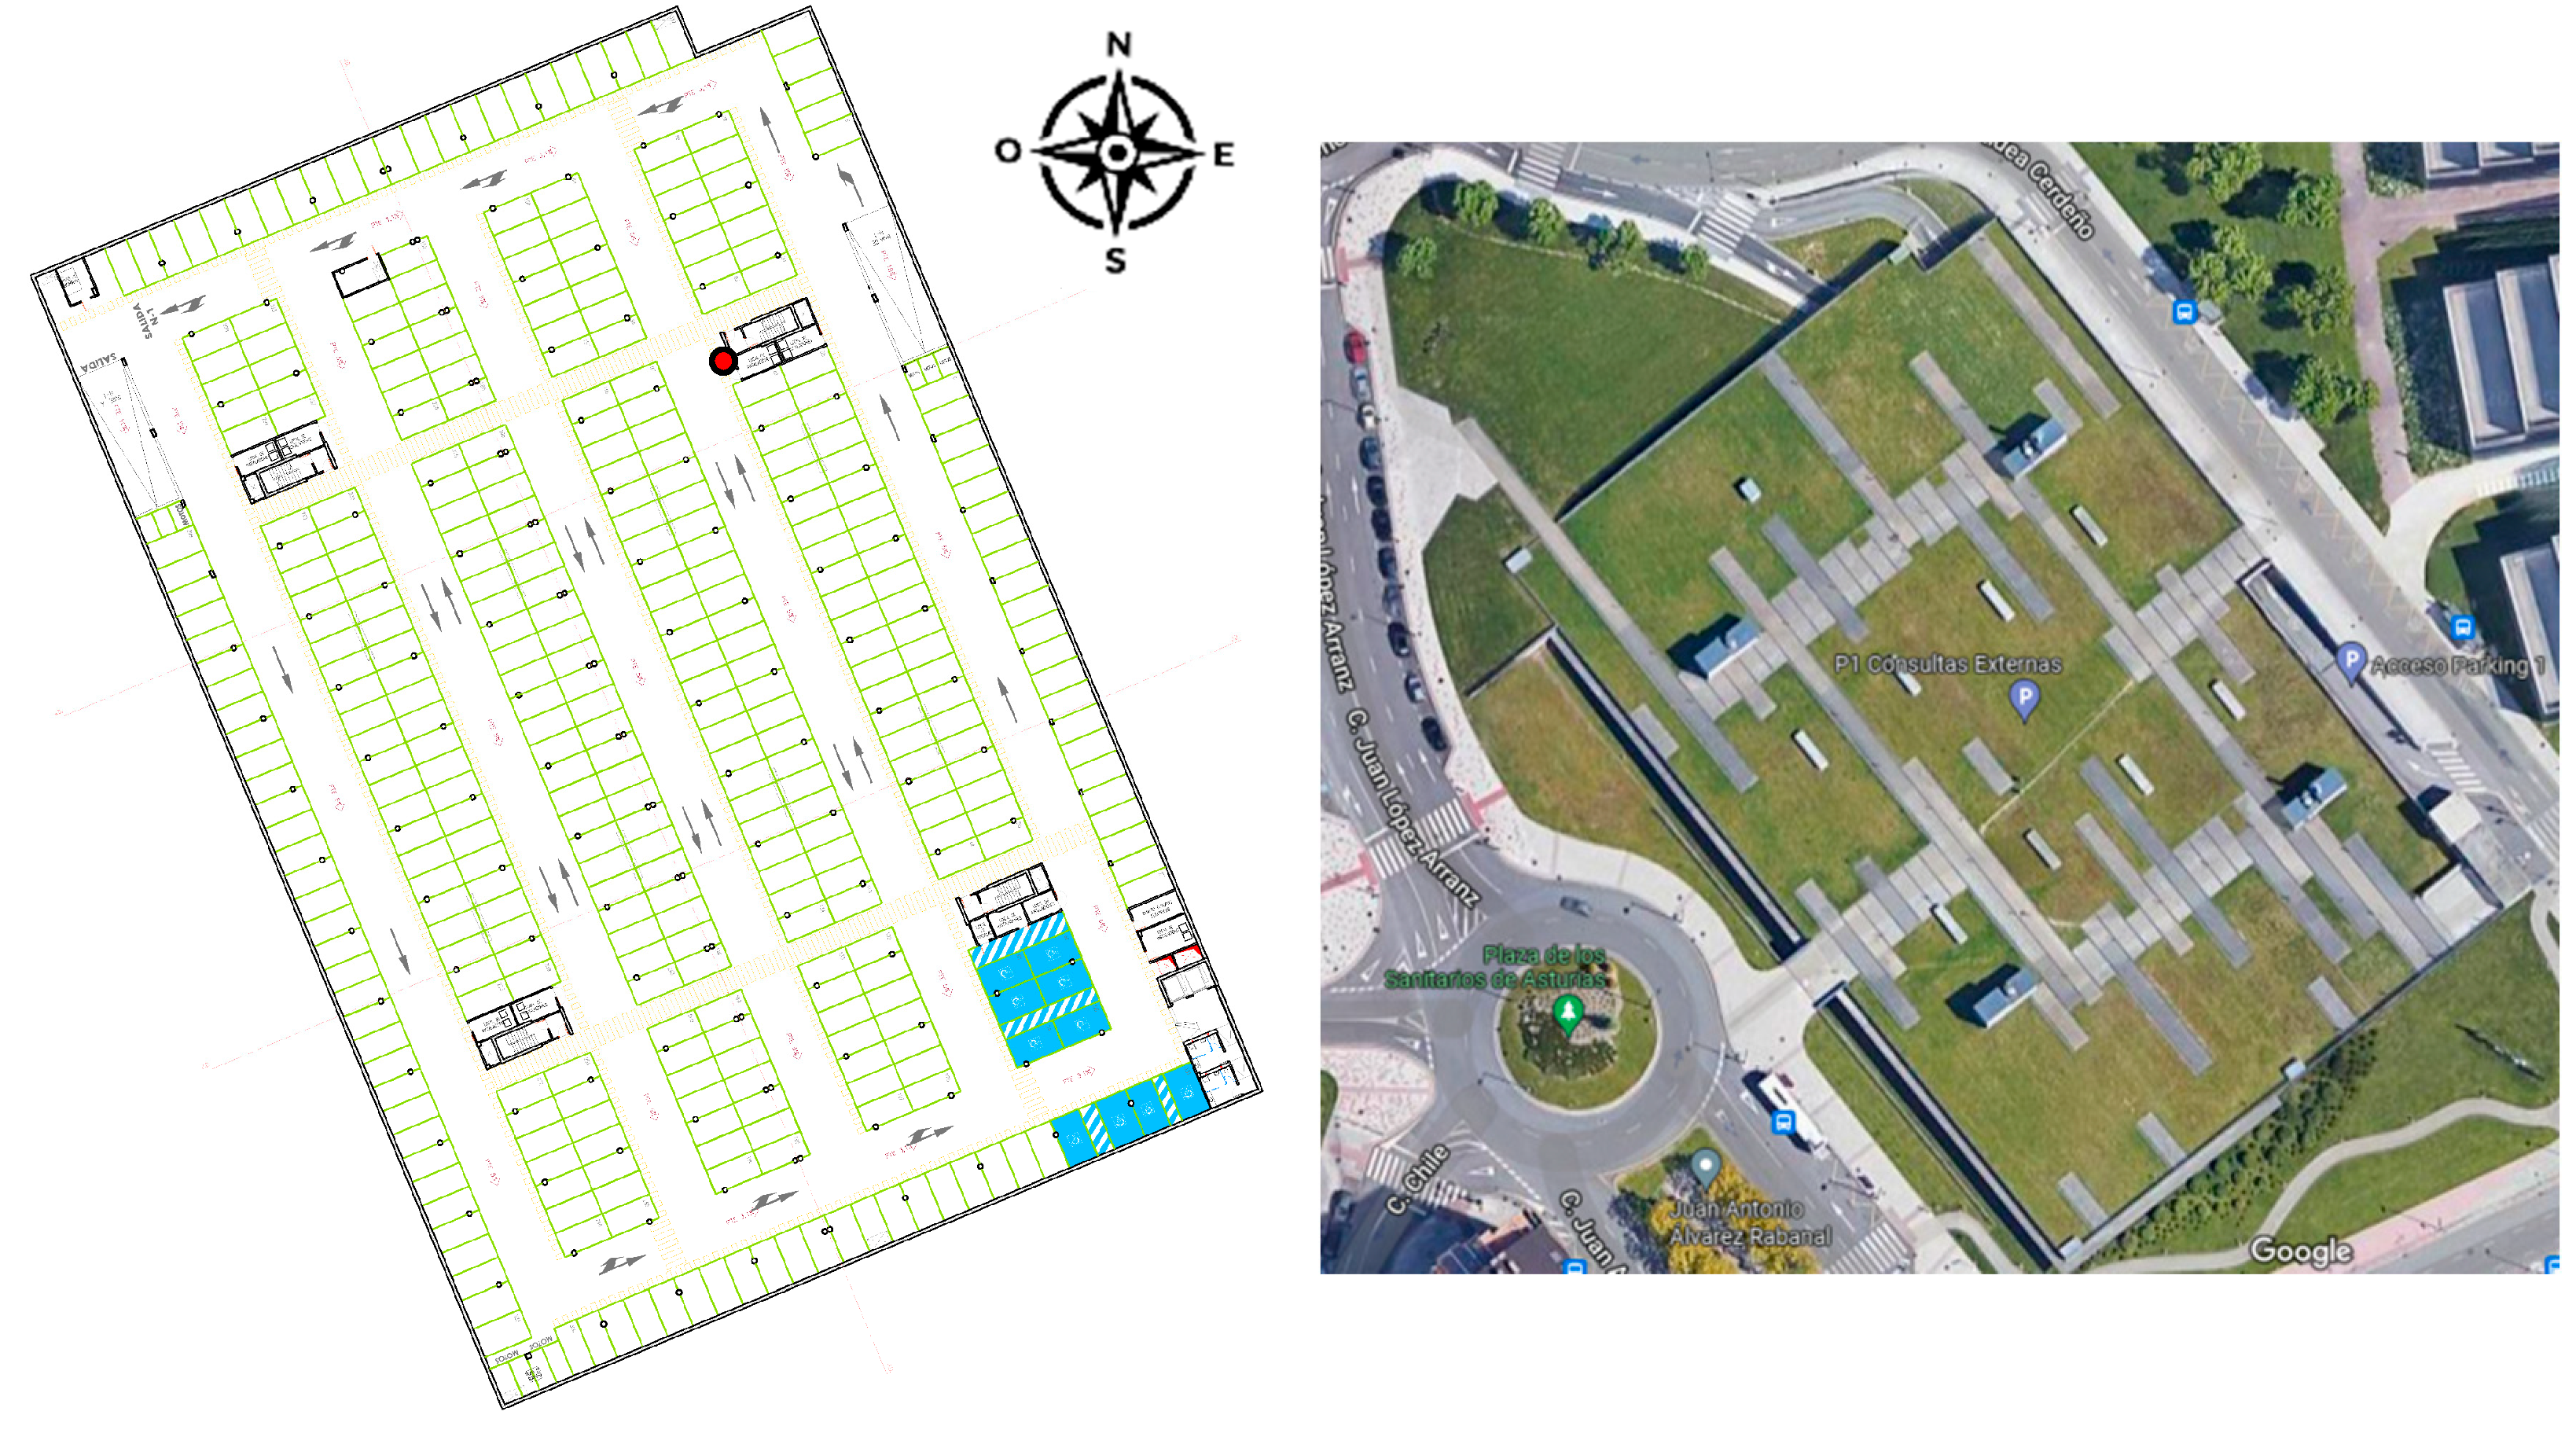
2.1. Characteristics of the Sampling Site
2.2. Sampling Methodology
2.2.1. Particle Sampling
2.2.2. Diesel Particulate Matter (as Elemental Carbon)
2.2.3. Volatile Organic Compounds (VOCs)
2.2.4. Polycyclic Aromatic Hydrocarbons (PAHs)
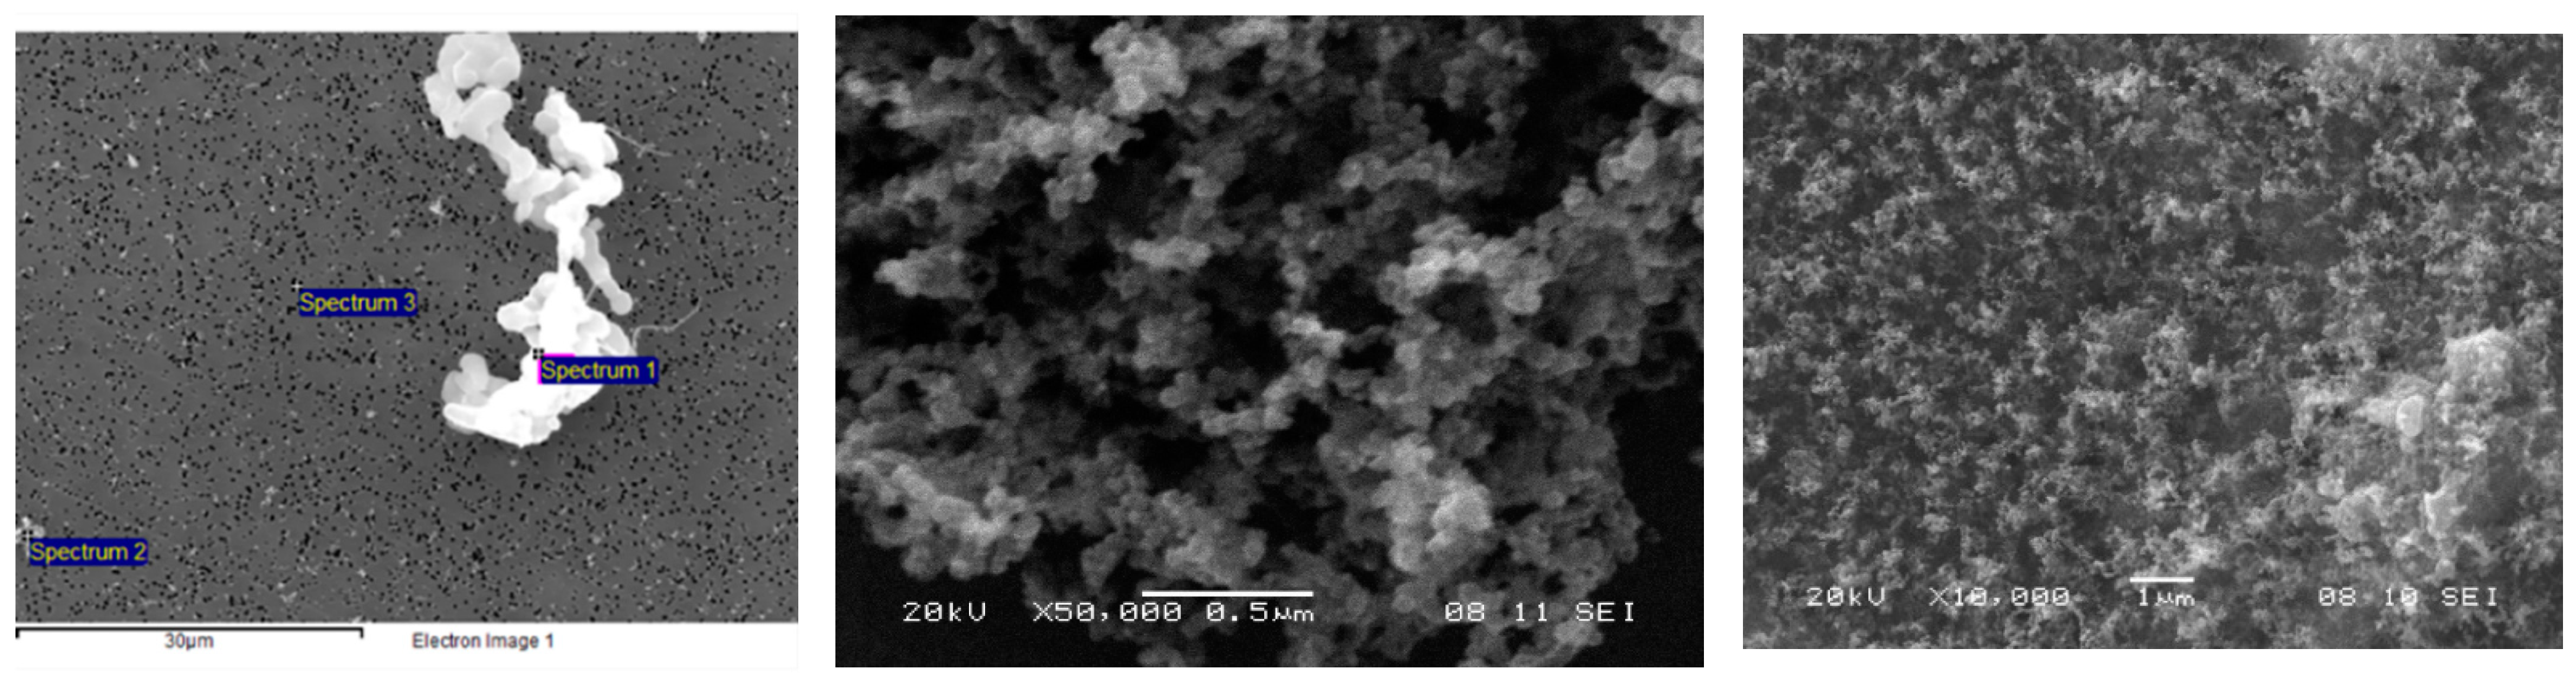
2.2.5. Characterization with SEM-EDX Microscopy
2.3. Limits
2.3.1. Particle Number Concentrations
2.3.2. Diesel Particulate Matter (as Elemental Carbon)
2.3.3. Volatile Organic Compounds (VOCs)
2.3.4. Polycyclic Aromatic Hydrocarbons (PAHs)
3. Results and Discussion
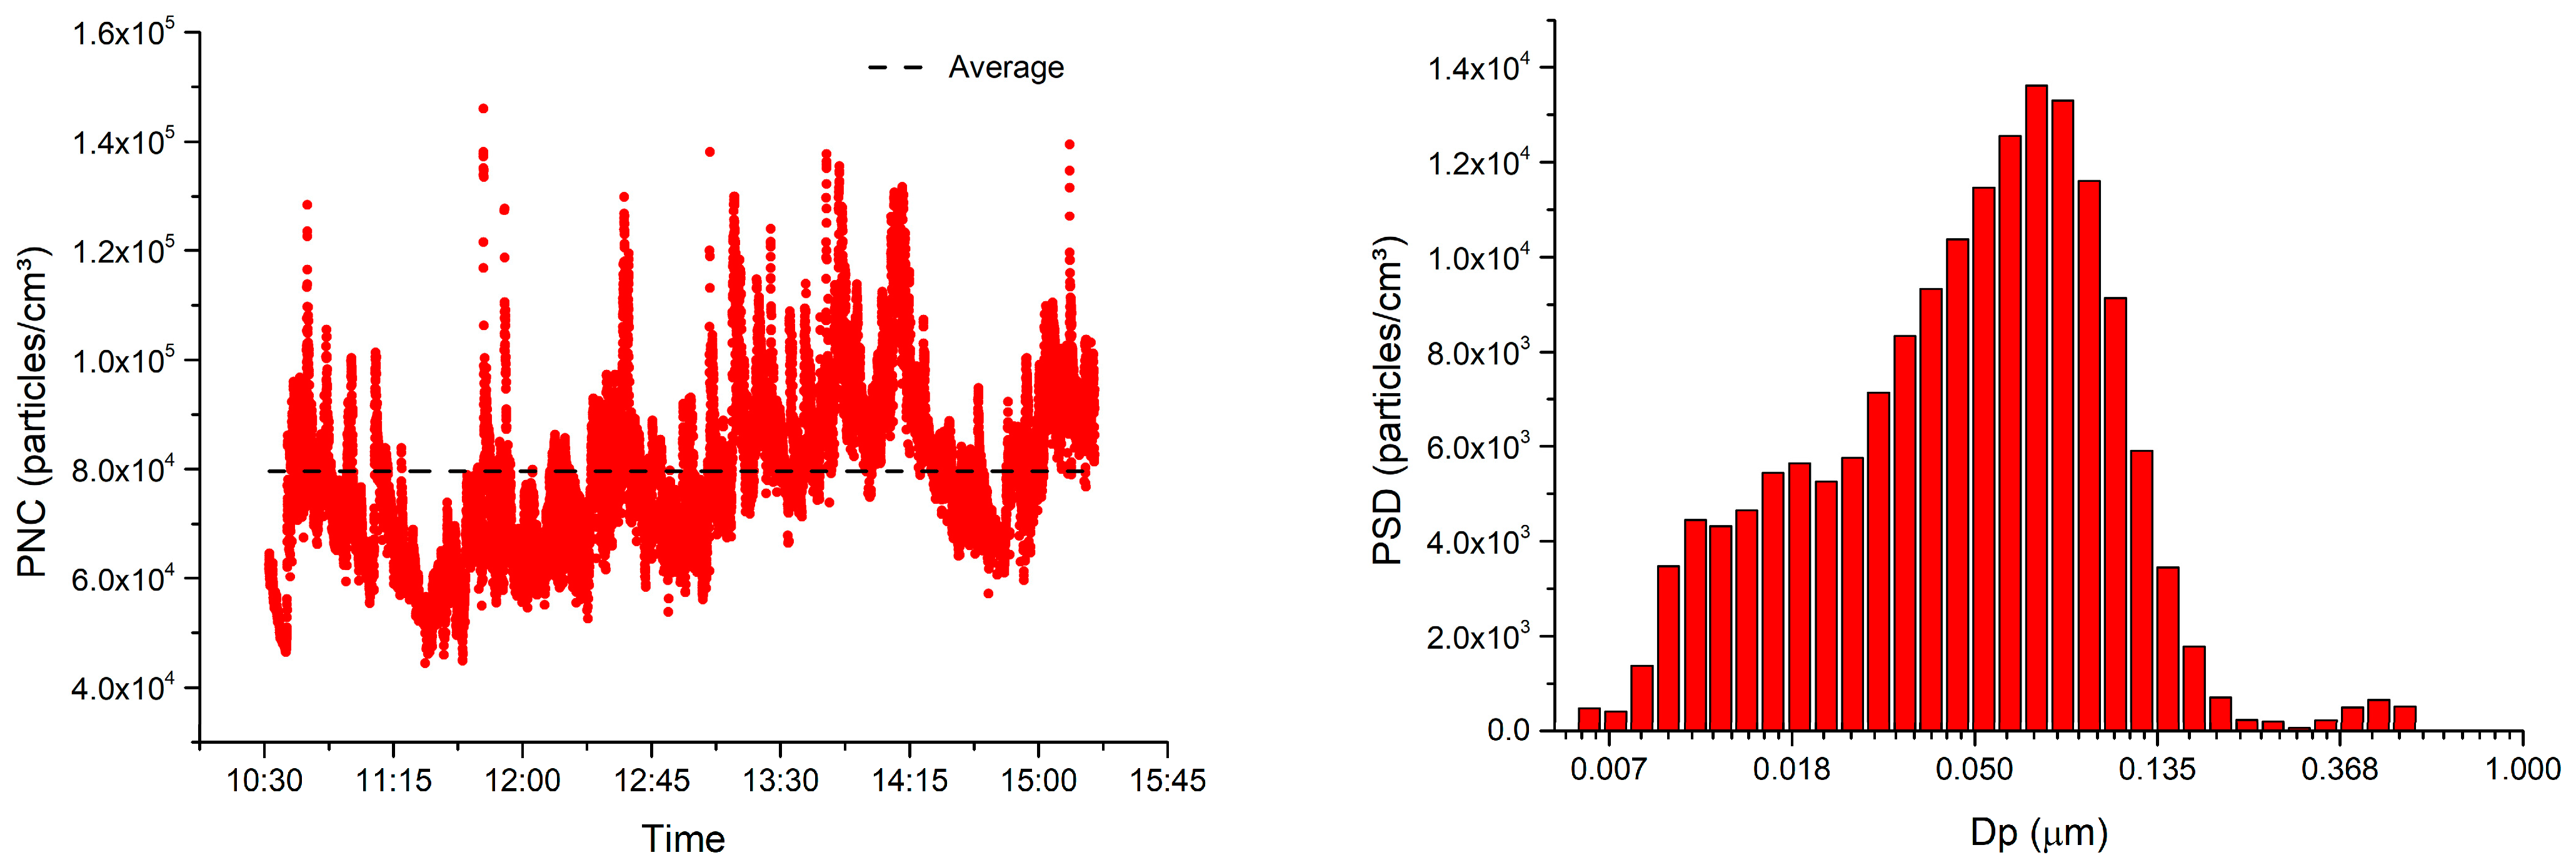
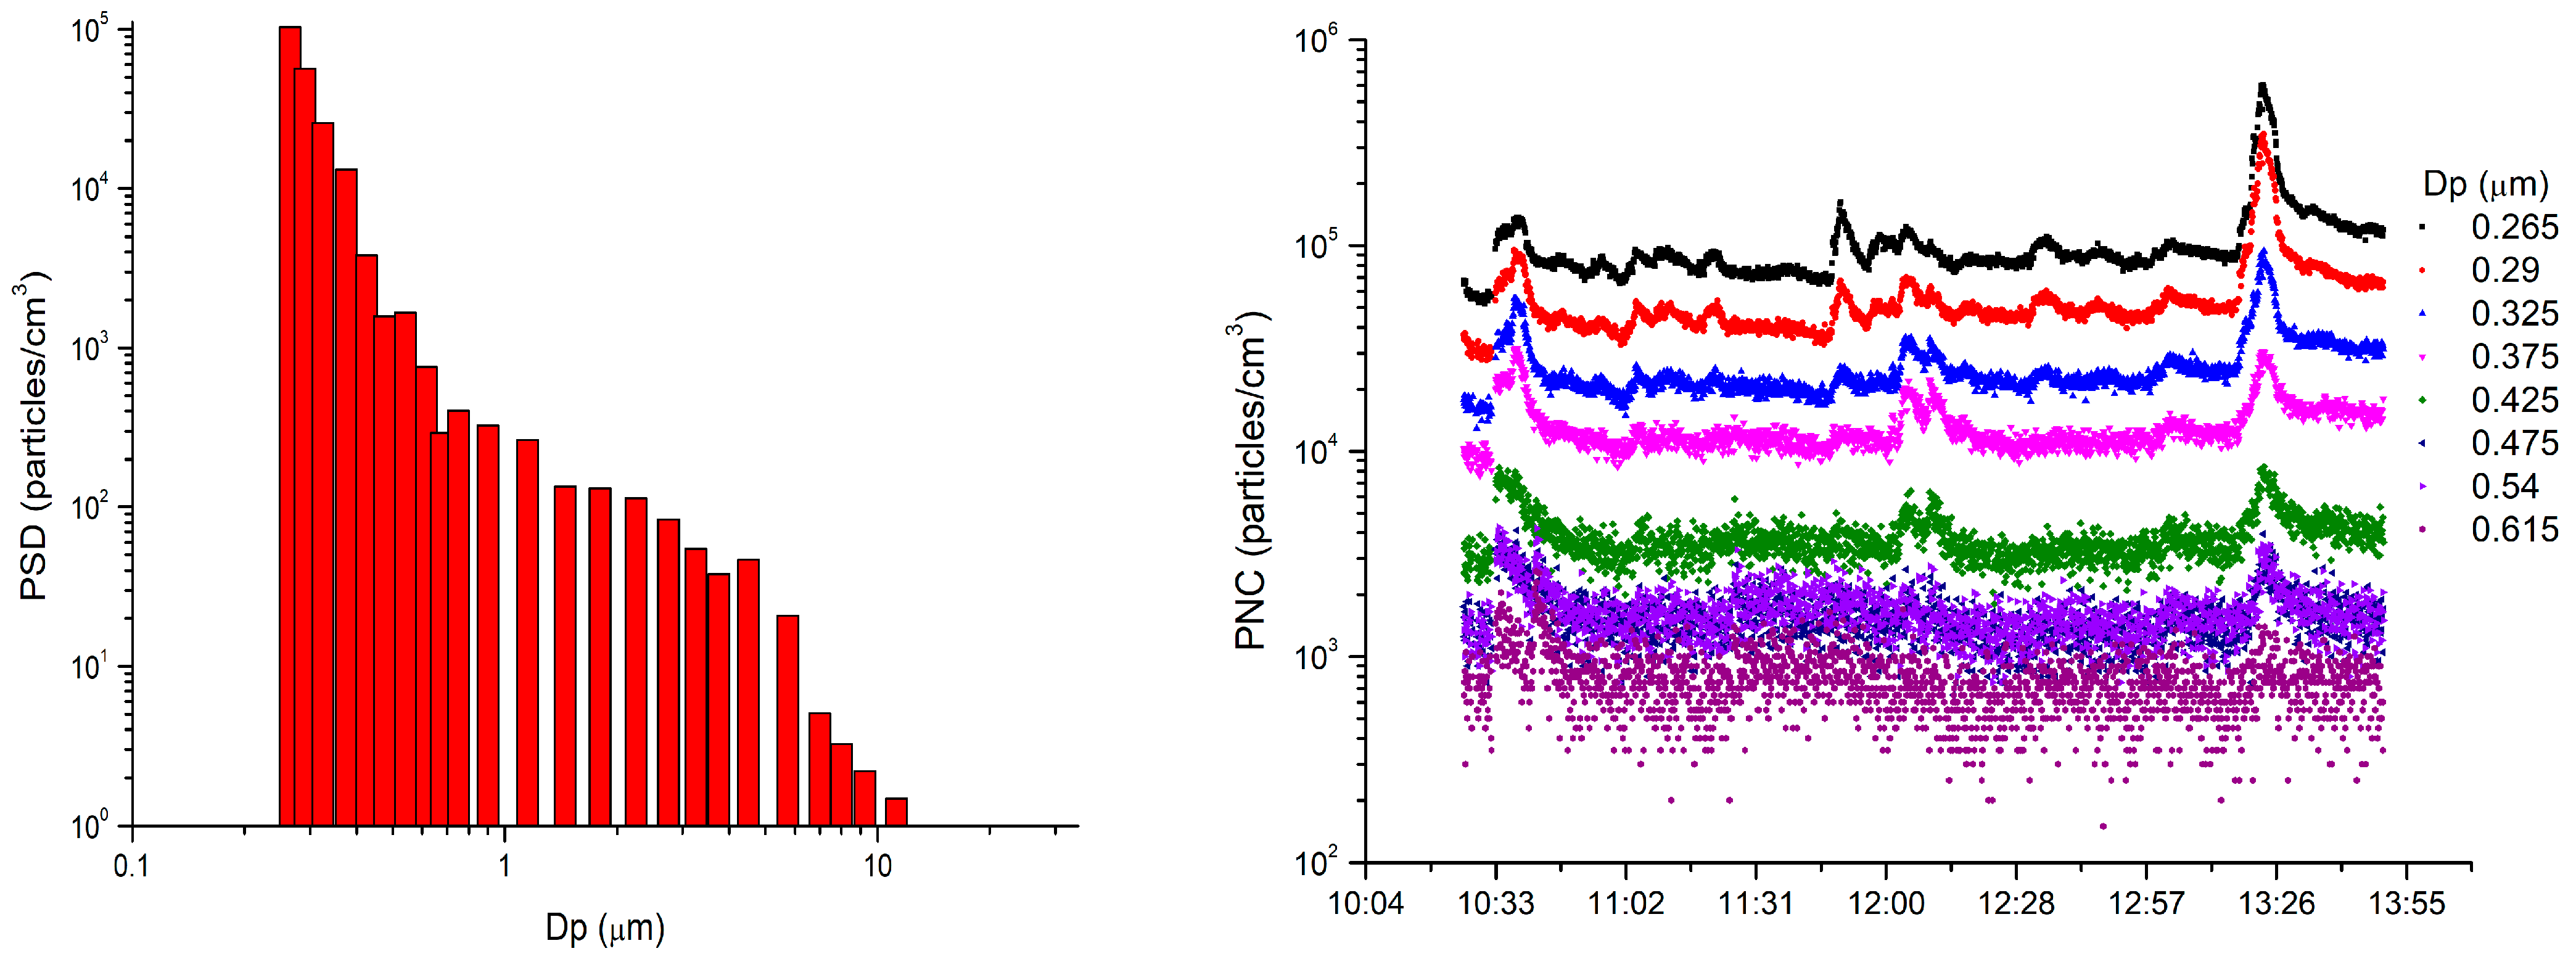
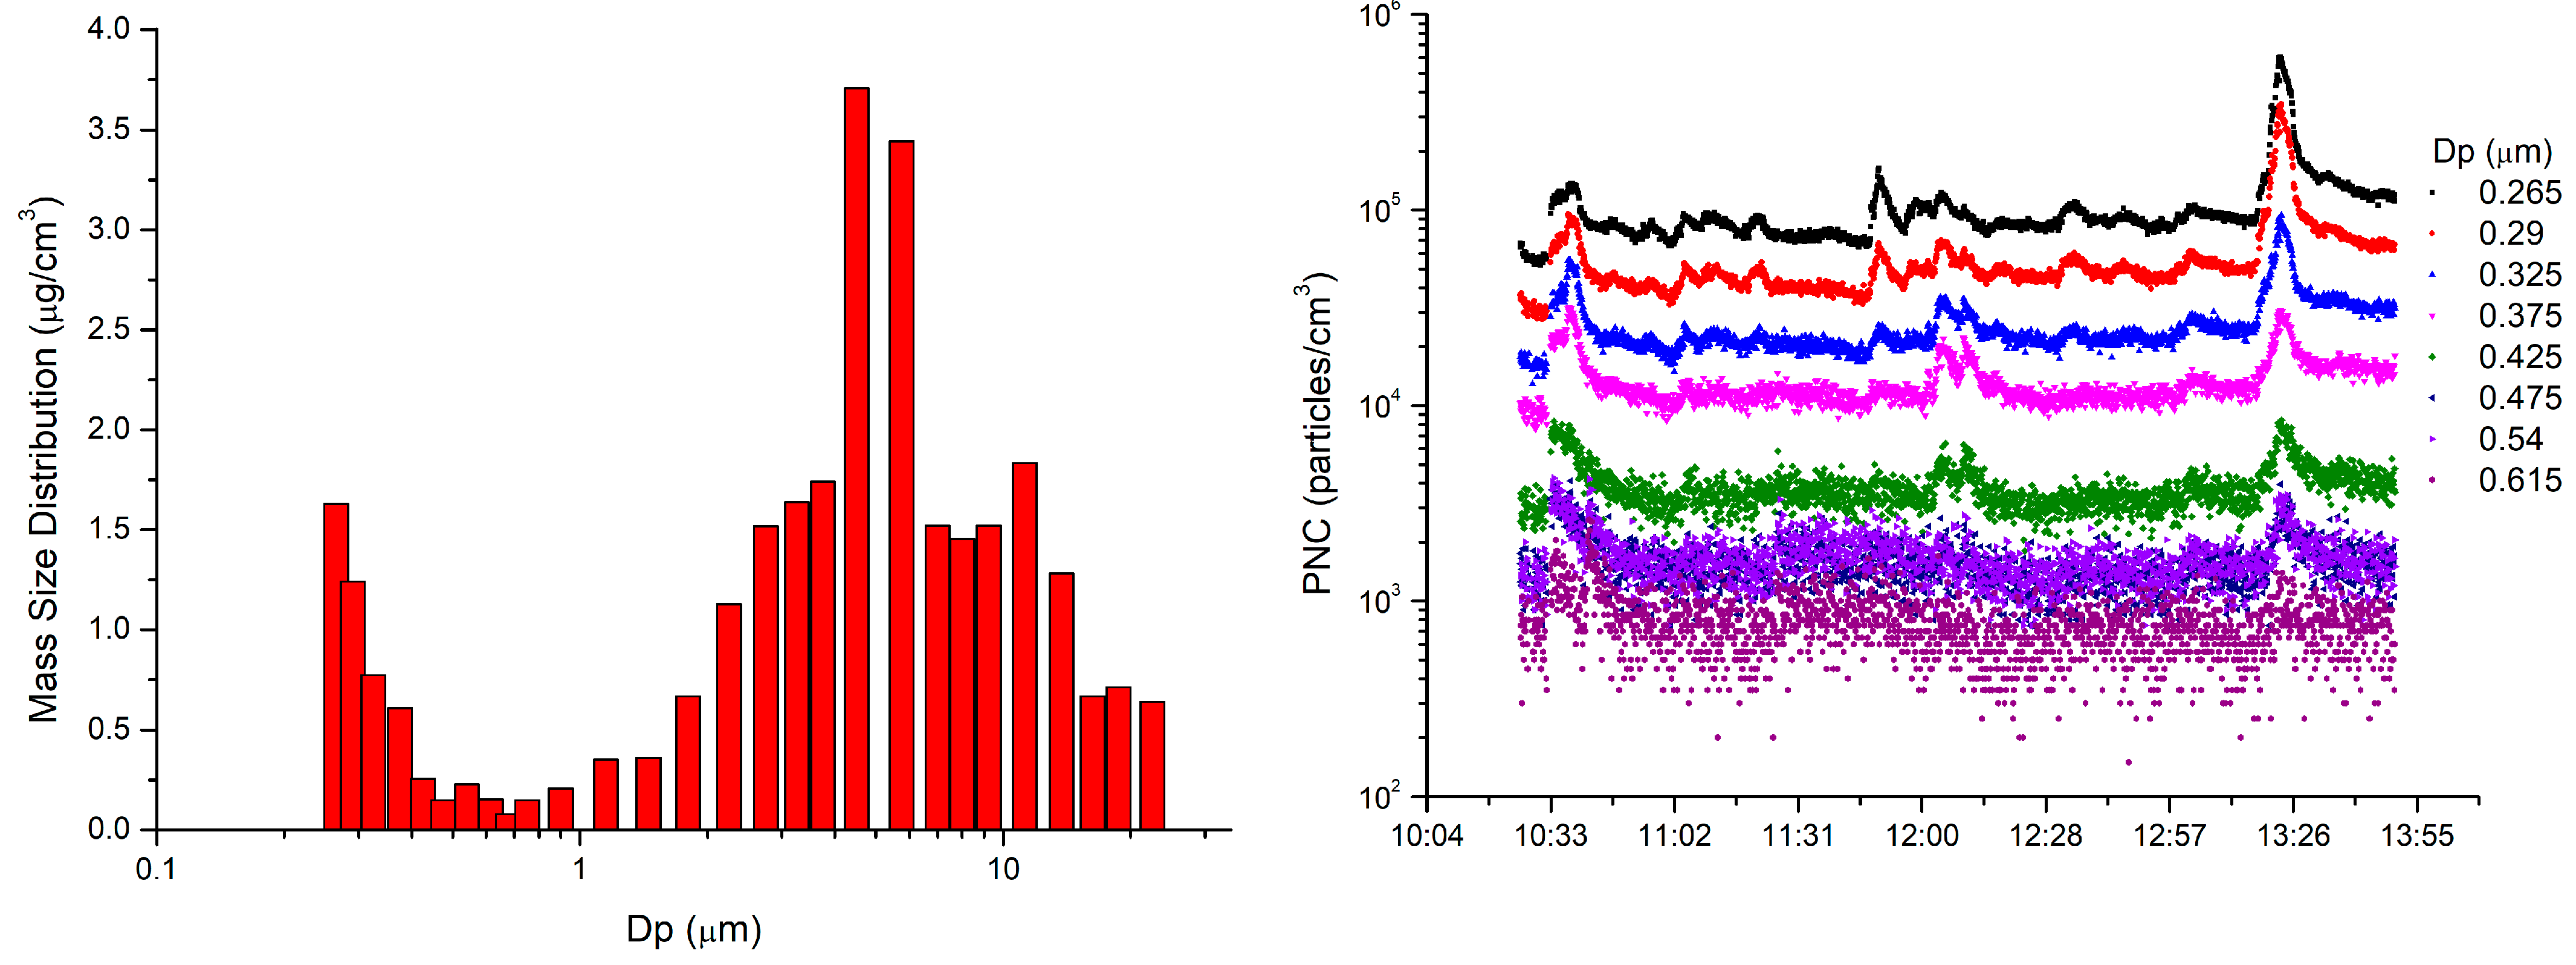
3.1. Particles and Ultrafineparticles
3.2. Diesel Particulate Matter (as Elemental Carbon)
3.3. Volatile Organic Compounds (VOCs)
3.4. Polycyclic Aromatic Hydrocarbons (PAHs)
3.5. SEM-EDX Microscopy
4. Conclusions
Author Contributions
Funding
Acknowledgments
Conflicts of Interest
References
- Glorennec, P.; Bonvallot, N.; Mandin, C.; Goupil, G.; Pernelet-Joly, V.; Millet, M.; Filleul, L.; Le Moullec, Y.; Alary, R. Is a quantitative risk assessment of air quality in underground parking garages possible? Indoor Air 2008, 18, 283–292. [Google Scholar] [CrossRef] [PubMed]
- Hwang, S.H.; Park, W.M. Indoor air quality assessment with respect to culturable airborne bacteria, total volatile organic compounds, formaldehyde, PM10, CO2, NO2, and O3 in underground subway stations and parking lots. Air Qual. Atmos. Health 2019, 12, 435–441. [Google Scholar] [CrossRef]
- Violante, F.S.; Barbieri, A.; Curti, S.; Sanguinetti, G.; Graziosi, F.; Mattioli, S. Urban atmospheric pollution: Personal exposure versus fixed monitoring station measurements. Chemosphere 2006, 64, 1722–1729. [Google Scholar] [CrossRef] [PubMed]
- Van Veelen, W.; Streekstra, W.-H.; Van Broekhuizen, P.; Schulte, P.; Reijnders, L. Exposure Limits for Nanoparticles: Report of an International Workshop on Nano Reference Values. Ann. Occup. Hyg. 2012, 56, 515–524. [Google Scholar] [CrossRef]
- Instituto Nacional de Seguridad e Higiene en el Trabajo (INSHT) Seguridad y salud en el trabajo con Nanomateriales. 2015. Available online: https://www.insst.es/documentacion/catalogo-de-publicaciones/seguridad-y-salud-en-el-trabajo-con-nanomateriales (accessed on 26 April 2022).
- Vermeulen, R.; Silverman, D.T.; Garshick, E.; Vlaanderen, J.; Portengen, L.; Steenland, K. Exposure-Response Estimates for Diesel Engine Exhaust and Lung Cancer Mortality Based on Data from Three Occupational Cohorts. Environ. Health Perspect. 2014, 122, 172–177. [Google Scholar] [CrossRef] [PubMed]
- IARC Diesel Engine Exhaust Carcinogenic. 2012. Available online: https://www.iarc.who.int/wp-content/uploads/2018/07/pr213_E.pdf (accessed on 26 April 2022).
- Directive 2004/37/EC—Carcinogens or Mutagens at Work|Safety and Health at Work EU-OSHA. Available online: https://osha.europa.eu/en/legislation/directive/directive-200437ec-carcinogens-or-mutagens-work (accessed on 31 March 2022).
- Debia, M.; Neesham-Grenon, E.; Mudaheranwa, O.C.; Ragettli, M.S. Diesel exhaust exposures in port workers. J. Occup. Environ. Hyg. 2016, 13, 549–557. [Google Scholar] [CrossRef] [PubMed]
- Wichmann, H.-E. Diesel Exhaust Particles. Inhal. Toxicol. 2007, 19, 241–244. [Google Scholar] [CrossRef] [PubMed]
- Kittelson, D.; Watts, W.; Johnson, J.; Air, C.; Board, R. Engine Manufacturers Association (EMA) South Coast Air Quality Management District. Available online: https://www.oyez.org/cases/2003/02-1343 (accessed on 26 April 2022).
- Debia, M.; Trachy-Bourget, M.-C.; Beaudry, C.; Neesham-Grenon, E.; Perron, S.; Lapointe, C. Characterization of indoor diesel exhaust emissions from the parking garage of a school. Environ. Sci. Pollut. Res. 2016, 24, 4655–4665. [Google Scholar] [CrossRef] [PubMed][Green Version]
- Cantrel, B.K.; Rubow, K.L.; Watts, W.F., Jr.; Bagley, S.T.; Carlson, D.H. Pollutant Levels in Underground Coal Mines Using Diesel Equipment. In Proceedings of the 6th US Mine Ventilation Symposium, Salt Lake City, UT, USA, 21–23 June 1993. [Google Scholar]
- Li, H.; Zeng, X.; Zhang, D.; Chen, P.; Yu, Z.; Sheng, G.; Fu, J.; Peng, P. Occurrence and carcinogenic potential of airborne polycyclic aromatic hydrocarbons in some large-scale enclosed/semi-enclosed vehicle parking areas. J. Hazard. Mater. 2014, 274, 279–286. [Google Scholar] [CrossRef] [PubMed]
- Ravindra, K.; Sokhi, R.; Van Grieken, R. Atmospheric polycyclic aromatic hydrocarbons: Source attribution, emission factors and regulation. Atmos. Environ. 2008, 42, 2895–2921. [Google Scholar] [CrossRef]
- Ravindra, K.; Bencs, L.; Wauters, E.; de Hoog, J.; Deutsch, F.; Roekens, E.; Bleux, N.; Berghmans, P.; Van Grieken, R. Seasonal and site-specific variation in vapour and aerosol phase PAHs over Flanders (Belgium) and their relation with anthropogenic activities. Atmos. Environ. 2006, 40, 771–785. [Google Scholar] [CrossRef]
- Qian, F.; Xue, C.-X.; Xu, X.-W.; Ma, D.; Li, P.; Zhu, N. VOCs Emission Characteristics of DPF Regeneration in National Ⅵ Diesel Engine. Huan Jing Ke Xue 2020, 41, 674–681. [Google Scholar] [PubMed]
- Wang, S.; Yuan, B.; Wu, C.; Wang, C.; Li, T.; He, X.; Huangfu, Y.; Qi, J.; Li, X.; Zheng, J.; et al. Oxygenated VOCs as Significant but Varied Contributors to VOC Emissions from Vehicles. Atmos. Chem. Phys. Discuss. 2022, 22, 9703–9720. [Google Scholar] [CrossRef]
- Government of the Principality of Asturias. Air Quality in Asturias 2021. 2022. Available online: https://cutt.ly/FZoqEJL (accessed on 28 May 2022).
- U.S. EPA. Guidelines for Exposure Assessment. EPA/600/Z-92/001. 1992. Available online: https://www.epa.gov/sites/default/files/2014-11/documents/guidelines_exp_assessment.pdf (accessed on 26 April 2022).
- NIOSH Diesel Particulate Matter (as Elemental Carbon) 5040. Available online: https://www.cdc.gov/niosh/docs/2003-154/pdfs/5040.pdf (accessed on 26 April 2022).
- Límites de Exposición Profesional para Agentes Químicos 2022—Portal INSST-INSST. Available online: https://www.insst.es/documentacion/catalogo-de-Publicaciones/limites-de-exposicion-profesional-para-agentes-quimicos-2022 (accessed on 26 April 2022).
- Ministerio de la Presidencia of Spain. Royal Decree 665/1997 on the Protection of Workers from the Risks Related to Exposure to Carcinogens at Work (1997, Updated on June 2021). Available online: https://www.boe.es/buscar/act.php?id=BOE-A-1997-11145 (accessed on 26 April 2022).
- Gonzalez, H.G.; García-Ordiales, E.; Diez, R.R. Analysis of the airborne mercury and particulate arsenic levels close to an abandoned waste dump and buildings of a mercury mine and the potential risk of atmospheric pollution. SN Appl. Sci. 2022, 4, 76. [Google Scholar] [CrossRef]
- Deutsche Gesetzliche Unfallversicherung, D.G.U. IFA—Technical Information: Ultrafine Aerosols and Nanoparticles at the Workplace. Available online: https://www.dguv.de/ifa/fachinfos/nanopartikel-am-arbeitsplatz/beurteilung-von-schutzmassnahmen/index-2.jsp (accessed on 22 June 2022).
- World Health Organization. WHO Global Air Quality Guidelines. Particulate Matter (PM2.5 and PM10), Ozone, Nitrogen Dioxide, Sulfur Dioxide and Carbon Monoxide; World Health Organization: Geneva, Switzerland, 2021; ISBN 9789240034228. [Google Scholar]
- García, H.; Pola, T.L. Health and safety in 3D printing. Int. J. Occup. Environ. Saf. 2022, 6, 14–25. [Google Scholar] [CrossRef]
- Mečiarová, Ľ.; Vilčeková, S.; Burdová, E.K.; Kiselák, J. Factors Effecting the Total Volatile Organic Compound (TVOC) Concentrations in Slovak Households. Int. J. Environ. Res. Public Health 2017, 14, 1443. [Google Scholar] [CrossRef] [PubMed]
- Working group 13 Total Volatile Organic Compounds (TVOC) in Indoor Air Quality Investigations; European Collaborative Action, Indoor Air Quality & Its Impact on Man. 1997. Available online: https://cdn.sparkfun.com/assets/learn_tutorials/1/4/3/ECA_Report19.pdf (accessed on 26 April 2022).
- Public Health England. Public Health England Indoor Air Quality Guidelines for Selected Volatile Organic Compounds (VOCs) in the UK; Public Health England: London, UK, 2019; p. 9. Available online: https://assets.publishing.service.gov.uk/government/uploads/system/uploads/attachment_data/file/831319/VO__statement_Final_12092019_CS__1_.pdf (accessed on 26 April 2022).
- IARC. Chemical Agents and Related Occupations; IARC: Lyon, France, 2012; ISBN 978-92-832-1323-9.


| Instrument | Sampling Principle | Main Metric | Range |
|---|---|---|---|
| CPC 3007 (TSI Inc., Shoreview, MN, USA) | Condensation nuclei counter | Particle number concentration | 0.010 to 1 µm 105 particles/cm3 |
| EEPS 3090 (TSI Inc., Shoreview, MN, USA) | Engine Exhaust Particle Sizer Spectrometer | Ultrafine particle size distribution (nanoparticles) | 0.0056 to 0.56 μm 32 Channels |
| Nanozen (Nanozen industries Inc., Vancouver, BC, Canada) | Optical Particle Counter (OPC) | Particle mass concentration and size distribution | PM4 (0.3 to 4.3 μm 12 Channels) |
| Trolex Air XD (Trolex Ltd., Hazel Grove, UK) | Optical Particle Counter (OPC) | Particle mass concentration and size distribution | PM10, PM4, PM2.5, PM1 (24 Channels) |
| GRIMM 1109 (Grimm Durag Group, Hamburg, Germany) | Spectrometer | Particle size distribution | 0.0265 to 34 μm 32 Channels |
| Description | Density | Benchmark Level (8-h Time-Weighted Average (TWA)) |
|---|---|---|
| Biopersistent granular nanomaterial in the range 1–100 nm | >6000 kg/m3 | 20,000 particles/cm3 |
| Biopersistent granular nanomaterial in the range 1–100 nm | <6000 kg/m3 | 40,000 particles/cm3 |
| Non-bio-persistent nanomaterial in the range 1–100 nm | Applicable OEL |
| VOCs | OEL |
|---|---|
| (mg/m3) | |
| n-Heptane | 2085 |
| n-Octane | 1420 |
| n-Nonane | 1065 |
| Benzene | 3.25 |
| 1,2-dichloropropane | 47 |
| p-Xylene | 221 |
| n-Butanol | 61 |
| o-Xylene | 221 |
| 1,3,5-Trimethylbenzene | 100 |
| Styrene | 86 |
| 1,2,4-Trimethylbenzene | 100 |
| 1,2,3-Trimethylbenzene | 100 |
| VOCs | Limit Values in µg/m3 | Source | |
|---|---|---|---|
| Short Term | Long Term | ||
| Acetaldehyde (75-07-0) | 1420 (1 h) | 280 (1 day) | Health Canada (2018) |
| α-Pinene (80-56-8) | 45,000 (30 min) | 4500 (1 day) | EPHECT (Trantallidi et al., 2015) |
| Benzene (71-43-2) | No recommended level of exposure | World Health Organisation (2010) | |
| D-Limonene (5989-27-5) | 90,000 (30 min) | 9000 (1 day) | EPHECT (Trantallidi et al., 2015) |
| Formaldehyde (50-00-0) | 100 (30 min) | 10 (1 year) | World Health Organisation (2010) |
| Naphthalene (91-20-3) | - | 3 (1 year) | Agency for Toxic Substances & Disease Registry (2005), USA |
| Styrene (100-42-5) | - | 850 (1 year) | Health Canada (2018) |
| Tetrachloroethylene (127-18-4) | - | 40 (1 day) | Health Canada (2018) |
| Toluene (108-88-3) | 15,000 (8 h) | 2300 (1 day) | Health Canada (2018) |
| Trichloroethylene (71-01-06) | No recommended level of exposure | World Health Organisation (2010) | |
| Xylenes-mixture (1330-20-7) | - | 100 (1 year) | Health Canada (2018) |
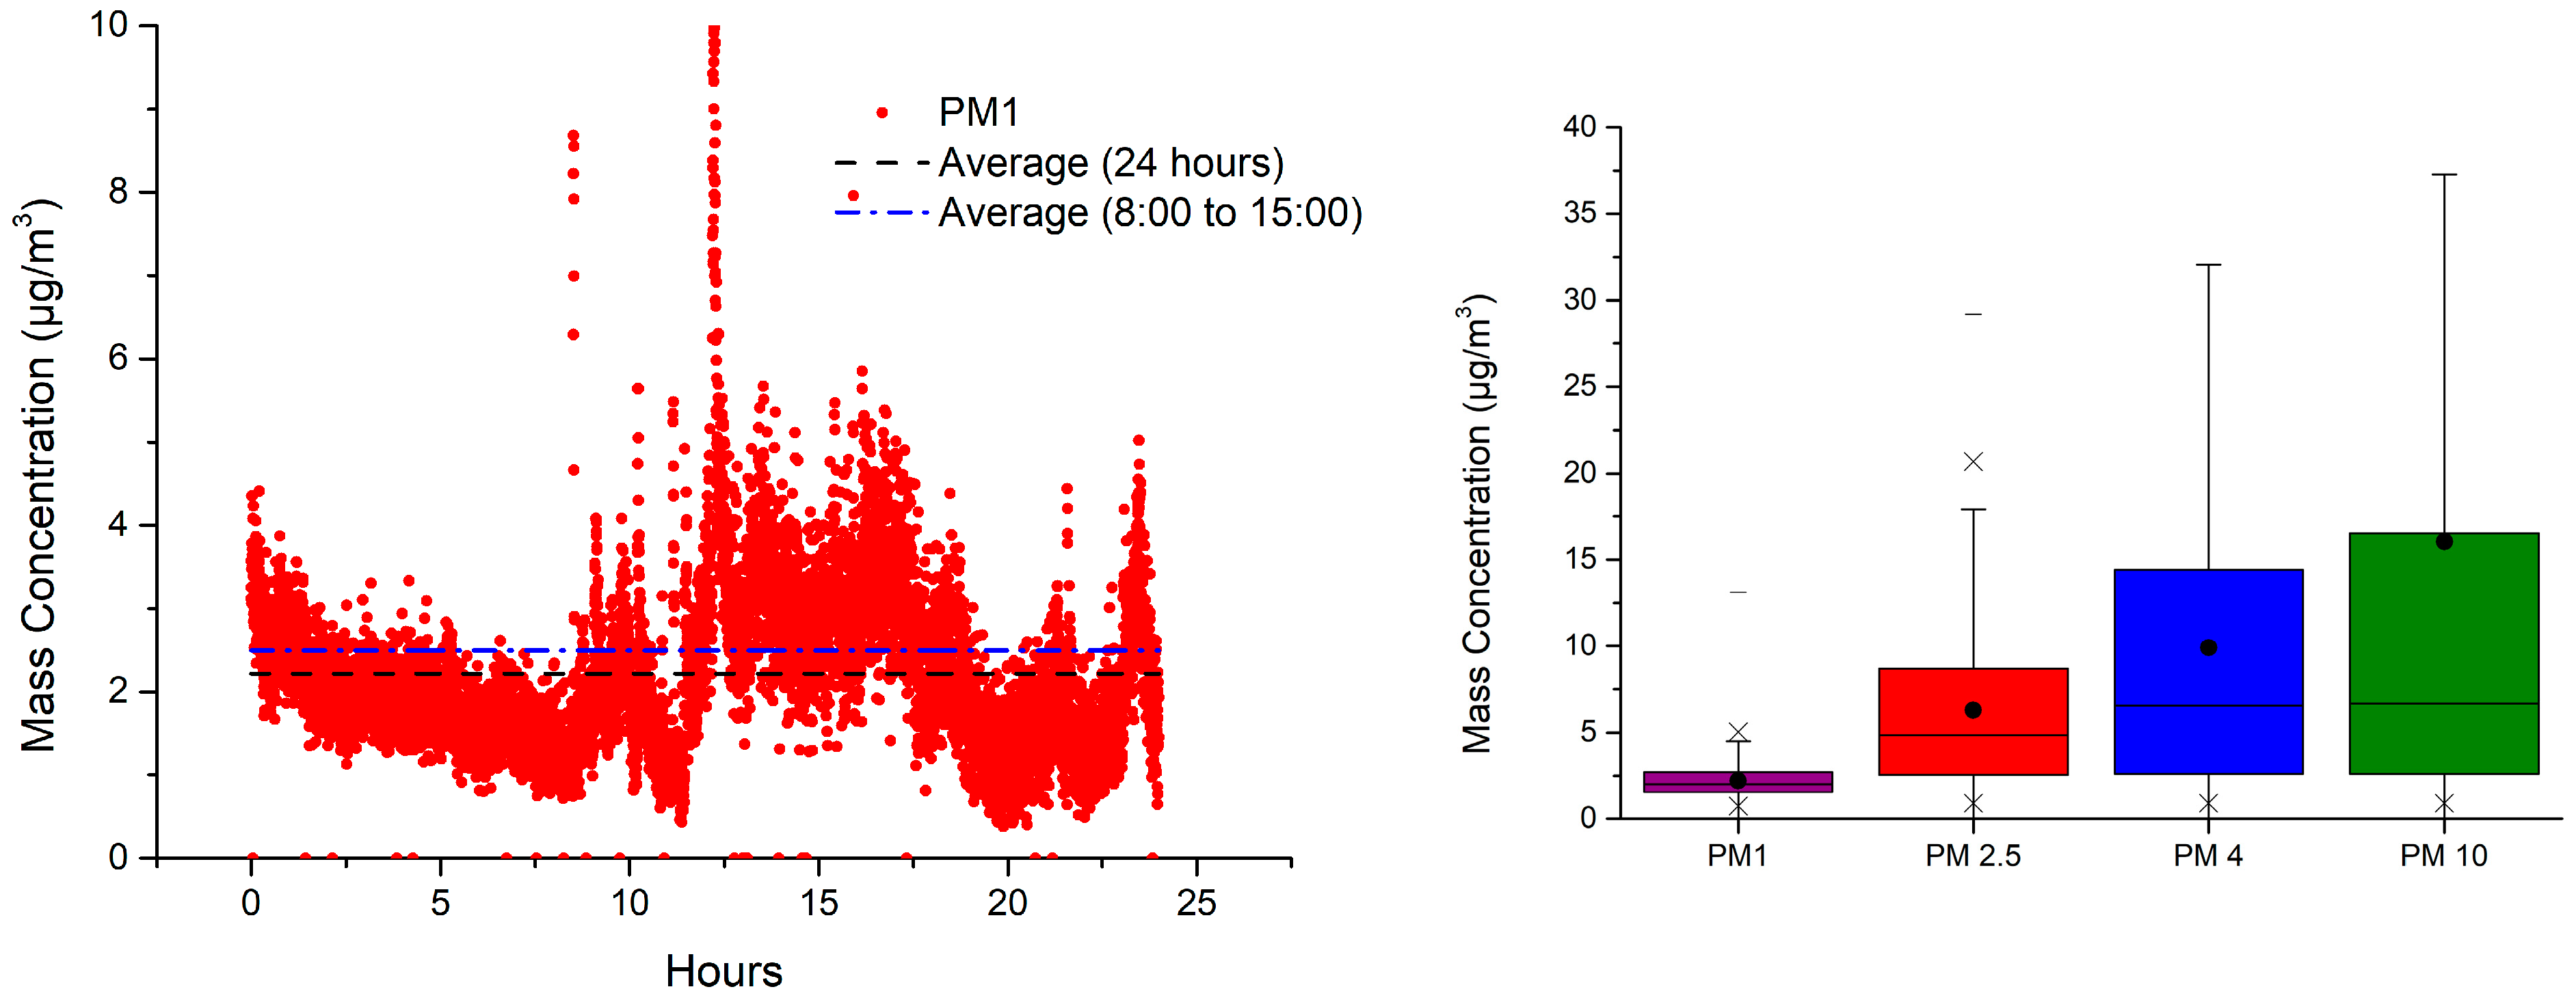
| Device | Sampling Time | PM1 (µg/m3) | PM 2.5 (µg/m3) | PM 4 (µg/m3) | PM 10 (µg/m3) |
|---|---|---|---|---|---|
| Trolex Air XD | Average (24 h) | 2.21 | 6.29 | 9.90 | 16.02 |
| Trolex Air XD | Average (8:00 to 15:00) | 2.49 | 7.45 | 12.30 | 21.16 |
| Nanozen | Average (8:00 to 15:00) | -- | -- | 7.1 | -- |
| VOCs | µg/m3 |
|---|---|
| n-Heptane | 2.73 |
| Benzene | 2.5 |
| Ethylbenzene | 2.44 |
| p-Xylene | 1.4 |
| m-Xylene | 2.32 |
| n-Dodecane | 0.61 |
| o-Xylene | 2.32 |
| 1,3,5-Trimethylbenzene | 0.79 |
| Styrene | 1.05 |
| n-Tridecane | 1.83 |
| 1,2,4-Trimethylbenzene | 3 |
| n-Pentadecane | 1.8 |
| n-Hexadecane | 1.07 |
Publisher’s Note: MDPI stays neutral with regard to jurisdictional claims in published maps and institutional affiliations. |
© 2022 by the authors. Licensee MDPI, Basel, Switzerland. This article is an open access article distributed under the terms and conditions of the Creative Commons Attribution (CC BY) license (https://creativecommons.org/licenses/by/4.0/).
Share and Cite
Garcia-Gonzalez, H.; Domat, M.; Lopez-Pola, T.; Fernandez-Rubio, P.; Fernandez-Rodriguez, P. Particulate Matter Characterization in a Hospital’s Underground Car Park. Powders 2022, 1, 194-206. https://doi.org/10.3390/powders1040013
Garcia-Gonzalez H, Domat M, Lopez-Pola T, Fernandez-Rubio P, Fernandez-Rodriguez P. Particulate Matter Characterization in a Hospital’s Underground Car Park. Powders. 2022; 1(4):194-206. https://doi.org/10.3390/powders1040013
Chicago/Turabian StyleGarcia-Gonzalez, Hector, Maida Domat, Teresa Lopez-Pola, Pilar Fernandez-Rubio, and Pablo Fernandez-Rodriguez. 2022. "Particulate Matter Characterization in a Hospital’s Underground Car Park" Powders 1, no. 4: 194-206. https://doi.org/10.3390/powders1040013
APA StyleGarcia-Gonzalez, H., Domat, M., Lopez-Pola, T., Fernandez-Rubio, P., & Fernandez-Rodriguez, P. (2022). Particulate Matter Characterization in a Hospital’s Underground Car Park. Powders, 1(4), 194-206. https://doi.org/10.3390/powders1040013