Article

Biome-Specific Estimation of Maximum Air Temperature Using MODIS LST in the São Francisco River Basin

by
Fábio Farias Pereira
1,*,
Mahelvson Bazilio Chaves
2,
Claudia Rivera Escorcia
1,
José Anderson Farias da Silva Bomfim
3 and
Mayara Camila Santos Silva
1
1
Laboratório de Pesquisas em Recursos Naturais (LPqRN), Universidade Federal de Alagoas (UFAL), Maceió 57072-970, Brazil
2
Campus Palmeira dos Índios, Instituto Federal de Alagoas (IFAL), Palmeiras dos Índios 57608-180, Brazil
3
Programa de Pós-Graduação em Demografia, Universidade Federal do Rio Grande do Norte (UFRN), Natal 59078-970, Brazil
*
Author to whom correspondence should be addressed.
Meteorology 2025, 4(3), 17; https://doi.org/10.3390/meteorology4030017
Submission received: 6 March 2025 / Revised: 20 June 2025 / Accepted: 25 June 2025 / Published: 30 June 2025
(This article belongs to the Special Issue Early Career Scientists' (ECS) Contributions to Meteorology (2025))

Abstract

The São Francisco River provides water for agriculture, urban areas, and hydroelectric power generation, benefiting millions of people in Brazil. Its Basin supports various species, some of which are endemic and rely on its unique habitats for survival. Currently, monitoring maximum air temperature in the São Francisco River Basin is limited due to sparse weather stations. This study proposes three linear regression models to estimate maximum air temperature using satellite-derived land surface temperature from the Aqua’s moderate resolution imaging spectroradiometer across the Basin’s three main biomes: Caatinga, Cerrado, and Mata Atlântica. With over 94,000 paired observations of ground and satellite data, the models showed good performance, accounting for 46% to 54% of temperature variation. Cross-validation confirmed reliable estimates with errors below 2.7 °C. The findings demonstrate that satellite data can improve air temperature monitoring in areas with limited ground observations and suggest that the proposed biome-specific models could assist in environmental management and water resource planning in the São Francisco River Basin. This includes providing more informed policies for climate adaptation and sustainable development or analyzing variations in maximum air temperature in arid and semi-arid regions to contribute to desertification mitigation strategies in the São Francisco River Basin.

1. Introduction

The components of land surface water and energy balances are critical drivers of environmental and socio-economic vulnerabilities under climate change, particularly in arid and semi-arid regions where water scarcity is acute [1,2]. The São Francisco River Basin (SFRB), Brazil’s largest drainage basin, exemplifies these challenges due to its hydroelectric significance and its role as the principal water source for the Brazilian semi-arid [2,3]. Recent studies have documented an upward trend in temperature and declining precipitation across the SFRB, raising concerns about water supply intermittency and energy shortages for the region’s 14.3 million inhabitants [4,5,6]. The Basin’s extensive reach (2863 km) spans diverse climatic zones containing unique biodiversity hotspots. In the semi-arid portions, where most surface water undergoes atmospheric transfer, Land Surface Temperature (LST) and air temperature (Tair) emerge as key controls on water availability [7]. This relationship makes continuous temperature monitoring essential for understanding vegetation dynamics, water resources, and urban expansion across the Basin.
The sparse distribution of ground-based weather stations maintained by the Instituto Nacional de Meteorologia (INMET) limits the spatial resolution of meteorological data, impeding robust geospatial analyses [8,9,10]. Satellite remote sensing has, consequently, become a powerful tool for temperature monitoring [11], with growing recognition of its value for spatial pattern analysis [12,13]. The expanding availability of global satellite data has enabled numerous validation studies linking remote sensing products with ground measurements [14,15,16,17]. However, the accuracy of these relationships can vary substantially across heterogeneous landscapes due to differences in land cover, surface emissivity, and local energy-balance processes [18,19].
Despite advances in modeling approaches—including machine learning and neural networks for air temperature estimation from satellite data [20,21,22,23,24,25]—there remains a gap: few studies have evaluated how biome-specific land cover classifications influence the LST–air temperature relationship within major river basins such as the SFRB. This is particularly relevant as Brazil’s official land cover database is increasingly used for water management and policy decisions. With the imminent completion of the São Francisco River Integration Project, designed to alleviate water shortages in semi-arid regions [26], the need for robust temperature monitoring tools has become urgent.
This study addresses this gap by developing and validating biome-partitioned linear regression models to estimate maximum air temperature from MODIS MYD21A1D LST retrievals across the three dominant biomes of the SFRB, as defined by the Brazilian environmental agency [27]. Our approach leverages the official land cover database used in policy-making, ensuring that our findings are directly applicable to regulatory and management frameworks. Additionally, by providing the first assessment of how biome-specific land cover classes modulate the relationship between satellite-derived LST and ground-based maximum air temperature in the SFRB, this work advances beyond previous studies that focused on continental or homogeneous landscapes. Our analysis quantifies the extent to which biome-partitioned models improve air temperature estimation accuracy over conventional, non-stratified approaches, thereby supporting finer-scale water resource management and climate adaptation planning. By validating these models against ground observations, we offer actionable background for integrating remote sensing into operational monitoring systems, especially in data-scarce semi-arid environments.
The paper is organized as follows: Section 2 describes the study area, data sources, and analytical methods. Section 3 presents the regression results and validation metrics. Section 4 and Section 5 discuss the implications of our findings and their relevance for water resource management.

2. Data and Methods

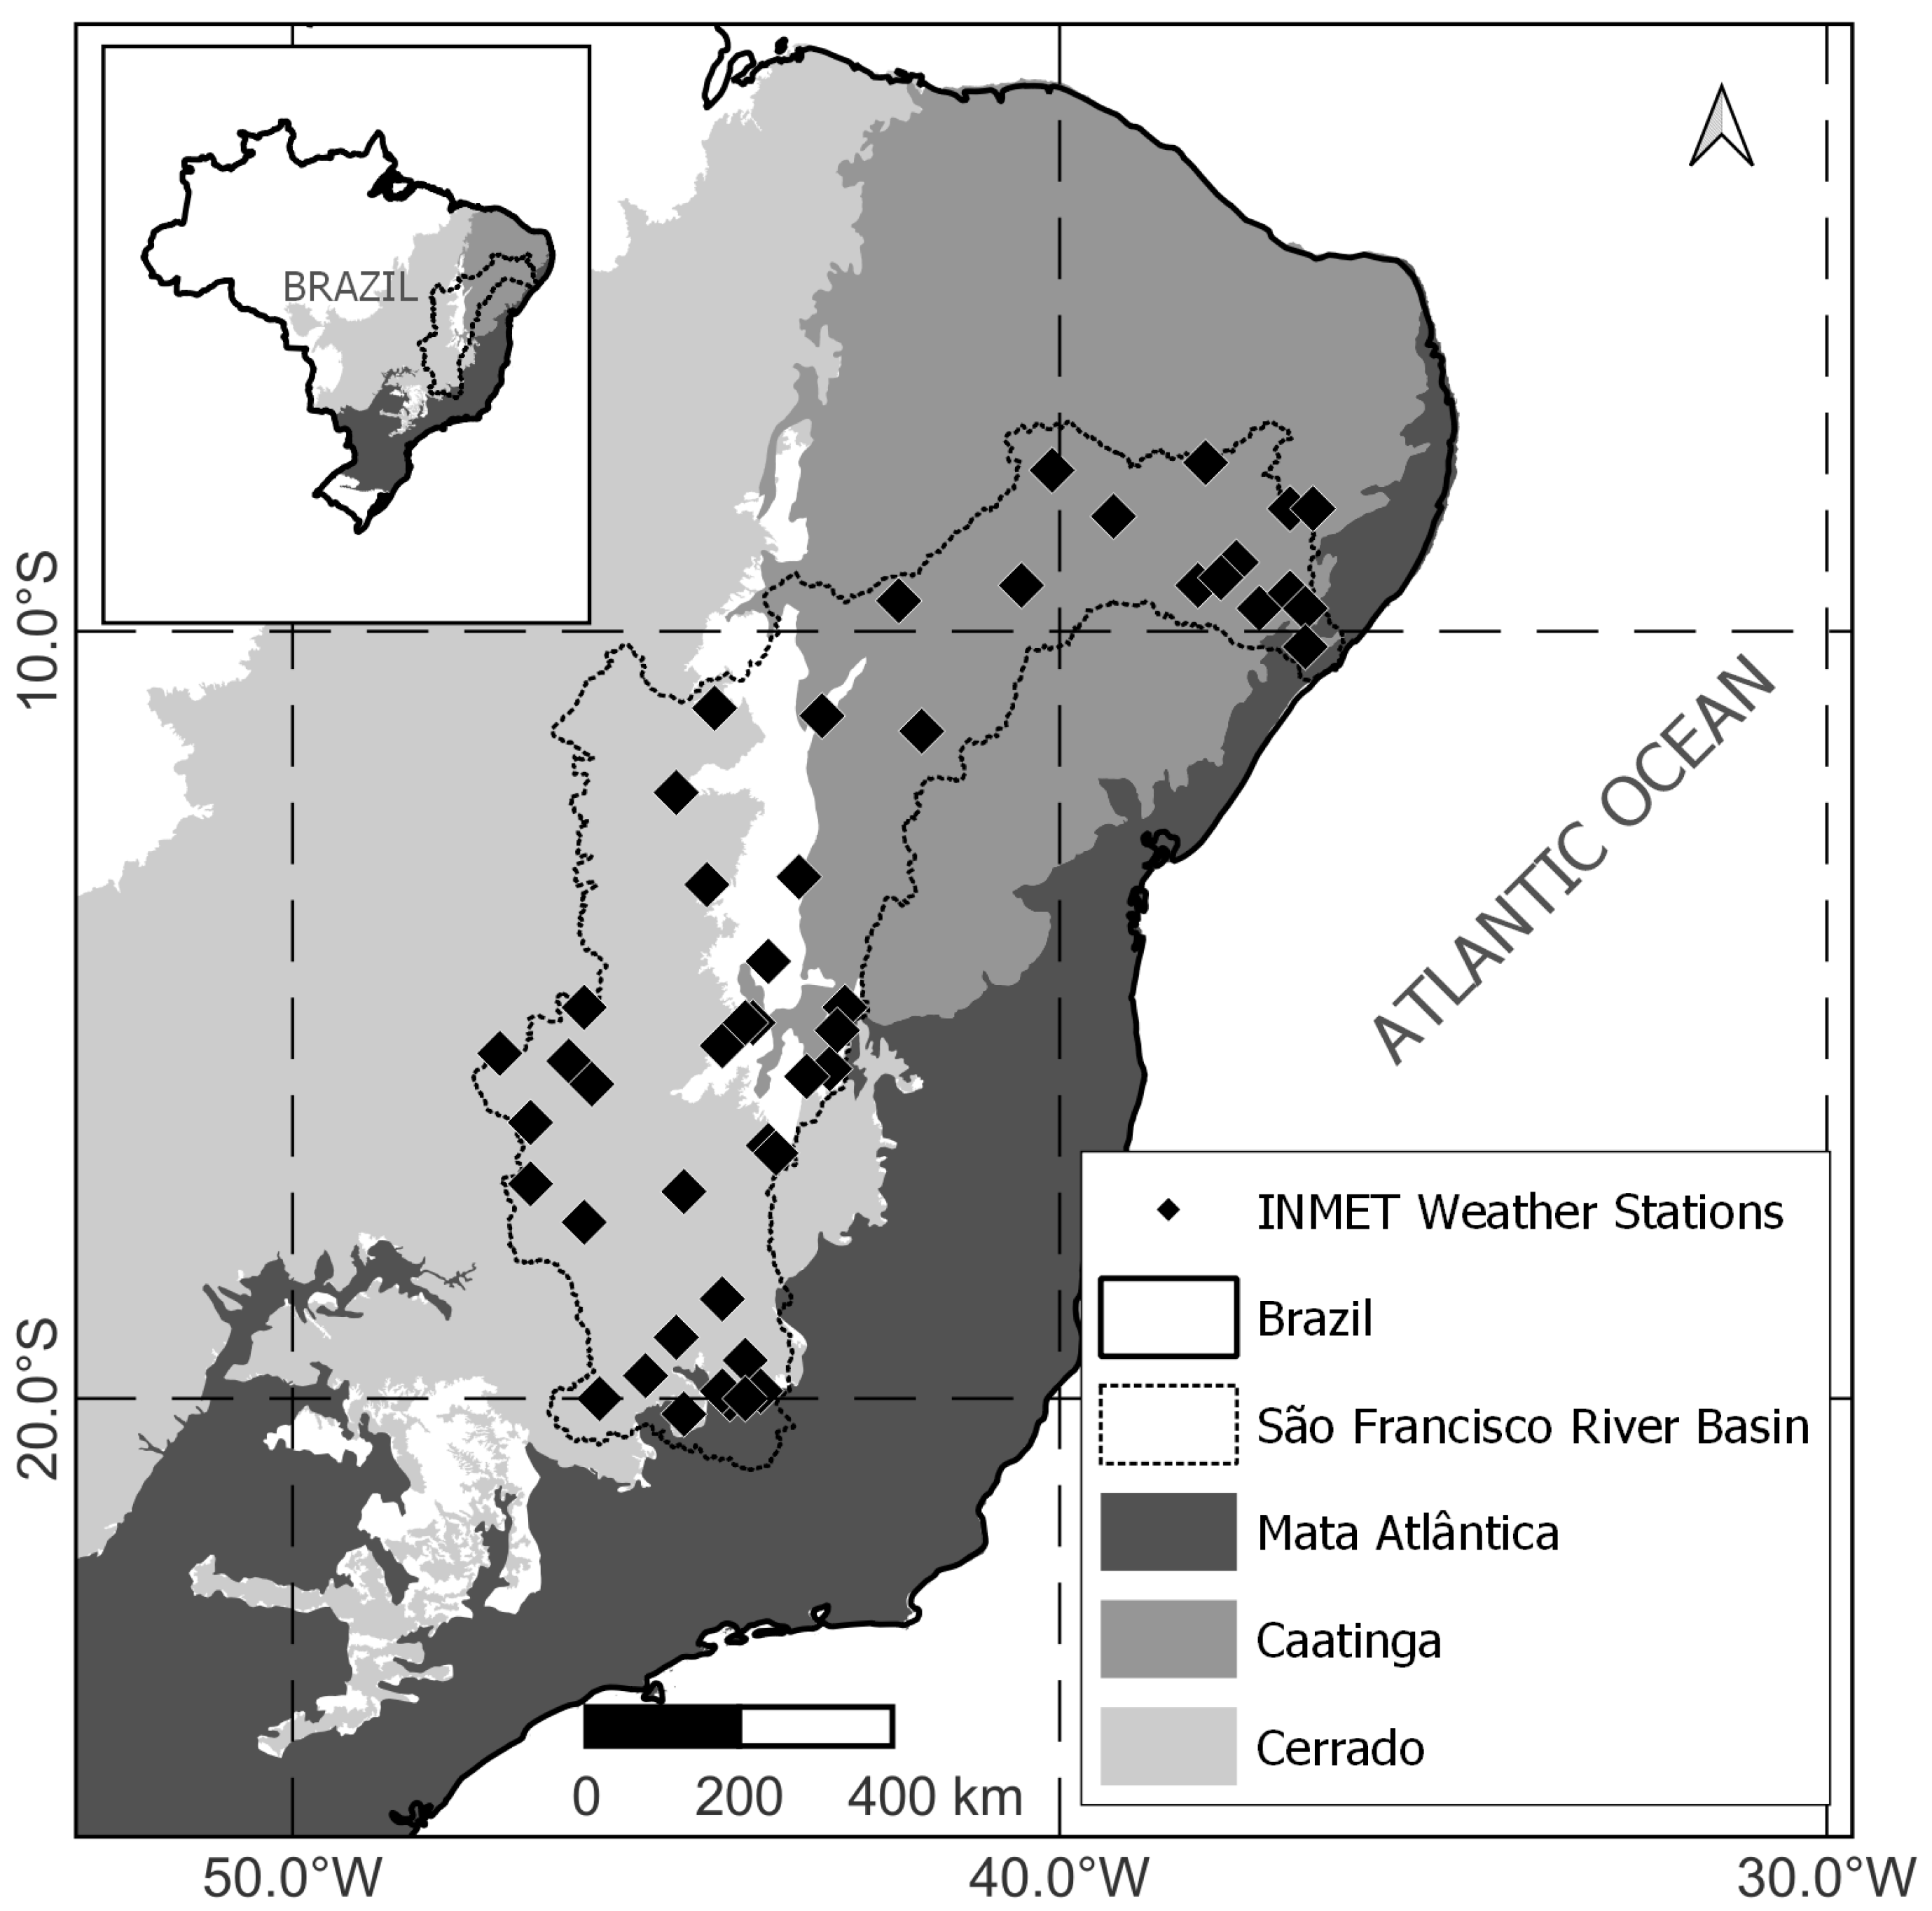
2.1. Types of Biome in the SFRB

Land Surface Temperature and air temperature have proven to be closely related to the type of land use/cover. In this study, we hypothesize that the SFRB is divided into three major types of land cover based on the Map of the Biomes of Brazil (MBB)—or the Mapa de Biomas do Brasil, in Portuguese—which are Caatinga, Cerrado, and Mata Atlântica.
The MBB is a product created from a partnership between the Instituto Brasileiro de Geografia e Estatística (IBGE) and the Ministério do Meio Ambiante (MMA). To elaborate this map, the IBGE and MMA assumed each biome as a region of the Brazilian land surface with the specific combination of fauna and flora with common past ecological and evolutionary circumstances, under the same geoclimatic conditions, that resulted in the present-day biological diversity.
A short description of each biome as well as their climate is given in this section, as they are the major drivers of change in the relationships between Land Surface Temperature and air temperature proposed by this study.
Caatinga is characterized by different types of landscapes, despite its semi-arid climate. This is because its type of vegetation is drought-tolerant and grows with very little rain, which usually falls scattered over the area assigned to Caatinga in the MBB.
Cerrado is considered to be a mix of woodland and grassland, with trees widely spaced over the landscape. It can be thought of as a savanna with a larger biological diversity than Caatinga. The overall climate in the Cerrado is tropical with notable long dry seasons.
Mata Atlântica is located along the coast, where the overall rainfall received is associated with coastal land–sea interaction. Although Mata Atlântica has the same tropical climate as Cerrado, it is wetter, which favors its richness of biological variation. This biome is the most impacted by human activities, as it is estimated to be home to more than 50% of the current population of Brazil.
Figure 1 illustrates the distribution of the three biomes in the SFRB:

2.2. MODIS LST Data

We used LST data from the Aqua satellite’s MODIS sensor, specifically the MYD21A1D product, which provides daily global LST retrievals at 1 km spatial resolution. The product is based on the MOD21 algorithm, designed to improve LST estimates in arid and semi-arid regions through enhanced atmospheric correction and emissivity separation.
We selected Aqua/MODIS over Terra/MODIS due to its 13:30 local overpass time, which is more representative of peak solar heating and, thus, closer to the daily maximum LST. The MYD21A1D product uses observations from thermal infrared bands and includes only cloud-free pixels with high-quality LST estimates. We used version 6.1 of the product, covering the period from 4 July 2002 to the present.
Details on MODIS spectral bands, algorithm characteristics, and quality filtering criteria are provided in the Supplementary Material (Table S1).

2.3. Site-Based Data

The Instituto Nacional de Meteorologia (INMET) maintains over a million data records from weather stations nationwide in the Banco de Dados Meteorológicos (BDMEP), following the standards and requirements formulated by World Meteorological Organization (WMO) for climate observations.
BDMEP uses a web-based portal for data selection based on the frequency of observations, the type of weather station, the geographic region, and the time frame, as well as the INMET identification number for the weather station. We selected and downloaded all the daily observations of maximum air temperature in the SFRB for the period of record from 4 July 2002 to the present, when MODIS/Aqua data were also available. In total, 48 weather stations met this filtering criteria.

2.4. Data Processing

We extracted daily LST data from MYD21A1D at the locations of 48 INMET weather stations within the SFRB. MODIS data were converted from digital counts to degrees Celsius using standard scaling factors. Only cloud-free, high-quality observations were retained. We aligned LST data with daily maximum air temperature records from weather stations, removing pairs with missing values.
The process of tile selection, mosaicking, and handling of missing MODIS values is detailed in the Supplementary Material (Figure S1).

2.5. Regression Analysis

We used linear regressions to model the relationships between the retrievals of MODIS/Aqua and maximum air temperature. Measurements of maximum air temperature were used as the response variable, whereas the retrievals of MODIS/Aqua LST data were used as the predictor variable. Each linear regression model consisted of two regression coefficients that defined the best line of fit that minimized the variance of the dataset. So, a set of eight regression coefficients were defined, being two coefficients for each of the three types of biome in the São Francisco River Basin and two more using the entire dataset, regardless of the biome. The ability of the regression models was measured by the correlation coefficient (R2) and the residual standard error.

2.6. Cross-Validation

In order to identify whether the bounds of the biome, as defined in the MBB, impacted the predictions of LST, we performed a cross-validation. For this, we set three subsets of data based on the locations of the INMET weather stations and the boundaries of the biomes. Then, we validated the regression model, trained on one subset, on the other two subsets, and on itself (for reference). Another reference used in the cross-validation was the validation of the regression model trained on all subsets. We used the Root Mean Squared Error (RMSE) and Mean Absolute Error (MAE) to evaluate the models.

3. Results

3.1. Datasets

After data processing, we selected 48 weather stations from the Banco de Dados Meteorológicos (BDMEP) of the INMET, covering the period from April 2002 to the present. The stations were sorted by biome within the SFRB, with 26 in Caatinga, 19 in Cerrado, and 3 in Mata Atlântica (Table 1). These distributions reflected the dominant land covers within the Basin and enabled assessment of how vegetation structure and climatic patterns influence surface–air temperature relationships.
Four pairwise datasets were generated: one per biome and one aggregate for the whole Basin. This resulted in 50,540 data points for Caatinga, 38,238 for Cerrado, 5766 for Mata Atlântica, and 94,544 for the full basin. The larger volume of data from Caatinga and Cerrado reflects both their spatial extent and the data availability, whereas the low sample from Mata Atlântica limited the resolution of its model.

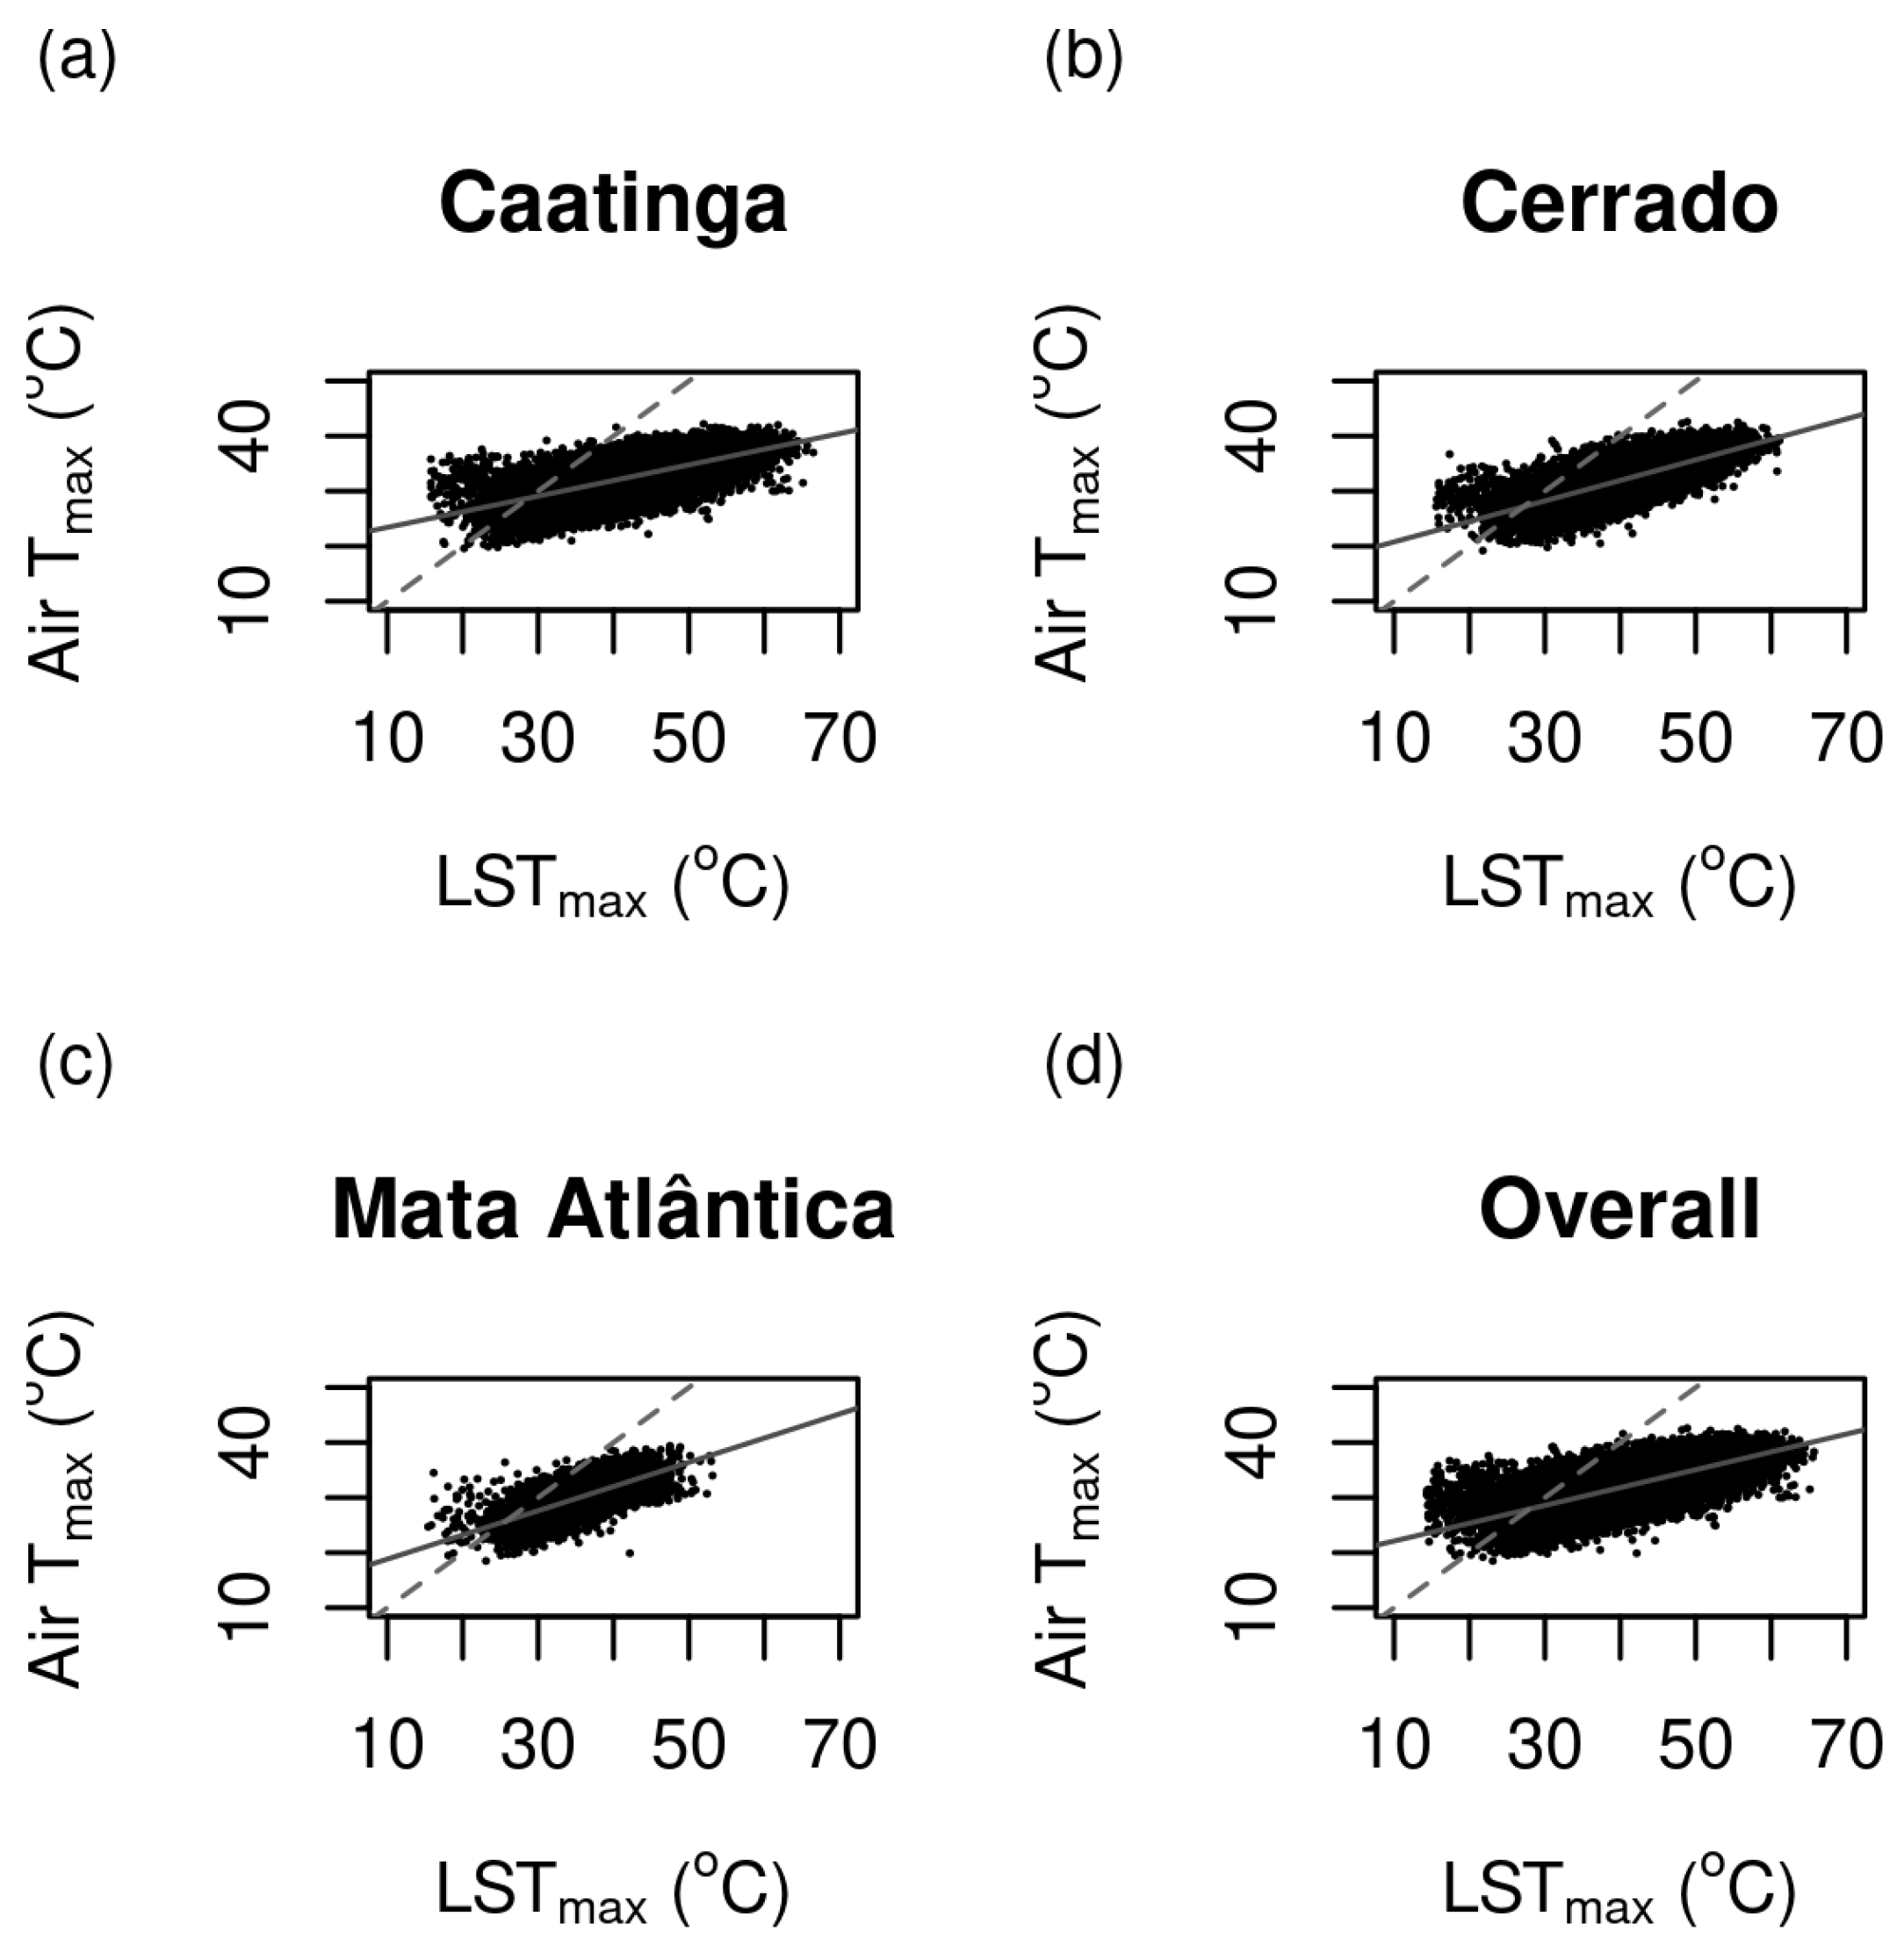
3.2. Regression Analysis

Figure 2 presents scatterplots of the maximum air temperature versus MODIS/Aqua LST, including fitted regression lines and lines of equality. These visualizations confirm strong linear tendencies, although clear biome-specific differences in model strength and spread are observed:
Table 2 summarizes the regression coefficients. The general model is defined as
A i r T m a x = C o e f f i c i e n t × L S T + C o n s t a n t ,
with biome-specific parameters allowing tailored application.
The biome Cerrado exhibited the strongest relationship, with a Residual Standard Error (RSE) of 2.07 °C and a correlation coefficient of 0.54. Caatinga, although more data-rich, showed the weakest correlation ( R 2 = 0.46), and Mata Atlântica had the highest residuals (RSE = 2.41 °C). These differences reflect ecological and climatic variation: Cerrado’s relatively homogeneous vegetative cover and tropical climate yield more consistent LST–air temperature dynamics, while the heterogeneity and dense canopy of Mata Atlântica may decouple surface and air temperature due to shading and evapotranspiration buffering effects. The weaker performance in Caatinga is attributable to sparse vegetation and frequent cloud-free conditions resulting in high LST variability, which complicates its predictive relationship with air temperature [28].

3.3. Cross-Validation

Table 3 presents the Root Mean Squared Error (RMSE) and Mean Absolute Error (MAE) from cross-validation, where each biome-specific model was tested on its own and on other biomes.
Models trained and tested within the same biome performed best, supporting the idea that vegetation and climate boundaries influence temperature dynamics. For example, the Cerrado model achieved an RMSE of 2.07 °C and an MAE of 1.63 °C when tested on Cerrado data, compared to RMSE values above 2.4 °C when applied to Mata Atlântica. The model for the entire SFRB performed moderately across all the biomes (e.g., RMSE = 2.15 °C in Caatinga and 2.53 °C in Mata Atlântica).

4. Discussion

Figure 2 illustrates a consistent positive linear trend between MODIS/Aqua LST and the observed maximum air temperature across all the datasets, confirming the expected physical coupling between surface heating and near-surface atmospheric warming—particularly for the daily maxima. This pattern is evident for the extreme values of maximum LST, as they mostly fall below the line of equality, when land surface is likely to be hotter than air. All the linear regression models captured this pattern from the datasets. Furthermore, these results reveal that LST can serve as a proxy for maximum air temperature with moderate confidence for the Cerrado, Caatinga, and Mata Atlântica biomes—critical in areas where station coverage is sparse. However, any operational system using LST to estimate T m a x should incorporate vegetation indices (e.g., NDVI) to compensate for canopy fraction changes [29] in such a way that one can, for example, confidently parameterize sensible and latent heat fluxes based on LST retrievals. This could improve estimates of evapotranspiration rates, soil moisture depletion, and, ultimately, streamflow. This is because by accounting for canopy fraction and phenological changes, coupled models capture drought-induced declines in ET more accurately than LST alone, particularly in the pasture-dominated areas of the Cerrado. Late-fall satellite soil moisture estimates, when informed by both LST and vegetation signals, are closely linked with subsequent spring streamflow, offering lead time for hydrological forecasting. This combined remote sensing approach could improve representation of pre-wet-season moisture deficits and runoff generation in seasonally dry environments.
All the regression models were built from relatively large datasets (up to 94,544 data points). The standard errors of the estimated coefficients were close to 0. The ability of the LST retrievals from the MYD21A1D data product to predict the maximum air temperature turned out to be statistically significant for a 95% confidence interval (p-value < 0.01—see Table 2). These statistical results reinforce the reliability of LST retrievals as predictors of maximum air temperature [30]. They highlight their potential as valuable inputs for temperature monitoring systems to support climate adaptation strategies and promote sustainable environmental and agricultural practices in the SFRB, as discussed in [31]. In practical terms, this strengthens the case for incorporating satellite-derived LST as a cost-effective and scalable tool for regional temperature monitoring and for improving early warning systems, particularly in areas vulnerable to heat stress and drought, such as the semi-arid Caatinga [21,32].
The regression models demonstrate a statistically significant relationship between MODIS-derived LST and the observed maximum air temperature. The biome-specific models yielded varying correlation coefficients (R²), with the Cerrado biome exhibiting the highest R² of 0.54, followed by Mata Atlântica at 0.49, and Caatinga at 0.46. These variations align with known differences in vegetation cover and moisture availability among the biomes, which influence the surface energy balance and, consequently, the LST–air temperature relationship [33]. The Residual Standard Errors (RSEs) ranged from 2.07 °C in the Cerrado to 2.41 °C in Mata Atlântica, indicating the models’ varying predictive accuracies. The higher RSE in Mata Atlântica can be attributed to its complex terrain and heterogeneous land cover, which can introduce variability in LST measurements [34].
Despite all the models showing consistent positive trends, differences in predictive performance among the biomes offer gaps that show how vegetation structure and surface properties influence land–atmosphere interactions. For example, the model for Cerrado showed the strongest fit, which can be attributed to its relatively homogeneous savanna vegetation and consistent seasonal climate. These characteristics support stable surface energy partitioning, thus yielding a clearer LST–air temperature relationship. Caatinga had the weakest correlation, a result that could be linked to its sparse vegetation and high surface exposure. Under such conditions, LST becomes highly variable due to rapid soil heating, which could have led to decreasing its predictive power for air temperature.
The model for Mata Atlântica yielded the largest Residual Standard Error (RSE = 2.41 °C). This likely reflects not only the sample limitations but also the biome’s structural complexity: dense canopies and high humidity levels can buffer surface temperatures through evapotranspiration and shading. These processes decouple LST from near-surface air temperatures, reducing the reliability of simple linear models for forested areas. This outcome confirms that vegetation type and local climatic conditions significantly influence temperature dynamics, validating the need for biome-specific models. More importantly, it reinforces the value of forest cover as a regulator of microclimate [35,36,37].
The superior performance of the within-biome models underscores the role of land-cover heterogeneity—specifically, variations in canopy structure and moisture regimes—in driving surface–atmosphere thermal coupling. Forested ecosystems like the Mata Atlântica exhibit thermally buffered regimes, while open-canopy biomes such as the Cerrado (tropical savanna) and Caatinga (semi-arid shrubland) show heightened sensitivity to surface radiative forcing [38].
Despite these findings, several limitations should be noted. First, cloud contamination can introduce data gaps, most notably during the wet season in humid biomes such as the Mata Atlântica [39,40]. Second, the under-representation of Mata Atlântica stations limits the robustness of its biome-specific model [17]. Third, the use of simple linear regressions does not capture non-linear or lagged surface–air interactions (e.g., canopy buffering or soil moisture feedback) that influence extreme temperature events [41,42].

5. Conclusions

We performed a regression analysis with over 5000 data points (at least) per dataset, spanning from 2002 to the present, which yielded four linear regression models that represent the relationships between maximum air temperature and LST from the MYD21A1D data product ( LST M Y D 21 A 1 D ): three for each biome in the São Francisco River basin, and one for the entire basin. All the linear regression models showed a positive correlation between extreme values of maximum air temperature (Air T m a x ) and Land Surface Temperature, as retrieved from the remote sensing product.
We demonstrated that MODIS/Aqua LST data can provide a proxy for estimating the daily maximum air temperature ( T m a x ) across the SFRB. Through biome-specific and general linear regression models, we established strong and significant relationships between satellite-derived LST and in situ air temperature, particularly in the Cerrado and Caatinga biomes. Despite regional heterogeneity, the overall model for the basin maintained acceptable predictive performance, indicating its utility for large-scale applications.
From a technical perspective, this study has shown that LST data can offer a practical and scalable alternative to sparse or inconsistent meteorological station networks across the SFRB. Their integration into climate monitoring frameworks could further enhance spatial resolution of temperature assessments, improve hydrological modeling (including evapotranspiration and water balance estimations), and support early-warning systems for heatwaves and drought.
From a policy standpoint, the results underscore the importance of considering land cover and biome characteristics when interpreting surface–atmosphere temperature dynamics. The stronger coupling in savanna and semi-arid regions compared to forested areas highlights the value of vegetation in thermal regulation. This supports conservation strategies—such as forest protection and land restoration—not only for biodiversity but also for their climate-buffering services. Moreover, satellite-based temperature proxies can inform evidence-based decision-making in natural resource management, agricultural planning, and climate adaptation for the SFRB.
Looking forward, the adoption of more sophisticated modeling approaches could further improve predictive accuracy and capture complex environmental interactions. Future work should explore machine learning algorithms. Incorporating these intelligent methods, along with additional predictors (e.g., vegetation indices, topography, soil moisture), will likely yield more reliable estimates of near-surface air temperature from satellite LST.

Supplementary Materials

The following supporting information can be downloaded at https://www.mdpi.com/article/10.3390/meteorology4030017/s1, Table S1: MODIS LST Data Product Details, Figure S1: File Selection, Quality Filtering, Data Conversion, and Matching Details.

Author Contributions

Conceptualization, C.R.E. and F.F.P.; methodology, software, investigation, and analysis, F.F.P., M.B.C., J.A.F.d.S.B. and M.C.S.S.; formal analysis, M.C.S.S. and F.F.P.; writing—original draft preparation, writing—review and editing and supervision, C.R.E. and F.F.P.; visualization, F.F.P. and M.B.C.; funding acquisition, F.F.P. All authors have read and agreed to the published version of the manuscript.

Funding

There was no external funding to carry out the scientific activities presented in this research. However, Fábio Farias Pereira received travel grants from Fundação de Amparo à Pesquisa do Estado de Alagoas (FAPEAL) in the ERC/CONPAP/CNPq N° 7/2018 call “Research opportunities in Europe for active PhD researchers from Brazil” to collaborate with European researchers, which he used to present the outcome of this research in seminars and workshops. Then, he used the valuable feedback to improve the overall quality of this work.

Institutional Review Board Statement

Not applicable.

Informed Consent Statement

Not applicable.

Data Availability Statement

Two datasets were used in the analysis presented in this research. Both datasets were publicly available, by the time we carried out the analysis, at https://lpdaac.usgs.gov/products/myd21v061/ (accessed on 24 June 2025) for the Aqua/MODIS dataset and at https://bdmep.inmet.gov.br/ (accessed on 24 June 2025) for the INMET weather stations.

Conflicts of Interest

The authors declare no conflict of interest.

Abbreviations

The following abbreviations are used in this manuscript:
MBBMap of Biomes of Brazil
IBGEInstituto Brasileiro de Geografia e Estatística
MMAMinistério do Meio Ambiente
LSTLand Surface Temperature
LST LST M Y D 21 A 1 D Land Surface Temperature from the MYD21A1D data product
Air T m a x maximum air temperature
RMSERoot Mean Squared Error
MAEMean Absolute Error
SFRBSão Francisco River Basin
TIR bandsThermal Infrared bands
SIN gridSinusoidal grid
MODISModerate-Resolution Imaging Spectroradiometer
INMETInstituto Nacional de Meteorologia
BDMEPBanco de Dados Meteorológicos
LP DAACLand Processes Distributed Active Archive Center
ERCEuropean Research Council
CONFAPConselho Nacional das Fundações Estaduais de Amparo à Pesquisa
CNPqConselho Nacional de Desenvolvimento Científico e Tecnológico

References

  1. Nova, F.V.P.V.; Torres, M.F.A.; Coelho, M.P. Uso e ocupação da terra e indicadores ambientais de impactos negativos: Baixo curso do Rio São Francisco, Estado de Alagoas, Brasil. Bol. Geogr. 2015, 33, 1–14. [Google Scholar] [CrossRef]
  2. Fernandes, M.M.; de Moura Fernandes, M.R.; Garcia, J.R.; Matricardi, E.A.T.; de Souza Lima, A.H.; de Araújo Filho, R.N.; Gomes Filho, R.R.; Piscoya, V.C.; Piscoya, T.O.F.; Cunha Filho, M. Land use and land cover changes and carbon stock valuation in the São Francisco river basin, Brazil. Environ. Challenges 2021, 5, 100247. [Google Scholar] [CrossRef]
  3. Bezerra, B.G.; Silva, L.L.; Santos e Silva, C.M.; de Carvalho, G.G. Changes of precipitation extremes indices in São Francisco River Basin, Brazil from 1947 to 2012. Theor. Appl. Climatol. 2019, 135, 565–576. [Google Scholar] [CrossRef]
  4. Silva, A.; Pereira, F. Assessment of Drought Occurrence and Severity in the São Francisco River Basin between the years 1961 to 2019. Rev. Geociencias Nordeste 2023, 9, 56–68. [Google Scholar] [CrossRef]
  5. Damasceno, J.; Oliveira, E.; Pereira, F.; Duan, Z. Assessment of Precipitation Deficit in the São Francisco River Basin from 1998 to 2018. Rev. Bras. Meteorol. 2023, 38, e38230017. [Google Scholar] [CrossRef]
  6. Oliveira, E.V.S.V.d.; Damasceno, J.H.B.; Pereira, F.F.; Holanda, S.C.d. Avaliação do Desempenho e Limitações do PERSIANN-CDR: Um Estudo de Caso na Bacia do Rio São Francisco: Assessing the Performance and Limitations of PERSIANN-CDR: A Case Study in the São Francisco River Basin. Rev. GeociêNcias Nordeste 2024, 10, 237–243. [Google Scholar] [CrossRef]
  7. Kayet, N.; Pathak, K.; Chakrabarty, A.; Sahoo, S. Spatial impact of land use/land cover change on surface temperature distribution in Saranda Forest, Jharkhand. Model. Earth Syst. Environ. 2016, 2, 1–10. [Google Scholar] [CrossRef]
  8. Alvares, C.A.; Stape, J.L.; Sentelhas, P.C.; de Moraes Gonçalves, J.L. Modeling monthly mean air temperature for Brazil. Theor. Appl. Climatol. 2013, 113, 407–427. [Google Scholar] [CrossRef]
  9. de Souza, A.; dos Santos, C.M.; Ihaddadene, R.; Cavazzana, G.; Abreu, M.C.; de Oliveira-Júnior, J.F.; Pobocikova, I.; de Gois, G.; Lins, T.M.P. Analysis of extreme monthly and annual air temperatures variability using regression model in Mato Grosso do Sul, Brazil. Model. Earth Syst. Environ. 2022, 8, 647–663. [Google Scholar] [CrossRef]
  10. de Carvalho Alves, M.; Sanches, L.; de Carvalho, L.G. Geostatistical surfaces of climatological normals of mean air temperature in Minas Gerais. Environ. Monit. Assess. 2022, 194, 1–21. [Google Scholar] [CrossRef]
  11. Prihodko, L.; Goward, S.N. Estimation of air temperature from remotely sensed surface observations. Remote. Sens. Environ. 1997, 60, 335–346. [Google Scholar] [CrossRef]
  12. Xian, G. Satellite remotely-sensed land surface parameters and their climatic effects for three metropolitan regions. Adv. Space Res. 2008, 41, 1861–1869. [Google Scholar] [CrossRef]
  13. Callejas, I.J.; de Oliveira, A.S.; de Moura Santos, F.M.; Durante, L.C.; Nogueira, M.C.d.J.A.; Zeilhofer, P. Relationship between land use/cover and surface temperatures in the urban agglomeration of Cuiabá-Várzea Grande, Central Brazil. J. Appl. Remote Sens. 2011, 5, 053569. [Google Scholar] [CrossRef]
  14. Camparotto, L.B.; Blain, G.C.; Giarolla, A.; Adami, M.; de Camargo, M.B. Validation of temperature and rainfall data obtained by remote sensing for the state of São Paulo, Brazil. Rev. Bras. Eng. Agrícola e Ambient. 2013, 17, 665–671. [Google Scholar] [CrossRef]
  15. Caparoci Nogueira, S.M.; Moreira, M.A.; Lordelo Volpato, M.M. Evaluating precipitation estimates from Eta, TRMM and CHRIPS Data in the south-southeast region of Minas Gerais State—Brazil. Remote Sens. 2018, 10, 313. [Google Scholar] [CrossRef]
  16. Thomas, C.; Wey, E.; Blanc, P.; Wald, L. Validation of three satellite-derived databases of surface solar radiation using measurements performed at 42 stations in Brazil. Adv. Sci. Res. 2016, 13, 81–86. [Google Scholar] [CrossRef]
  17. Chaves, M.B.; Farias Pereira, F.; Rivera Escorcia, C.; Cavalcante, N. Assessing Drought Vulnerability in the Brazilian Atlantic Forest Using High-Frequency Data. Meteorology 2024, 3, 262–280. [Google Scholar] [CrossRef]
  18. Zhang, W.; Li, Y.; Wu, X.; Chen, Y.; Chen, A.; Schwalm, C.R.; Kimball, J.S. Divergent Response of Vegetation Growth to Soil Water Availability in Dry and Wet Periods Over Central Asia. J. Geophys. Res. Biogeosci. 2021, 126, e2020JG005912. [Google Scholar] [CrossRef]
  19. Vancutsem, C.; Ceccato, P.; Dinku, T.; Connor, S.J. Evaluation of MODIS land surface temperature data to estimate air temperature in different ecosystems over Africa. Remote Sens. Environ. 2010, 114, 449–465. [Google Scholar] [CrossRef]
  20. Janatian, N.; Sadeghi, M.; Sanaeinejad, S.H.; Bakhshian, E.; Farid, A.; Hasheminia, S.M.; Ghazanfari, S. A statistical framework for estimating air temperature using MODIS land surface temperature data. Int. J. Climatol. 2017, 37, 1181–1194. [Google Scholar] [CrossRef]
  21. Yang, Y.Z.; Cai, W.H.; Yang, J. Evaluation of MODIS land surface temperature data to estimate near-surface air temperature in Northeast China. Remote Sens. 2017, 9, 410. [Google Scholar] [CrossRef]
  22. Benali, A.; Carvalho, A.; Nunes, J.; Carvalhais, N.; Santos, A. Estimating air surface temperature in Portugal using MODIS LST data. Remote Sens. Environ. 2012, 124, 108–121. [Google Scholar] [CrossRef]
  23. Shen, H.; Jiang, Y.; Li, T.; Cheng, Q.; Zeng, C.; Zhang, L. Deep learning-based air temperature mapping by fusing remote sensing, station, simulation and socioeconomic data. Remote Sens. Environ. 2020, 240, 111692. [Google Scholar] [CrossRef]
  24. dos Santos, R.S. Estimating spatio-temporal air temperature in London (UK) using machine learning and earth observation satellite data. Int. J. Appl. Earth Obs. Geoinf. 2020, 88, 102066. [Google Scholar] [CrossRef]
  25. Liu, J.; Hagan, D.F.T.; Holmes, T.R.; Liu, Y. An Analysis of Spatio-Temporal Relationship between Satellite-Based Land Surface Temperature and Station-Based Near-Surface Air Temperature over Brazil. Remote Sens. 2022, 14, 4420. [Google Scholar] [CrossRef]
  26. Brito, H.D.; Brito, Y.D.; Assis, W.D.; Ferreira, Y.C.B.; Vasconcelos, R.S.; Rufino, I. Análise temporal da disponibilidade hídrica nos estados beneficiados pela transposição do Rio São Francisco. Rev. Caminhos Geogr. 2020, 21, 102–116. [Google Scholar] [CrossRef]
  27. CPRM. Atlas Geoquímico da Bacia do Rio São Francisco: Minas Gerais. Serviço Geológico do Brasil—CPRM. Available online: https://rigeo.cprm.gov.br/handle/doc/20939 (accessed on 6 October 2022).
  28. dos Santos, W.R.; da Rosa Ferraz Jardim, A.M.; de Souza, L.S.B.; de Souza, C.A.A.; de Morais, J.E.F.; Alves, C.P.; do Nascimento Araujo Júnior, G.; da Silva, M.J.; da Silva Salvador, K.R.; da Silva, M.V.; et al. Can changes in land use in a semi-arid region of Brazil cause seasonal variation in energy partitioning and evapotranspiration? J. Environ. Manag. 2024, 367, 121959. [Google Scholar] [CrossRef]
  29. Santos, C.V.B.; Carvalho, H.F.S.; Silva, M.J.; Moura, M.S.B.d.; Galvincio, J. Uso de Sensoriamento Remoto na análise da temperatura da superfície em áreas de floresta tropical sazonalmente seca. Rev. Bras. Geogr. Física 2020, 13, 941–957. [Google Scholar] [CrossRef]
  30. Good, E.J.; Ghent, D.J.; Bulgin, C.E.; Remedios, J.J. A spatiotemporal analysis of the relationship between near-surface air temperature and satellite land surface temperatures using 17 years of data from the ATSR series. J. Geophys. Res. Atmos. 2017, 122, 9185–9210. [Google Scholar] [CrossRef]
  31. Andrade, C.; de Souza, I.; da Silva, L. The Future Sustainability of the São Francisco River Basin in Brazil: A Case Study. Sustainability 2024, 16, 5521. [Google Scholar] [CrossRef]
  32. Chung, J.; Lee, Y.; Jang, W.; Lee, S.; Kim, S. Correlation Analysis between Air Temperature and MODIS Land Surface Temperature and Prediction of Air Temperature Using TensorFlow Long Short-Term Memory for the Period of Occurrence of Cold and Heat Waves. Remote Sens. 2020, 12, 3231. [Google Scholar] [CrossRef]
  33. Lian, X.; Zeng, Z.; Yao, Y.; Peng, S.; Wang, K.; Piao, S. Spatiotemporal variations in the difference between satellite-observed daily maximum land surface temperature and station-based daily maximum near-surface air temperature. J. Geophys. Res. Atmos. 2017, 122, 2254–2268. [Google Scholar] [CrossRef]
  34. Yu, W.; Ma, M.; Wang, X.; Geng, L.; Tan, J.; Shi, J. Evaluation of MODIS LST Products Using Longwave Radiation Ground Measurements in the Northern Arid Region of China. Remote Sens. 2014, 6, 11494–11517. [Google Scholar] [CrossRef]
  35. Lenoir, J.; Hattab, T.; Pierre, G. Climatic microrefugia under anthropogenic climate change: Implications for species redistribution. Ecography 2017, 40, 253–266. [Google Scholar] [CrossRef]
  36. Yu, L.; Liu, Y.; Li, X.; Yan, F.; Lyne, V.; Liu, T. Vegetation-induced asymmetric diurnal land surface temperatures changes across global climate zones. Sci. Total. Environ. 2023, 896, 165255. [Google Scholar] [CrossRef]
  37. Meier, R.; Davin, E.L.; Swenson, S.C.; Lawrence, D.M.; Schwaab, J. Biomass heat storage dampens diurnal temperature variations in forests. Environ. Res. Lett. 2019, 14, 084026. [Google Scholar] [CrossRef]
  38. Mildrexler, D.J.; Zhao, M.; Running, S.W. A global comparison between station air temperatures and MODIS land surface temperatures reveals the cooling role of forests. J. Geophys. Res. Biogeosci. 2011, 116, G3. [Google Scholar] [CrossRef]
  39. Ma, J.; Shen, H.; Wu, P.; Wu, J.; Gao, M.; Meng, C. Generating gapless land surface temperature with a high spatio-temporal resolution by fusing multi-source satellite-observed and model-simulated data. Remote Sens. Environ. 2022, 278, 113083. [Google Scholar] [CrossRef]
  40. Liu, H.; Lu, N.; Jiang, H.; Qin, J.; Yao, L. Filling Gaps of Monthly Terra/MODIS Daytime Land Surface Temperature Using Discrete Cosine Transform Method. Remote Sens. 2020, 12. [Google Scholar] [CrossRef]
  41. Garai, A.; Kleissl, J. Air and Surface Temperature Coupling in the Convective Atmospheric Boundary Layer. J. Atmos. Sci. 2011, 68, 2945–2954. [Google Scholar] [CrossRef]
  42. Knutti, R.; Rugenstein, M.A.A. Feedbacks, climate sensitivity and the limits of linear models. Philos. Trans. R. Soc. Math. Phys. Eng. Sci. 2015, 373, 20150146. [Google Scholar] [CrossRef]
Figure 1. Distribution of the three biomes and the INMET weather stations in the São Francisco River Basin.
Meteorology 04 00017 g001
Figure 2. Scatterplots comparing the observed daily maximum air temperature ( T m a x ) from INMET weather stations with corresponding maximum LST from the MODIS/Aqua MYD21A1D product. Results are shown for the biomes: (a) Caatinga, (b) Cerrado, (c) Mata Atlântica, and (d) all biomes combined. Each panel includes a gray solid line representing the regression model and a gray dashed line indicating the line of equality (1:1), where satellite LST and observed air temperature would be equal. These plots illustrate the strength and variation of the relationship between surface and air temperatures.
Meteorology 04 00017 g002
Table 1. Location and code of the INMET weather stations, sorted by biome.
CodeLongitudeLatitudeBiome
82,753−40.1−7.9Caatinga
82,789−38.1−7.8
82,886−39.3−8.5
82,890−37.0−8.4
82,892−36.7−8.4
82,979−42.1−9.6
82,983−40.5−9.4
82,986−38.2−9.4
82,988−37.7−9.1
82,989−37.9−9.3
82,990−37.4−9.7
82,991−37.0−9.5
82,995−36.8−9.7
83,076−44.5−11.0
83,179−43.1−11.1
83,182−41.8−11.3
83,286−44.6−13.3
83,288−43.4−13.2
83,338−42.8−14.9
83,386−44.4−15.4
83,387−43.0−15.7
83,388−42.9−15.2
83,389−44.0−15.1
83,390−44.1−15.1
83,395−43.3−15.8
83,408−43.8−14.3
83,236−45.0−12.1Cerrado
83,334−46.2−14.9
83,379−47.3−15.5
83,383−46.4−15.6
83,384−46.1−15.9
83,428−46.9−16.4
83,437−43.8−16.7
83,452−43.7−16.8
83,479−46.9−17.2
83,481−46.2−17.7
83,483−44.9−17.3
83,533−45.4−19.7
83,536−44.4−18.7
83,570−45.0−19.2
83,578−44.3−20.0
83,581−44.4−19.9
83,582−46.0−20.0
83,586−44.1−19.5
83,635−44.9−20.2
83,097−36.8−10.2Mata Atlântica
83,587−43.9−19.9
83,632−44.1−20.0
Table 2. Relationships between observations of the maximum air temperature at the INMET weather stations, the response variable, and retrievals of LST from the MYD21A1D data product, the predictor variable, for the biomes in the São Francisco River Basin. The relationships were built under the fundamental assumption of linearity, so given for each relationship are their constant and slope (as well as their standard error and p-value, in parentheses), which characterize their linear regression model, the number of observations used to build the linear regression models, and the adjusted R2 and the residual standard error for the models.
Response Variable:
Maximum Air Temperature From
INMET Weather Stations
Biome Caatinga Cerrado Mata Atlântica Overall
LST data from the0.284 *0.372 *0.440 *0.324 *
MYD21A1D data product(0.001)(0.002)(0.006)(0.001)
Constant20.6 *17.1 *14.4 *18.9 *
(0.058)(0.067)(0.209)(0.041)
Observations50,54038,238576694,544
Adjusted R20.460.540.490.52
Residual Std. Error2.132.072.412.15
Note: * p-value < 0.01.
Table 3. Results of the cross-validation performed with the subsets of data from the three biomes in the SFRB. Two metrics are presented as results of the cross-validation: the Mean Absolute Error (MAE)—in parenthesis—and the Root Mean Squared Error (RMSE). As a reference, the RMSE and MAE between the predictions of the regression model for the entire Basin and the actual data are presented. This should provide an average performance across the models. Also, as a reference, we include the RMSE and MAE for the predictions of the regression model and the actual subset of data that has been used to generate itself. This should provide superior performance across the models.
Actual Data in the Biome:
Predictions of the Caatinga Cerrado Mata Atlântica
Regression model for the2.15 *2.09 *2.53 *
entire Basin(1.69) *(1.65) *(2.05) *
Regression model for the2.13 *2.142.66
biome Caatinga(1.67) *(1.68)(2.14)
Regression model for the2.232.07 *2.46
biome Cerrado(1.76)(1.63) *(1.99)
Regression model for the2.432.112.41 *
biome Mata Atlântica(1.93)(1.65)(1.95) *
Note: * used as reference.
Disclaimer/Publisher’s Note: The statements, opinions and data contained in all publications are solely those of the individual author(s) and contributor(s) and not of MDPI and/or the editor(s). MDPI and/or the editor(s) disclaim responsibility for any injury to people or property resulting from any ideas, methods, instructions or products referred to in the content.

