1. Introduction
Tropical cyclones (TCs) are among the most destructive natural hazards, causing significant loss of life and huge devastation of property due to their catastrophic nature [
1,
2,
3]. Even though 7% of global tropical cyclones occur in the North Indian Ocean (NIO), their devastation is very high because of the shallow waters of the BoB, the low, flat coastal terrain, and the funneling shape of the coastline, which favors strong storm surges [
4]. A “cyclone” is an intense vortex that mostly originates in warm oceans or a whirl in the atmosphere with very strong winds circulating around it in an anticlockwise direction in the Northern Hemisphere and a clockwise direction in the Southern Hemisphere (IMD). The Bay of Bengal (BoB) and Arabian Sea (AS) are regions prone to TC activity, particularly during the post-monsoon season (October–November–December), as reported by the Regional Specialized Meteorological Centre (RSMC) for the TCs by Indian Meteorological Department (IMD), and the details are discussed in
https://rsmcnewdelhi.imd.gov.in/ (accessed on 26 February 2025). Understanding the factors influencing TC genesis, intensification, and lifetime in these basins is crucial for improving early warning systems and disaster preparedness [
5]. Several studies have highlighted the role of sea surface temperature (SST) in modulating TC activity [
6,
7].
After genesis from a warm ocean surface, tropical cyclonic disturbances can intensify into severe storms by inducing the upward transport of heat fluxes [
7]. Warming in the tropical Indian Ocean increased at 0.15 °C per decade from 1951 to 2015, a faster rate compared to the global ocean’s 0.11 °C per decade [
8]. Study has also revealed that this warming was non-uniform, and ~90% of it is attributed to anthropogenic activities [
9]. Warming of the SST and mid-tropospheric moisture (specific humidity) over the past two decades, which are key ingredients for TC development [
10], have been observed over the western and central Indian Ocean. However, one of the few prominent features of local warming is the indication of the potential for surface heat and moisture fluxes capable of fueling a self-sustaining circulation [
11]. The availability of moisture from the surface to the middle atmosphere in recent decades is an important factor in the rapid intensification and strengthening of tropical cyclones before their landfall. The North Indian Ocean (NIO) has experienced rising temperatures in recent decades due to global warming [
12].
Based on the theory of rising ocean temperatures, Elsner [
13] suggested that tropical cyclones during 1981–2006 and 2007–2019 showed the strongest intensification, as tropical oceans have continued to warm, contributing to an increase in global tropical cyclones by approximately 3.5% to 4.5% in the period 2007–2019 relative to the earlier base period (1981–2006). Specifically, the BoB basin has shown an upward trend in the intensity of extremely severe cyclonic storms (ESCSs). Bhaskara Rao et al. [
14], analysis TCs from 2000 to 2021, documented an increase in cyclone frequency in the BoB during November, which may be due to strong warming over the East Equatorial Indian Oceanic (EEIO) region. Under the global warming scenario, there may be other reasons for the rapid intensification of storms before landfall. However, SST and moisture supply are two primary driving factors over the Indian Ocean during the post-monsoon season. We found that SST and moisture supply are among the main components of the rapid intensification of cyclones over the BoB.
Table 1 shows the formation of the total number of low-pressure systems and storms over the BoB and Arabian Sea (AS) from November in the last 20 years (2000–2020).
There were significant variations in the number of cyclone formations in the first decade, 1991–2000. The number of depressions decreased, while the number of severe cyclones increased. Furthermore, due to warming, the intensity of landfalling cyclones, from severe to very severe cyclonic storms (SCSs/VSCSs), escalated 24 h before landfall. The number of such cyclones increased three times during 2011–2020 compared to 2001–2010 over the BoB (
Table 1). Such changes are attributed to the enhancement of the necessary and sufficient conditions for cyclone formation in the region, including abundant moisture and warmer SST in recent years.
The comparison of SST, moisture, and vertical wind shear over the past two decades shows favorable conditions that facilitated the formation of VSCSs.
Table 1 provides details on the formation of DD and VSC storms in recent decades. Balaguru et al. [
15] found that an increasing trend in SST in the eastern BoB (90–95° E, 10–20° N) has led to the formation of stronger tropical storms during the post-monsoon season. There has been a notable shift in the total number of severe to extremely severe cyclonic storms over the past 20 years, occurring more frequently over the southeast and central BoB rather than the south–central region. Further explanation for this shift may involve regional or remote influences, as discussed by Bhaskar Rao et al. [
16]. There may be a decadal or large-scale shift in the fundamental atmospheric and oceanic conditions that facilitate tropical cyclone formation.
In addition to SST, other factors such as atmospheric latent heat flux, vorticity, wind shear, and moisture content also play important roles in TC genesis and intensification. Low-level tropospheric relative vorticity measures atmospheric rotation, and cyclonic vorticity is essential for TC formation. Wind shear, the change in wind speed and direction with height, can inhibit TC development or intensification. Moisture availability is also crucial, as it fuels TC development, and low vertical wind shear triggers severe cyclonic storms.
Studies by Even and Camargo [
17], Rajeevan et al. [
18], and Balaji et al. [
19] have suggested that aerosol concentrations in the middle atmosphere play an important role in latent heat release, which probably reduces basin-wide vertical wind shear, creating a more favorable environment for intense tropical cyclones over the NIO. During the past two decades (2000–2020), La Niña years experienced almost twice the number of intense cyclones compared to El Niño years. Additionally, during the La Niña years, the positional shifts in the average cyclogenesis of intense cyclones in the Bay of Bengal align with observations for the western North Pacific Ocean basin.
The decadal variability in TC activity over the BoB and AS during the post-monsoon season (OND) is a critical concern, given the increasing frequency and intensity of cyclones, especially in recent decades. This study evaluates the influence of key genesis factors such as sea surface temperature (SST), vertical wind shear (VWS), vorticity, relative humidity (RH), and potential instability (PI) across three decades: 1991–2001, 2002–2011, and 2012–2021. Warm SST anomalies, along with increased atmospheric moisture, have significantly contributed to the rapid intensification of TCs before landfall, particularly in the BoB region, which has witnessed an increase in cyclonic storms, including very severe cyclones (VSCs), during 2009–2019. This analysis relies on the atmospheric global reanalysis of climate by the European Centre for Medium-Range Weather Forecast (ECMWF) of fifth-generation referred as ERA5, and National Ocean and Atmospheric Administration (NOAA) datasets to assess the decadal shifts in ocean–atmospheric parameters that govern TC formation and intensification, offering insights into large-scale climate variability.
The new findings from this study are expected to enhance advanced research on TC activity in the NIO region and provide a basis for a detailed investigation of possible linkages with other climate indices over the AS. The impact of global warming due to climate change and its effect on extreme weather events, such as the frequency and intensity of TCs formed over global ocean basins, is a matter of concern. High-intensity cyclones have become more frequent in the NIO, posing significant risks and vulnerabilities to coastal regions.
In this study, we investigate the decadal variability of TC genesis factors over the AS during the post-monsoon season. Specifically, we examine the role of SST, vorticity, wind shear, and moisture content in influencing TC formation and intensification. By analyzing observational data from the ERA5 and NOAA datasets, we aim to identify decadal trends or shifts in these environmental factors and their potential impact on TC activity, which are discussed in subsequent sections.
The main objectives of this study are as follows:
Examine changes in key factors influencing tropical cyclone genesis, such as sea surface temperature (SST), vorticity, wind shear, and moisture availability.
Study the effects of large-scale atmospheric shifts, including the northward movement of the Asian Jet Stream and variations in wind shear, on cyclone formation and behavior.
Assess localized warming impacts, evaluating how localized warming in the Indian Ocean affects cyclone frequency and intensity, particularly in the context of global warming and recent extreme weather events.
The rest of the paper is organized as follows:
Section 2 discusses data and methodology, while
Section 3 and
Section 4 present the results and concluding remarks, respectively.
3. Results
In recent decades, the location shifts of low-pressure systems (e.g., cyclones, typhoons, and hurricanes) within their respective basins have been reported by the IMD. The present research focuses on the increased genesis of cyclones in the Arabian Sea compared to previous decades. The Bay of Bengal has consistently witnessed several cyclones due to low wind shear and warmer SST [
14]. The drainage of freshwater from rivers into the BoB, along with surface and subsurface saline water, has caused ocean stratification, enhancing TC genesis due to the deep mixed layer during the OND season [
25,
26]. Moreover, the AS has higher salinity and a deeper mixed layer, exhibiting greater seasonal variation than the BoB [
27]. Additionally, water temperatures in the Arabian Sea remain warm after the summer monsoon season.
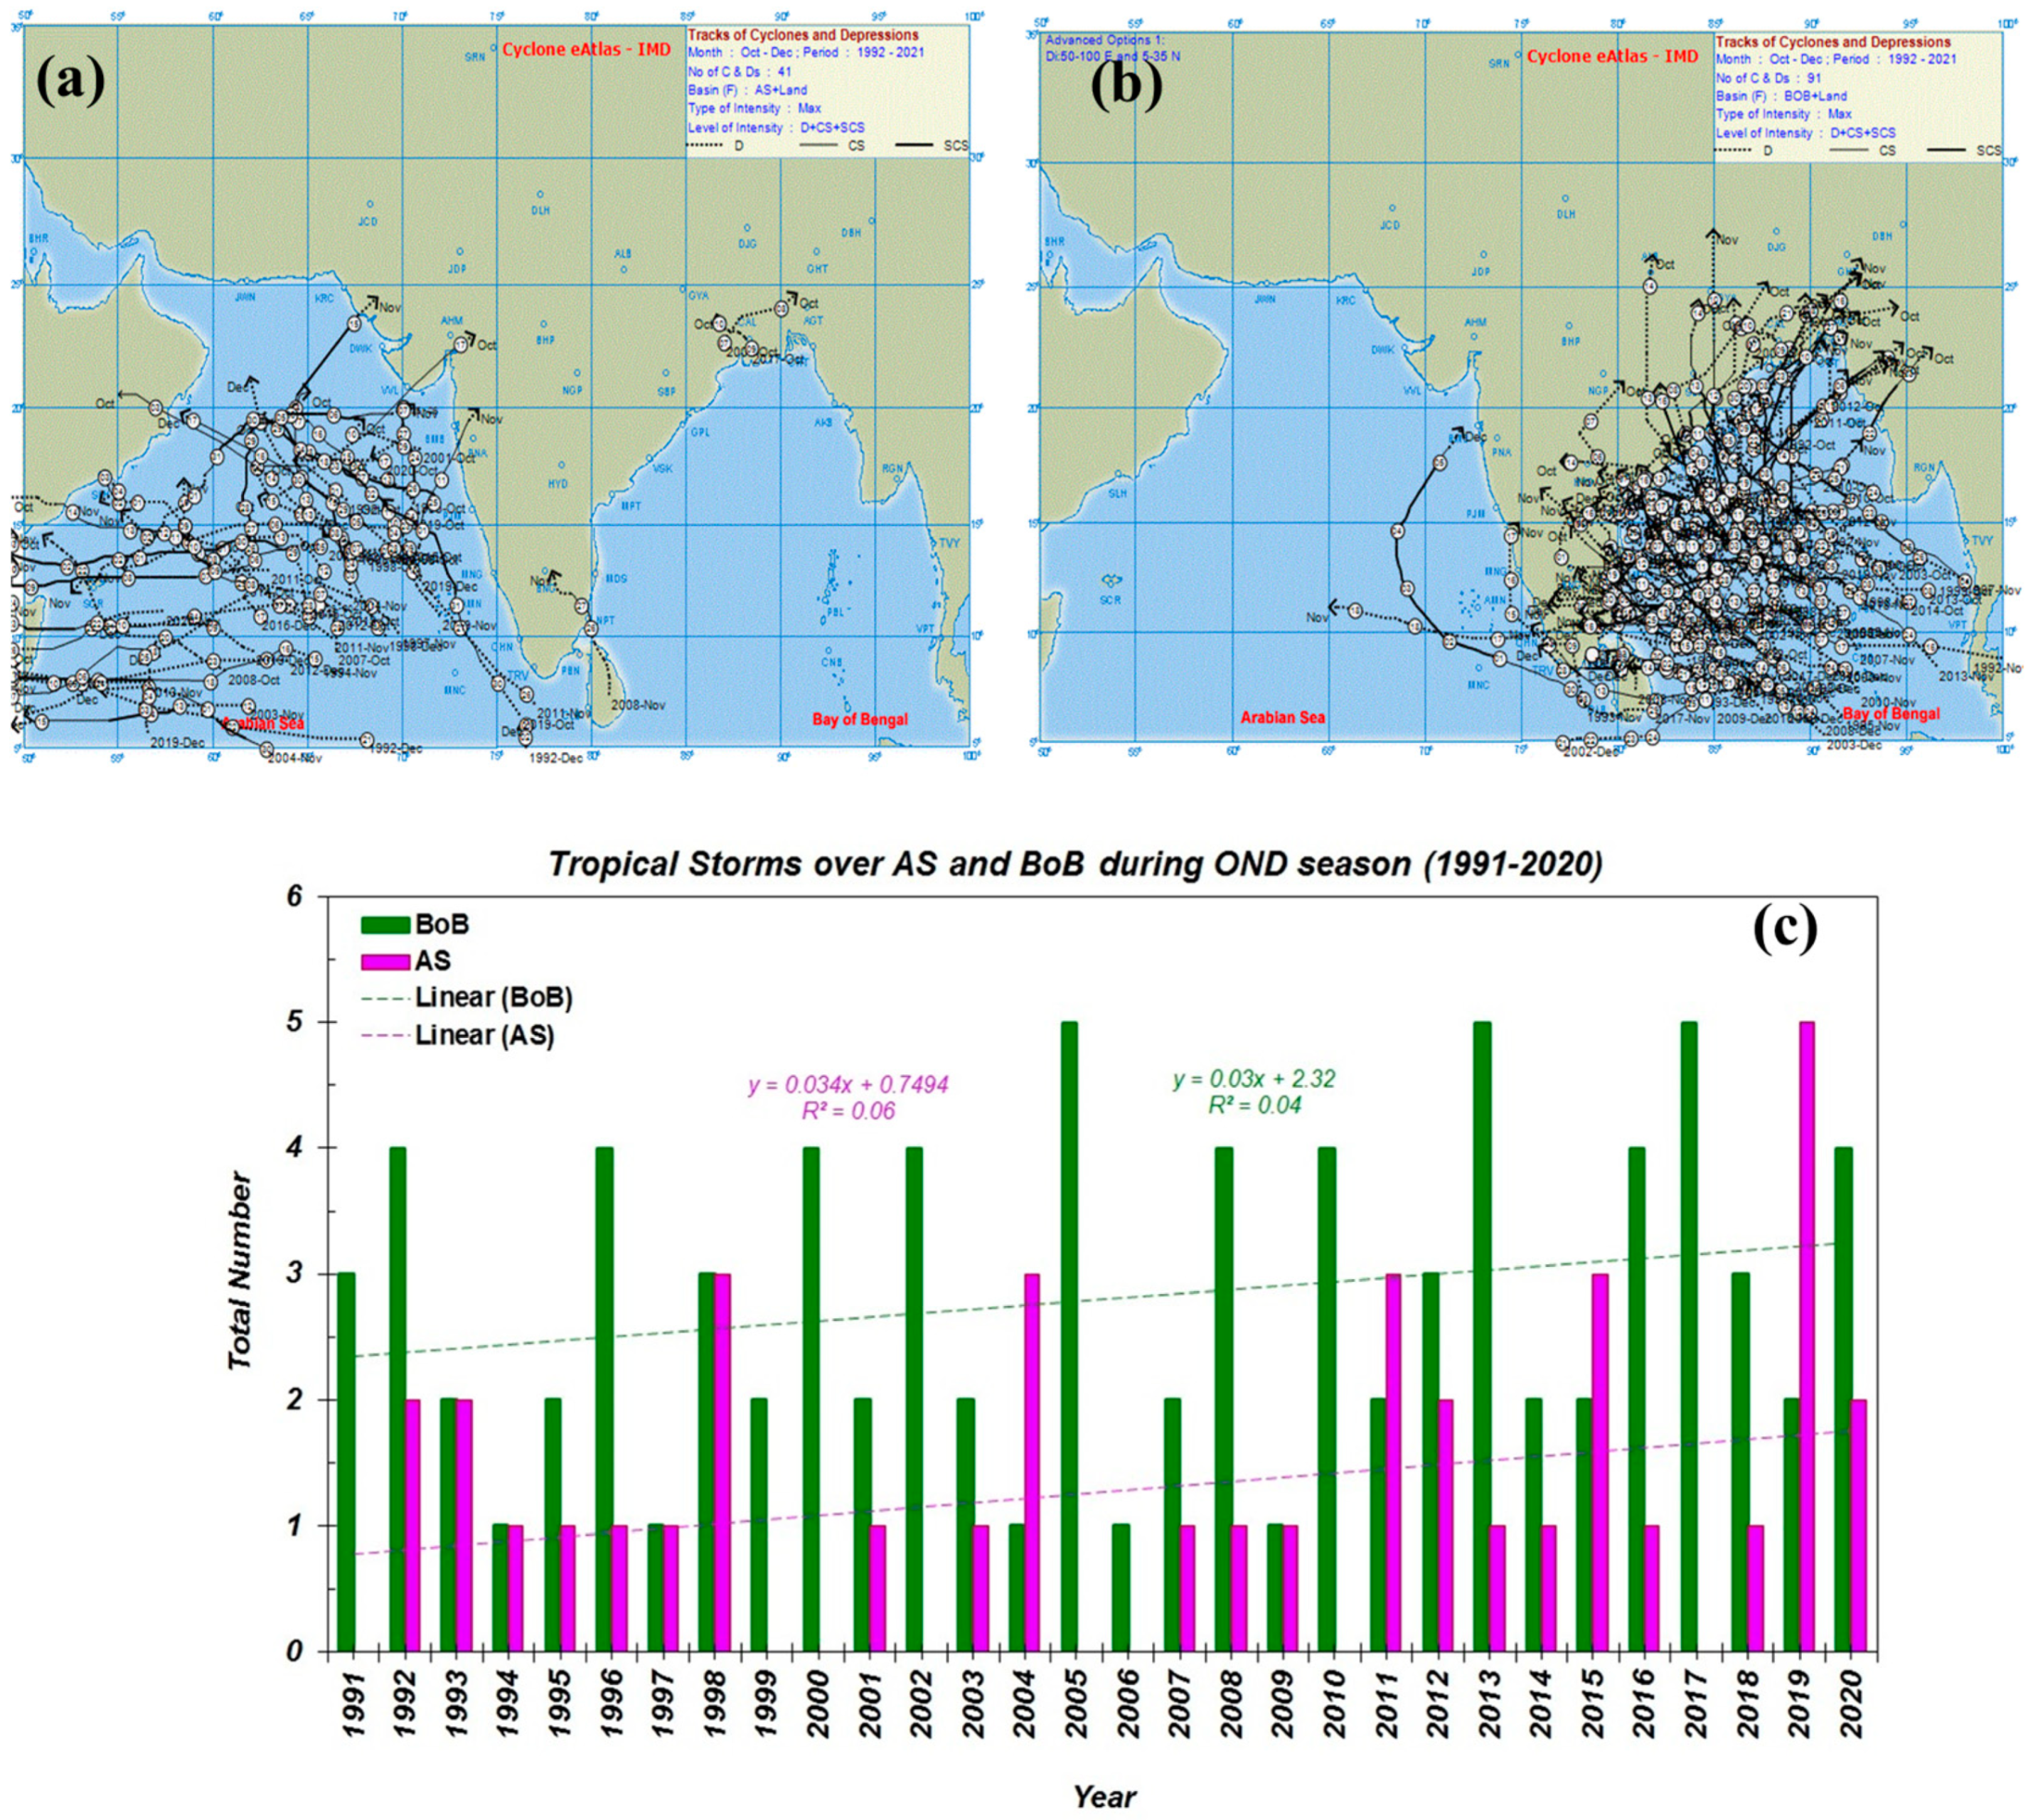
The spatial distribution and frequency of cyclonic storms over the BoB and AS during the OND season across three decades are shown in
Figure 1. Further, it presents a comparative analysis of the number of TCs, highlighting any trends or changes in cyclonic activity over time. Both BoB and AS basins are also witnessed an increased number of cyclones (
Figure 1a,b) compared to their climatology. Due to their westward movement and curvature, cyclones are major sources of water and wind damage over nearby landmasses. The BoB cyclones cause heavy rainfall over the India, Bangladesh, Myanmar coasts, and while AS cyclones might bring rainfall to the Middle Eastern region and East African countries (
Figure 1a). Yearly variations (from 1991 to 2020) in cyclone formation (of all intensities) also show a gradual increase in numbers year by year over the BoB and AS (
Figure 1c). Notably, the number of cyclone formations has increased more over the AS than the BoB, which could change the hydrological cycle around the AS. In the last four decades, Murakami et al. [
28] noticed an increasing trend of cyclones in the northwestern part of the AS basin. The increase in cyclones over the AS might be attributed to the increased SST, enhanced moisture, and modifications in upper tropospheric winds. However, the analysis shows an increase in cyclonic activity over the BoB, due to SST-induced moisture supply in 2012–2021 compared to 2002–2011. The total number of cyclonic storms reached a maximum of 18 (
Table 1) during 2012–2021, compared to the previous two decades (1992–2001 and 2002–2011).
Recent studies by Deshpande et al. [
29], Singh et al. [
30], Tiwari et al. [
31], and Labban et al. [
32] documented that the mean intensity, frequency, track and size of tropical cyclones over the AS were stronger and larger in 2012–2021 compared to 1992–2001 and 2002–2011, respectively.
The tracks of all kinds of low-pressure systems formed over the AS and BoB are listed in
Table 1. The BoB is a region of higher SST and low wind shear, where the formation of a low-pressure system has a known history. There has been a sudden increase in the formation of low-pressure systems in the AS compared to the BoB in recent years and decades (in 2012–2021, a total of 18). A full analysis of the formation and comparison of the cyclones was performed by Deshpande et al. [
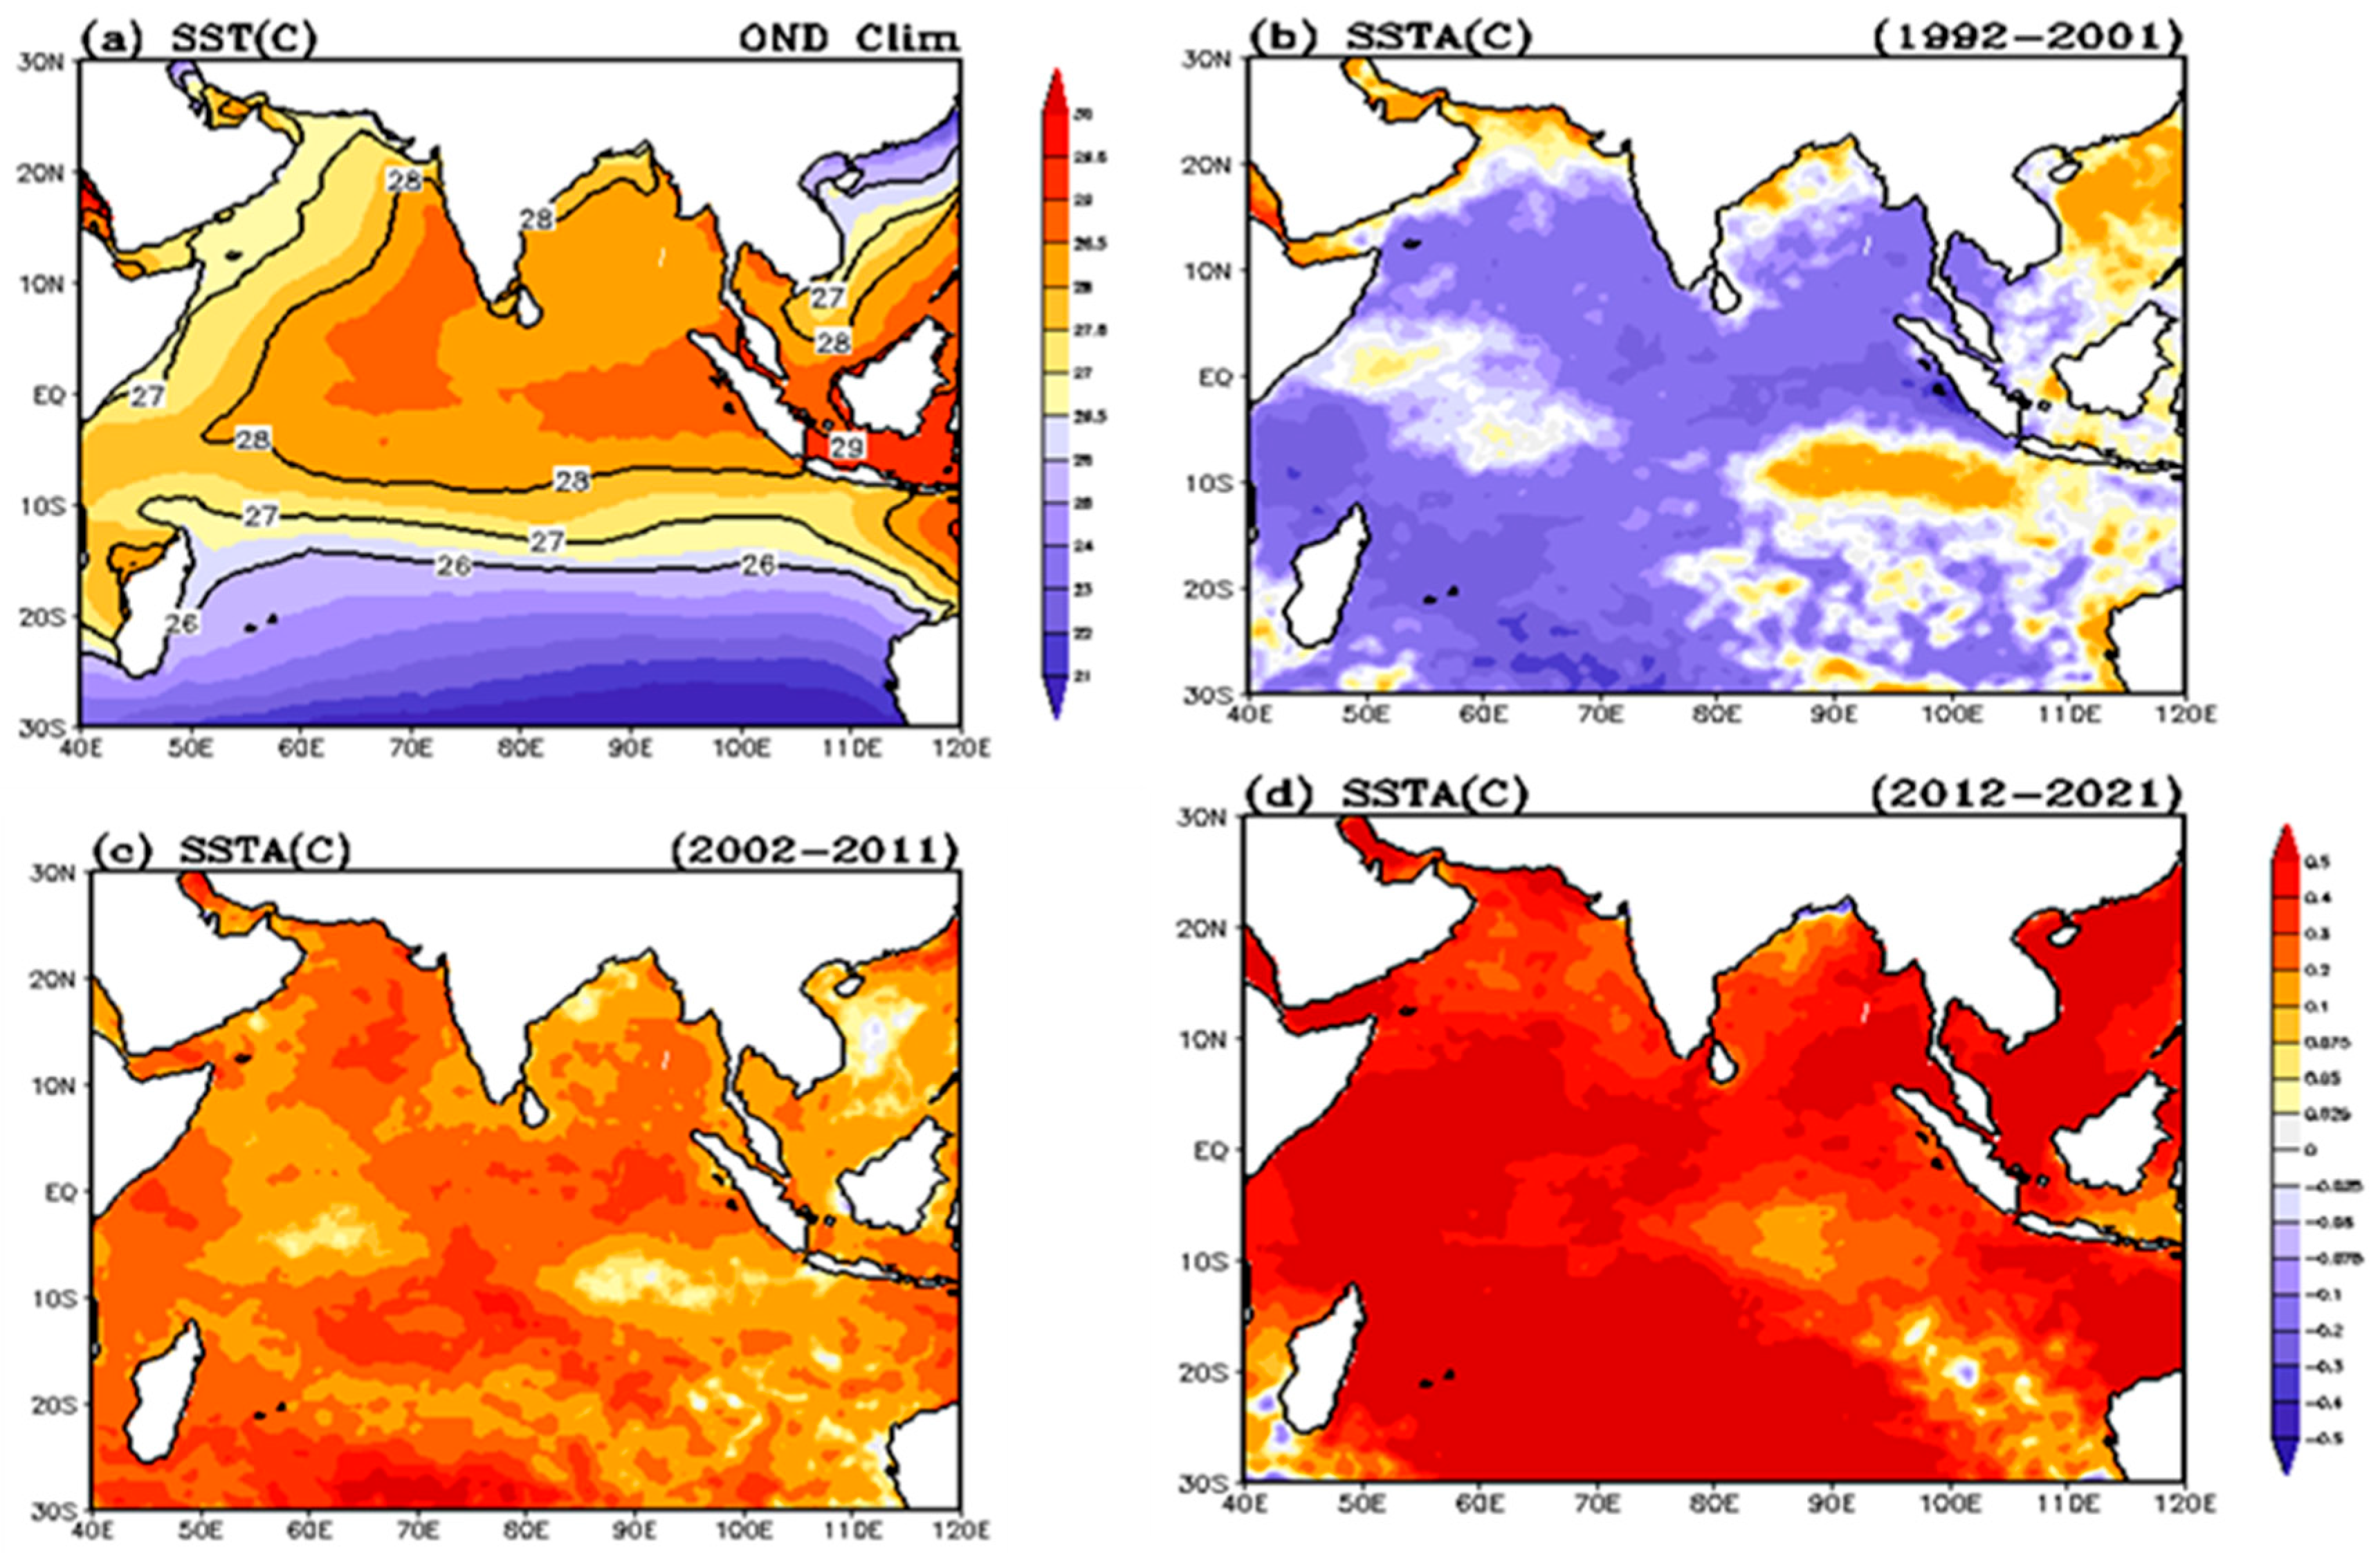
29]. In their study on the changing cyclone frequency in the Indian Ocean, they pointed to the availability of heat potential, moist static energy, and other related variables that contribute to cyclonic circulation. The SST climatology and anomalies for the three decades indicate areas with significant warming or cooling around the Indian subcontinent (
Figure 2). The anomalies are calculated using the 1982–2011 climatology as a reference. This helps in understanding the changes in SST patterns and their potential impact on TC genesis. Warm SST indicates the potential for low-pressure systems to form.
Figure 2a–d depict the horizontal distributions of SST climatology (1982–2011) and anomalies (°C) over the NIO region during 1992–2001, 2002–2011, and 2012–2021, respectively.
Figure 2b–d depict the horizontal distribution of SST (°C) anomalies over the NIO region during 1992–2001, 2002–2011, and 2012–2021, respectively.
Figure 2a shows a negative anomaly, indicating cooling during the post-monsoon period of the first decade (1992–2001), except in the region of the East Indian Ocean, which shows a positive anomaly.
Figure 2b shows a negative anomaly, indicating cooling during the post-monsoon period of the first decade (1992–2001), except in the region of the East Indian Ocean, which shows a positive anomaly.
In the second-decadal years, a clear signature of moderate warming environments during 2002–2011 was observed, as compared to 1992–2001. However, the highly positive SST anomaly shows extreme conditions in 2012–2021. In brief, the lower region (south of 10° S and west of 80° E) in
Figure 2d shows extreme heating conditions, while
Figure 2b shows contrasting conditions. After originating over the warm ocean surface, tropical cyclonic disturbances can grow into TCs by inducing upward transport of heat fluxes that are positively related to surface wind speeds [
7]. The supply of surface heat fluxes, including both sensible heat (SHX) and latent heat (LHX), is identified as the energy source for the intensification of TCs [
33]. From an energetic perspective, the storm extracts latent energy from the underlying ocean via LHX, increasing the available potential energy.
By releasing latent energy in convective clouds, a portion of the latent heat release acts to increase the kinetic energy through an inefficient conversion [
33]. Hence, LHX is the fundamental energy source for TC intensification. SHX, however, is not directly involved in the energy conversion processes. From a magnitude perspective, SHX is usually several times smaller than LHX and is generally believed to be much less important than LHX in determining TC development (e.g., [
34,
35]). Without the supply of LHX from the ocean, the storm weakens and shrinks rapidly, and its maximum surface winds are reduced to less than 33 m/s within 24 h, leading to a continuous decrease in kinetic energy.
The latent heat flux (LHF) is, therefore, indicated to be the dominant energy source for TC intensification, whereas SHX is not. Climatologically, LHF has increased in the western parts of the AS and BoB (
Figure S1a). On average, LHF increased linearly over the AS from 1992 to 2021 (
Figure S1). The increase in LHF shows enhanced cloud formation and possibly increased precipitation in recent decades (2011–2021) over the AS compared to BoB (
Figure S1d) and other decades (
Figure S1b,c). Meanwhile, climatologically, it showed an increase in both the AS and BoB.
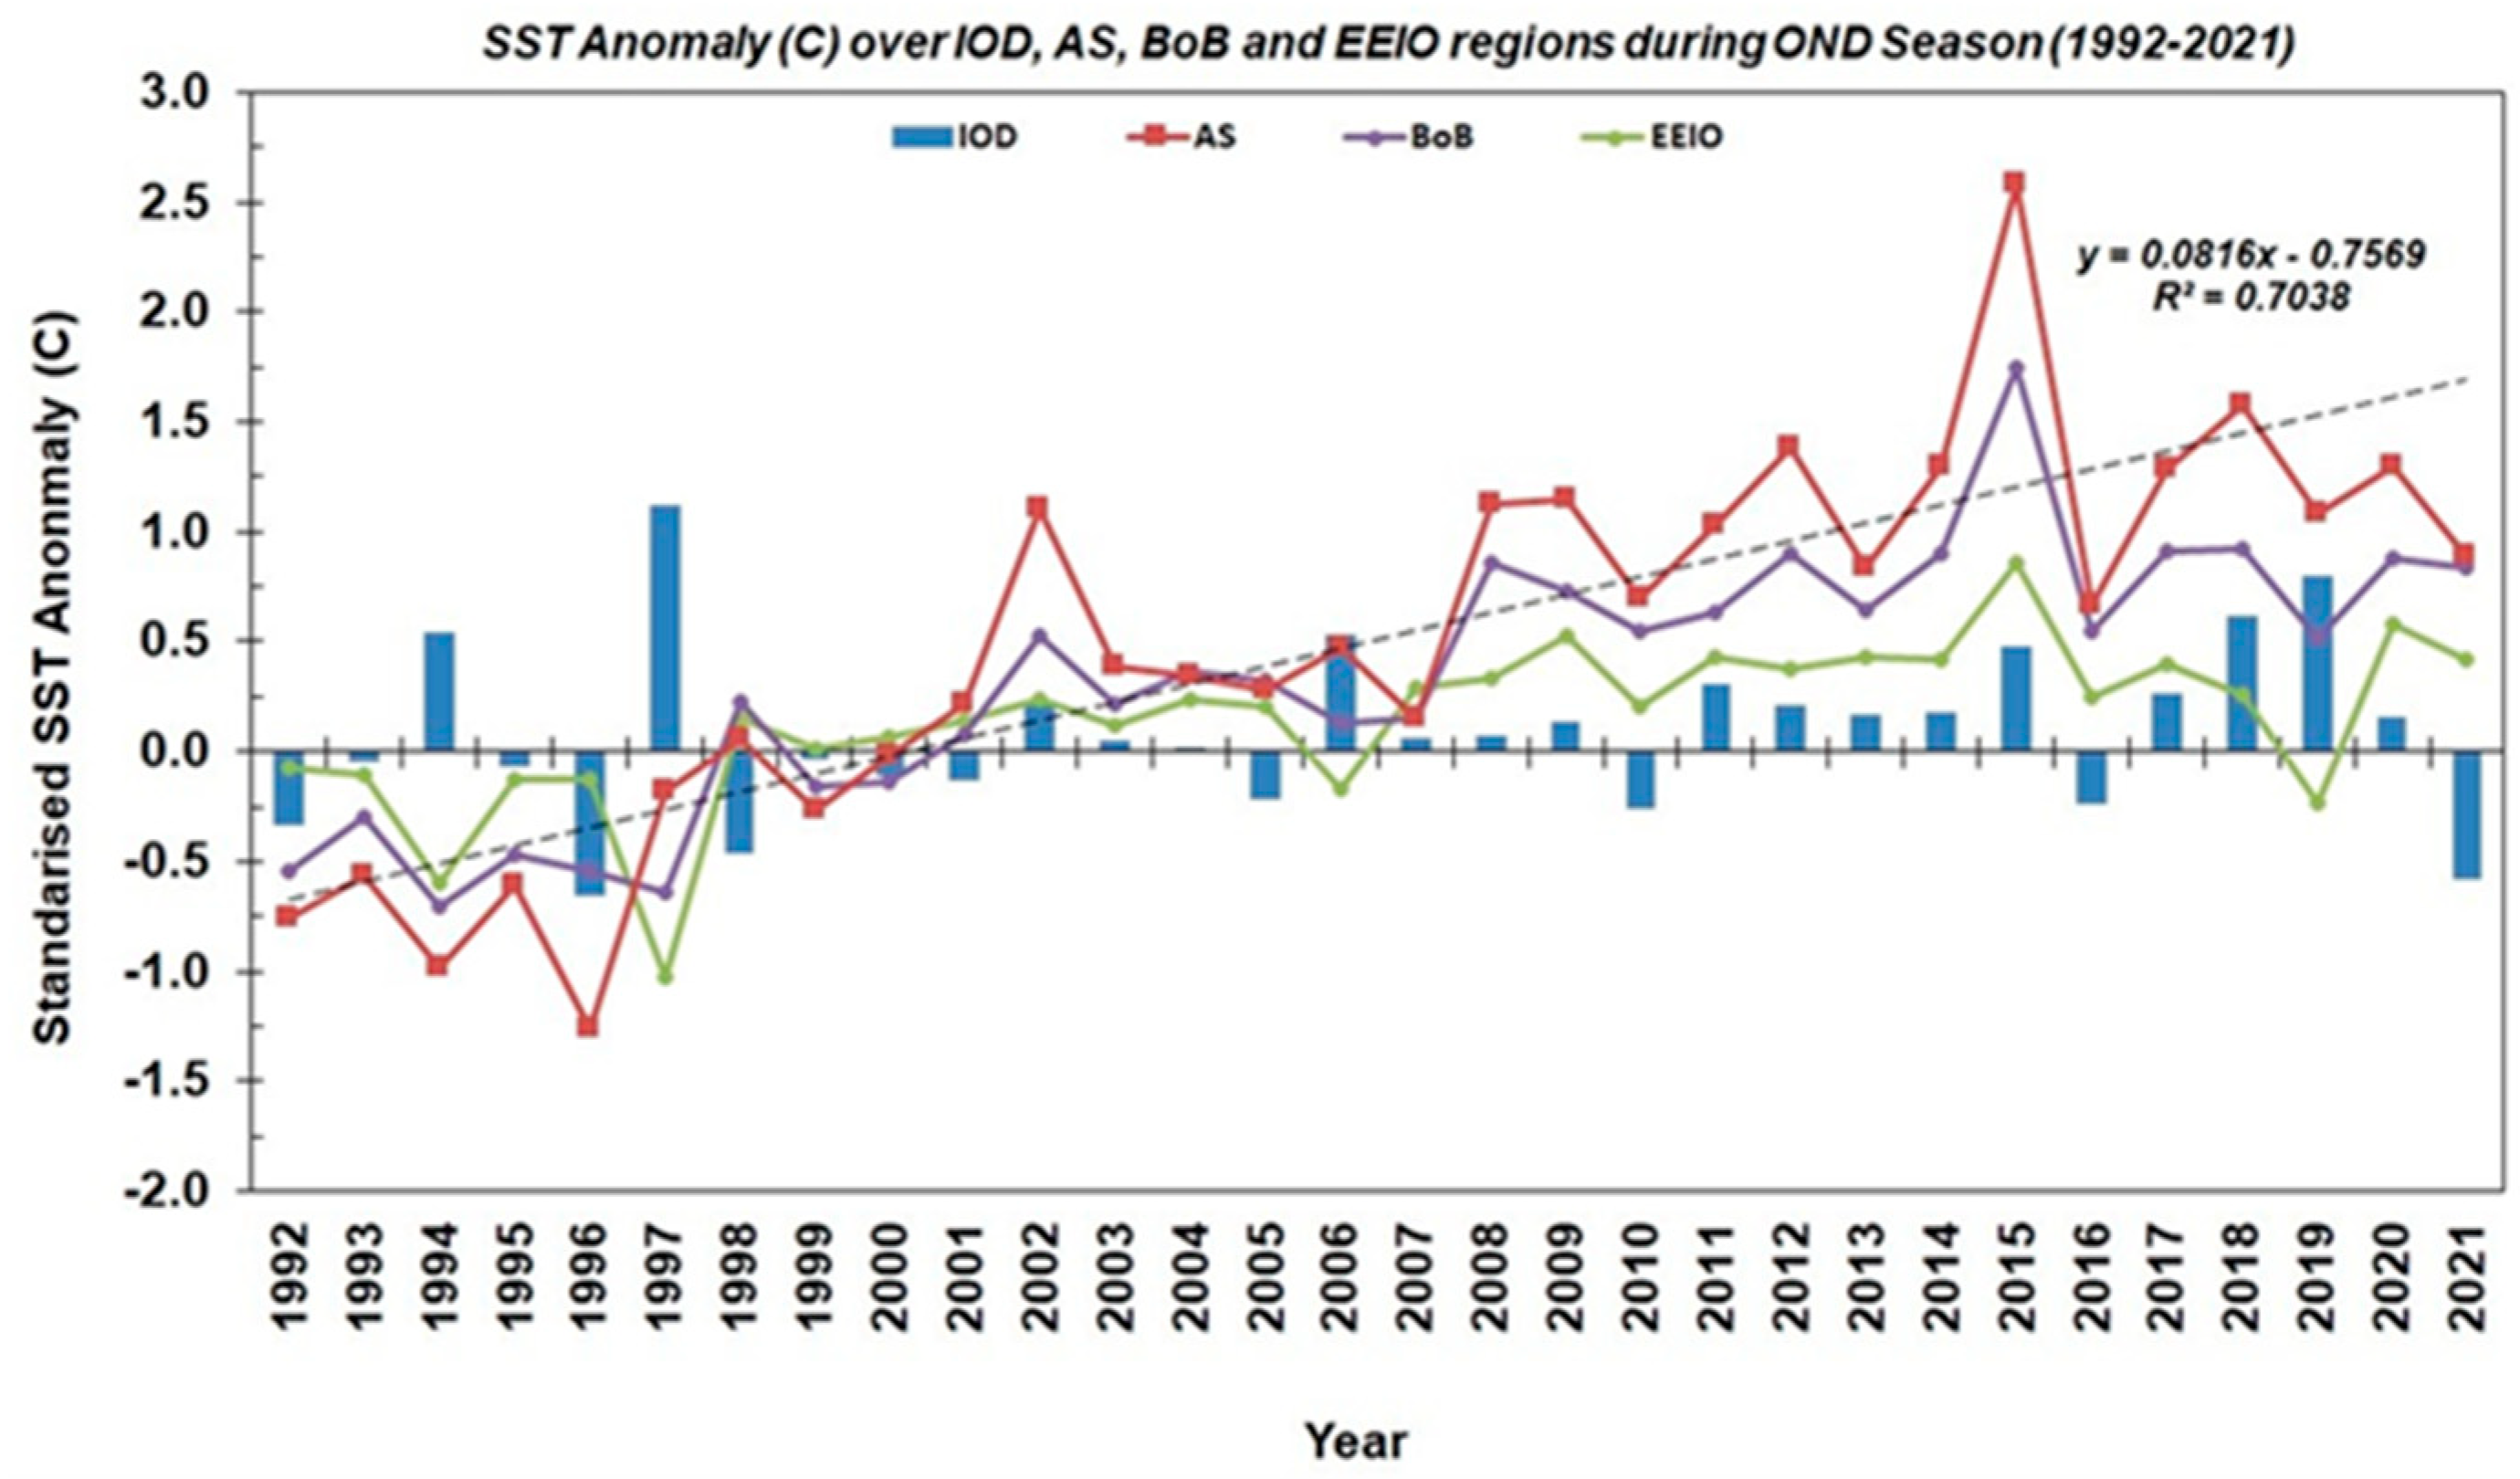
It is clear from
Figure 3 that positive SST anomalies persisted over the IOD region, as described by Saji et al. [
36]. There is a difference in the SST anomaly between the western (50–70° E, 10° S–10° N) and southeastern (90–110° E, 10° S–Equator) called IOD region of the tropical Indian Ocean, AS (55–75° E; 5–20° N), BoB (80–100° E; 5–20° N), and EEIO (80.5–103.5° E and 6.5° S–3.5° N) sub-regions of the Indian Ocean during the OND season of 1992–2021. Among all the graphs, AS shows a dramatic change from the lowest temperature from 1990 to recent years. The increase in SST can pump more moisture into TC formation from the Indian Oceanic region. The local magnitude of SST anomalies exceeds 1.5 °C.
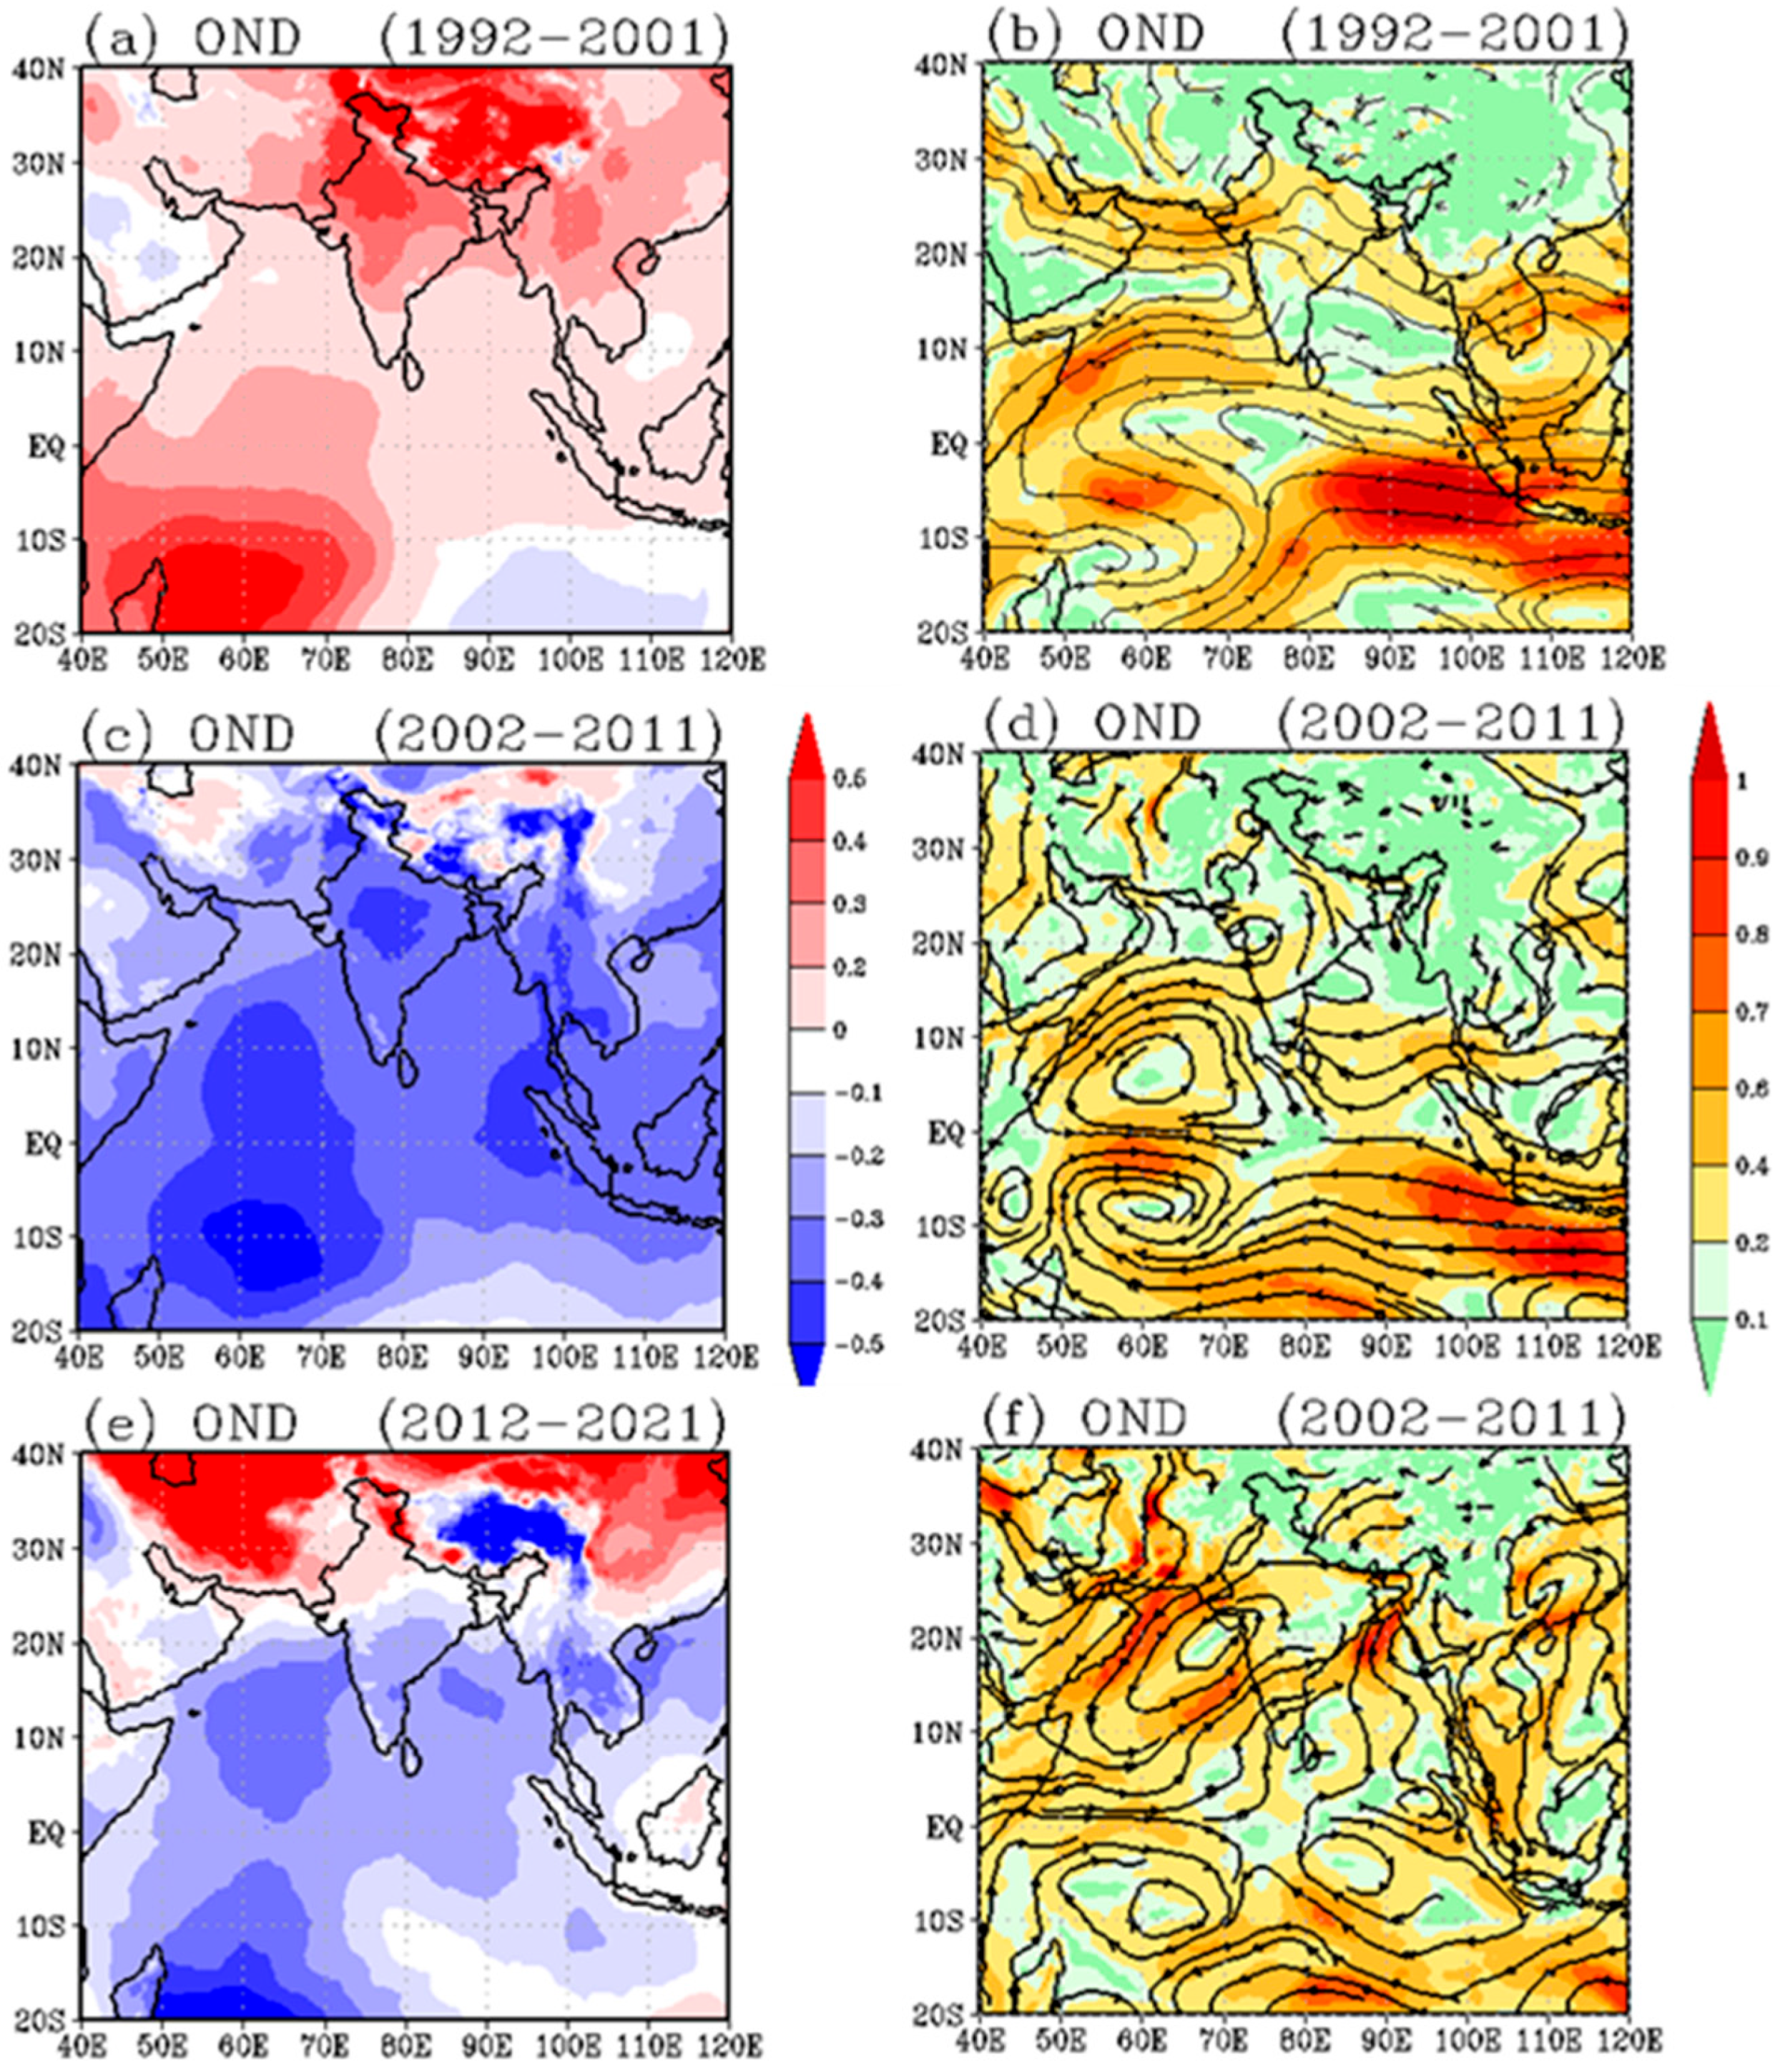
Variability in MSLP and the associated wind patterns provides insights into atmospheric circulation changes and their influence on TC formation and intensification (
Figure 4). During each decade, MSLP declines (indicating lower-pressure zones conducive to cyclogenesis) are coupled with stronger wind patterns, enhancing vorticity. The combination of lower pressure and favorable wind flow increases the likelihood of TC formation. This figure further illustrates how atmospheric pressure and wind anomalies evolve over time, creating more conducive environments for TCs.
3.1. Cyclogenesis Parameters Such as RH, VWS, Vorticity, and PI
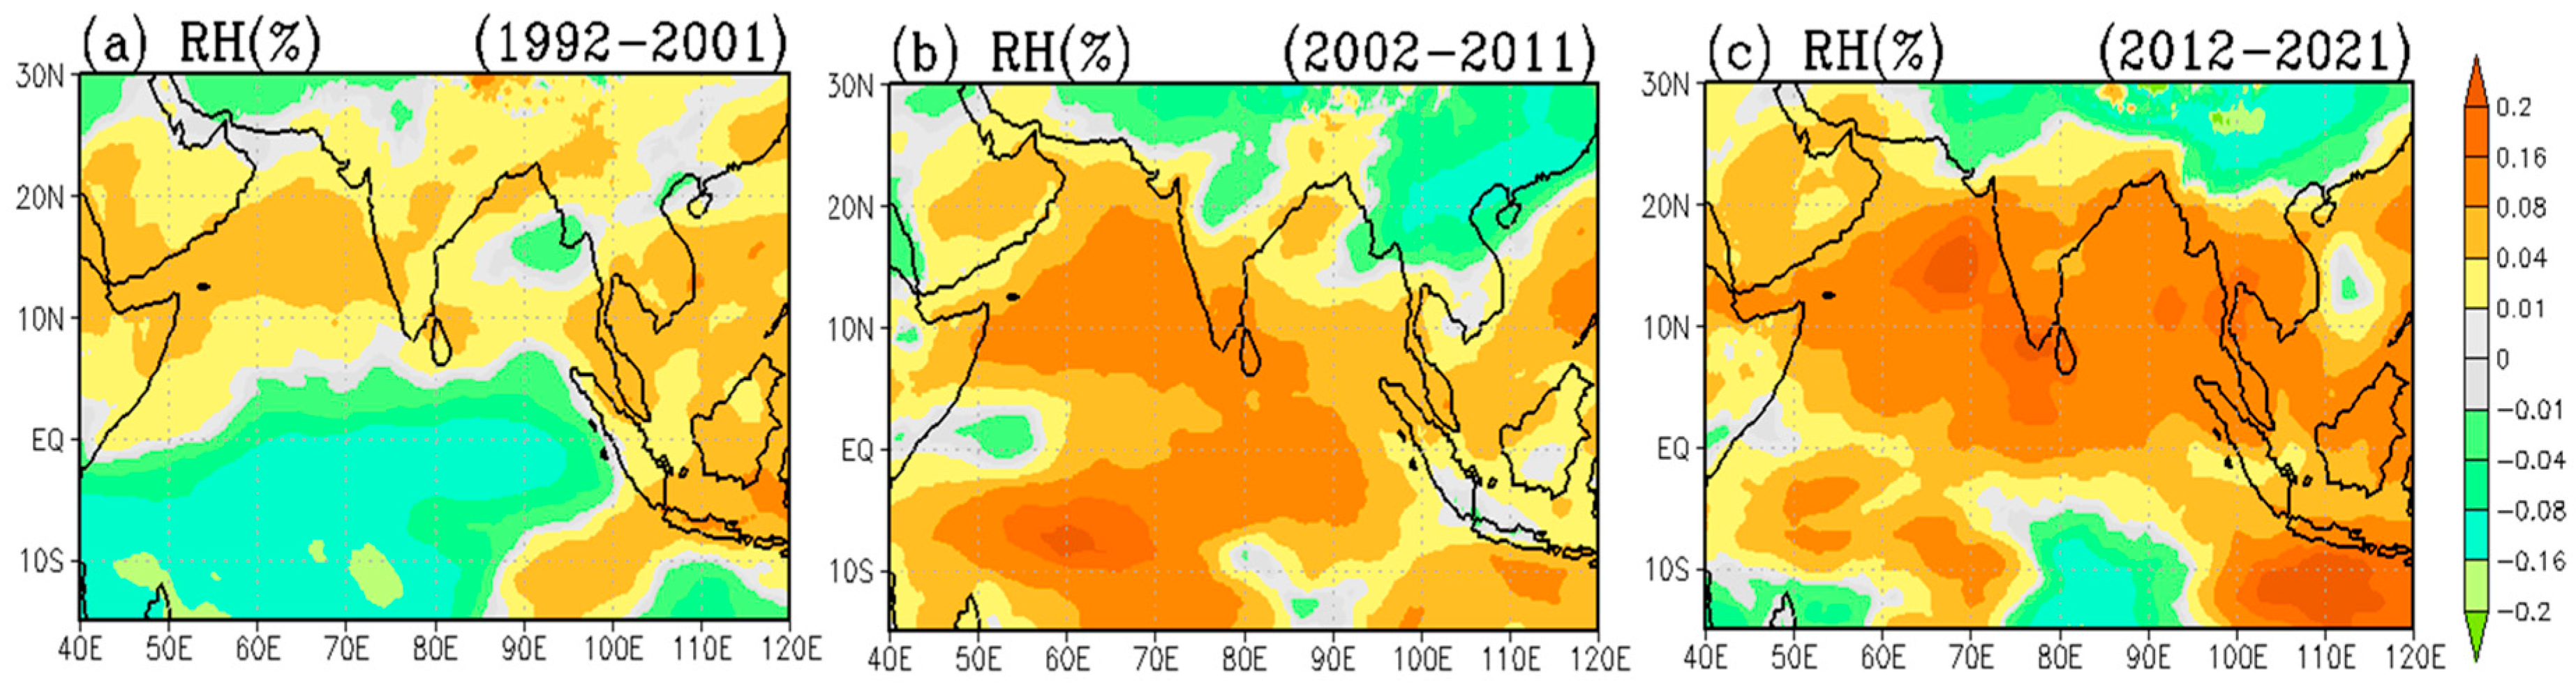
Schemes in the time of global warming show that the pumping of moisture into a rain-bearing system can eventually enhance the system to extremes. The mean tropospheric moisture (MTM) in the troposphere is vital for TC formation (
Figure 5). The MTM anomalies (%) in the mid-troposphere, depicted in
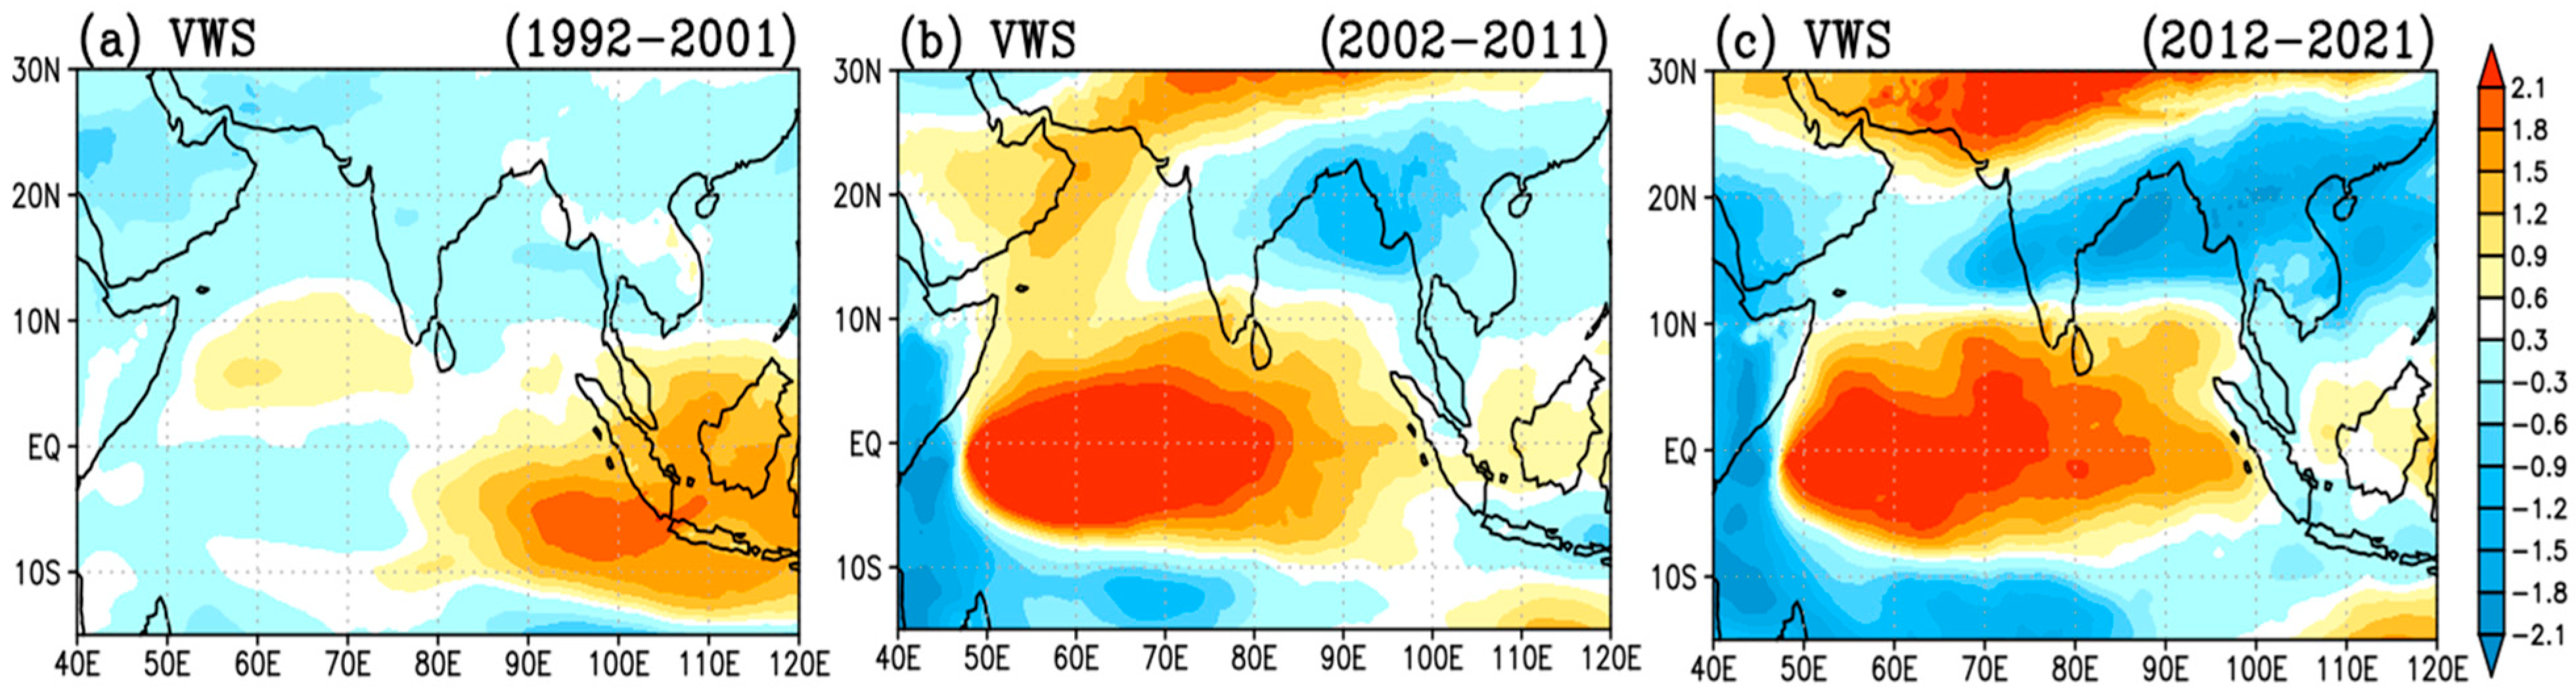
Figure 5, clearly show a steady increase in moisture content during 2012–2021, particularly over the AS compared to previous decades. High MTM supports sustained convection and enhances the likelihood of TC development. This rise in RH is directly linked to the observed increase in TCs during the last decade. Another important variable is the VWS; a magnitude below 12 m/s can intensify the TCs over the BoB, as discussed by Bi et al. [
37]. The VWS anomalies, defined as the wind vector difference between the 200 and 850 hPa levels, commonly referred to as “deep-layer”. The VWS, rank as the second most important predictor of TC intensity, as discussed by Rios-Berrios et al. [
38].
The VWS anomalies during each decade indicate that VWS weakened and became confined to a narrow corridor during 2012–2021 (
Figure 6c). The lowest VWS in the magnitude of −2.1 m/s is shown over the AS, as represented in
Figure 6c, which is a critical parameter for TC intensification, allowing storms to maintain their vertical structure. This reduction in shear helps explain the rapid intensification of TCs before landfall in recent years.
On the other hand, VWS (which opposes TC development when strong) has decreased, further aiding TC formation and intensification, particularly in the BoB.
In two decades, 2002–2011 and 2012–2021, dipole-type structures of positive and negative anomalies in the western equatorial IO and central India stretched towards the AS, as shown in
Figure 6b,c. The intensity of a low-pressure system is defined in terms of positive vorticity. Positive vorticity anomalies at 850 hPa levels, which indicate cyclonic rotation, are higher over the Indian Ocean (
Figure 7a–c). The vorticity at lower level have shifted over the northern part of the AS and BoB from earlier decades to 2012–2021. Overall,
Figure 4 suggests more favorable conditions for TC genesis. The intrusion of vorticity from the AS to the Indian landmass has been interesting to watch in recent decades. The year-to-year relative vorticity at 850 hPa variability shows a linear increase in VWS over the AS (
Figure 8c). The Arabian Sea exhibits increasing vorticity and decreasing wind shear, along with heightened instability, particularly in the last decade depicted in
Figure 8a,b.
The westward shift of warming from the South China Sea is clearly evident in recent decades, as shown in
Figure 8c.
Figure 9 shows the interannual variations and trends of the fundamental variables required for the formation and sustenance of tropical cyclones over the Arabian Sea. In general, the wind shear and moisture are quite high during the summer monsoon, which decreases substantially after the post-monsoon (OND) season. The increase in moisture and VWS contributed to the formation of cyclones over the AS, as shown in
Figure 9a,b. The increase in wind shear is one of the main reasons for the formation of a number of cyclones over the AS in recent years (2012–2021). Wind, along with another parameter of moisture (MRH anomalies;
Figure 5c), shows a cyclonic pattern extended from Gujarat towards AS at 850 hPa in
Figure 4f. The favorable VWS between 0 and 5 m/s is very favorable and ideal for tropical cyclone formation. Overall, the average value of VWS for the recent decade is around 0.7 m/s, contributing to circulation and increasing moisture from the AS to the western coast of India (
Figure S2).
These trends highlight the growing potential for TC formation in the AS region during 1992–2021. Time series of vorticity, VWS, and MRH are depicted in
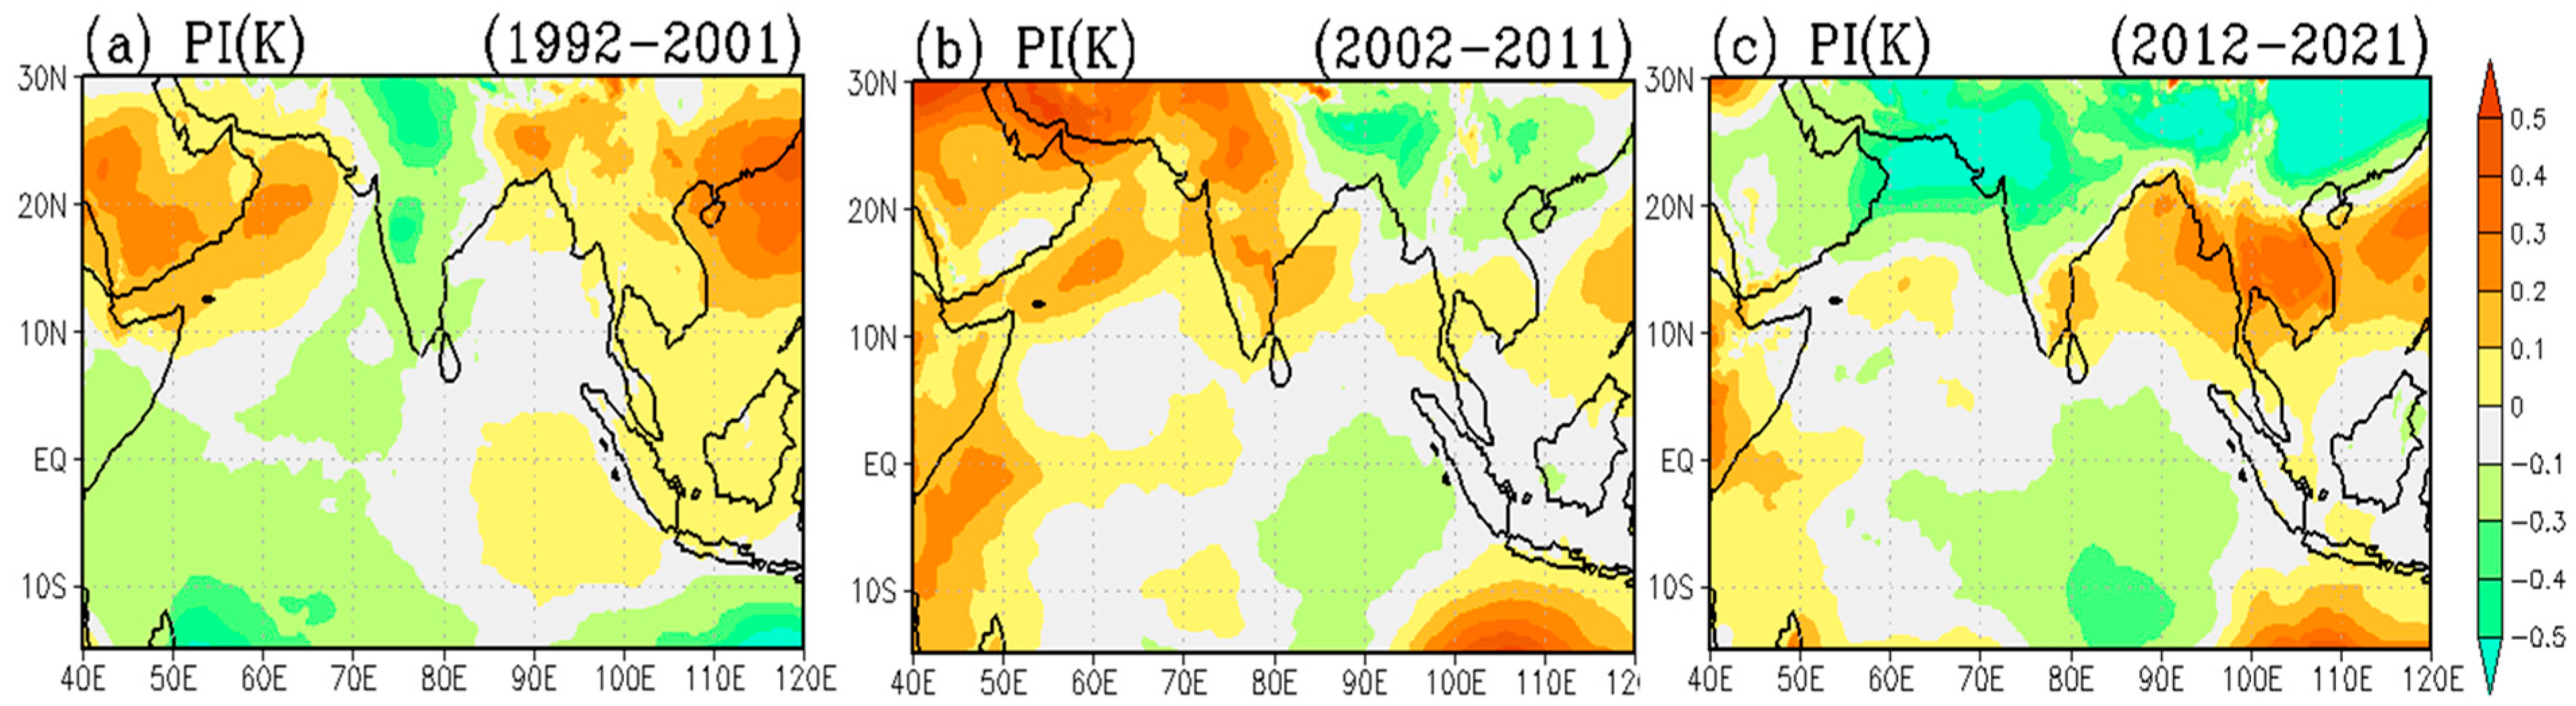
Figure 9. These trends reinforce the hypothesis that decadal variability in these key parameters has driven the recent rise in TC activity in the AS. The potential instability (PI) is one of the TC genesis parameters depicted in
Figure 8. In recent decades (2012–2021), the central AS showed higher potential instability than the previous two decades (1992–2001) and (2002–2011). The westward shift of warming from the South China Sea has been clearly evident in recent decades, as shown in
Figure 8c.
Figure 9 shows the interannual variations and trends of the fundamental variables required for the formation and then sustenance of the tropical cyclones over the Arabian Sea. In general, the wind shear and moisture are quite high during the summer monsoon, which decreases substantially after the post-monsoon season.
3.2. OLR and Rainfall Distribution During Post-Monsoon Season
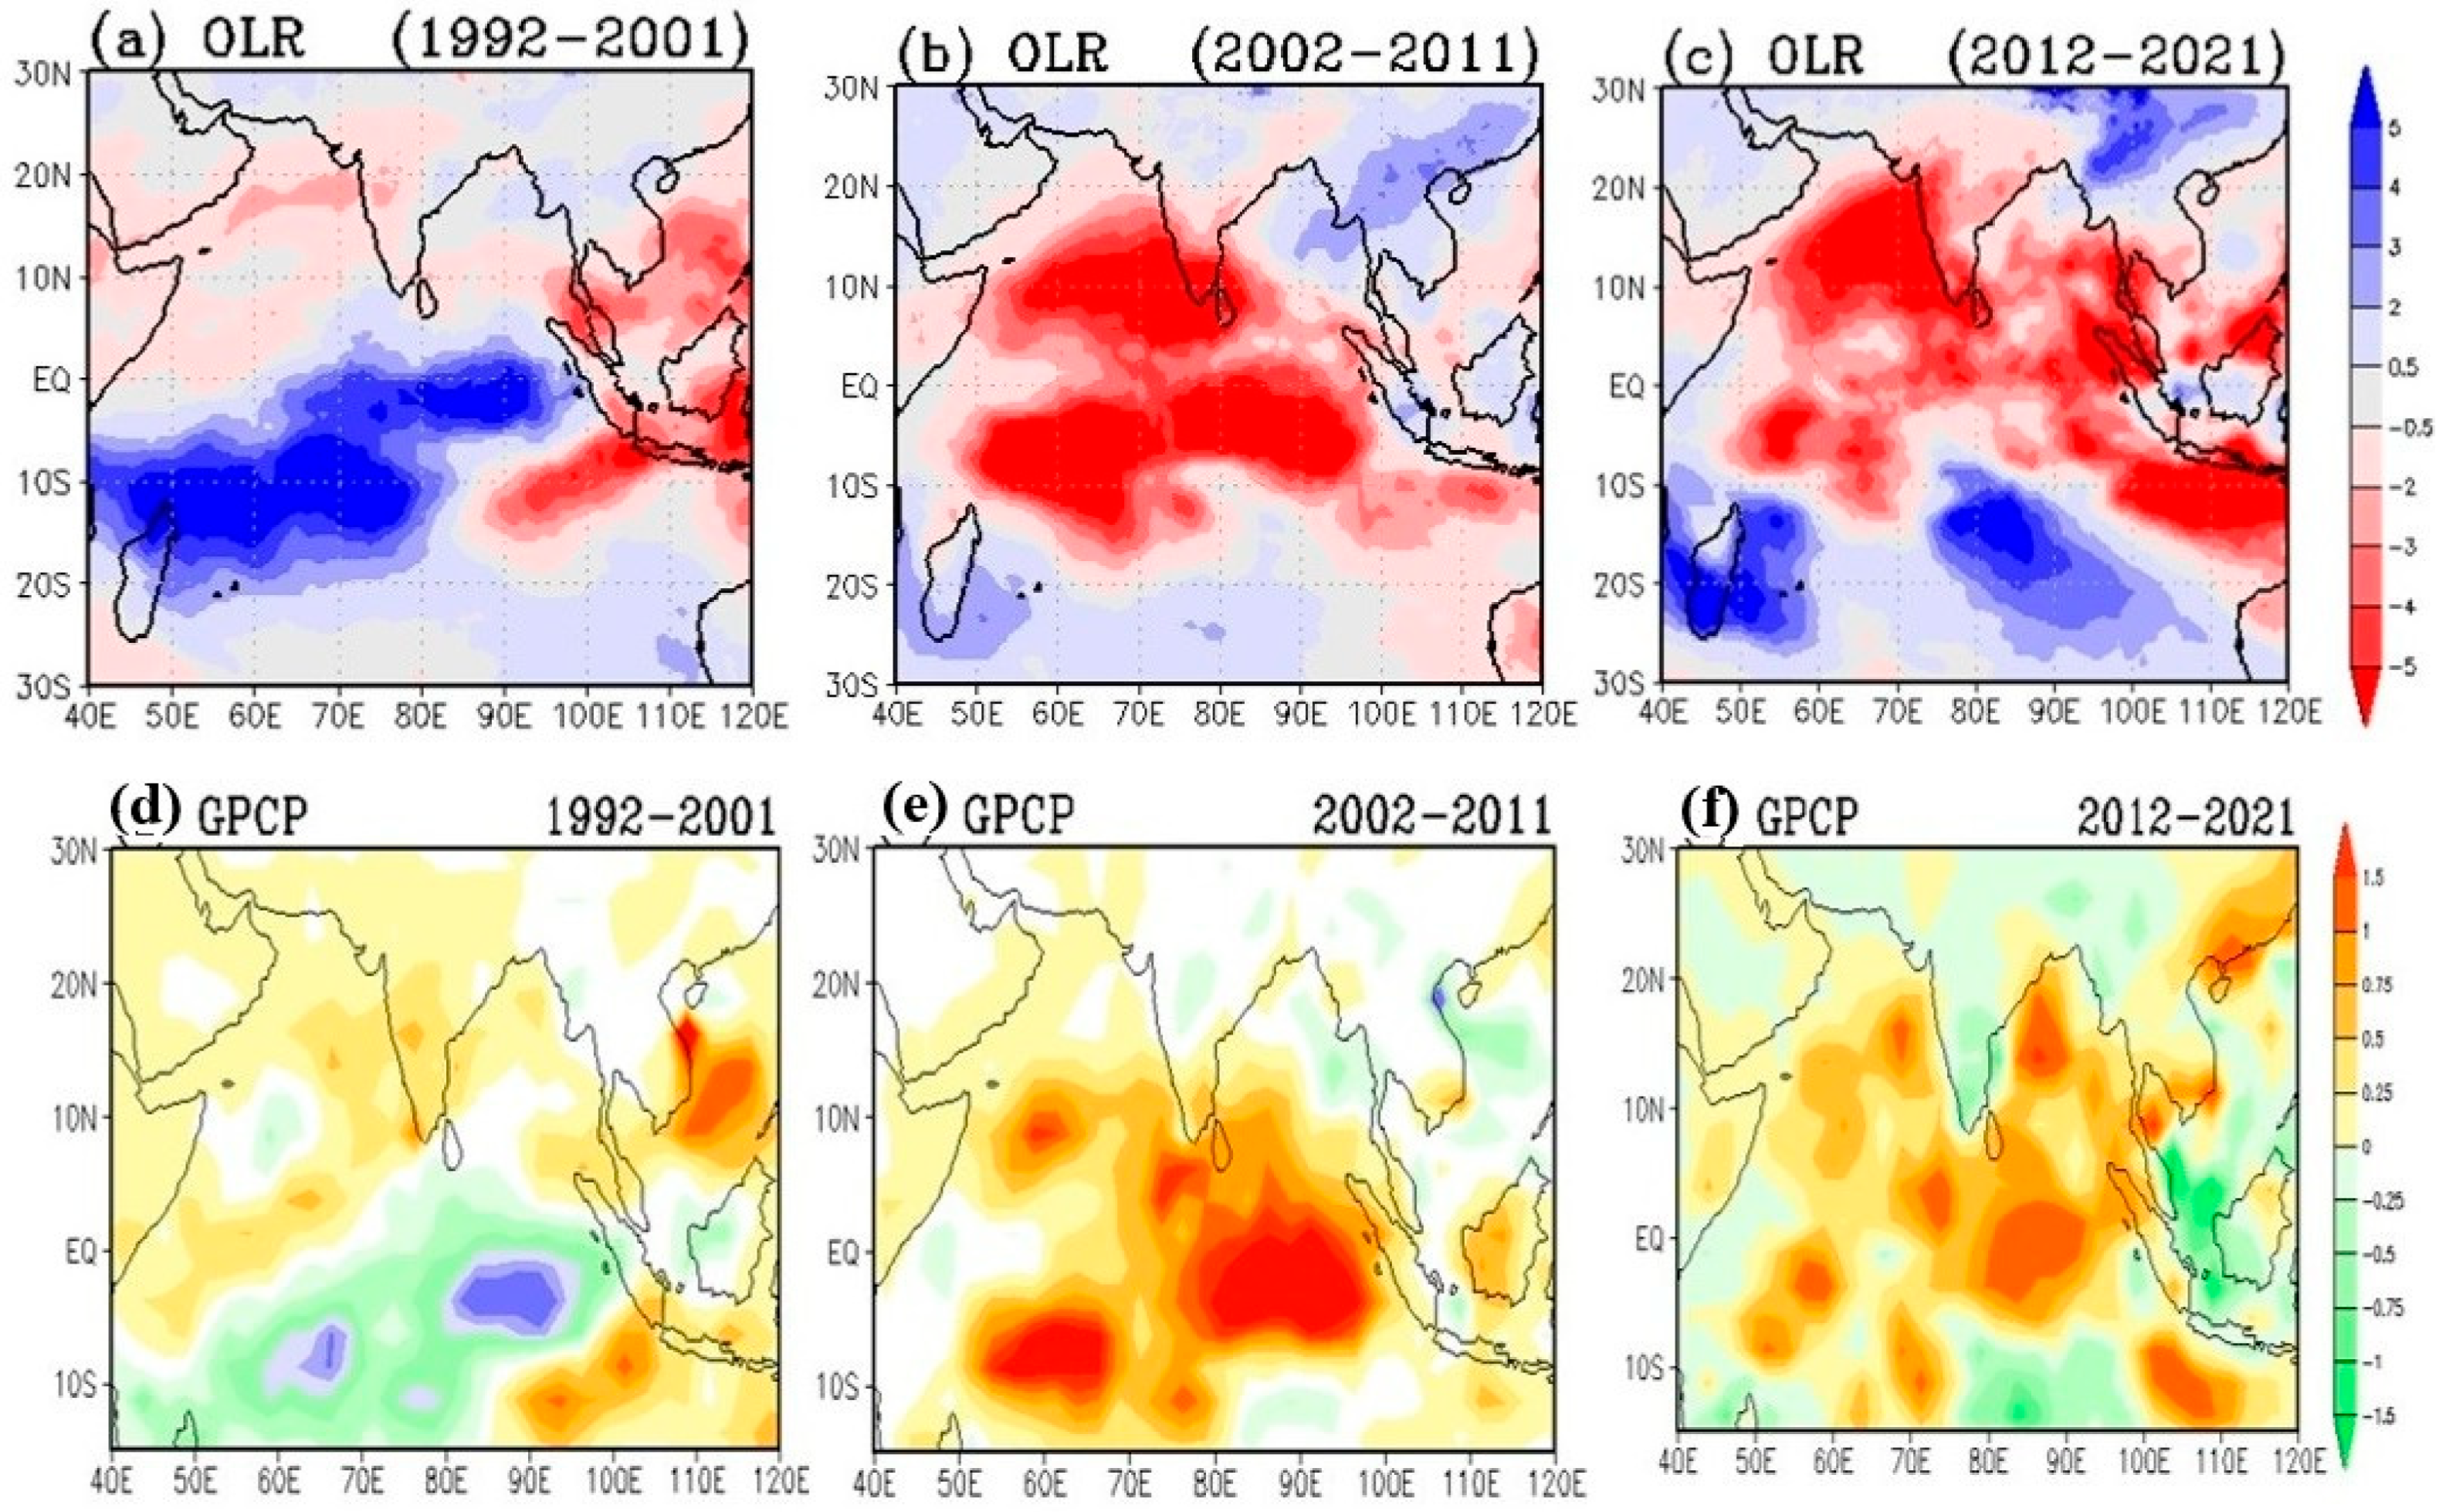
The AS regions have experienced stronger winds and increased moisture, especially during the latest decade, indicating a more favorable environment for cyclogenesis. Outgoing Longwave Radiation (OLR) anomalies provide insights into convection and cloud cover (
Figure 9). Lower OLR values, especially in the AS during 2012–2021, suggest enhanced convection and increased cloud cover, both of which are conducive to TC formation. Clouds and rainfall are not always highly correlated on a grid-to-grid scale. GPCP Rainfall Anomalies: This figure shows rainfall anomalies during OND (
Figure 10d–f). The Indian Ocean (AS and BoB regions) exhibits increasing rainfall, reflecting enhanced atmospheric convection, which is consistent with the increasing TC activity.
3.3. Silkroad Pattern (SRP) and Large-Scale Circulation
Streamline flow and meridional wind anomalies are important factors for cyclogenesis. The Silkroad pattern (SRP) can be explained well by the stationary Rossby wave dynamics and the interaction between stationary waves and the basic flow, as documented in Hong and Lu [
39]. Rossby wave ray theory (Hoskins and Ambrizzi [
40]) suggested that the potent westerly jet acts as the waveguide and confines the waves within it, causing convection.
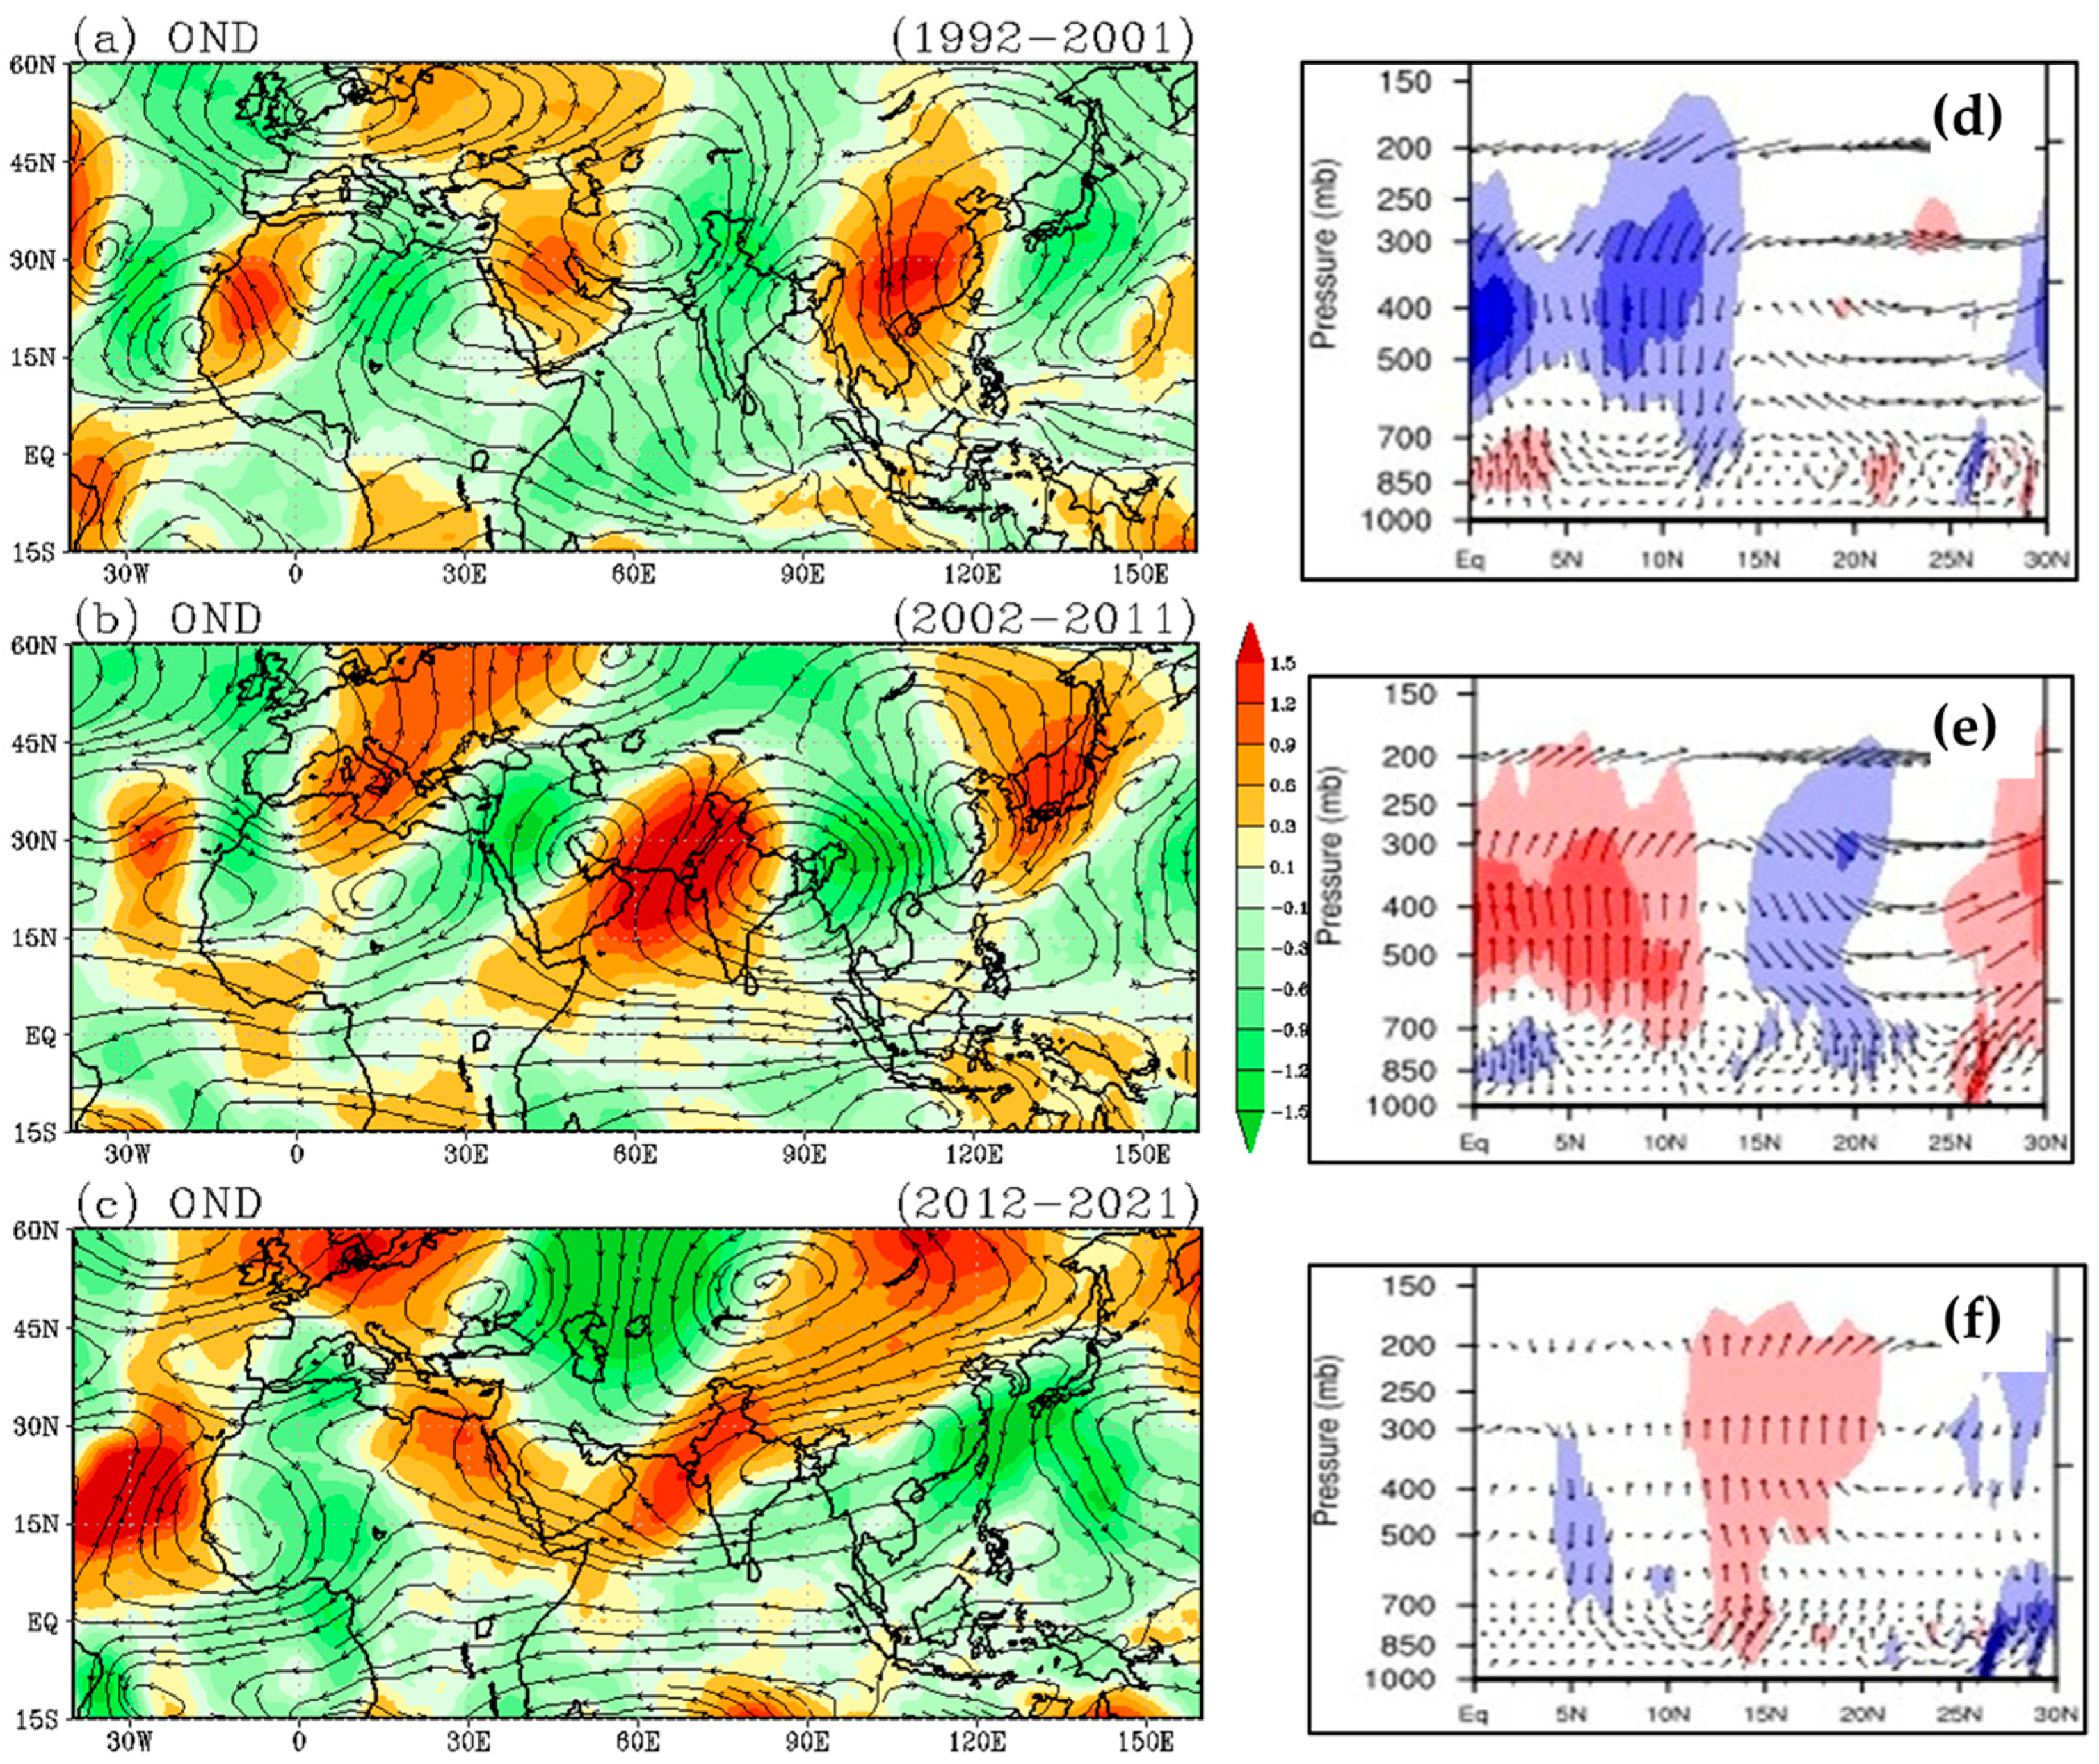
The meridional wind anomalies at 200 hPa show changes in upper-level circulation patterns, which are important for steering cyclonic systems (
Figure 11a–c). The streamline flow patterns suggest that upper-level winds became more favorable for TC development during the last decade. To explore the large-scale anomalous circulation pattern that influences Indian post-monsoon rainfall,
Figure 11 shows the 200 hPa horizontal wind anomalies for three decades: 1992–2001, 2002–2011, and 2012–2021 respectively. The anomalous circulation is characterized by a distinct wave pattern propagating along the Asian westerly jet from the North Atlantic to East Asia. This pattern is very similar to the SRP. Due to the warming over the Indian Ocean, the shift in the Asian westerly jet and associated high–low–high pattern is also one of the reasons for a change in the regional climate of South Asia.
Hadley circulation changes, plotted for the AS region, reveal stronger ascending motion during the 2012–2021 period, particularly over the AS, supporting the increased TC formation in recent years (
Figure 11d–f). It can also be noted that the Hadley circulation (HC) during the OND season over three decades has varied in strength. The HC strength has strengthened in recent decades in the AS region. The changes in the intensity of the HC may be dependent on the strong warming over the AS. The positive anomaly of HC has shown significant shifting from the equator to 15° N. However, some studies have shown a decrease in the strength of the Hadley cell in recent decades over the Indian subcontinent, especially over the Indian landmass [
41].
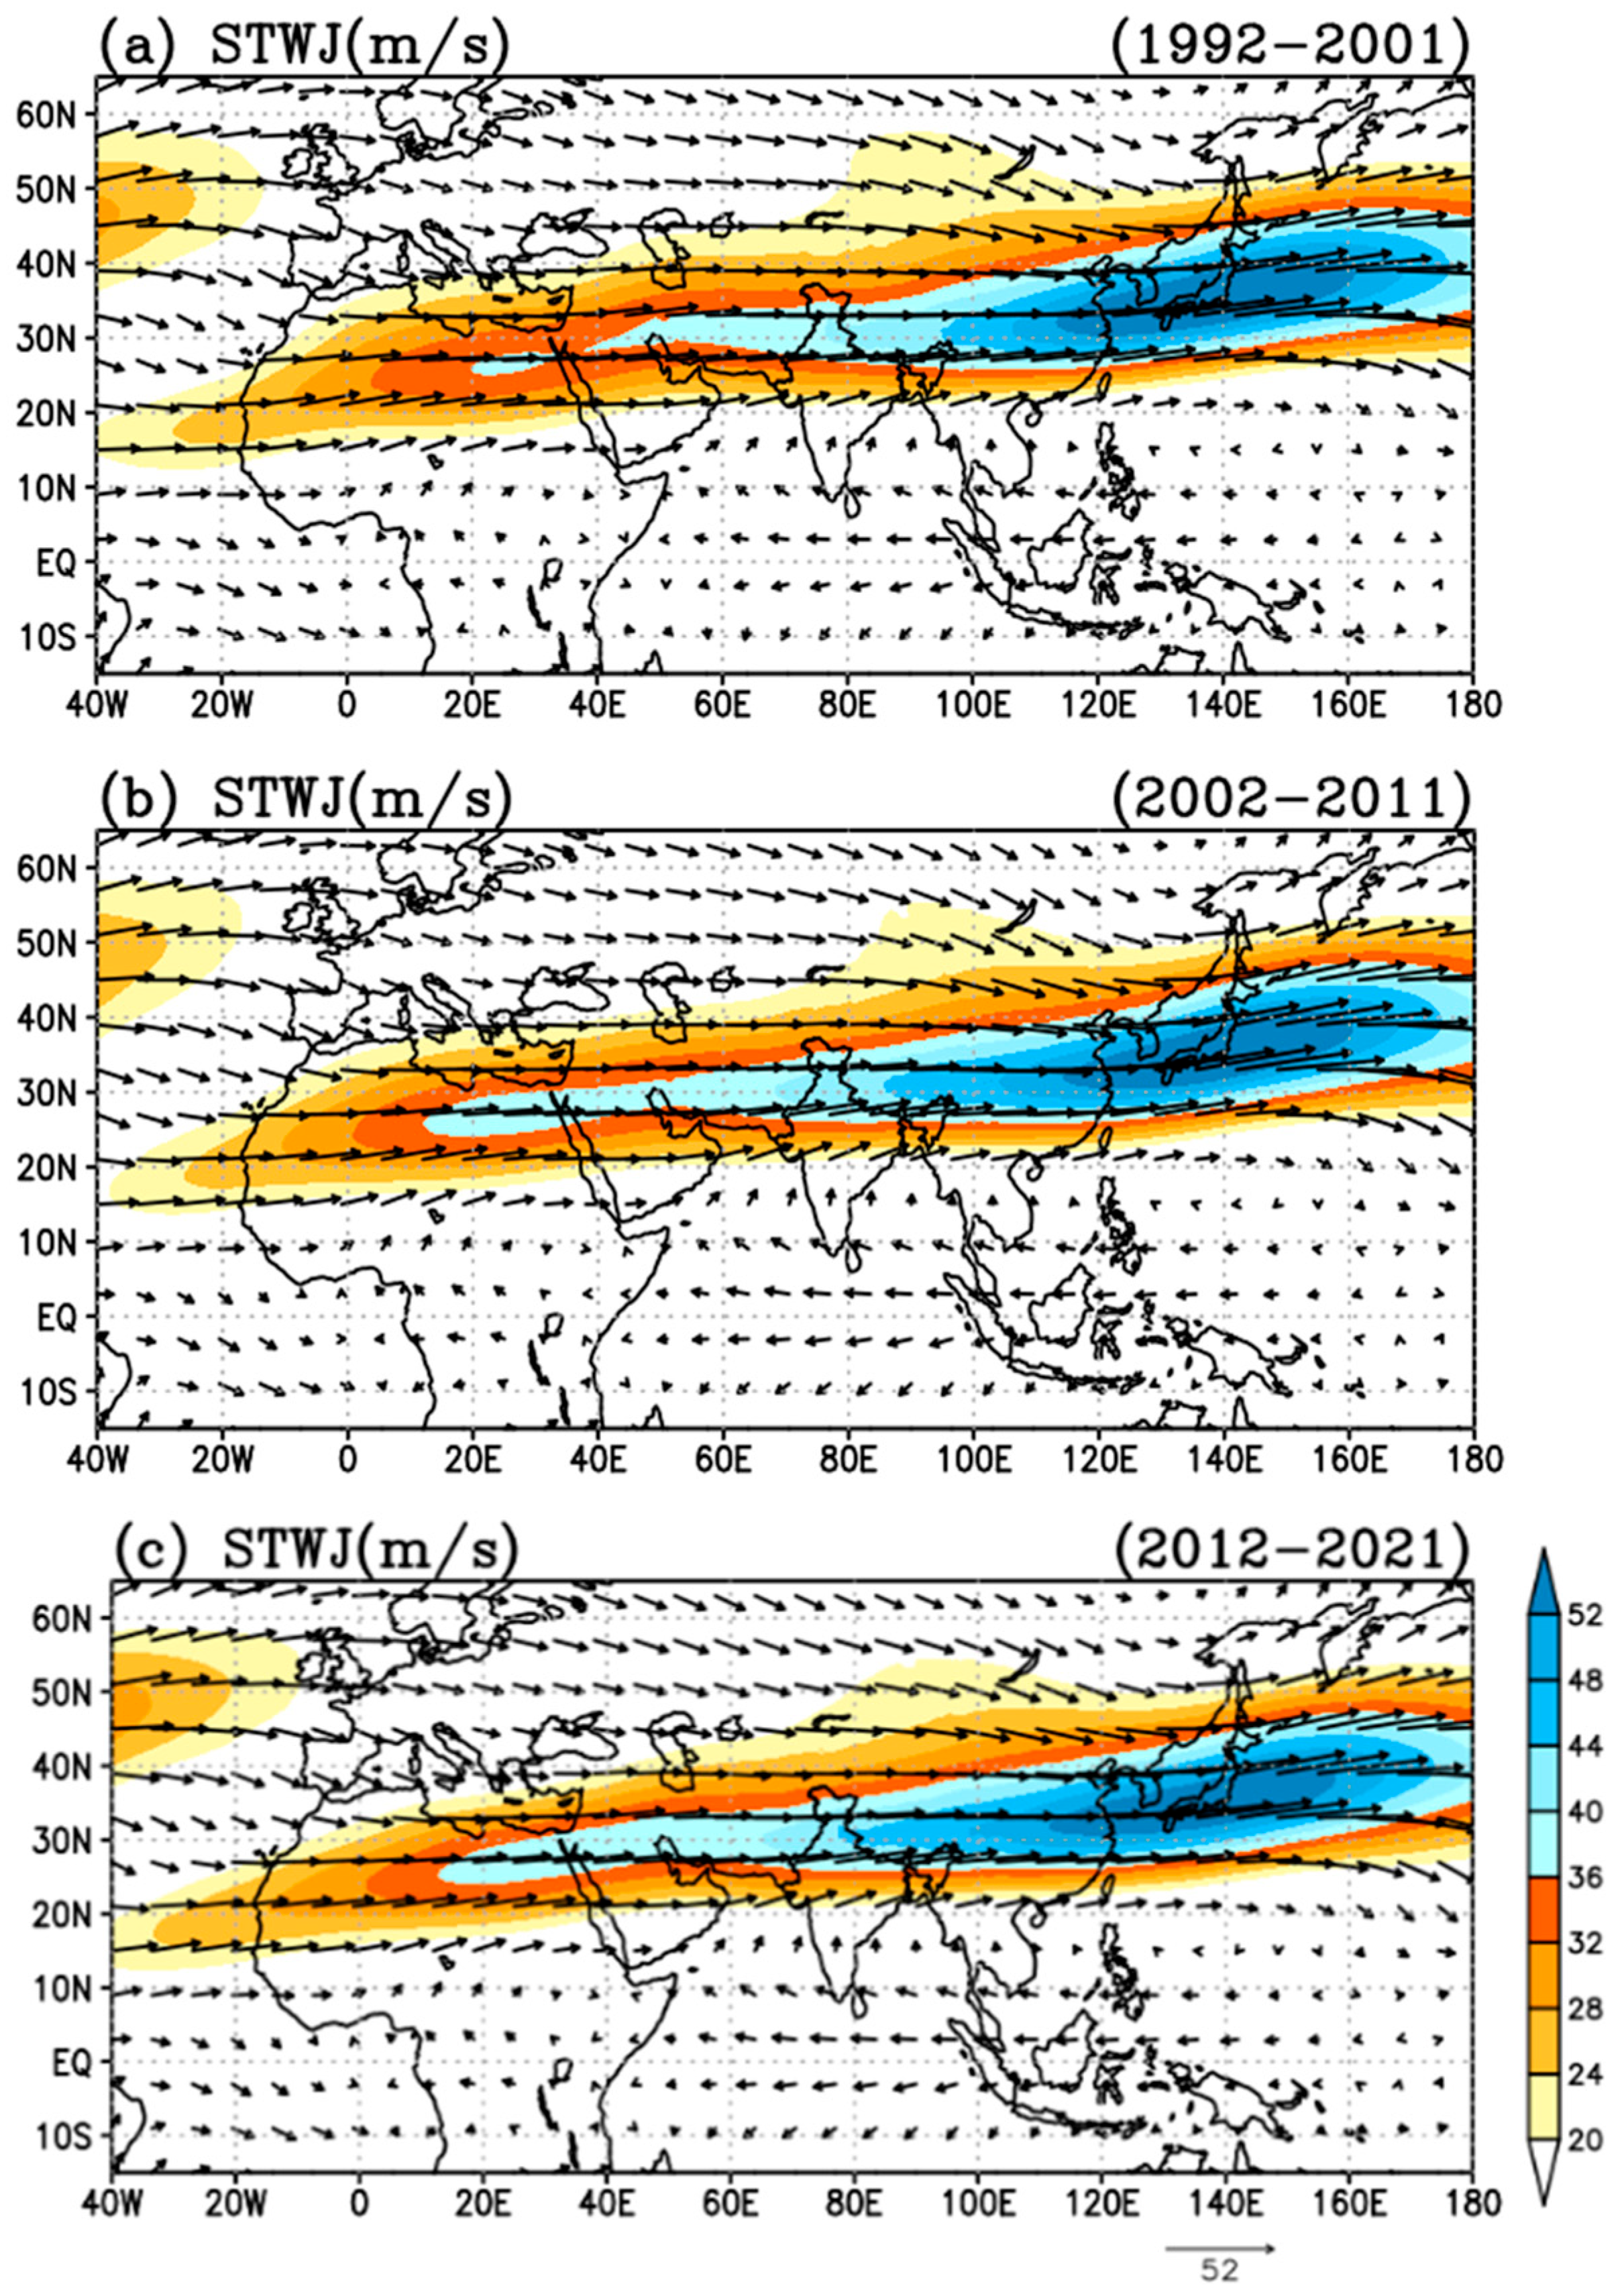
The Subtropical Westerly Jet Stream (STWJ) plays a key role in shaping the weather and climate of the Indian subcontinent. It shifts northward during summer, facilitating the onset of the southwesterly monsoon, while its southward retreat influences monsoon withdrawal. Climate change has caused the STWJ to exhibit both poleward and equatorward shifts, driven by warming in the tropical upper levels and changes in mid-latitude eddies [
42]. The interannual variability of the STWJ is influenced by large-scale climate drivers such as ENSO and the Indian Ocean Dipole, affecting the timing and extent of monsoon rainfall. Additionally, the Rossby wave train along the STWJ guides moisture transport, leading to extreme rainfall events, particularly during the pre- and post-monsoon periods [
43].
Figure 12a–c show an intensification and widening of the north–south direction of the STWJ from the first decade (1992–2001) to the last decade (2012–2021). Such variations in the jet stream pattern can significantly influence the low-pressure system and steer it northward direction.
4. Conclusions and Discussion
This study investigates the decadal variability (1991–2000, 2001–2010, and 2011–2020) of tropical cyclone (TC) genesis factors over the Arabian Sea (AS) during the post-monsoon season. It reveals a significant trend in ocean–atmospheric conditions that have facilitated TC formation and intensification over the past three decades. The findings indicate that warm sea surface temperature (SST) anomalies, particularly over the AS, play a crucial role in driving increased moisture content and convection, which enhances the likelihood of TC development and rapid intensification before landfall. Key environmental factors such as low-level vorticity, vertical wind shear (VWS), relative humidity (RH), intensification and widening of the Subtropical Westerly Jet (STWJ), and potential instability have shown distinct shifts over time, with the 2012–2021 decade experiencing the most favorable conditions for cyclogenesis.
The spatial and temporal analysis of SST, atmospheric circulation patterns, and cyclogenesis parameters underscores a decadal shift towards more frequent and intense cyclones over the AS. This is evidenced by the increased occurrence of very severe cyclones (VSCs) during recent years, which have been linked to higher moisture availability, increased wind shear, and variations in the STWJ. The combination of warming in the Indian Ocean and improved conditions for cyclone intensification highlights the growing impact of climate variability on regional cyclone behavior. Overall, this study emphasizes that the AS has become increasingly prone to cyclonic activity due to the favorable interplay of oceanic warming and atmospheric dynamics. This decadal shift in tropical cyclone activity raises concerns about the potential for more frequent and severe cyclones in the future, particularly as global warming continues to influence ocean–atmospheric interactions in the region.
Understanding these changing environmental conditions is essential for improving cyclone prediction models and mitigating the impacts of future tropical storms. Further, the dominant effects of interannual variability of the Pacific Decadal Oscillation (PDO), Atlantic Multi-decadal Oscillation (AMO), ENSO, and IOD teleconnections [
44] on the number of TCs over the AS can be studied to comprehend the TC variability in detail. However, Wang et al. [
45] suggested that the tremendous rainfall brought by a TC over the AS can temporarily relieve drought conditions over Middle Eastern countries and thus benefit residents and agriculture in the vicinity. Some of the notable findings from this research are as follows:
The shifting in cyclone formation and its intensification is linked to regional warming and the availability of moisture supply in the AS, especially over the western region in the 2012–2021 decade compared to the previous one (2002–2011).
In recent years (2012–2021), the SST (24.62%) and mid-tropospheric RH (5.86%) have shown increased trends that may be attributed to the enhancement of cyclone intensification over the AS.
Warm SST, enhanced moisture, favorable wind shear (0 to 5 m/s range), low-level vorticity in the AS (north of 10° N), and a stronger and northward shift of the Asian Jet Stream in recent decades made favorable conditions for the genesis of more cyclones in the AS basin.
In contrast, variations in storm intensity patterns are more likely to result from changes in SST and winds over the large areas traversed by mature cyclones. Both formation and maximum intensity may be related to warm SST anomalies and moisture transfer from the surface to the mid-tropospheric level due to maximum low-level vorticity.


 ,
, 


