Article

Trends in ANPP Response to Temperature in Wetland Meadows across a Subcontinental Gradient in Patagonia

by
Jorge Gonzalo N. Irisarri
1,*,
Pablo A. Cipriotti
2,3,
Marcos Texeira
2,3 and
Matias H. Curcio
4
1
Net Zero & Resilient Farming Directorate, Rothamsted Research, North Wyke, Harpenden EX20 2SB, UK
2
Instituto de Investigaciones Fisiológicas y Ecológicas Vinculadas a la Agricultura (IFEVA), Consejo Nacional de Investigaciones Científicas y Técnicas (CONICET), Ciudad de Buenos Aires C1417, Argentina
3
Dpto. Métodos Cuantitativos y Sistemas de Información, Facultad de Agronomía, Universidad de Buenos Aires, Ciudad de Buenos Aires C1417, Argentina
4
Instituto Nacional de Tecnología Agropecuaria (INTA), Consejo Nacional de Investigaciones Científicas y Técnicas (CONICET), Esquel Chubut C9200, Argentina
*
Author to whom correspondence should be addressed.
Meteorology 2022, 1(2), 220-230; https://doi.org/10.3390/meteorology1020015
Submission received: 18 April 2022 / Revised: 2 June 2022 / Accepted: 14 June 2022 / Published: 17 June 2022

Abstract

:
Due to ongoing global warming, seasonal patterns of aboveground net primary production (ANPP) may be altered by temperature trends. Of particular interest is the seasonal association between ANPP and temperature at the beginning of the growing season (the period encompassing minimum to maximum ANPP), where two contrasting mechanisms are in tension. On the one hand, the restrictions exerted by low temperatures in winter may be relaxed, increasing the slope of seasonal association between ANPP and temperature over the years. On the other hand, increases in temperature may increase water demand, reducing the slope over time. Across 543 wetland meadow areas in Patagonia, we estimated ANPP and obtained temperature records on a monthly basis from 2001 to 2019. The seasonal association between ANPP and temperature, tested through linear regression, was statistically significant in 96% of the cases (9921/10317 (543 wetland areas × 19 growing seasons)). The fitted linear models explained, on average, 84% of ANPP seasonal (June–December) variations. Through regression trees, we found out that the two tested mechanisms, the relaxation of temperature restriction and the increase in water demand, showed clear spatial patterns. The relaxation due to temperature increase took place at higher latitudes, but the water-limiting mechanism increased over mid-latitude areas.

1. Introduction

The study of the temporal patterns of the growth rate of vegetation, aboveground net primary production (ANPP), and their association with environmental drivers is critical to understanding the impact of the ongoing global warming effects [1,2]. Across grassland ecosystems of the world, there is a good understanding of the spatial [3,4] and inter-annual [5,6,7,8,9] association between ANPP and precipitation. However, our understanding of ANPP seasonal variations and their association with temperature is less clear. This deficit of clarity is partially associated with the positive covariation of temperature and CO2 [10], which increases ANPP, but is also due to the association between temperature and drought severity [11,12] which decreases it. Moreover, many of the studies addressing ANPP association with climate drivers are harvest-based, focusing on a single, peak biomass value. This prevents our understanding of how seasonal variations of ANPP are related to biophysical drivers, such as temperature.
ANPP seasonal patterns are governed by seasonality in terms of incoming radiation, temperature, and precipitation [13,14]. From mid to high latitudes, ANPP increases at the beginning of spring, reaches its maximum at the beginning of summer, and decreases during autumn [15,16,17]. This pattern is compressed at even higher latitudes and altitudes [18]. Of particular interest is the start of the growing season, the period in which seasonal ANPP goes from minimum to maximum, since its variation is tightly associated with herbivores’ reproductive behavior both in managed [19,20,21] and natural ecosystems [22,23], and is a key component of ecosystem functional types [17,24,25]. Recently, in a meadow area at a very high altitude, above 3000 m above sea level (m.a.s.l), it was shown that under ongoing global warming, ANPP increased at the start of the growing season due to a warming-induced earlier onset [26]. This result highlights the constraint that temperature imposes on ANPP when other factors are not limited, mainly water availability. However, it remains unknown if this finding can be extrapolated to other meadow areas located at mid and high latitudes in other parts of the world.
In southern South America, in the ecological area of Patagonia, the largest semiarid area of the continent, wetland meadows are imbibed within the main matrix of arid and semiarid steppes [27]. These areas are key for rangeland sustainability [28] and act as biodiversity hot spots [29,30,31,32]. Even though they usually represent a small proportion of the landscape within any ranch, from 2% to 8% [33], its ANPP can be up to six times higher than the one of the surrounding steppe areas [15,34,35,36]. The mechanism for this pattern is associated with the fact that water availability in meadows relies on the depth of the water table, and not directly on the amount of rainfall [31]. Within these ecosystems, ANPP regional spatial variations have been partially studied. Mean ANPP is at its maximum towards the west, close to the Andes Mountains where mean annual precipitation is also maximum and mean temperature reaches its minimum. Additionally, ANPP relative interannual variation increases towards the north [15]. However, this study only covers a minor portion of wetland area distribution across Patagonia. Moreover, regarding the seasonal variation of ANPP, no study has addressed the seasonal association of ANPP and temperature at the start of the growing season in meadow areas.
In the central basin of Patagonia, July’s temperature governs the starting date of the growing season [19], influencing the reproductive performance of sheep herds [33]. Within this area, there is a delay in the start of the growing season if the temperature in July decreases [19]. Moreover, in many areas of Patagonia, the average minimum temperature has increased over the last twenty years [37]. These two patterns suggest that, in rangeland areas of Patagonia, the association between ANPP seasonal variations at the start of the growing season and temperature should be changing. There are, at least, two opposite predictions on the seasonal association between ANPP and temperature. On the one hand, as the restrictions exerted by low temperatures in winter are relaxed, due to temperature increases, the positive association between ANPP and temperature could become steeper. In other words, the slope of seasonal association between ANPP and temperature could increase through the years. However, on the other hand, increases in temperature also represent increases in water demand, which may impose a new restriction on ANPP, reducing the positive slope of the association between ANPP and temperature through the years.
Our main objective was to analyze the spatial variation, across an 18° latitude range, of the association between ANPP and temperature within meadow areas. To do so, and for a set of 543 meadow areas embedded in the semiarid Patagonian steppes, we proposed two specific objectives. The first one was to describe the spatial variation in the association between ANPP at the beginning of the growing season and temperature. The second objective was to describe if the association between ANPP and temperature changed over time. Additionally, if it did, we aimed to understand which mechanism prevailed: the relaxation of temperature restriction or, on the contrary, a negative trend suggesting an increase in water demand. To do so, we performed linear models associating ANPP seasonal variations and temperature per year from 2001 to 2019, and then we used the estimated parameters of the models to describe the possible temporal trends with regression trees. Through this approach, we evaluated which of the two alternatives regarding temperature effect on ANPP prevailed.

2. Materials and Methods

2.1. Site Description

Sampling sites were entirely located within the phytogeographic region of Patagonia at the southern end of South America (Figure 1). The climate of this wide region is cold temperate, with a pattern that denotes the influence of the Andes mountain range and latitude [38]. Moreover, altitude also plays a key role in shaping temperature variations [39]. Mean annual temperature ranges from 3 °C in the south to 12 °C in the north, with absolute minimum temperatures below −20 °C. The thermal amplitude varies from 5 °C in the extreme south of the region to 16 °C in the north [38]. Mean annual precipitation decreases from the Andes Mountains towards the east, from more than 1000 mm of annual precipitation towards the Andes to less than 150 mm towards the central basin of Patagonia, while its variability increases, in this sense, for the vast majority of the area [38,40]. The precipitation is concentrated in the autumn–winter period with a consequent marked summer water deficit [16,40]. However, the extreme south of the region has a more uniform seasonal distribution of rainfall, showing some additional rains, especially in the summer, in a narrow eastern strip [16,38]. This decrease in rainfall from west to east determines a gradient of vegetation types: from forests through grass steppes, to shrub steppes and semideserts [41,42]. Imbibed in the semiarid matrix of Patagonia are wetland meadows, locally named ‘‘mallines’’ or “vegas”. Mallines present seasonal periods of flooding due to large fluctuations in the water table [31,32], which determines that their vegetation is generally characterized by containing hygrophytic species [29,30,43]. Within these areas, water distribution determines different physiognomies, with species better adapted to drought conditions at the borders and species better adapted to flooding in the center [43,44]

2.2. ANPP Monthly Association with Temperature

Wetland meadow locations across Patagonia are not easily reached [27]. For example, there is no land cover classification able to identify their location over the entire region, even though some subregional studies have been able to identify their location [36,45]. Moreover, wetland meadow areas exhibit contrasting cover ranges associated with the depth of the water table, and/or grazing history [34,35,36]. To surpass this location limitation, we took advantage of a recent compilation of 543 wetland meadows’ botanical surveys carried out by local experts across the entire region of Patagonia. All the botanical surveys were carried out to describe botanical heterogeneity. This gave us the advantage of securing the location of wetland meadow areas. However, in these areas, studies were carried out on different vegetation physiognomies associated with the depth of the water table and/or grazing history.
Across these 543 wetland meadow areas, located from −54° to −37° latitude and from −72° to −66° longitude (Figure 1), we, on the one hand, estimated ANPP on a monthly basis based on locally calibrated remote sensing data [15] and, on the other, obtained from a world database monthly maximum and minimum temperature [46] to finally study the association between them. ANPP, expressed in kg/ha·day with monthly values from 2001 to 2019, was estimated as the triple product of incoming photosynthetic radiation (PAR, in MJ/m2 day), the proportion of it absorbed by green active vegetation (fPAR), and by the conversion of the absorbed radiation into biomass, i.e., the radiation use efficiency (RUE, in g/MJ) [14]. Monthly PAR values were obtained from ERA5-Land monthly averaged data [47] through the Google Earth Engine (GEE) platform [48]. This worldwide database has a pixel resolution of 11,132 m. fPAR values were obtained from the MODIS satellite mission, specifically using NDVI values from product MOD13Q1 [48] with a pixel resolution of 250 m. NDVI values were non-linearly converted to fPAR following a local protocol developed for meadow areas of Patagonia [15]. Finally, ANPP was estimated as the product between APAR (PAR × fPAR) and RUE; the latter was also obtained from local estimations [15]. Maximum and minimum temperature were averaged to generate an estimator of mean monthly temperature. Both maximum and minimum temperature values were obtained from the TerraClimate database, also through the GEE [48]. This worldwide database has a pixel resolution of 4638.3 m. For each area and growing season from 2001 to 2019, we estimated the linear association between monthly ANPP and the standardized temperature considering the period between June and December (n = 7 months). Because of the analysis, we obtained a total of 10,317 estimators of the Y-intercept and the same number of estimators of the slope (543 meadow areas × 19 analyzed periods, from 2001 to 2019) and their statistical significance (alpha level of 0.05).

2.3. Spatial and Inter-Annual Variation in the Slope

Two approaches were taken to analyze the spatial and inter-annual variations and their association with geographical coordinates. First, and to analyze the spatial variation, we compared two statistical techniques: linear multiple regression and regression trees. For both analyses, the dependent variable was the slope of the seasonal association between ANPP and temperature, and the independent variable was the geographical coordinates (LAT and LONG). The use of multiple linear regression and regression trees allowed us to compare the complexity of the spatial pattern. While the former only allowed linear associations, the latter allowed non-linear ones. Specifically, due to the absence of wetland meadow areas towards the northeast portion of Patagonia (Figure 1), this was particularly important for the linear multiple regression approach. However, the regression tree was more flexible on this end. In a nutshell, regression trees describe the variation of a dependent variable (i.e., slope estimator) by applying a recursive partitioning procedure based on an iterative search for the best binary splits of data into more homogeneous groups, using geographical coordinates in our case as explanatory variables. The method searches for a single explanatory variable which splits the data into two homogeneous subgroups to minimize an impurity or diversity measure in the subgroups, e.g., the Gini coefficient, information index, etc. To do so, explanatory variables as well as their thresholds are compared to choose those minimizing the risk of misclassifying errors for each split. Then, data are divided, and this process is applied separately to each subgroup, and so on, recursively, until the subgroups either reach a minimum size or until no improvement can be made. Default values finalize the tree construction based on a complexity parameter to avoid overfitting (cp = 0.01). In addition, we established 50 as the minimum number of cases (wetland meadow areas) in each terminal node. Multiple regression analysis was constructed using the nlme R package [49]. The evaluated model considered the independent variables in a full polynomic degree of two. Regression trees were constructed using the rpart R package [50] which is based on the original ideas of Breiman [51].
Second, and to understand the inter-annual variation, we took a two-step approach. In the first step, we looked at the temporal trend of the slope of the linear association between ANPP and temperature. We used the Pearson correlation coefficient as an estimator of the temporal trend. Positive correlations of the slope over time would support the restriction relaxation exerted by temperature. On the contrary, negative ones would support the increases in water demand which impose new restrictions on ANPP. In the second step, we took advantage of the regression tree. In this case, we used the Pearson correlation coefficient of the slope through the years as the dependent variable and the geographical coordinates as the independent variable. All statistical analyses were carried in an R environment (R Core Team 2021).

3. Results

3.1. ANPP Monthly Association with Temperature

Overall, the linear association between monthly ANPP and temperature was highly significant across wetland meadow areas and growing seasons. The tested association was statistically significant in 96% of the cases (9921/10,317) and was always positive. Moreover, the fitted models explained, from a minimum of 50% to a maximum of 90%, with an average of 84%, the ANPP monthly variations, indicating that there is a tight and positive association between variations in ANPP and temperature during the growing season (June–December). However, the mean estimated slope (b1) exhibited a 210-fold variation (Figure 2) where ANPP increased from a minimum of 0.037 to a maximum of 7.8 kg/ha·day per one degree of increase in mean temperature during the growing season. Moreover, the variation in the slope did not exhibit a straight relation with either latitude or longitude (Figure 2).
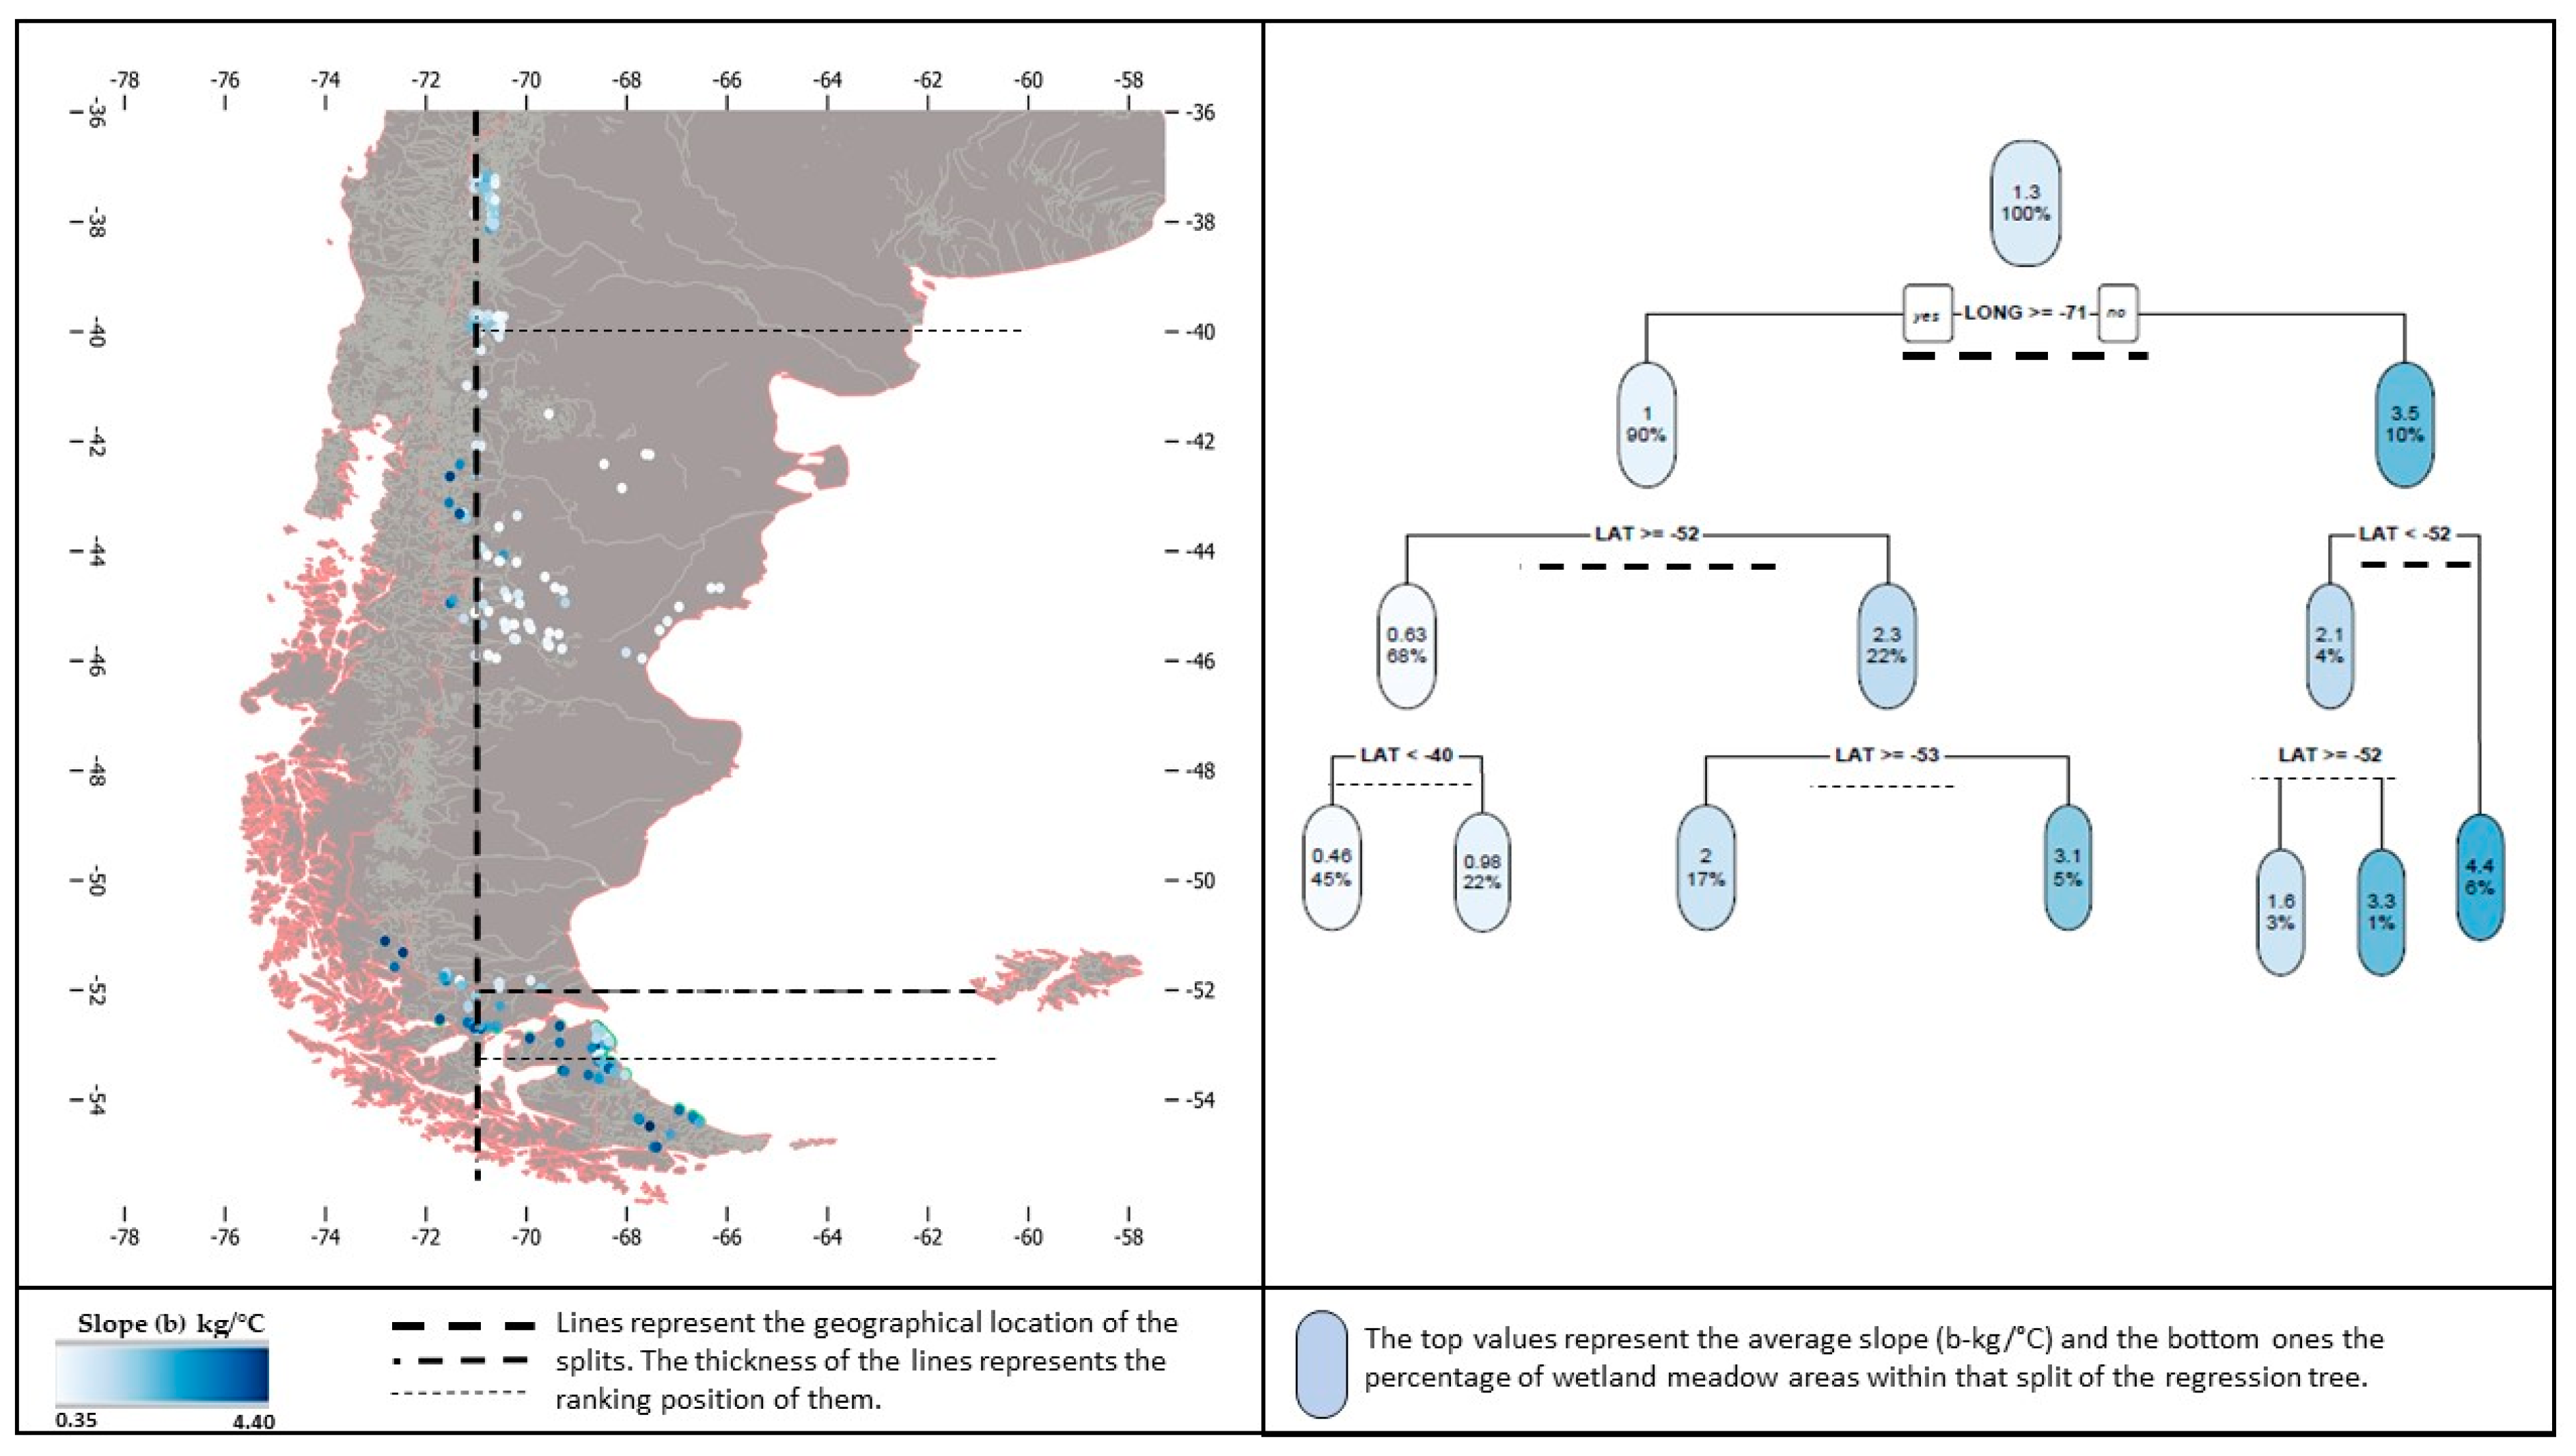
The complexity of the association between the slope and the geographical coordinates was better captured by regression trees than by multiple linear regression. On the one hand, the proposed multiple regression analysis explained 37% of the spatial variation in the slope with the following adjusted model: b1 = 979 − 3.01LAT + 0.01LAT2 + 30.7LONG + 0.24LONG2 − 0.05LATLONG (Adjusted R-squared: 0.3672, p-value: <2.2 × 10⁻¹⁶). The regression tree (Figure 3), on the other hand, explained 64% of the spatial variation in the slope up to the sixth split (Figure 3; Table S1 in Supplementary Materials). According to the regression tree, the first main split was associated with sites located east or west of −71° LONG, and accounted for 27% of the variability in b (Table S1). Those west of −71° LONG represented 10% of the sites while those east of it represented the remaining 90%. Moreover, b1 was 3.5-fold higher in sites towards the west when compared to those east of −71° LONG. The second and third splits were associated with the location of the sites either north or south of −52° LAT, and east of −71° LONG (Figure 3). These three splits accounted for 56% of the variability in b1 (Table S1). Within these two groups, the ones north of −52° LAT represented most of the sites (68%), and on average had a slope almost four-fold lower than those south of −52° LAT (Figure 3). Up to the sixth split, the model accounted for 64% of the variability in b1 (Figure 3, Table S1). At these levels, divisions were associated with portions north or south of −40° LAT, −53° LAT, and −52° LAT.

3.2. Temporal Trends of ANPP Response to Temperature

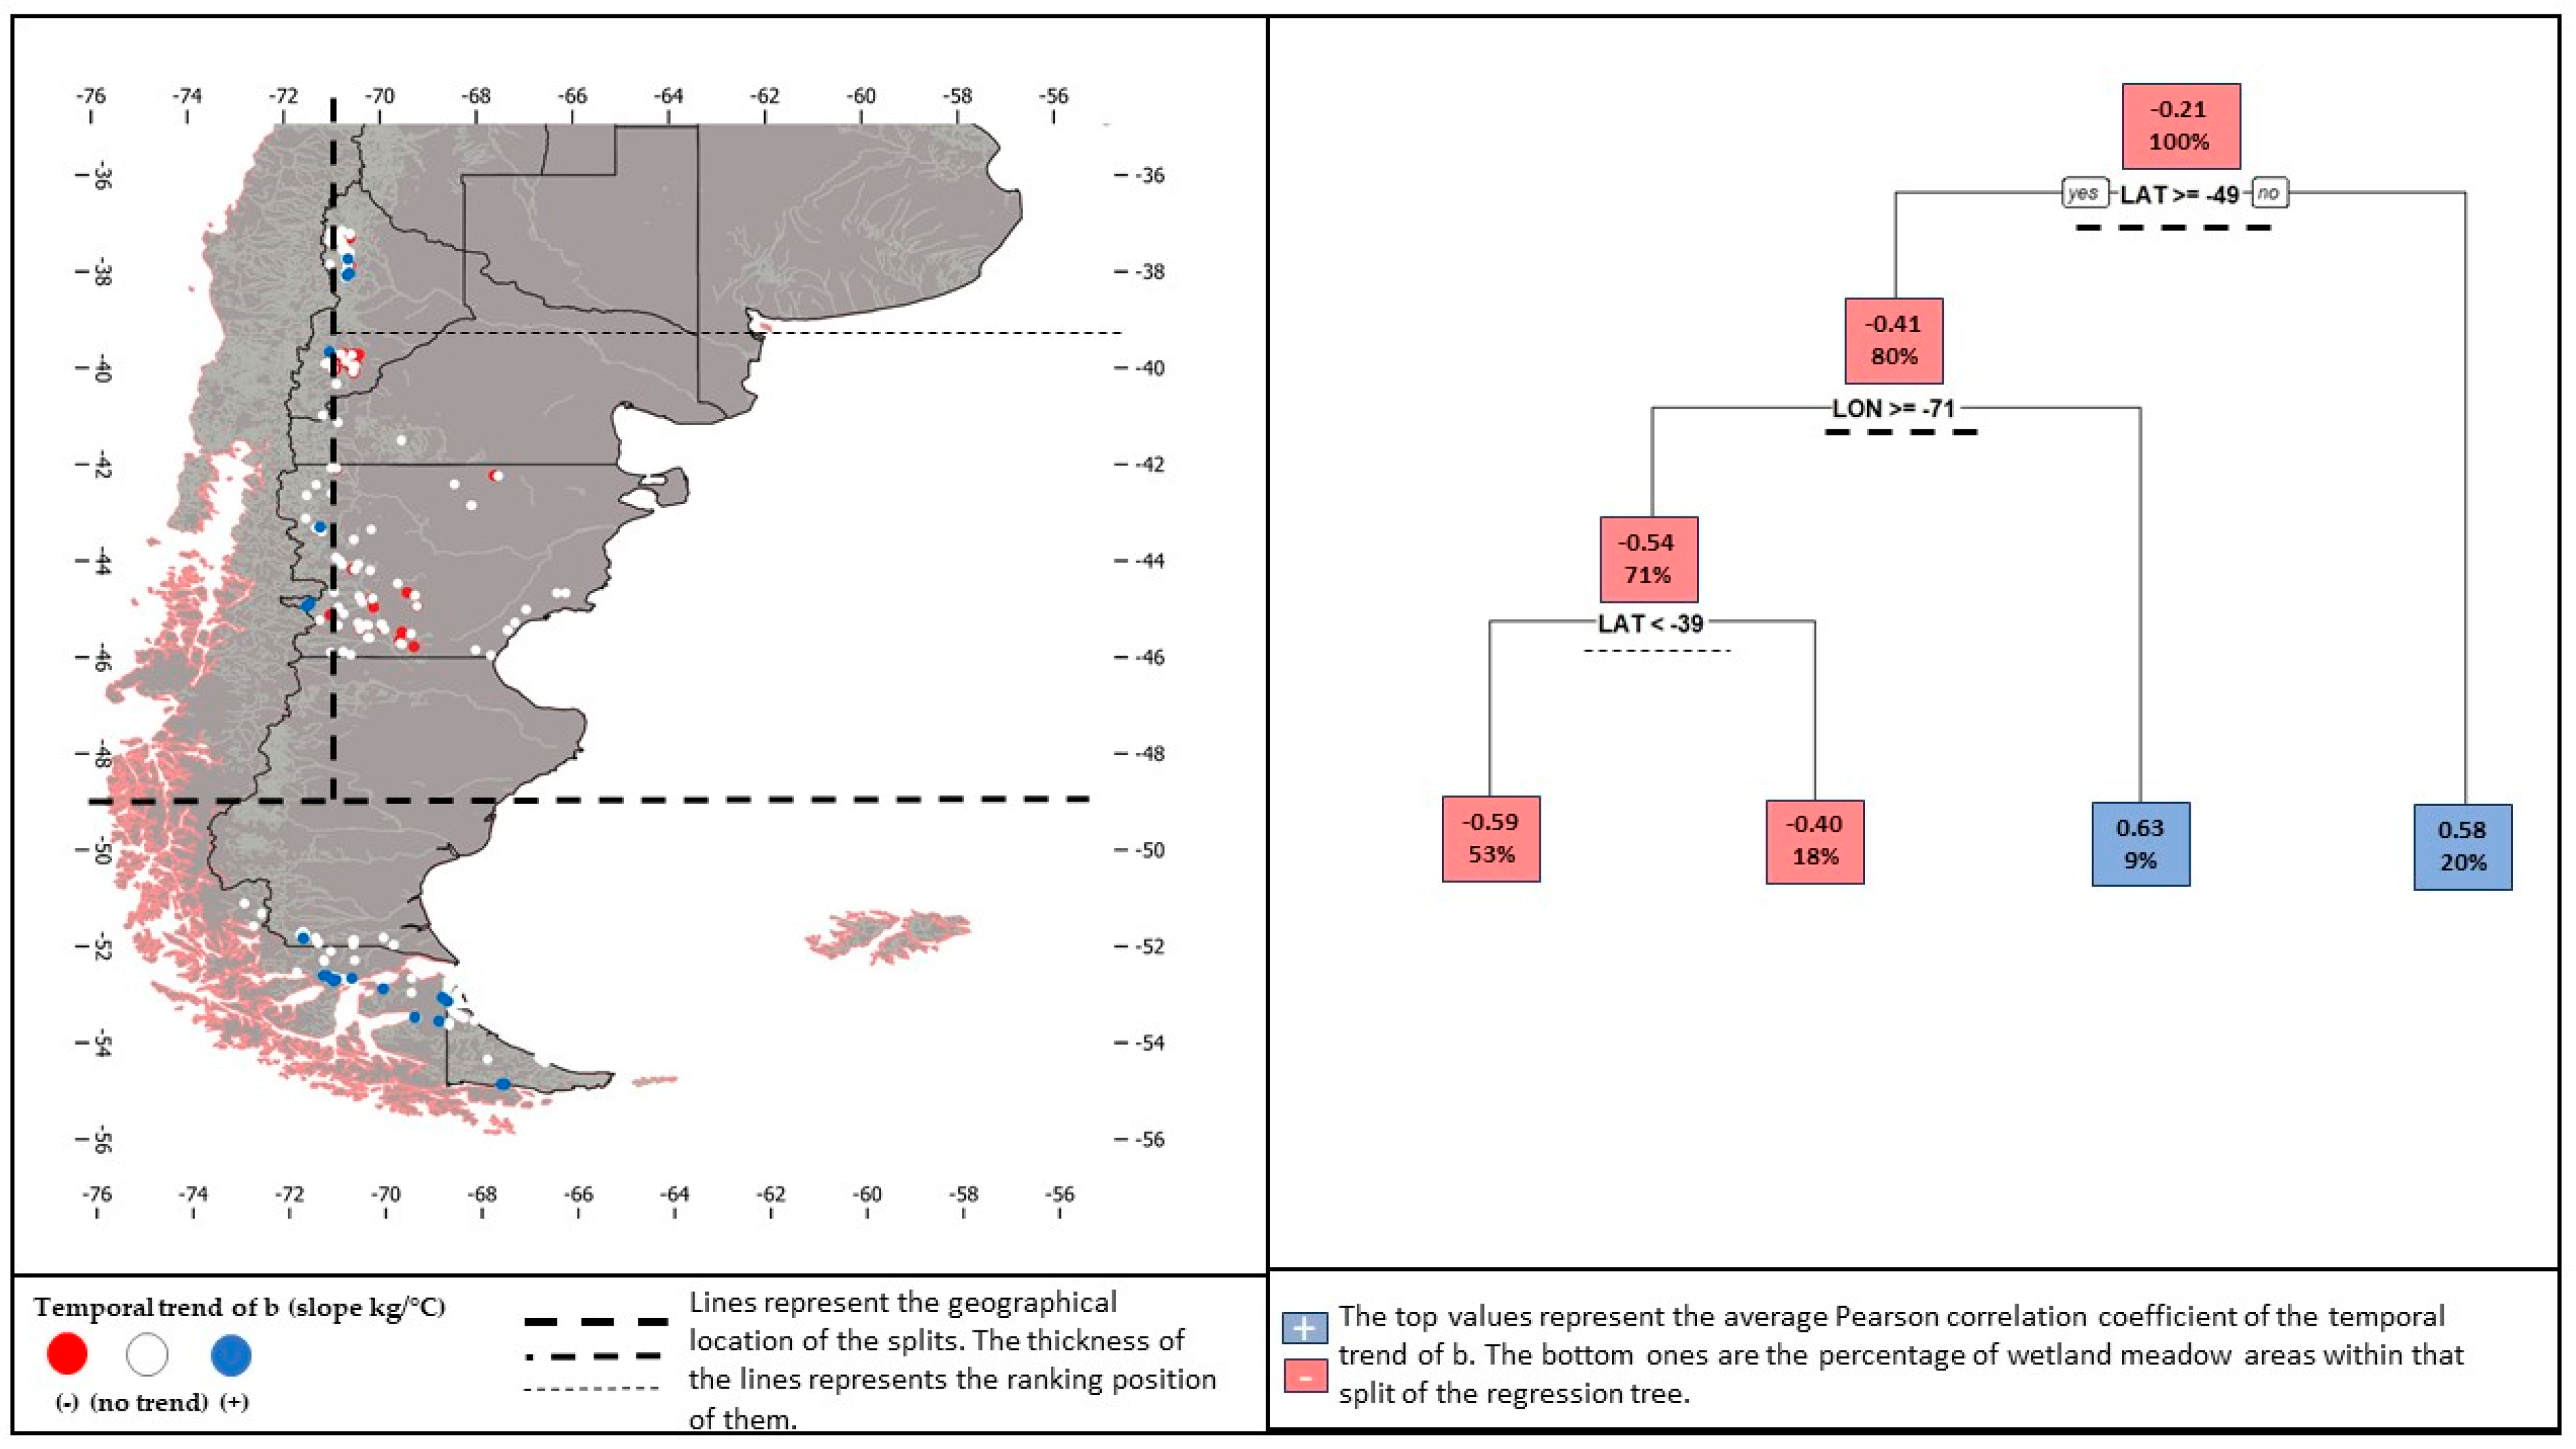
In 18% (n = 99) of the 543 meadow areas, there were significant (p-value < 0.05) temporal trends in the slope of linear regression between ANPP and temperature. Within the areas with significant trends, negative ones prevailed (67% of the sites with significant trends were negative). The complexity of the association between the slope of temporal trends and the geographical coordinates was, as with the spatial variation, better captured by regression trees than by multiple linear regression. However, both analyses explained a vast proportion of the spatial variability in the temporal trend of the slope. The multiple regression analysis explained 62% of the spatial variation in the trend with the following adjusted model: Trend b1 = 563 − 0.77LAT + 0.002LAT2 + 17LONG + 0.12LONG2 − 0.01LATLONG (Adjusted R-squared: 0.6229, p-value: <2.2 × 10⁻¹⁶). The regression tree (Figure 4) explained 89% of the spatial variation in the temporal trend with only four splits (Table S1). According to the regression tree, the first main split was associated with sites located north or south of −49° LAT. Those to the south of it exhibited positive trends of b1 and represented 20% of the areas. North of −49° LAT, there were both positive and negative trends (Figure 4). Positive trends, however, were west of −71° LONG but negative to the east of it (Figure 4). Finally, east of −71°, there was another split across −39° LAT with smaller differences among both terminal nodes.

4. Discussion

Our results confirmed that, across wetland meadows, there is a strong positive and linear association between ANPP and temperature at the start of the growing season. However, the slope of this association showed a 210-fold variation (from 0.037 to 7.8 kg/ha·day per one degree of increase in mean temperature) and significant temporal trends. Regarding the two tested mechanisms, the relaxation of temperature restriction and the increase in water demand, both mechanisms showed clear spatial patterns. The relaxation due to temperature increases took place at higher latitudes, but the water-limiting mechanism increased over mid-latitude sites.
The 210-fold variation in the slope of the association between ANPP and temperature highlights, on the one hand, the heterogeneity of the vegetation across these wetlands and, on the other, its variation over time within each area. Many authors have described across different wetland meadows differences in physiognomy and vegetation cover [29,35,42,43,52,53]. The consensus is that, within wetland meadows, there are at least three main physiognomies [54] strongly associated with the landscape distance from the center to the periphery of the main water stream [43]. Across these different physiognomies, ANPP can vary up to two-fold, from 5000 kg/ha·yr to 9000 kg/ha·yr [15]. Our analysis partially suggests that ANPP response to temperature was restricted by these different physiognomies. The response over time seems to be very novel, and as far as we are aware there are no descriptions of the temporal patterns described here.
The temporal trends in the slope of the association between ANPP and temperature highlight at least three possible mechanisms. Regarding the positive trends, and as proposed previously, increases in the average minimum temperature in the last twenty years [37] have driven increases in the response of ANPP to it. This was particularly true towards the western and southern ends of the study area. These findings support the constraint reduction in ANPP by temperature when other factors are not limited, mainly water availability, as observed in similar areas of the world [26]. For these sites, global warming predictions should enhance conditions for both primary and secondary production [55,56].
Regarding the negative trends, there were two overlapped sources of variation for the observed pattern. On the one hand, our results support the second proposed mechanism: the increase in water demand given the increase in temperature. This is particularly true for sites located towards the center of the study area, where hyperarid conditions exist [11,57]. However, on the other hand, rangeland areas of Patagonia have been long described as overgrazed since the sheep introduction at the end of the 19th century [28,39,58,59,60,61]. In this context, wetland meadow areas are current “hotspots” of degradation given that, within Patagonia, the vast majority of these areas are outside the international union for conservation of nature levels I to III [27]. Consequently, in most ranches, these lowland areas are mixed with the surrounding steppes [15,28,35,53], preventing a differential grazing management to preserve them. Future studies should address which mechanism exerts more pressure: global warming or overgrazing. To do so, the use of techniques such as RESTREND analysis appear as a potential paths to disentangle the relative importance of climate from grazing within these areas [62,63,64,65,66].

5. Conclusions

Overall, we were able to quantify the main role that temperature plays in ANPP dynamics at the beginning of the growing season in wetland meadow areas of Patagonia. Our results showed a tight and positive association between ANPP and temperature. This seasonal association exhibited strong regional spatial patterns and, in some cases, temporal trends. The two tested mechanisms, the relaxation of temperature restriction and the increase in water demand, both showed clear spatial patterns. The relaxation due to temperature increases took place at higher latitudes, but the water-limiting mechanism increased in mid-latitude areas.

Supplementary Materials

The following supporting information can be downloaded at: https://www.mdpi.com/article/10.3390/meteorology1020015/s1. Table S1. Proportion of variation explained by tree regression.

Author Contributions

Conceptualization, J.G.N.I., P.A.C. and M.T.; methodology, J.G.N.I. and P.A.C.; data curation, M.H.C. and J.G.N.I.; writing—original draft preparation, J.G.N.I.; writing—review and editing, P.A.C., M.T. and M.H.C. All authors have read and agreed to the published version of the manuscript.

Funding

This research was funded by FONCyT and UBA through PDE_8_2019.

Acknowledgments

We would like to thank A. Soriano and R.J.C. Leon (founder fathers of IFEVA).

Conflicts of Interest

The authors declare no conflict of interest.

References

  1. Morgan, J.A.; Parton, W.; Derner, J.D.; Gilmanov, T.G.; Smith, D.P. Importance of early season conditions and grazing on carbon dioxide fluxes in Colorado shortgrass steppe. Rangel. Ecol. Manag. 2016, 69, 342–350. [Google Scholar] [CrossRef]
  2. Polley, H.W.; Briske, D.D.; Morgan, J.A.; Wolter, K.; Bailey, D.W.; Brown, J.R. Climate change and North American rangelands: Trends, projections, and implications. Rangel. Ecol. Manag. 2013, 66, 493–511. [Google Scholar] [CrossRef]
  3. Huxman, T.E.; Smith, M.D.; Fay, P.A.; Knapp, A.K.; Shaw, M.R.; Loik, M.E.; Smith, S.D.; Tissue, D.T.; Zak, J.C.; Weltzin, J.F.; et al. Convergence across biomes to a common rain-use ef ciency. Nature 2004, 429, 651–654. [Google Scholar] [CrossRef]
  4. Sala, O.E.; Gherardi, L.A.; Reichmann, L.; Jobbágy, E.; Peters, D. Legacies of precipitation fluctuations on primary production: Theory and data synthesis. Philos. Trans. R. Soc. Lond. B. Biol. Sci. 2012, 367, 3135–3144. [Google Scholar] [CrossRef] [Green Version]
  5. Irisarri, J.G.N.; Derner, J.D.; Porensky, L.M.; Augustine, D.J.; Reeves, J.L.; Mueller, K.E. Grazing intensity differentially regulates ANPP response to precipitation in North American semiarid grasslands. Ecol. Appl. 2016, 26, 1370–1380. [Google Scholar] [CrossRef] [Green Version]
  6. Lauenroth, W.K.; Sala, O.E. Long-term forage production of North American shortgrass steppe. Ecol. Appl. 1992, 2, 397–403. [Google Scholar] [CrossRef] [Green Version]
  7. Durante, M.; Piñeiro, G.; Irisarri, J.G.N.; Oesterheld, M. Primary Production of Lowland Natural Grasslands and Upland Sown Pastures Across a Narrow Climatic Gradient. Ecosystems 2017, 20, 543–552. [Google Scholar] [CrossRef]
  8. Knapp, A.K.; Ciais, P.; Smith, M.D. Tansley insight Reconciling inconsistencies in precipitation—Productivity relationships: Implications for climate change. New Phytol. 2017, 241, 41–47. [Google Scholar] [CrossRef] [Green Version]
  9. Verón, S.R.; Paruelo, J.M. Desertification alters the response of vegetation to changes in precipitation. J. Appl. Ecol. 2010, 47, 1233–1241. [Google Scholar] [CrossRef] [Green Version]
  10. Augustine, D.J.; Blumenthal, D.M.; Springer, T.L.; Lecain, D.R.; Gunter, S.A.; Derner, J.D. Elevated CO2 induces substantial and persistent declines in forage quality irrespective of warming in mixedgrass prairie. Ecol. Appl. 2018, 28, 721–735. [Google Scholar] [CrossRef]
  11. Gaitán, J.J.; Bran, D.; Oliva, G.; Maestre, F.T.; Aguiar, M.R.; Jobbágy, E.; Buono, G.; Ferrante, D.; Nakamatsu, V.; Ciari, G.; et al. Plant species richness and shrub cover attenuate drought effects on ecosystem functioning across Patagonian rangelands. Biol. Lett. 2014, 10, 20140673. [Google Scholar] [CrossRef] [Green Version]
  12. Maestre, F.T.; Eldridge, D.J.; Soliveres, S.; Kéfi, S.; Delgado-Baquerizo, M.; Bowker, M.A.; García-Palacios, P.; Gaitán, J.; Gallardo, A.; Lázaro, R.; et al. Structure and Functioning of Dryland Ecosystems in a Changing World. Annu. Rev. Ecol. Evol. Syst. 2016, 47, 215–237. [Google Scholar] [CrossRef] [Green Version]
  13. Chapin, F.S.I.; Matson, P.A.; Vitousek, P.M. Principles of Terrestrial Ecosystem Ecology, 2nd ed.; Chapin, F.S.I., Matson, P.A., Vitousek, P.M., Eds.; Springer: New York, NY, USA, 2011; ISBN 9781441995032. [Google Scholar]
  14. Monteith, J.L. Climate and the efficiency of crop production in Britain. Philos. Trans. R. Soc. London B Biol. Sci. 1977, 281, 277–294. [Google Scholar]
  15. Irisarri, J.G.N.; Oesterheld, M.; Paruelo, J.M.; Texeira, M.A. Patterns and controls of above-ground net primary production in meadows of Patagonia. A remote sensing approach. J. Veg. Sci. 2011, 23, 114–126. [Google Scholar] [CrossRef]
  16. Bandieri, L.M.; Fernández, R.J.; Bisigato, A.J. Risks of Neglecting Phenology When Assessing Climatic Controls of Primary Production. Ecosystems 2020, 23, 164–174. [Google Scholar] [CrossRef]
  17. Paruelo, J.M.; Jobbagy, E.G.; Sala, O.E. Current distribution of ecosystem functional types in temperate South America. Ecosystems 2001, 4, 683–698. [Google Scholar] [CrossRef]
  18. Billings, W.D.; Mooney, H.A. The ecology of artic and alpine plants. Biol. Rev. 1968, 43, 481–529. [Google Scholar] [CrossRef]
  19. Jobbágy, E.G.; Sala, O.E.; Paruelo, J.M. Patterns and controls of primary production in the Patagonian steppe: A remote sensing approach. Ecology 2002, 83, 307–319. [Google Scholar] [CrossRef] [Green Version]
  20. Reeves, J.L.; Derner, J.D.; Sanderson, M.A.; Hendrickson, J.R.; Kronberg, S.L.; Petersen, M.K.; Vermeire, L.T. Seasonal weather influences on yearling beef steer production in C3-dominated Northern Great Plains rangeland. Agric. Ecosyst. Environ. 2014, 183, 110–117. [Google Scholar] [CrossRef]
  21. Texeira, M.; Paruelo, J.M.; Jobbagy, E. How do forage availability and climate control sheep reproductive performance?: An analysis based on artificial neural networks and remotely sensed data. Ecol. Modell. 2008, 217, 197–206. [Google Scholar] [CrossRef]
  22. Pettorelli, N.; Gaillard, J.M.; Mysterud, A.; Duncan, P.; Stenseth, N.C.; Delorme, D.; Van Laere, G.; Toi, C.; Van Laere, G.; Toïgo, C.; et al. Using a proxy of plant productivity (NDVI) to find key periods for animal performance: The case of roe deer. Oikos 2006, 112, 565–572. [Google Scholar] [CrossRef]
  23. Pettorelli, N.; Weladji, R.B.; Holand, O.; Mysterud, A.; Breie, H.; Stenseth, N.C. The relative role of winter and spring conditions: Linking climate and landscape-scale plant phenology to alpine reindeer body mass. Biol. Lett. 2005, 1, 24–26. [Google Scholar] [CrossRef] [Green Version]
  24. Alcaraz, D.; Paruelo, J.; Cabello, J. Identification of current ecosystem functional types in the Iberian Peninsula. Glob. Ecol. Biogeogr. 2006, 15, 200–212. [Google Scholar] [CrossRef]
  25. Paruelo, J.M.; Jobbagy, E.G.; Sala, O.E.; Lauenroth, W.K.; Burke, I.C. Functional and structural convergence of temperate grassland and shrubland ecosystems. Ecol. Appl. 1998, 8, 194–206. [Google Scholar] [CrossRef]
  26. Wang, H.; Liu, H.; Cao, G.; Ma, Z.; Li, Y.; Zhang, F.; Zhao, X.; Zhao, X.; Jiang, L.; Sanders, N.J.; et al. Alpine grassland plants grow earlier and faster but biomass remains unchanged over 35 years of climate change. Ecol. Lett. 2020, 23, 701–710. [Google Scholar] [CrossRef] [PubMed] [Green Version]
  27. Crego, R.D.; Didier, K.A.; Nielsen, C.K. Modeling meadow distribution for conservation action in arid and semi-arid Patagonia, Argentina. J. Arid Environ. 2014, 102, 68–75. [Google Scholar] [CrossRef]
  28. Golluscio, R.; Paruelo, J.; Deregibus, A. Sustainability and range management in the Patagonian steppes. Ecol. Austral 1998, 8, 265–284. [Google Scholar]
  29. Gaitán, J.J.; López, C.R.; Bran, D.E. Vegetation composition and its relationship with the environment in mallines of north Patagonia, Argentina. Wetl. Ecol. Manag. 2011, 19, 121–130. [Google Scholar] [CrossRef]
  30. Collantes, M.B.; Anchorena, J.; Stoffella, S.; Escartín, C.; Rauber, R. Wetlands of the magellanic steppe (Tierra del Fuego, Argentina). Folia Geobot. 2009, 44, 227–245. [Google Scholar] [CrossRef]
  31. Chimner, R.A.; Bonvissuto, G.L.; Victoria Cremona, M.; Gaitan, J.J.; López, C.R.; Cremona, M.V.; Gaitan, J.J.; Lopez, C.R. Ecohydrological conditions of wetlands along a precipitation gradient in Patagonia, Argentina. Ecol. Austral 2011, 21, 329–337. [Google Scholar]
  32. Enriquez, A.S.; Chimner, R.A.; Cremona, M.V.; Diehl, P.; Bonvissuto, G.L. Grazing intensity levels influence C reservoirs of wet and mesic meadows along a precipitation gradient in Northern Patagonia. Wetl. Ecol. Manag. 2015, 23, 439–451. [Google Scholar] [CrossRef]
  33. Texeira, M.; Baldi, G.; Paruelo, J. An exploration of direct and indirect drivers of herbivore reproductive performance in arid and semi arid rangelands by means of structural equation models. J. Arid Environ. 2012, 81, 26–34. [Google Scholar] [CrossRef]
  34. Cipriotti, P.A.; Collantes, M.B.; Rauber, R.B.; Braun, K.; Escartín, C. Inter-Annual and Seasonal Variation of ANPP and Leaf Nutrient Concentration in Cold-Temperate Wetlands of Tierra del Fuego. Wetlands 2018, 38, 37–49. [Google Scholar] [CrossRef]
  35. Buono, G.; Oesterheld, M.; Nakamatsu, V.; Paruelo, J.M. Spatial and temporal variation of primary production of Patagonian wet meadows. J. Arid Environ. 2010, 74, 1257–1261. [Google Scholar] [CrossRef]
  36. Paruelo, J.M.; Golluscio, R.A.; Guerschman, J.P. Regional scale relationships between ecosystem structure and functioning: The case of the Patagonian steppes. Glob. Ecol. Biogeogr. 2004, 13, 385–395. [Google Scholar] [CrossRef]
  37. García Martínez, G.C.; Ciari, G.; Gaitan, J.; Caruso, C.; Nagahama, N.; Opazo, W.; Nakamatsu, V.; Lloyd, C.; Cotut, C.; Irisarri, G.; et al. Analysis of the evolution of climate and natural grasslands in northwest Chubut province, Argentina, between 2000 and 2014: Identification of variables associated with livestock decrease in the region. AgriScientia 2017, 34, 59–69. [Google Scholar] [CrossRef] [Green Version]
  38. Paruelo, J.M.; Beltrán, A.; Jobbágy, E.; Sala, O.E.; Golluscio, R.A. The climate of Patagonia: General patterns and controls on biotic processes. Ecol. Austral 1998, 8, 85–101. [Google Scholar]
  39. Oliva, G.; Gaitan, J.; Ferrante, D. Humans Cause Deserts: Evidence of Irreversible Changes in Argentinian Patagonia Rangelands. In The End of Desertification? Springer: Berlin/Heidelberg, Germany, 2016; pp. 363–386. ISBN 978-3-642-16013-4. [Google Scholar]
  40. Jobbágy, E.G.; Paruelo, J.M.; León, R.J.C. Estimación del régimen de precipitación a partir de la distancia a la cordillera en el noroeste de la Patagonia. Ecol. Austral 1995, 5, 47–53. [Google Scholar]
  41. Soriano, A. Los distritos florísticos de la provincia patagónica. Rev. Investig. Agrícolas 1956, 10, 323–347. [Google Scholar]
  42. León, R.J.C.; Bran, D.E.; Collantes, M.B.; Paruelo, J.M.; Soriano, A. grandes unidades de vegetación de la Patagonia extra andina. Ecol. Austral 1998, 8, 125–144. [Google Scholar]
  43. Boelcke, O. Comunidades herbaceas del norte de Patagonia y sus relaciones con la ganaderia. Rev. Investig. Agric. 1957, 11, 5–98. [Google Scholar]
  44. Mazzoni, E.; Rabassa, J. Types and internal hydro-geomorphologic variability of mallines (wet-meadows) of Patagonia: Emphasis on volcanic plateaus. J. S. Am. Earth Sci. 2013, 46, 170–182. [Google Scholar] [CrossRef]
  45. Easdale, M.; Gaitán, J. Relación entre la superficie y clase de mallines y la composición de la estructura ganadera en establecimientos del noroeste de la Patagonia. Rev. Argentina Prod. Anim. 2013, 30, 69–80. [Google Scholar]
  46. Abatzoglou, J.T.; Dobrowski, S.Z.; Parks, S.A.; Hegewisch, K.C. TerraClimate, a high-resolution global dataset of monthly climate and climatic water balance from 1958–2015. Sci. Data 2018, 5, 170191. [Google Scholar] [CrossRef] [PubMed] [Green Version]
  47. Muñoz Sabater, J. ERA5-Land Monthly Averaged Data from 1981 to Present. Available online: https://cds.climate.copernicus.eu/cdsapp#!/dataset/reanalysis-era5-land-monthly-means?tab=overview (accessed on 1 February 2022).
  48. Gorelick, N.; Hancher, M.; Dixon, M.; Ilyushchenko, S.; Thau, D.; Moore, R. Google Earth Engine: Planetary-scale geospatial analysis for everyone. Remote Sens. Environ. 2017, 202, 18–27. [Google Scholar] [CrossRef]
  49. Pinheiro, J.; Bates, D.; DebRoy, S.; Sarkar, D. R. Core Team. Linear and Non-linear Mixed Effects Models, R Package Version 3.1-108; R Package Vignette: Madison, WI, USA, 2013; pp. 1–108. Available online: https://rdrr.io/cran/nlme/ (accessed on 1 February 2022).
  50. Therneau, T.; Atkinson, B. Rpart: Recursive Partitioning and Regression Trees, R package version 4.1-15 2019. Available online: https://rdrr.io/cran/rpart/ (accessed on 1 February 2022).
  51. Breiman, L.; Friedman, J.H.; Olshen, R.A.; Stone, C.J. Classification and Regression Trees; Taylor & Francis: Boca Raton, FL, USA, 1984; ISBN 9781351460491. [Google Scholar]
  52. Posse, G.; Anchorena, J.; Collantes, M.B. Seasonal diets of sheep in the steppe region of Tierra del Fuego, Argentina. J. Range Manag. 1996, 49, 24–30. [Google Scholar] [CrossRef]
  53. Paruelo, J.M.; Aguiar, M.R. Impacto humano sobre los ecosistemas: El caso de la desertificación. Cienc. Hoy 2003, 13, 48–59. [Google Scholar]
  54. Aragón, R.; Oesterheld, M.; Irisarri, G.; Texeira, M. Stability of ecosystem functioning and diversity of grasslands at the landscape scale. Landsc. Ecol. 2011, 26, 1011–1022. [Google Scholar] [CrossRef]
  55. Masson-Delmotte, V.; Zhai, P.; Pörtner, H.-O.; Roberts, D.; Skea, J.; Shukla, P.R.; Pirani, A.; Moufouma-Okia, W.; Péan, C.; Pidcock, R.; et al. Global Warming of 1.5 °C—An IPCC Special Report on the Impacts of Global Warming of 1.5 °C above Pre-Industrial Levels and Related Global Greenhouse Gas Emission Pathways, in the Context of Strengthening the Global Response to the Threat of Climate Change, Sustainable Development, and Efforts to Eradicate Poverty. Available online: https://www.ipcc.ch/sr15/ (accessed on 10 February 2022).
  56. Jia, G.; Shevliakova, E.; Artaxo, P.; De Noblet-Ducoudré, N.; Houghton, R.; Anderegg, W.; Bernier, P.; Carlo Espinoza, J.; Semenov, S.; Xu, X.; et al. Climate Change and Land—An IPCC Special Report on Climate Change, Desertification, Land Degradation, Sustainable Land Management, Food Security, and Greenhouse Gas Gluxes in Terrestrial Ecosystems. Available online: https://www.ipcc.ch/srccl/ (accessed on 10 February 2022).
  57. Maestre, F.T.; Quero, J.L.; Gotelli, N.J.; Escudero, A.; Ochoa, V.; Delgado-baquerizo, M.; García-gómez, M.; Bowker, M.A.; Soliveres, S.; Escolar, C.; et al. Plant Species Richness and Ecosystems Multifunctionality in Global Drylands. Science 2012, 335, 2014–2017. [Google Scholar] [CrossRef] [Green Version]
  58. Oliva, G.; Paredes, P.; Ferrante, D.; Cepeda, C.; Rabinovich, J. Remotely sensed primary productivity shows that domestic and native herbivores combined are overgrazing Patagonia. J. Appl. Ecol. 2019, 56, 1575–1584. [Google Scholar] [CrossRef]
  59. Cipriotti, P.A.; Aguiar, M.R.; Wiegand, T.; Paruelo, J.M. Combined effects of grazing management and climate on semi-arid steppes: Hysteresis dynamics prevent recovery of degraded rangelands. J. Appl. Ecol. 2019, 56, 2155–2165. [Google Scholar] [CrossRef]
  60. Soriano, A.; Sala, O. Ecological strategies in a Patagonian steppe. Vegetatio 1983, 56, 9–15. [Google Scholar] [CrossRef]
  61. Oñatibia, G.R.; Aguiar, M.R. Grasses and grazers in arid rangelands: Impact of sheep management on forage and non-forage grass populations. J. Environ. Manag. 2019, 235, 42–50. [Google Scholar] [CrossRef] [PubMed]
  62. Wessels, K.J.; Prince, S.D.; Frost, P.E.; Van Zyl, D.; Zyl, V.D. Assessing the effects of human-induced land degradation in the former homelands of northern South Africa with a 1 km AVHRR NDVI time-series. Remote Sens. Environ. 2004, 91, 47–67. [Google Scholar] [CrossRef]
  63. Kaptué, A.T.; Prihodko, L.; Hanan, N.P.; Turner, B.L. On regreening and degradation in Sahelian watersheds. Proc. Natl. Acad. Sci. USA 2015, 112, 12133–12138. [Google Scholar] [CrossRef] [Green Version]
  64. Verón, S.R.; Blanco, L.J.; Texeira, M.A.; Irisarri, J.G.N.; Paruelo, J.M. Desertification and ecosystem services supply: The case of the Arid Chaco of South America. J. Arid Environ. 2018, 159, 66–74. [Google Scholar] [CrossRef]
  65. Texeira, M.; Veron, S.; Irisarri, G.; Oyarzabal, M.; Staiano, L.; Baeza, S.; Paruelo, J. Functional syndromes as indicators of ecosystem change in temperate grasslands. Ecol. Indic. 2019, 96, 600–610. [Google Scholar] [CrossRef]
  66. Irisarri, J.G.N.; Texeira, M.; Oesterheld, M.; Verón, S.R.; Nave, F.D.; Paruelo, J.M. Discriminating the biophysical signal from human-induced effects on long-term primary production dynamics. The case of Patagonia. Glob. Chang. Biol. 2021, 27, 4381–4391. [Google Scholar] [CrossRef]
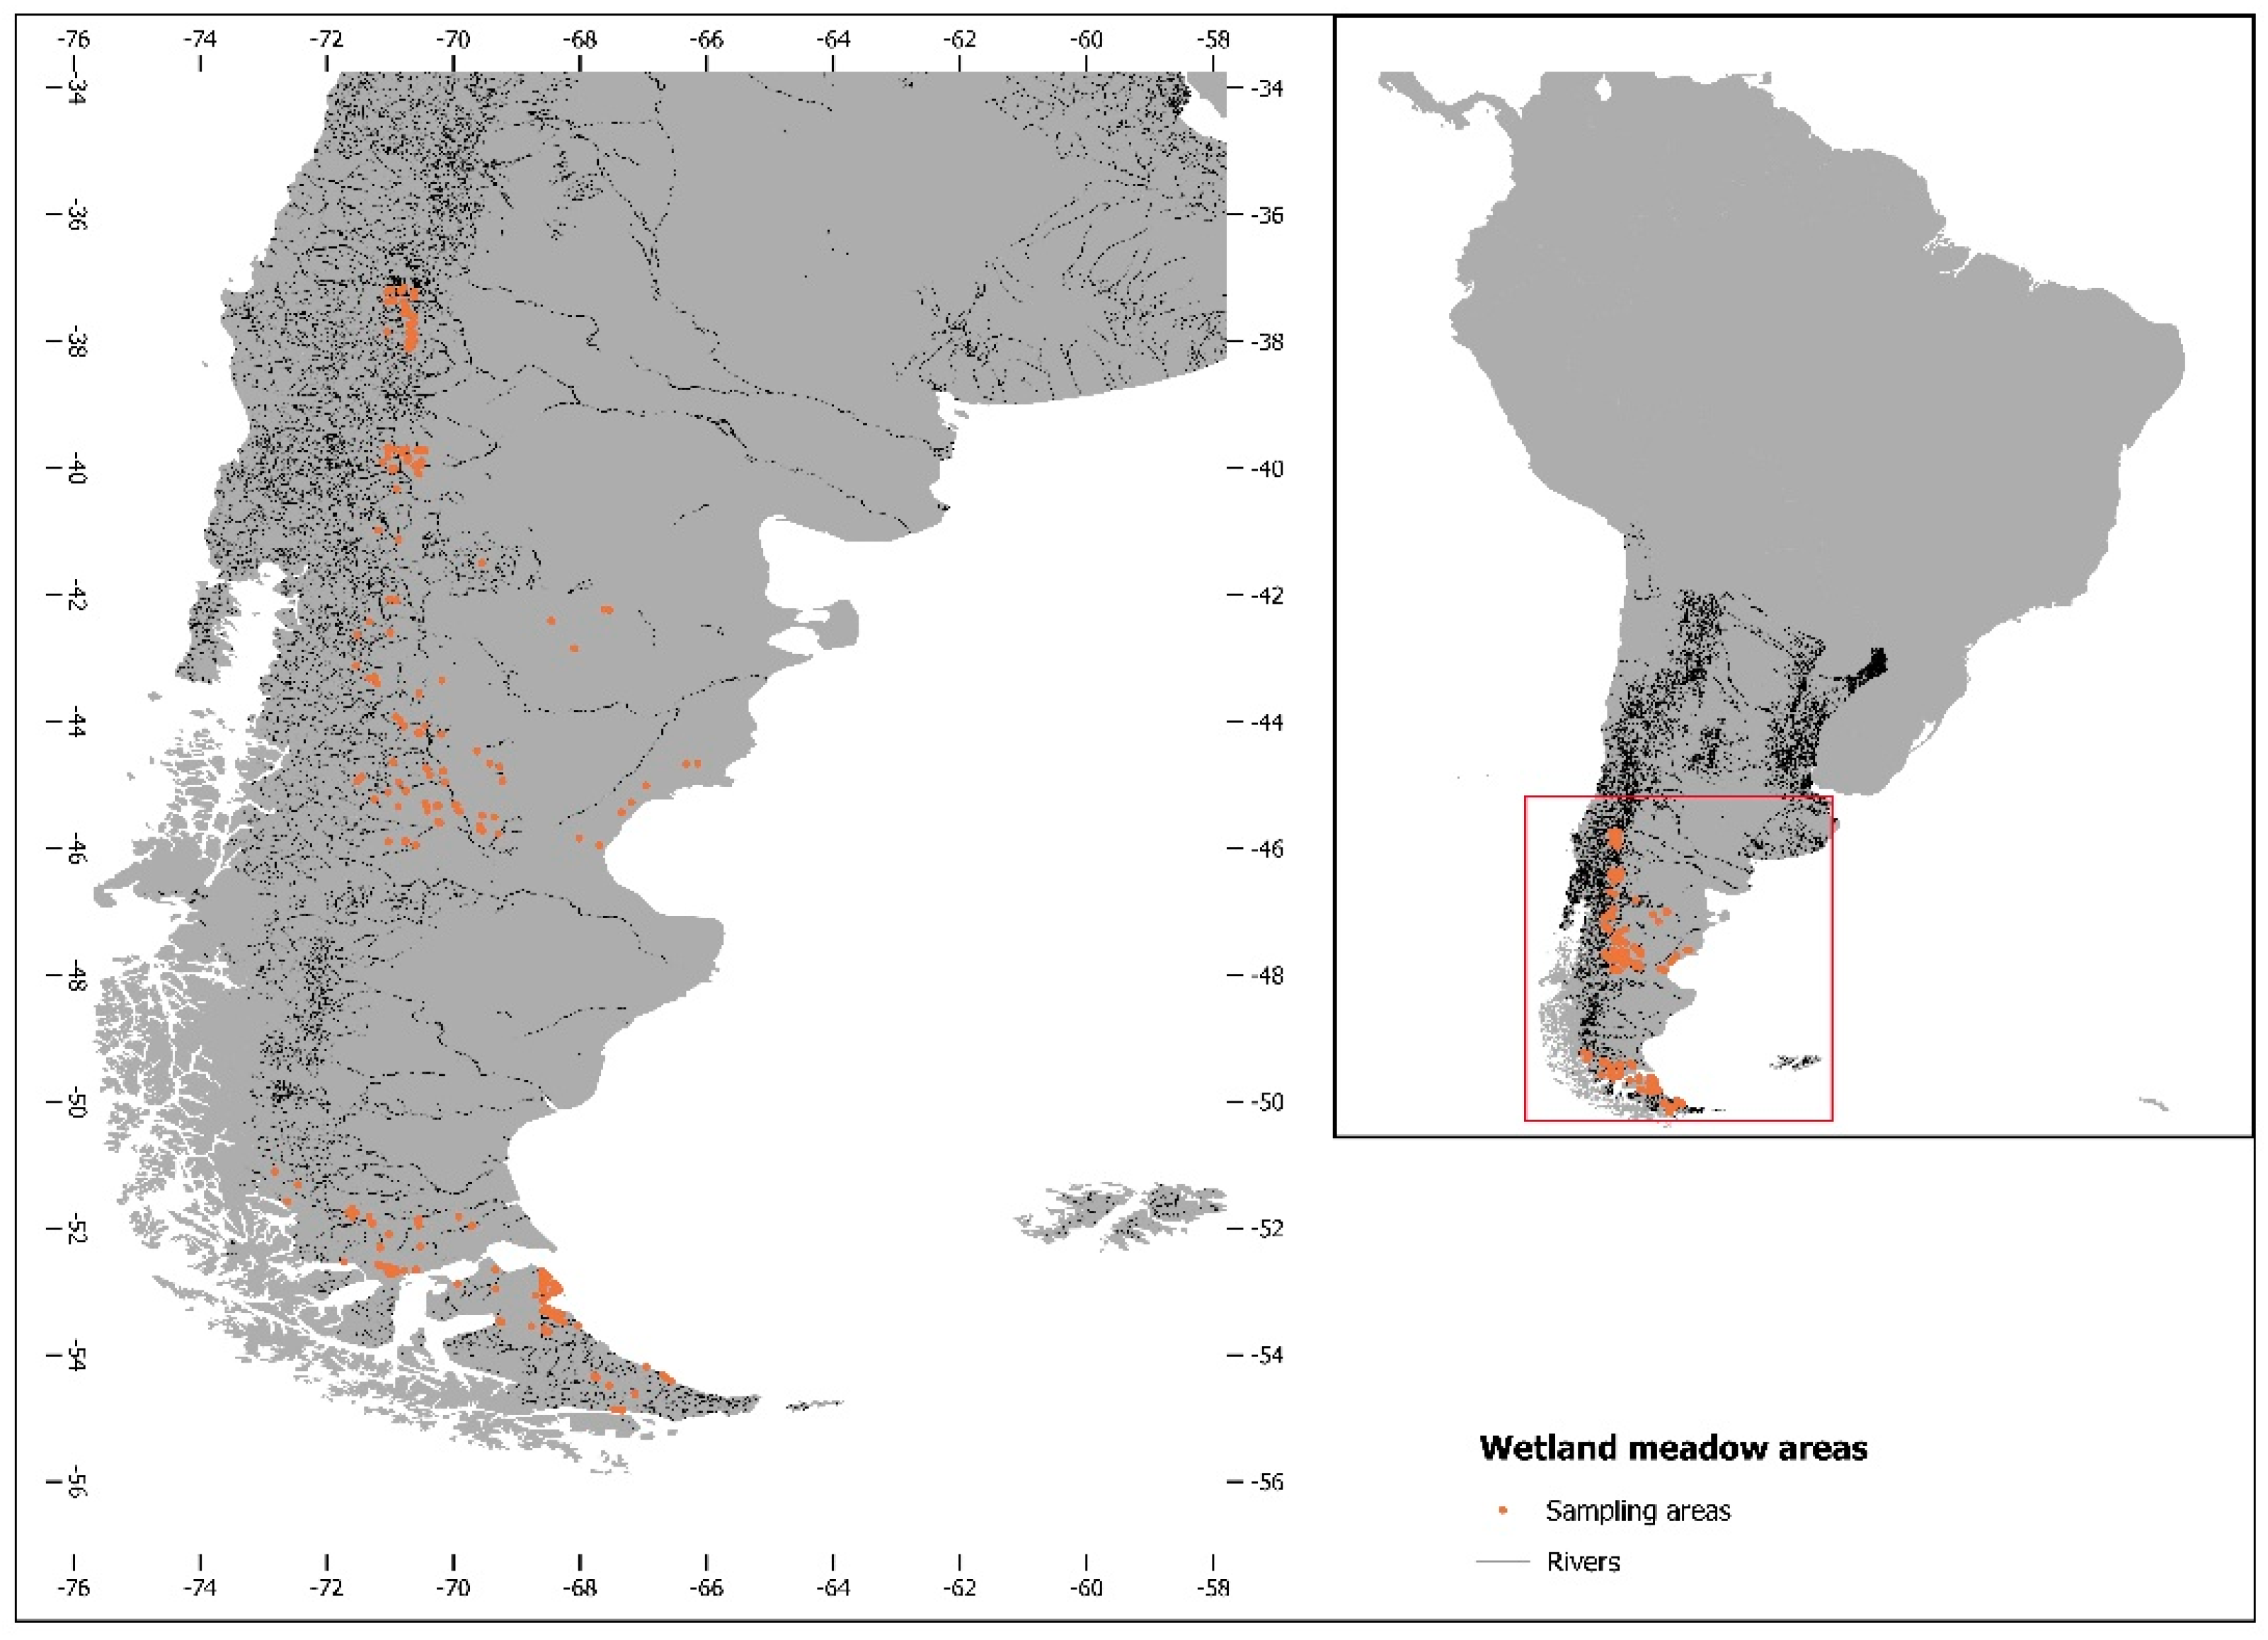
Figure 1. Left panel: Location of the wetland meadow areas in South America. Right panel: Wetland meadows area location across Patagonia. Each dot represents a sampling area of 5.3 ha. The total number of areas is 543.
Meteorology 01 00015 g001
Figure 2. Association between the slope of the seasonal pattern between aboveground net primary production (ANPP) and temperature across the geographical range for latitude (LAT) (left panel) and longitude (LONG) (right panel).
Meteorology 01 00015 g002
Figure 3. Left Panel: Geographic distribution of the average aboveground net primary production (ANPP) response to temperature for each wetland meadow area. Right panel: Regression tree analysis of the spatial variation for the ANPP response to temperature (slope of the linear regression analysis) with geographical coordinates. The dashed lines on the map from the left panel correspond to splits in the regression tree (right panel).
Meteorology 01 00015 g003
Figure 4. Left Panel: Geographic distribution of the wetland meadow areas describing the temporal trends of the slope of the linear regression between aboveground net primary production (ANPP) and temperature. Right panel: Regression tree analysis of the spatial variation in the temporal trend with geographical coordinates. The dashed lines on the map from the left panel correspond to splits in the regression tree (right panel). In the regression tree diagram (right panel), red boxes represent negative trends and blue boxes positive ones.
Meteorology 01 00015 g004
Publisher’s Note: MDPI stays neutral with regard to jurisdictional claims in published maps and institutional affiliations.