Article

Phase Behaviour of Multicomponent Mixtures of Hydrocarbons: MD Simulation

by
Alexander Sidorenkov
1 and
Viktor Ivanov
2,*
1
Faculty of Physics, Lomonosov Moscow State University, Moscow 119991, Russia
2
Institute of Physics, Martin Luther University, 06099 Halle (Saale), Germany
*
Author to whom correspondence should be addressed.
Methane 2025, 4(4), 24; https://doi.org/10.3390/methane4040024
Submission received: 5 August 2025 / Revised: 8 October 2025 / Accepted: 14 October 2025 / Published: 20 October 2025

Abstract

We perform a molecular dynamics simulation of a bulk eight-component hydrocarbon mixture that roughly represents a composition of hydrocarbon fluid in a volatile oil reservoir. For that goal, we have developed a method for building molecular models of hydrocarbon mixtures which can include various branched molecules. We have used self-periodical simulation boxes with different aspect ratios. Our main focus here is the phase behavior of a multicomponent mixture in the presence of gas–liquid interfaces of different shapes: spherical, cylindrical, and slab-like gas bubbles. We have developed a method for calculating properties of coexisting phases in molecular simulations of multicomponent systems. In particular, it allows us to analyze the local composition of the mixture and to calculate the molar densities of components in liquid and gas phases, and inside the interface layer between them. For the values of model parameters that we have used so far, the mixture is homogeneous at a high pressure and undergoes liquid–gas phase separation upon decreasing the pressure. We have kept the same temperature T = 375.15   K , the same composition and the same number of molecules in all systems and used several combinations of the simulation box size and shape to control the overall density, and therefore also the pressure, as well as the presence or absence of a liquid–gas interface and its shape. The gas bubble that appears in the system is mainly composed of methane. There is also a small number of ethane and butane molecules, a tiny number of hexane molecules, and no molecules of heavier components at all. In the liquid phase, all components are present. We also show that inside the gas–liquid interface layer, which is actually quite broad, the molar density of methane is also higher than that of other components and even reaches a maximum value in the middle of the interface. Ethane behaves similarly: its molar density also reaches a maximum inside the interface. The molar density of heavier components grows monotonically from the inner part of the interface towards its outer part and shows a very small (almost not visible) maximum at the outer side of the bubble.

1. Introduction

The growing interest in confined hydrocarbon (HC) mixtures is mainly caused by the importance of oil and gas stored in tight formations [1]. Hydrocarbon fossils are important resources for the energetic and chemical industries, and for the production of fertilizers. A reliable method of reservoir capacity estimation and production forecasting, which considers reservoirs with a large volume dedicated to nanopores, would be of great value. Despite a number of studies related to hydrocarbons’ interaction with porous media that are present, the development of such a method is far from over, since it has to cover many physical phenomena occurring at scales starting from the reservoir scale (hundreds of meters) down to nanometers. One of the difficulties is the investigation of processes in the nanoconfinement, since it is impossible to conduct a direct experiment using core sample from a reservoir. Nanoscale simulations and theoretical approaches look like a promising solution for the problem.
Confined fluids have properties that are different from the bulk [1,2,3,4]. Using modern “lab on a chip” devices, it was shown that confinement leads to a considerable shift in bubble and dew points of hydrocarbons: bubble point pressure is lower and dew point pressure is higher than in the bulk state [1,2]. Bao et al. [2] investigated propane in 88 nm depth silicon pores and concluded that phase behavior shift was caused by confinement (i.e., geometrical restriction) and was not attributed to pore wettability and roughness. It is worth emphasizing that such experiments usually targeted the investigation of fluid properties inside pores with macroscopic length (several millimeters). In the porous media of tight reservoirs, pore lengths are much smaller, and nanopores of interest, which participate in fluid production, are connected to larger pores.
In a real-world scenario, nanopores in tight reservoirs frequently consist of organic matter (kerogen) [5] and therefore are oil wet. In pores narrower than several nanometers, the effects of adsorption can play the main role in fluid behavior, since all volume of the pore would be filled with fluid molecules ordered in the adsorption layers [6,7]. This means that the presence of pores of different sizes can lead to the redistribution of fluid content in the porous media, and hence can change the phase behavior of a fluid. Therefore, one has to consider not only pore widths but also their volumes and interconnection. In a multicomponent fluid, behavior becomes even more complex. Competitive adsorption of different components leads to a considerable change in fluid properties not only in confinement, but also in the bulk volume that is connected to nanopores [3,8]. Of course, this effect strongly depends on the ratio of the volume of nanopores to the bulk volume. Furthermore, the phase behavior of bulk multicomponent mixtures in general is relatively unexplored [9] compared to single-component and binary mixtures. Even binary mixtures can have a rich variety of phase diagrams depending on the strengths of interactions between the components [10]. Fortunately, natural hydrocarbon mixtures have been well studied and usually have rather predictable phase behavior [11,12].
In the fluids confined on the nanoscale, traditional theories may become inaccurate. Apart from effects caused by fluid-wall interaction in nanoconfined systems, there are several phenomena attributed to the molecular structure of a fluid: At the molecular scale (up to several nanometers), there are phase behavior peculiarities (nanobubble or nanodroplet formation), fluid-wall adsorption and molecule layering; at the nanopore scale (up to tens of nanometers), there is a considerable change in phase behavior which can be caused by geometrical restrictions and the presence of a curved meniscus (which matches pore size) in a multiple-phase case; at the scale of a pore network (multiple of pore size), there are component redistribution effects and differences in the mobilities of phases, and at this scale, a crucial role is played by pore interconnections and their relative volumes. Effects on larger scales will depend on the rock type and its inhomogeneity. Therefore, it is not a simple task to perform a comprehensive study, which considers all effects simultaneously.
On the other hand, even in small systems without confinements, for example, in the computer simulation of a single-component fluid in bulk, performed in a simulation cell with periodic boundary conditions, one should be aware of strong finite size effects. Studies dedicated to the investigation of fluid phase behavior by means of molecular simulations show that the size of a system is one of the parameters which strongly influences the phase behavior of a fluid [13,14]. For small systems, the gas–liquid phase transition is smeared out, and the coexistence line is shifted. Depending on the system size and composition (relative volumes of phases), phase interface in a finite system can have different shapes: spherical, cylindrical, or flat [14,15,16]. For the curved interfaces (nanobubbles and nanodroplets), the surface tension has a strong influence on the behavior of a nanoscale system since the system is small, and the curvature is extremely high. Some studies avoid direct simulation of phase interfaces to make results more clear [3].
In this article, we perform the molecular dynamics simulation of an eight-component hydrocarbon mixture in bulk, focusing on the gas–liquid phase coexistence and redistribution of the mixture components between the gas and liquid phases and the interface layer. The mixture composition roughly represents a composition of hydrocarbon fluid in a volatile oil reservoir. Simulations were carried out using self-periodical simulation boxes of different sizes and with different aspect ratios. We also investigate the influence of the shape of the gas–liquid interface (spherical, cylindrical, planar) on the phase behavior of a multicomponent mixture. We present a method for building molecular models of hydrocarbon mixtures which can include various branched molecules, and a method for calculating properties of coexisting phases in molecular simulations.
Our article is organized in a traditional way: we start with the description of our model and simulation method, proceed with the discussion of our results, and summarize them in the conclusion section. Technical details of our simulation algorithm and methods of analysis are described in the Appendices.

2. Model and Method

2.1. System Description

We perform molecular dynamics (MD) computer simulations of an eight-component hydrocarbon mixture at the constant temperature equal to T = 375.15   K and at different pressures. The molar composition of the mixture was the following: 30% methane, 10% ethane, 10% n-butane, 10% n-hexane, 10% n-octane, 10% C12, 10% C16, and 10% C24. This composition was chosen to represent a mixture which has similar in composition to volatile oil [12,17]. We have just taken one of the possible compositions of a volatile oil as an example and used it in all our simulated systems. We used branched molecules for higher-molecular-weight components C12, C16, and C24. Details on them are given below in Section 2.3.
We simulated the mixture with this constant composition and with the constant number of molecules equal to 48,000 in cuboid (rectangular parallelepiped) boxes with different volumes and aspect ratios. This size of system was large enough to reproduce the expected phenomena more or less reasonably, but at the same time it was small enough to allow for the reasonable equilibration of systems with many different sets of parameters within the available computer time. The number of component molecules in all our systems was 14,400 for methane and 4800 for each of the other seven components. With the volume and number of molecules, we controlled the average density of the systems, and, hence, the pressure. At high pressures, our system was in the one-phase state of a homogeneous liquid, while for small pressures, a phase separation into gas and liquid phases took place. Here, we make an important remark: all our systems have a very small size, as it is usual in computer simulations, so that we are dealing with “morphologies” (also called “structures” or “pseudophases” in the literature), but we will use the term “phases” for them for the sake of brevity.
Different aspect ratios (length-to-width ratio) allowed us to consider different shapes of interfaces between liquid and gas phases. All simulation runs can be split into four sets: (1) a two-phase system in a long simulation cell (aspect ratios were in the range of 13.6–7.2) with a plane interface; (2) a two-phase system in a cube-like cell (aspect ratios were in the range of 1.8–1.04) with a plane interface; (3) a one-phase or two-phase system in a cube-like cell (aspect ratios were in the range of 1.08–0.8) with a sphere-shaped interface; (4) a two-phase system in a flat-shaped cell with one dimension much less than the two others (aspect ratios were in the range of 7.875–4.875) with a cylindrical interface. All considered simulation cells had the smallest dimension size that was several times bigger than molecule sizes and interaction radii.
The full list of studied systems, indicating the simulation box size, the pressure and the shape of liquid–gas interface is presented in Table 1. The pressure is measured in the liquid phase (see details in Section 2.2 below). The long dash in the phase interface shape column means the absence of an interface, i.e., those systems were homogeneous liquids. The line “interface only” means that the gas bubble in that system was quite small, and a gas phase was actually only in the center of this bubble, and there was a broad interface layer with local density increasing smoothly from the center of the bubble towards its outer border with the density of the liquid phase (more details will be given below).

2.2. Model and Simulation Method

We use the united atom (UA) model as a lowest-level coarse-grained (CG) model. Each carbon atom in a hydrocarbon molecule has the maximum possible number of bonded hydrogen atoms depending on the number of bonds with other carbon atoms. Each carbon atom with its bonded hydrogen atoms forms a united atom and is considered as a spherical particle (or a bead). In our study, we used a force field based on the NERD force field and that adopted for branched molecules [18]. This force field describes hydrocarbon molecules composed of uncharged united atoms (beads) of the following seven types: CH4 for the methane molecule, CH3e for both beads in the ethane molecule, CH3 for the ends of linear hydrocarbon molecules, CH3s for the ends of branches in branched hydrocarbon molecules, and CH2, CH1, C for all other beads. For the representation of heavy fractions Cn with n = 12, 16, and 24, we used sets of randomly generated branched molecules (see Section 2.3 below). The details of the force field are provided in Appendix A.1. The task of choosing or even creating good force fields for the computer simulation of oils is very important but this was not our goal in this study. Most probably, there is no universal force field for oils, so that for each specific oil, a force field, e.g., the NERD force field, should be appropriately parameterized and validated. We have not considered in our simulation some specific system but rather an example of an eight-component mixture that is similar to a volatile oil. To the best of our knowledge, there are no experimental and no computer simulation studies on exactly this system, so no direct comparison of results can be performed now. We are sure that our force field is good enough for studying the liquid–gas separation in multicomponent hydrocarbon mixtures in finite size systems, including the composition of gas and liquid phases. An adjustment of force field parameters will not influence our main results on phase behavior.
Molecular dynamics simulations were carried out using GROMACS software [19,20]. Molecular systems were modeled in the canonical (NVT) ensemble using velocity-rescaling thermostats [21] for maintaining a constant temperature. We had 8 separate thermostats coupled to each component to avoid the temperature difference which can be caused by numerical errors. The leap-frog algorithm with a 1 fs time step was used as the integration method. Simulation cells had cuboid shapes and were self-periodic in all three directions. Scalar pressure values were calculated as an average of diagonal elements of the average pressure tensor calculated for a molecular system [21]. The averaging was conducted over time and over all particles (united atoms), presented in a system; therefore, the calculated pressure is a pressure of the dense phase (liquid), because it contains many more beads than the gas phase. We used double precision calculations (see Appendix A.2).
Our main focus in this study was on the liquid–gas phase coexistence in a specific eight-component fluid, specifically the composition of coexisting phases. Therefore, the kinetics (or scenario) of the phase separation process was not investigated here in detail, and we do not present any results and do not make any conclusions on that aspect. Of course, we have observed in our simulations processes of formation of a two-phase (inhomogeneous) configuration, e.g., a gas bubble in a liquid, from a homogeneous liquid upon decreasing pressure, as well as inverse processes of a gas bubble collapse upon increasing pressure, but we have not investigated them in detail (this was not our goal in this study). We have only used those processes for the preparation of appropriate initial starting configurations.
We have prepared the starting configurations for every system in the following way. We have equilibrated a homogeneous mixture at T = 375.15 K and high pressure in an elongated box with an aspect ratio larger than 7. We increased the box size, i.e., decreased the pressure, until phase separation took place. In an elongated box, the formation of a slab-like gas bubble with two plane interfaces to the liquid phase is favored by the periodic boundary conditions, so that it was not difficult to get such a configuration. Then, we deformed the simulation box towards the desired size and aspect ratio. For some values of box sizes, the two plane interfaces survived, while for other values, the thin gas film (slab-like bubble) collapsed to a cylindrical or a spherical bubble. Obviously, some configurations obtained in such a way are stable and some are metastable under given external conditions (temperature T, pressure P, density ρ ). Every system was simulated until it reached an equilibrium (or at least a quasi-equilibrium) state. Behind usual requirements of the absence of the drift of mean values in the time series of the energy, pressure, etc., the main criteria of reaching equilibrium were the homogeneous (molar) density profiles of all components (either in a homogeneous one-phase system or in each of the two phases in two-phase systems at coexistence). We have calculated the (molar) density profiles of all components in our systems using our specially developed method to analyze the local density of components in a multicomponent system (see Appendix C for details). However, the criteria mentioned above do not guarantee that the true equilibrium, that would correspond to the global minimum of free energy, has been reached in the system. It may be that we have just reached some stationary state which corresponds to some local free-energy minimum, and in this case, we are speaking about quasi-equilibrium.
It was shown in the literature that a spinodal decomposition during transition from a one-phase state (homogeneous mixture) to a two-phase state (a gas bubble reached on light components and the remaining liquid) is a very fast process which lasts for several picoseconds [15]. We suppose that our system undergoes this scenario, and it is realized by means of the diffusion of molecules. Interestingly, heavy molecules escaped from the gas phase quite fast and joined the liquid phase as soon as they reached it for the first time. This happened faster than the density profiles of light components became uniform. However, the diffusion of methane and ethane in the liquid phase was rather slow, and it required tens of nanoseconds to reach a uniform composition inside the dense phase and the proper volume of the gas phase.
Characteristic equilibration times were about 10 ns or longer. For some of the systems, it was a true equilibrium; for some it was a stationary metastable state (a quasi-equilibrium). For all systems, we have reached homogeneous local density profiles for all components, while the interface position has almost not changed. We do not know what the time of complete relaxation of metastable long-living states towards the true equilibrium would be, but this was also not our goal.
The final results were obtained by time averaging over 2 ns after the equilibrium was reached. This time was large enough to allow for local relaxation of molecules of all components inside both coexisting phases, but the gas–liquid interface has not moved, so that an averaging over configurations (i.e., microstates) could be performed for the analysis of the local density and composition (see Appendix C).

2.3. Molecular Model of Hydrocarbons

We developed a method for molecular dynamics simulation of a mixture with relatively large hydrocarbon molecules (up to 24 carbon atoms in this study). There are several publications of similar simulation approaches [22,23,24,25,26,27], which were created for molecular simulations of dense hydrocarbon mixtures (oil). In these methods, several particular molecules must be chosen for the representation of heavy fractions (up to asphaltenes with dozens of carbon molecules). The choice of particular types of heavy molecules was made to match desired values of experimentally measured properties with calculated values. The choice of these molecules is rather arbitrary though, and it requires having some predefined physical parameters of the fluid. There are two more weak points of such methods: (1) the choice of molecules for heavy fractions’ representation depends on the force field used in MD simulations; (2) a single conformation of large HC molecules will not represent adsorption properties of the represented fraction, since adsorption strength depends on a molecule’s shape. The first point leads to a situation when one can successfully build a molecular model of a mixture while using an inappropriate force field in simulations, thus resulting in a non-predictive model. The second point makes these approaches unreliable for the simulation of HC fluids in contact with porous media; therefore, they are useless for studies of nanoconfinement, where MD simulations can shed light on the underlying processes.
For our research (including future studies), we necessitate an approach which would allow us to build a molecular model using only very limited information about mixture composition. Our approach does not require other physical properties of a fluid and does not include an arbitrary choice of molecules’ conformations to represent fluid fractions. It requires only results of compositional analysis of a fluid, for example, results of chromatography, which is widely used for fluid characterization in oil and gas industry [28].
In the following subsections we describe our investigation of different molecular models of hydrocarbons. We would like to emphasize here that the following terminology is used in this article: by the term “configuration” we mean a microstate, i.e., coordinates of all beads in a system, and by the term “conformation” we mean the topology of a molecule, i.e., structural chain isomers. By different molecular models of hydrocarbons, we mean the structural isomerism in molecules with the same number of carbon atoms.

2.3.1. Linear Molecules

The most straightforward way to simulate different hydrocarbons is to take linear molecules with the desired number of carbon atoms in the chain. In the following subsection, we show that a molecular model of a hydrocarbon mixture, composed of linear molecules only, is not correct in the case of heavy molecules. It leads to an unsatisfactory result: the mixture composed of linear molecules forms crystallites (see Figure 1b). The initial state of this mixture at a high temperature and pressure ( T = 573.15 K, P = 18.7 MPa, ρ = 670 kg/m3) was uniform (Figure 1a); however, after relaxation at the desired conditions ( T = 375.15 K, P = 3.34 MPa, same density), long molecules aggregated into ordered structures. This phenomenon may happen in some sorts of oils and emerges in precipitations of paraffin [29]. However, since the composition of the considered mixture is close to that of volatile oil, the precipitation must not occur. Aggregation of long alkanes in crystal-like structures is a well-known effect in polymer physics. One of the methods to suppress the crystallization of macromolecules is to add branches to them [30].

2.3.2. One Branched Molecule for a Component

Since the use of linear alkanes yields an undesired molecular model of a hydrocarbon mixture, we attempted to select a branched molecule to represent one heavy component, so that molecules within each component had identical conformations. We made several MD simulations of a pure C24 component to test different molecules. Linear C24 molecules form a crystal-like state, while branched ones are in a liquid state under the same conditions ( T = 375.15 K, P = 30 MPa). However, single-component fluids composed of different C24 molecules have different densities (see Table 2).
It was unclear how to make the right choice of a particular conformation of heavy molecules without some extra information (density, for example). The modeling of a set of different conformations of molecules dedicated to a component looks like a more natural way of molecular simulation. A saturated hydrocarbon with 24 carbon atoms can have 14,490,245 constitutional isomers. Thus, the choice of one or even several molecules to represent this fraction is a simplification. Moreover, a molecule, chosen to represent a C24 component, can appear to have unnatural adsorption strength to some surfaces because of its shape. It could cause unrealistic results when the molecular adsorption of dense hydrocarbon mixtures is considered. We are aware of this risk since we are going to study adsorption in future studies.

2.3.3. Many Branched Molecules for a Component

We used a self-developed algorithm for the automatic generation of branched hydrocarbons for molecular simulations (see the next subsection for a detailed description). We represented C12, C16, and C24 fractions with randomly generated branched molecules with a respective number of carbon atoms. We used 600 different molecule conformations for each component. We tested different sets of random molecules. Simulations showed that all these sets had equal densities. So, we could conclude that 600 is enough to have results that are independent of a particular result of the random algorithm. The density of the pure C24 component consisting of random molecules is presented in Table 2. The mix of randomly branched molecules has a higher density than other branched molecules since randomly branched molecules are more compact due to the larger number of carbon atoms with three and four bonds.
Molecular masses of linear C12, C16, and C24 molecules are 170.34, 226.45, and 338.66 a.m.u., respectively. Average masses of randomly branched C12, C16, and C24 molecules were 170.18, 225.90, and 336.88 a.m.u., respectively, i.e., they are slightly smaller due to the presence of cycles. The numbers of different united atoms in sets of branched molecules are presented in Table 3.

2.3.4. Molecules Generation Algorithm

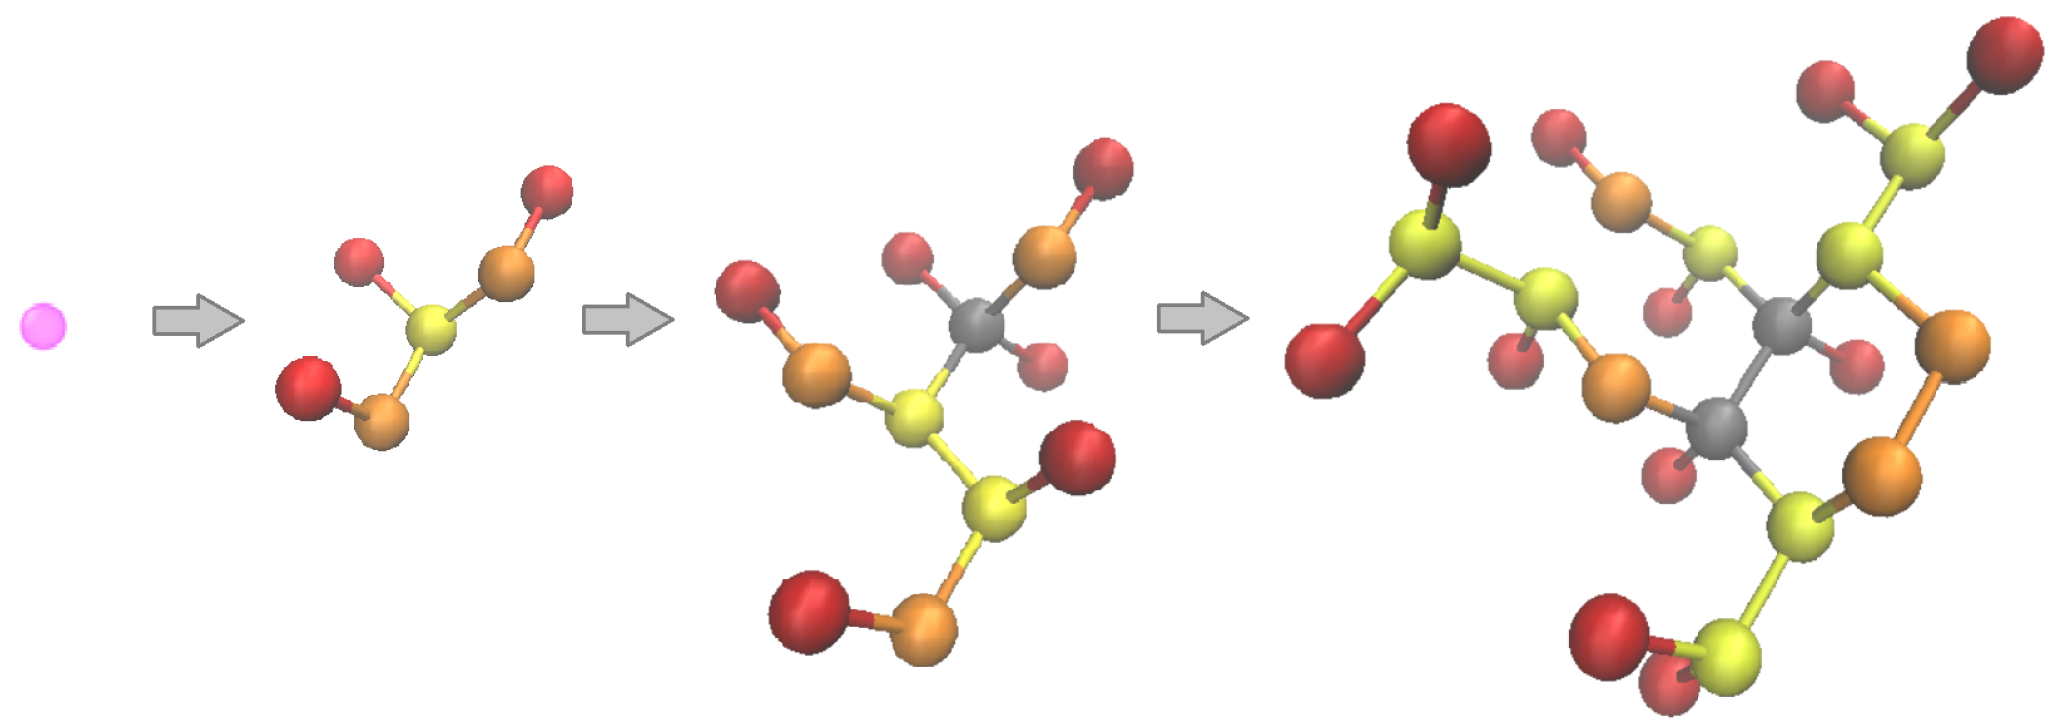
The molecule generation algorithm allows for the automatic creation of a large number of united atom models of saturated hydrocarbon molecules composed of UA beads. The generation process is iterative. The generation starts with one united atom particle (methane molecule). At each iteration, a C-C bond is added until the desired number of united atoms is reached. Such a step results in the addition of a carbon atom or the creation of a cycle. The scheme of the generation process is shown in Figure 2. Every united atom of a molecule being generated is placed in points of a diamond crystal lattice. It decreases the number of possible molecule types which can be generated. However, molecules generated in such a way have atom positions that are close to equilibrium, so there is no need to equilibrate intermediate states of molecules being generated. A detailed description is provided in Appendix B.

3. Simulation Results and Discussion

In this study, we are mainly interested in the phase behavior of the eight-component HC mixture at a constant temperature, in particular, the gas–liquid phase coexistence for different shapes of interfaces and in the redistribution of mixture components between the gas and liquid phases and the interface layer. Using our method for the calculation of local densities in many-component systems (see Appendix C for details), we calculated compositions and volumes of liquid and gas phases for different shapes of gas–liquid interfaces and different pressures.

3.1. Phase Diagram for a Mixture with a Spherical Gas–Liquid Interface

The considered multicomponent mixture is in a homogeneous liquid state at high pressures. It undergoes the liquid–gas phase separation transition as pressure decreases.
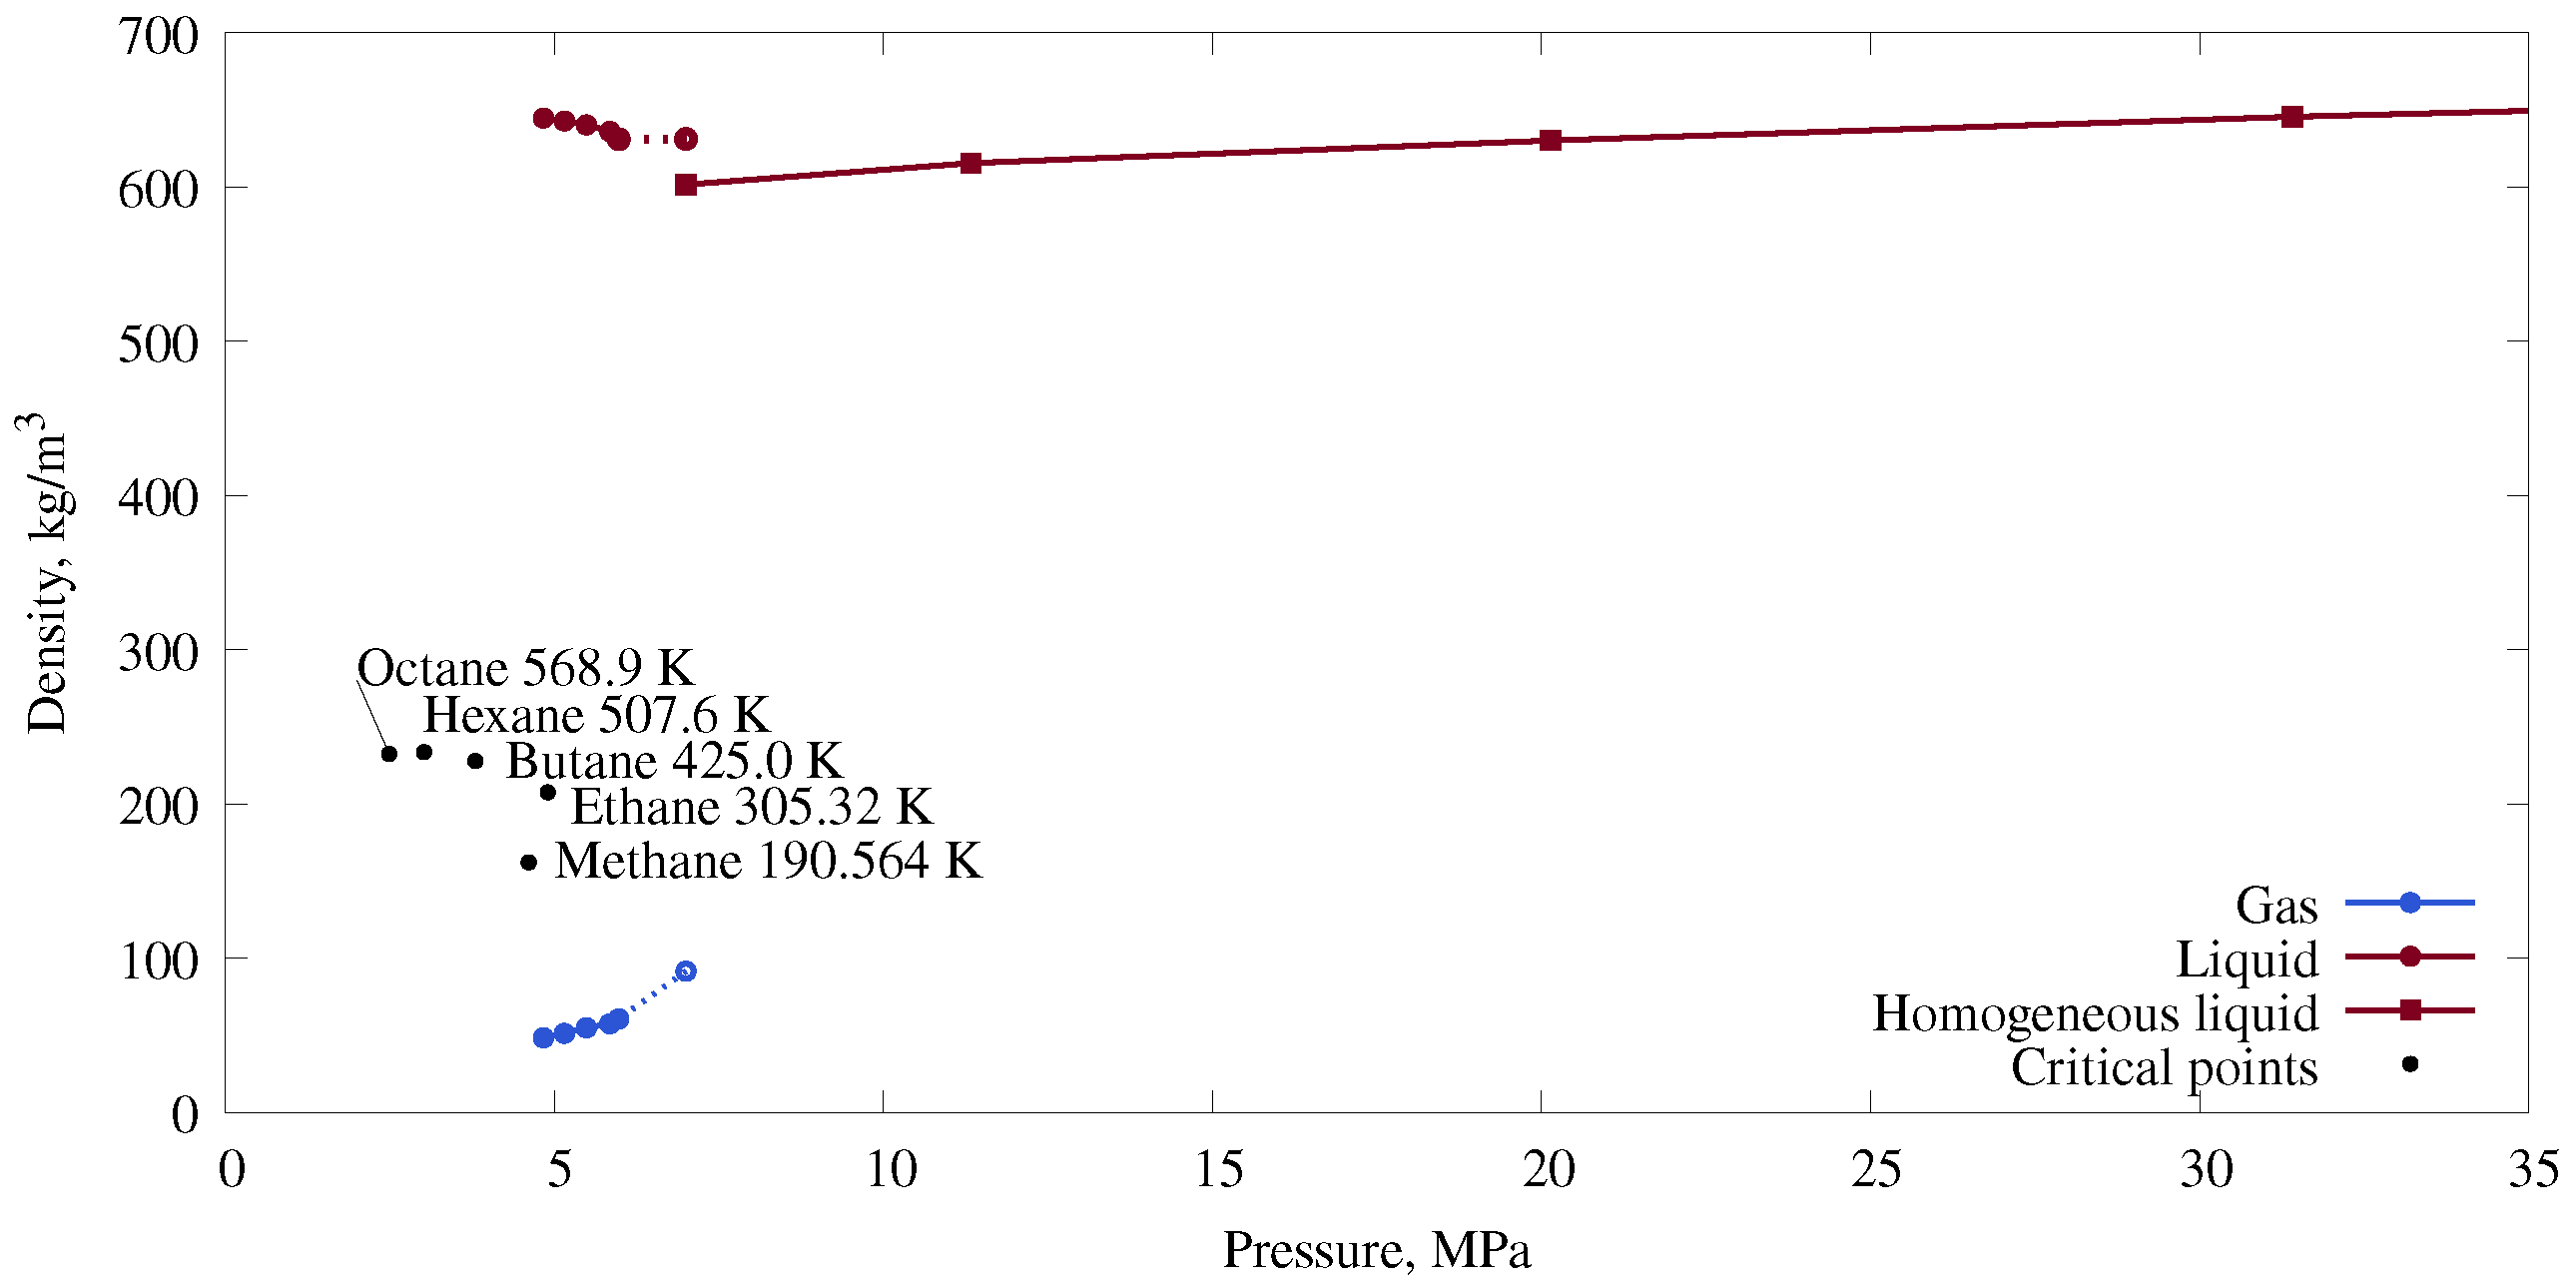
Let us consider first the systems where a spherical bubble of a low-density (i.e., gas) phase (primarily composed of methane and ethane) was formed at a certain pressure—bubble point, pressure P b u b b l e 7 MPa, average mass density, i.e., concentration, c b u b b l e 600 kg/m3 (Figure 3). This happened in almost cubic simulation cells with an aspect ratio of about 1.08–0.8. The average mass density inside the gas bubble was about 100 kg/m3 (open blue circle), and the average mass density inside the surrounding liquid phase was about 640 kg/m3 (open red circle). Red squares in Figure 3 represent the isotherm T = 375.15 K in the homogeneous liquid state, while filled red and blue circles show the liquid and the gas densities at coexistence for smaller pressures, i.e., for the systems with a smaller average density. From our simulation data we cannot, of course, reconstruct the whole phase diagram of the mixture, but this was also not our goal in this study. We will concentrate below on the comparison of phase diagrams in such a reduced form for systems with different shapes of gas–liquid interfaces and on the compositions of phases.
We have not investigated thermodynamic properties of the low-density phase separately from the coexisting liquid phase, so it can be in its supercritical state at high pressures. The temperature of the mixture, T = 375.15 K, is higher than the critical temperature for pure methane (190.564 K) and ethane (305.32 K) [31,32]; all other components have higher critical temperatures. The light components undergo liquid–gas phase transitions in pure states at 375.15 K at 1.59 MPa (butane), at 0.26 MPa (hexane), and at 0.05 MPa (octane) [32]. Other, more dense components have lower phase transition pressures.
We would like to remind readers here that these data were obtained in the course of (quasi-)equilibrium simulations starting from specially prepared configurations (the protocol for starting configurations is described in the Model Section above). We have also tried to get a spherical gas bubble in a cubic simulation box from a homogeneous liquid upon decreasing pressure, and to observe the collapse of a gas bubble in a cubic box upon increasing pressure. This took much more time and was less convenient for averaging over quasi-stable configurations. It is well known that classical MD simulations are not quite appropriate for the simulation of rare events—they may not happen at all [33]. A gas bubble nucleation is a rare event, and we observe it only when the energy barrier of the transition is low (when the system is far from equilibrium during pressure decrease). The inverse process of a gas bubble collapse is also quite slow. There are studies that discuss the high stability of nanobubbles [34,35]. In our protocol of obtaining the phase diagram from (quasi-)equilibrium simulations of pre-prepared configurations, we have used this fact to sample reasonable statistics for each of the studied systems.

3.2. Phase Diagram for Mixtures with Gas–Liquid Interfaces of Different Shapes

At pressures lower than the bubble point, when the fluid is in a two–phase state, a curved phase interface changes the properties of phases due to additional capillary pressure. According to Young–Laplace law, capillary pressure is higher in the case of a larger curvature of the phase interface. Actually, the Young–Laplace formula applies for macroscopic systems and is not necessarily valid for nanosized systems, but it was shown in the literature that the Laplace pressure differences can be predicted for drops as small as five molecular diameters [14]. The pressure difference is
Δ P = P i n s i d e P o u t s i d e = γ 1 R 1 + 1 R 2
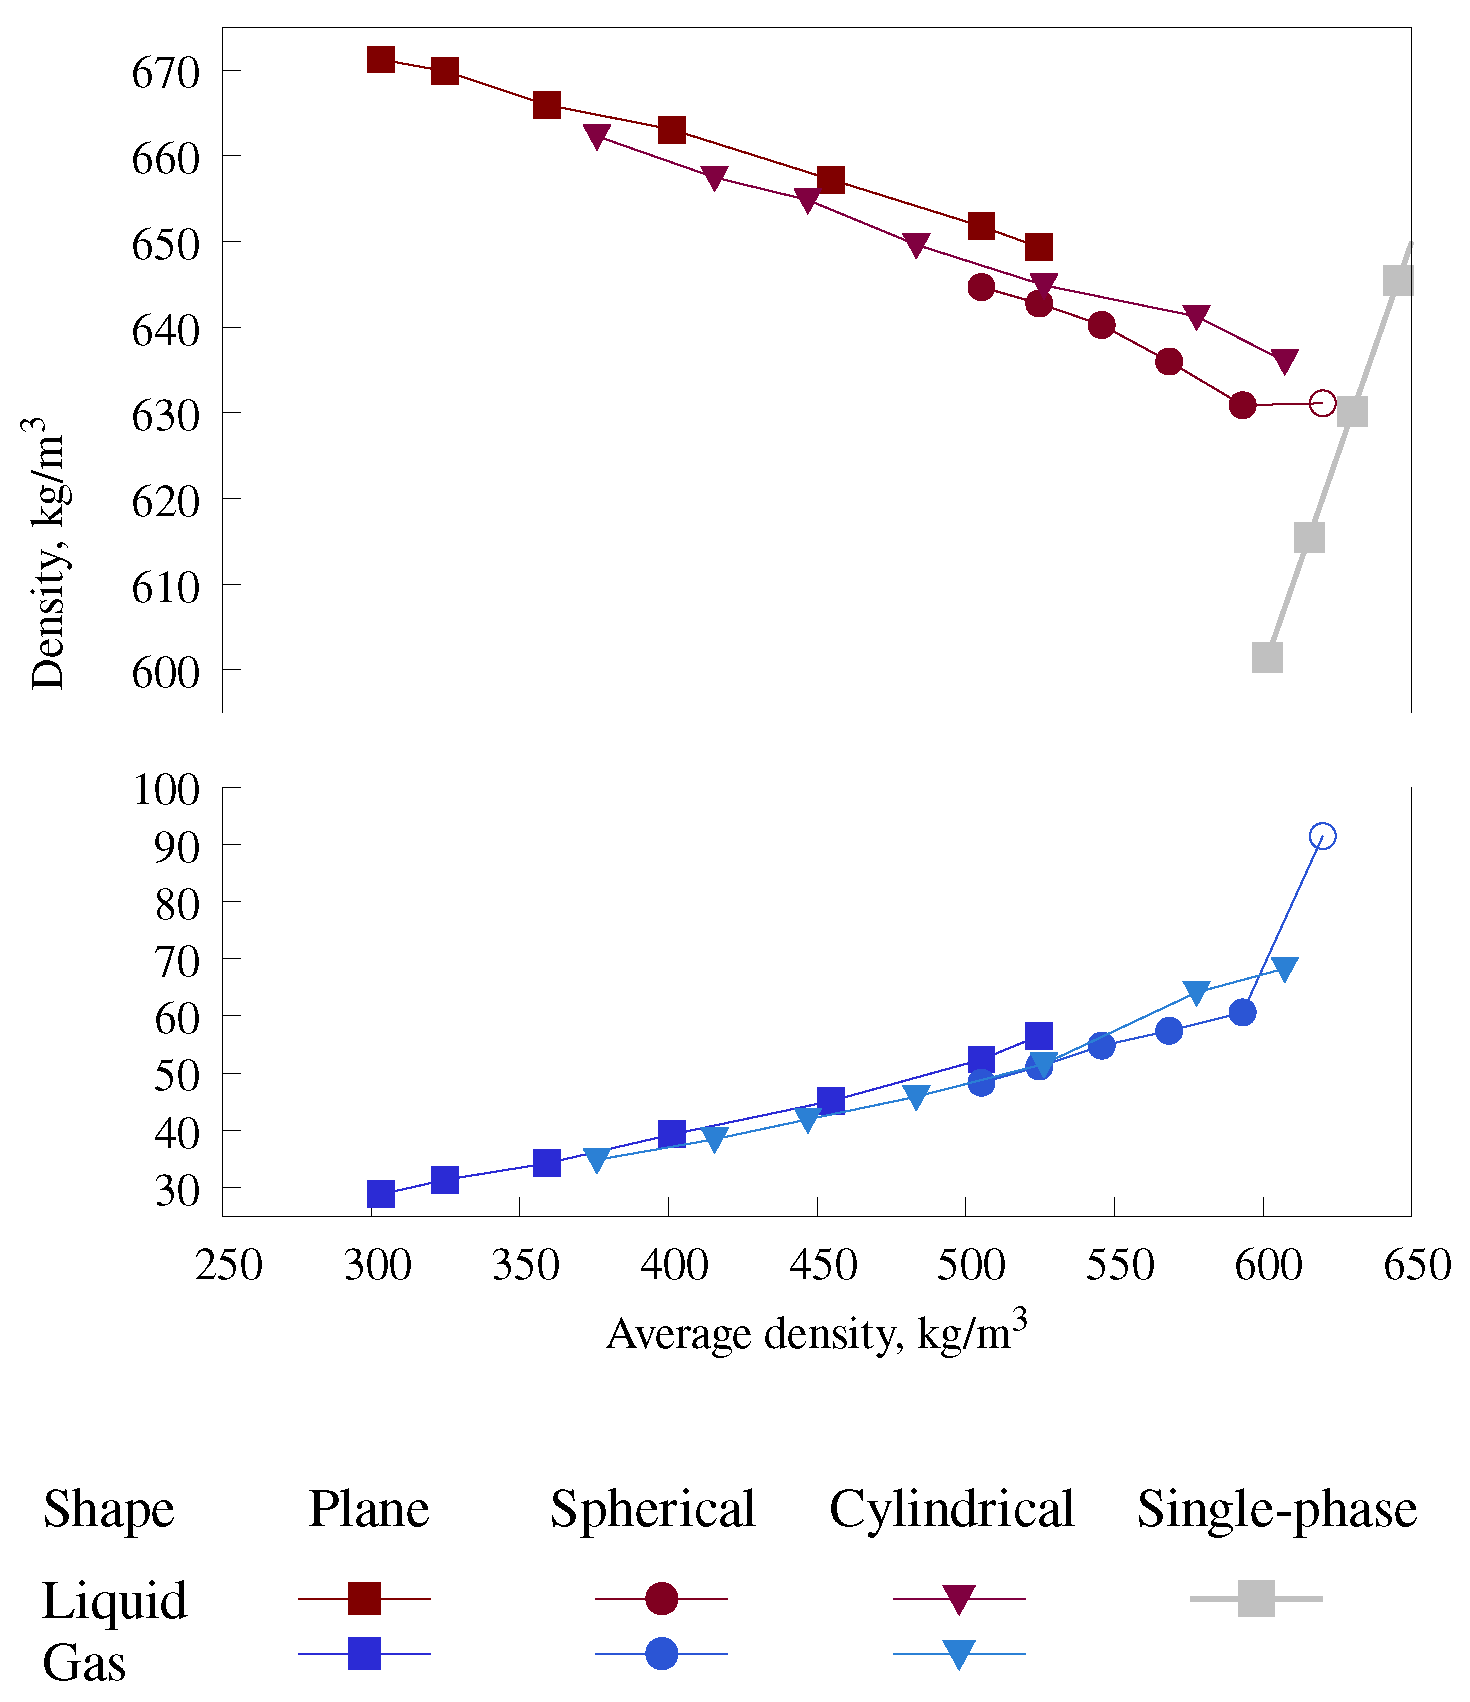
where R 1 and R 2 are principal radii of the interface curvature and γ is the surface tension. For nanosized gas bubbles, the curvature is extremely high, which leads to significant changes in the pressures of phases. Here, we compare simulation results obtained for different gas bubble shapes: flat, cylindrical, and spherical. A flat interface has no curvature, leading to zero capillary pressure. Curvature of cylindrical and spherical bubbles resulted in additional pressure inside the gas phase, i.e., negative additional pressure in the dense phase. Since the presented pressure value is the pressure in the liquid phase, we observe a shift in the bubble point to lower pressures for cylindrical and spherical gas bubbles, and therefore also a shift in the coexistence densities of the gas and liquid phases to lower pressures (Figure 4a) and a shift in the average density to lower pressures in the two–phase systems with cylindrical and spherical gas–liquid interfaces (Figure 4b).
Densities of the gas and liquid phases in Figure 4a are plotted against the pressure of the liquid phase, and this plot does not show differences in pressures of the two phases (at coexistence, the pressure of the liquid phase is equal to the pressure of the gas phase inside the bubble minus the Laplace pressure). The pressure in the liquid is the lowest for the spherical gas bubbles in comparison to cylindrical and flat interfaces. This effect is caused by capillary pressure, and it vanishes if the density of the gas and liquid phase is plotted vs. the average density of the system (Figure 5). The shape of bubbles was controlled by the aspect ratio of the simulation cells, so that the total number of molecules remained the same. Systems with equal average densities have equal volumes.
The minor discrepancy in phase densities for different interface shapes might be also related to different volumes occupied by the phase interface. We have checked whether this is really the case. The volume fractions of the gas and liquid phases and of the interface between them are presented in Figure 6. Systems with the same average density, i.e., of the same volume, but with different shapes of the simulation box and therefore also different shape of the gas–liquid interface, have the same volume fractions of gas and liquid phases.
Volumes of different phases and the volume of the interface were calculated according to the algorithm described in Appendix C. Since we know the volume and the shape of the gas bubble, its volume, and the volume of the interface, we can estimate the gas bubble radius r and the interface width d:
r f l a t = 1 2 v g a s X
r c y l i n d e r = 1 π v g a s X Z
r s p h e r e = 3 4 π v g a s X Y Z 3
d f l a t = r f l a t v s u r f v g a s = 1 2 v s u r f X
d c y l i n d e r = r c y l i n d e r 1 + v s u r f v g a s 1
d s p h e r e = r s p h e r e 1 + v s u r f v g a s 3 1
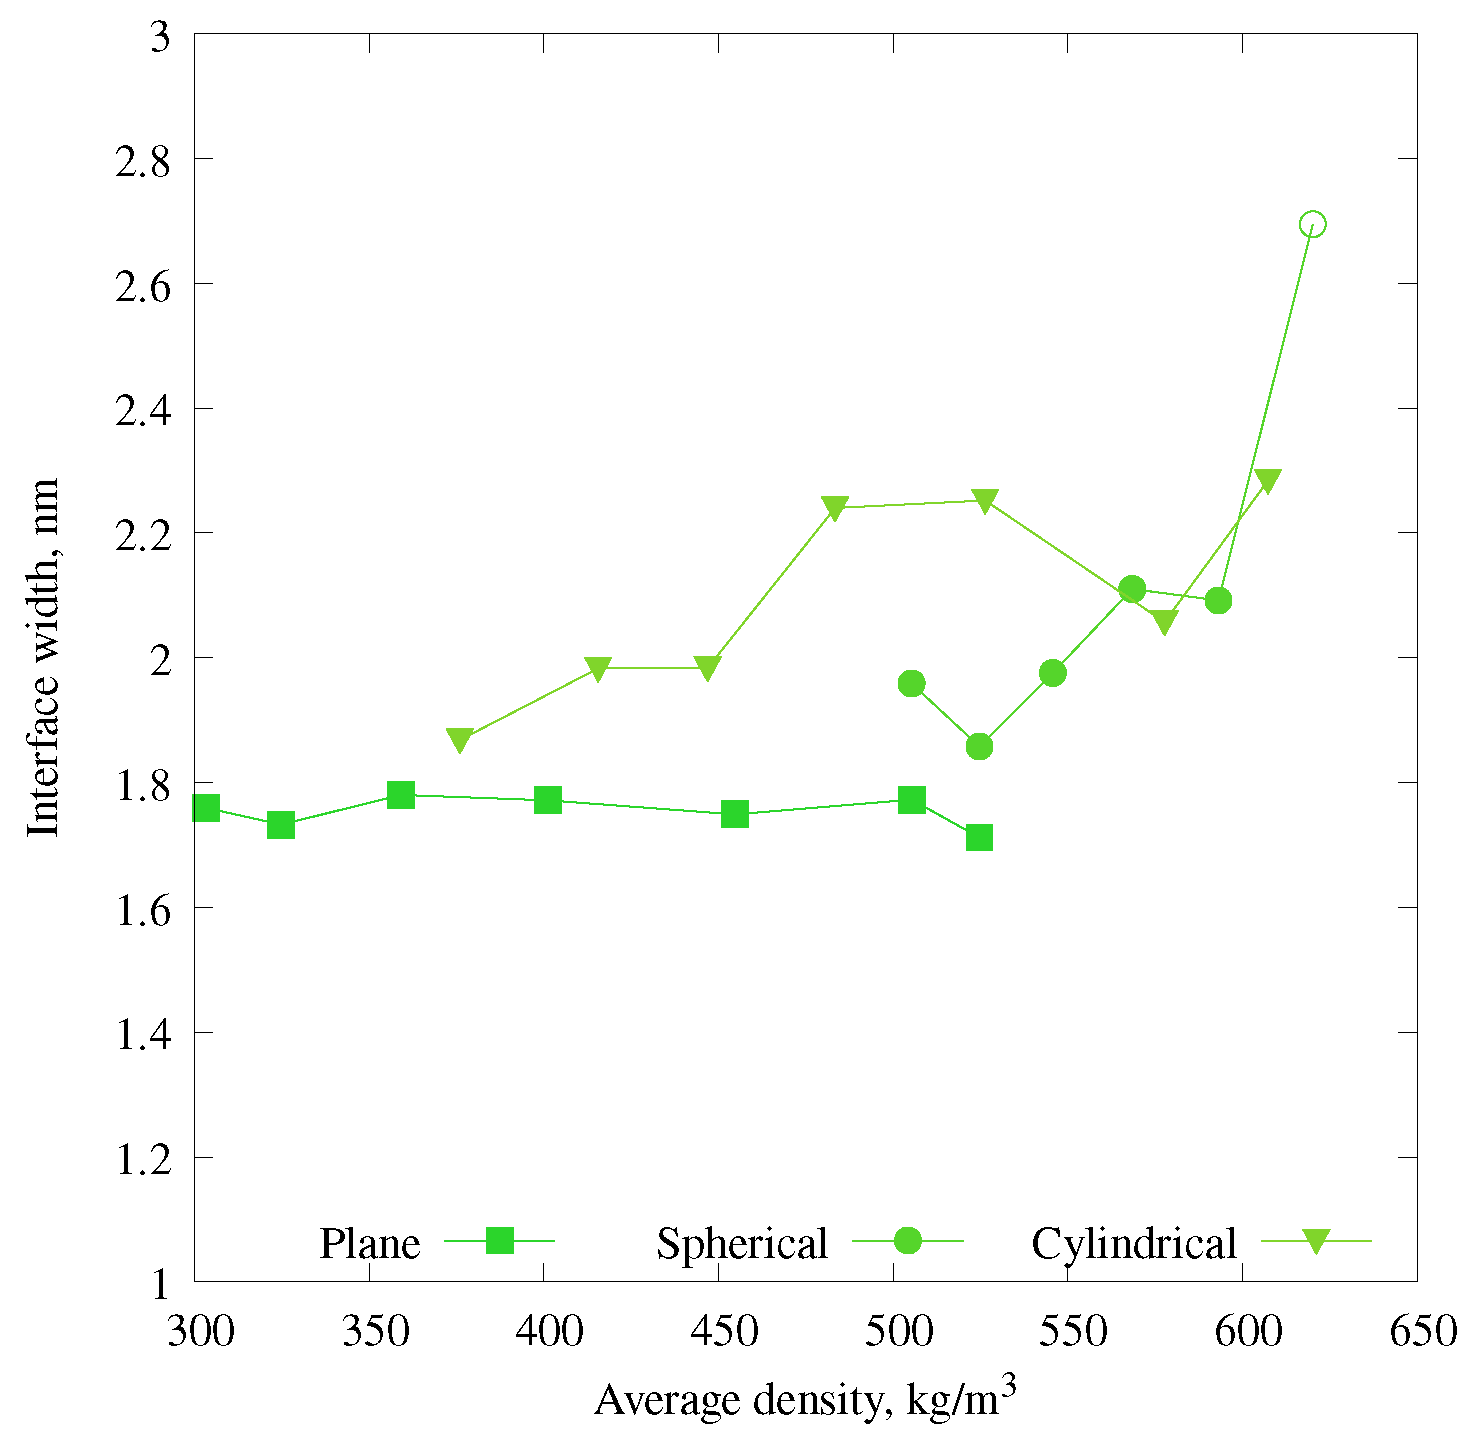
where v are volume fractions, X, Y, and Z are sizes of simulation cells. The flat interface was parallel to YZ plane, and the cylindrical interface was normal to the XZ plane. The “bubble” radius for the case of the flat interface is half of the distance between opposite gas–liquid surfaces. The widths of the interfaces are presented in Figure 7. In most of the cases, the width of the gas–liquid interface fits into an interval of 2 nm ± 0.3 nm with one high value (≈ 2.7 nm) corresponding to the case of the vanishing low-density phase in the bubble.
The effect of gas adsorption inside the interface layer, which we will discuss in detail in the next section, is also visible if one compares results of two sets of simulations: one is for cubic cells, and another is for elongated parallelepiped cells. Both of them have flat interfaces, but due to different cross sections of cells, the elongated cells have a smaller volume of the interface layer (Figure 8a). The number of molecules of each type was the same in both cases. The parallelepiped cells were four times longer and two times narrower in both directions parallel to the interface (see Table 1 in Section 2.1 for simulation cells sizes). Since fewer methane and ethane molecules could be adsorbed in the interface layer in the case of an elongated cell, they resided in the gas phase, which had a bigger volume (Figure 8a), and caused a slight pressure increase (Figure 8b) compared to cubic cells.
The difference in the aspect ratio of simulation cells leads to the formation of gas bubbles of different shapes and, hence, different capillary pressures between phases. At the same time, the influence of interface curvature and pressure difference does not imply major changes in phases compositions and densities. Let us compare the systems of the same average density, but with different gas-phase shapes, and calculate capillary pressure. To find the surface tension coefficient, we can use results obtained for the plane surface interface. The surface tension coefficient can be calculated as follows:
γ = 1 2 X P x x P y y + P z z 2
where P x x , P y y , and P z z are pressure tensor components in the system with the plane surface interface, perpendicular to the X direction. The 1 / 2 multiplier accounts for the two side surfaces on the opposite sides of the gas bubble. For the 26 × 25 × 25 nm3 system with the plane interface, the surface tension is γ = 7.4 × 10 3 N/m. With this as a reference for surface tension, we can evaluate Δ P for curved interfaces. For the 26 × 25 × 25 nm3 system with a sphere-shaped gas bubble, the bubble radius was 7.9 9.8 nm (depending on the exclusion or inclusion of interface volume), which yields a Δ P between 1.87 and 1.51 MPa. Considering the liquid pressure 5.15 MPa, it gives us the gas phase pressure in the range of 7.02 6.66 MPa. The gas in the spherical bubble, with this pressure, had a density of 51 kg/m3 (Figure 4). Gas of the same density, but in the system with the plane interface, would have a pressure equal to the liquid pressure around 6.6 MPa (to calculate it, we fitted pressure on density dependence). This pressure estimation is in good agreement with the estimation of gas pressure (with the inclusion of the interface layer to the bubble size) using capillary pressure.

3.3. Composition Analysis of the Gas and Liquid Phases and Interface Layer

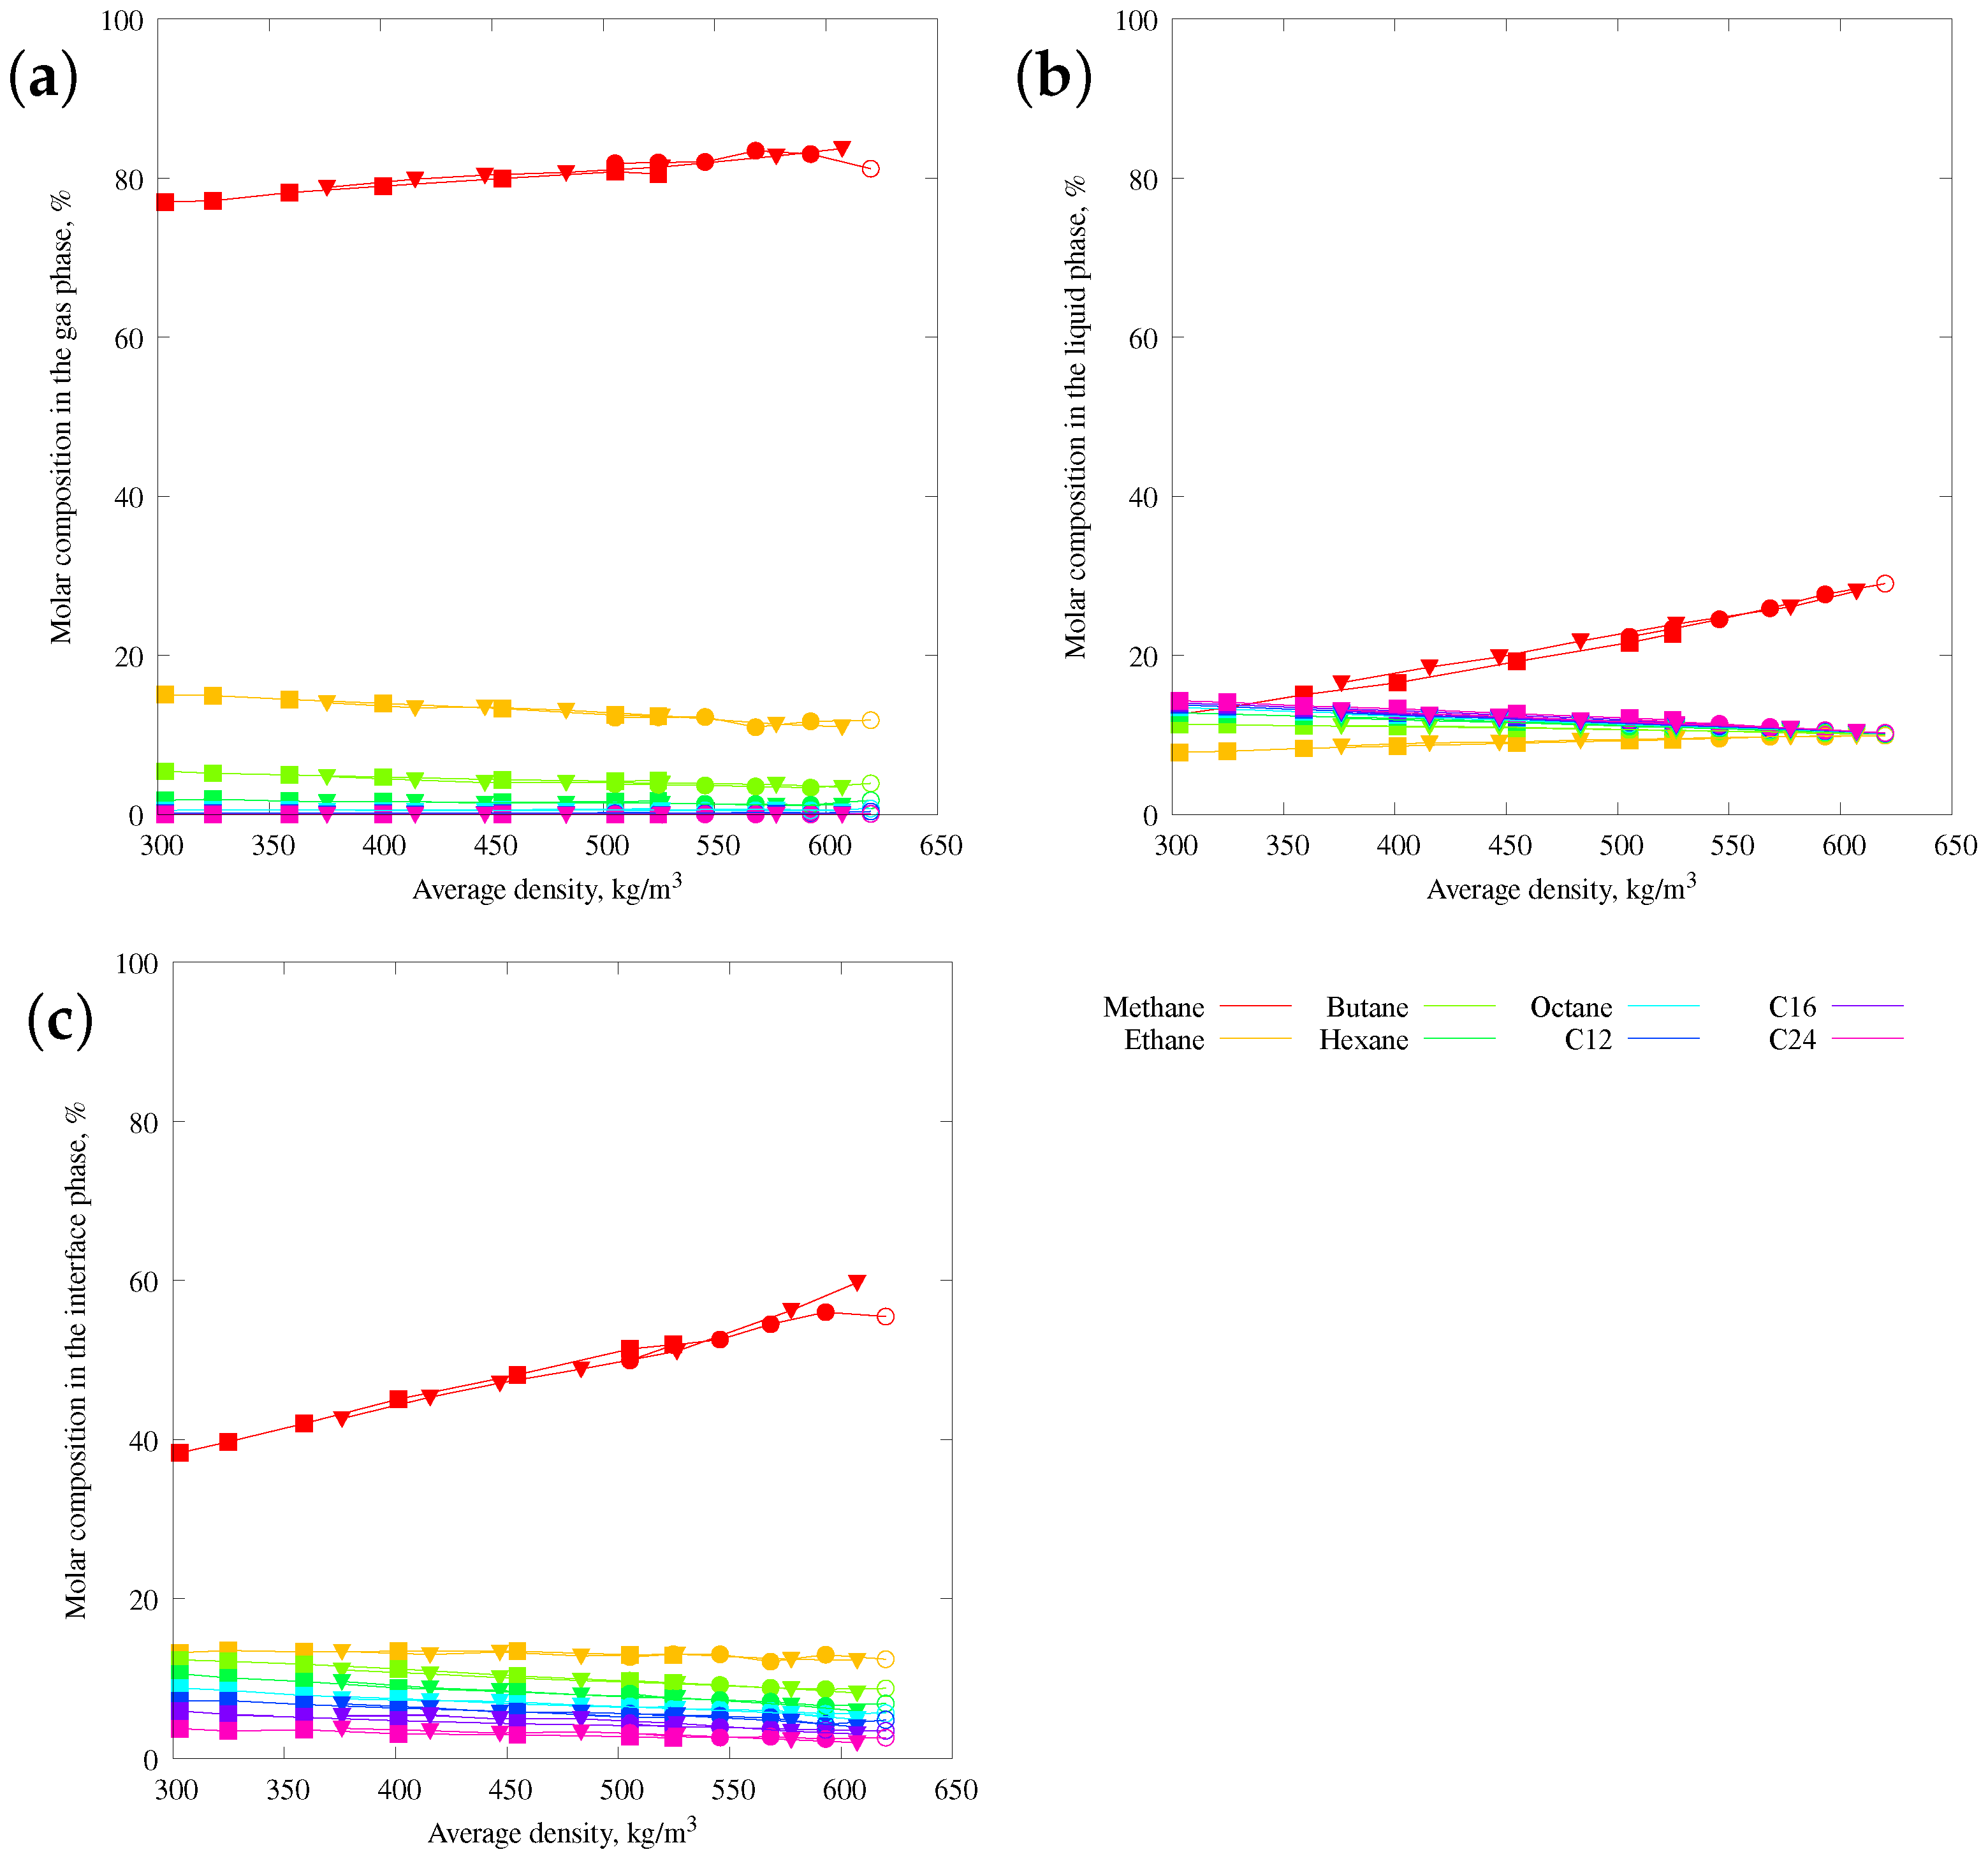
Our method for analysis of the local density and composition (Appendix C) allows us to calculate the total local density of all components as well as the local density (both the mass and the molar densities) for each component separately. The data for the molar composition (i.e., the molar fraction of each component) in the gas and liquid phases as well as in the interface layer for all systems are plotted in Figure 9.
The gas phase consists of 80% methane, about 15% ethane, and about 5% butane and hexane. The liquid phase for the most dense system (about 640 kg/m3) is the homogeneous liquid, so that its composition is exactly equal to the average composition of all systems (70% methane and 10% of each other component). In the interface layer, the molar fraction of methane is again the largest one (between 40 and 60%), the molar fraction of ethane is about 15%, as in the gas phase, but all other components are also present inside the interface layer.
Although the different shapes of the gas–liquid interface result in different pressures of phases, these differences have an insignificant effect on the composition of the phases and the interface layer.
More detailed analysis of the local density and composition in the gas and liquid phases at coexistence, and of the interface between them, was performed for the case of a spherical gas bubble in a cubic simulation box of the size 26 × 25 × 25 nm3, and the results are presented in Figure 10.
The simulation box was divided into very small subboxes (voxels or three-dimensional pixels) with the side 0.1 nm, i.e., there are, for example, about 250 3 1.5 · 10 6 voxels in the cubic simulation box with the side length of 25 nm. In every particular configuration there is on average less than one bead per such a voxel. Indeed, there are 360,000 beads in the system of 48,000 molecules in total. We analyze which UA beads are in each voxel for a particular configuration and average over many configurations at equilibrium, typically an over 2 ns trajectory, checking that a phase-separated configuration is stable during this time, i.e., that the bubble does not change its shape and position. Typically, such an averaging was performed over about several hundred configurations. A special smoothing procedure over neighboring voxels is performed as well. All details of the procedure are described in Appendix C. This procedure allows us to calculate the average mass density in each voxel and the average molar density of each component, and they are plotted in Figure 10a as functions of the cumulative volume fraction. Actually, these plots are not functions but diagrams! Let us explain here what we mean by cumulative volume fraction. We know for each voxel the average mass density and plot the histogram of mass density, i.e., the number of voxels that have a mass density in a small interval. Dividing the number of voxels with particular mass density by the total number of voxels, we get the fraction of voxels or the volume fraction of small subvolumes with a particular mass density, which is plotted in Figure A3 in Appendix C. In that plot, we divide the abscissa (mass density) into bins with the width of 2 kg/m3, and this splits all voxels into many classes, so that each class of voxels is characterized by the particular values of the local mass density. Each class of voxels occupies some fraction of the total volume, and this fraction is plotted along the x-axis in Figure 10a, while the local mass density (that actually defines the classes of voxels) is plotted along the right y-axis. The sum of all small intervals (bins) along the x-axis gives, of course, 1. For each x-bin (i.e., a few classes of voxels that are placed in this bin), we have calculated the average molar density of components and the average molar composition and plotted it along the left y-axis. We also included there the plot for the mass density of components (note the logarithmic axis there).
Analysis of the local composition shows that the molar density of methane and ethane is higher inside the gas–liquid interface than in the gas phase (which consists mainly of methane and ethane). These molecules are adsorbed on the liquid surface. In cases of nanobubbles, a large fraction of gas molecules may reside in the adsorbed state (both adsorbed inside an interface between the gas and liquid and at the walls of confining pores). The total effect will depend on the gas–liquid surface area, which can be significant for two-phase systems in porous media, especially when pore sizes go down to nanometers as they are in tight rock formations.

4. Conclusions

We have performed a molecular dynamics simulation of a bulk eight-component hydrocarbon mixture that roughly represents a composition of hydrocarbon fluid in a volatile oil reservoir. For that goal, we have developed a method for building molecular models of hydrocarbon mixtures which can include various branched molecules. We have used self-periodical simulation boxes of finite sizes and with different aspect ratios. Our main focus here is the phase behavior of a multicomponent mixture in the presence of gas–liquid interfaces of different shapes: spherical, cylindrical, and slab-like gas bubbles. We have also developed an efficient method for calculating properties of coexisting phases in molecular simulations of multicomponent systems. In particular, it allows us to analyze the local composition of the mixture and to calculate the molar densities of components in liquid and gas phases, as well as inside the interface between them. For the values of models’ parameters which we have used so far, we observe the liquid–gas phase separation upon decreasing the overall density, and therefore also the pressure, accompanied by the demixing of more light components. We have kept the same temperature, T = 375.15   K , in all systems and used several combinations of the number of molecules and the box size and shape to control the overall density and the presence or absence of a liquid–gas interface, as well as its shape. The gas bubble that appears in the system is mainly composed of methane. At the same time, there are also a small number of ethane and butane molecules, a tiny number of hexane molecules, and no molecules of heavier components at all. In the liquid phase, all components are present, and the molar density of all of them is approximately the same except for methane, whose molar density is twice that of the other seven components, that is essentially smaller than the average molar density of methane in the system that is three times larger than that of the other seven components. We also show that inside the gas–liquid interface, which is actually quite broad, the molar density of methane is also higher than that of other components and even reaches a maximum value in the middle of the interface. Ethane behaves similarly: its molar density also reaches a maximum inside the interface. The molar density of heavier components grows monotonically from the inner part of the interface towards its outer part and shows a very small (almost not visible) maximum at the outer side of the bubble.

Author Contributions

Conceptualization, A.S. and V.I.; methodology, A.S.; software, A.S.; validation, A.S.; formal analysis, A.S.; investigation, A.S.; resources, A.S.; data curation, A.S.; writing—original draft preparation, A.S.; writing—review and editing, A.S. and V.I.; visualization, A.S.; supervision, V.I.; project administration, A.S. and V.I. All authors have read and agreed to the published version of the manuscript.

Funding

This research received no external funding.

Data Availability Statement

The raw data supporting the conclusions of this article can be made available by the authors on request, provided that this does not violate certain legal restrictions.

Acknowledgments

Many helpful discussions with Mikhail Stukan are appreciated. This work was performed during the PhD study of A.S. in the Faculty of Physics of Moscow State University. The research was carried out using the equipment of the shared research facilities of HPC computing resources at Lomonosov Moscow State University [36].

Conflicts of Interest

The authors declare no conflicts of interest.

Appendix A. MD Simulation Details

Appendix A.1. Force Field

A NERD force field with additional parameters [18] was used for the MD simulation of a hydrocarbon mixture with branched molecules. This force field allows us to consider saturated hydrocarbons in the united atom approach. Every united atom is a spherical uncharged particle representing one carbon atom with hydrogen atoms bonded to it. United atoms differentiate by the number of hydrogen atoms and, in the case of the CH3 group, molecule type. In the current study, we used three different united atoms for the CH3 group: CH3e for ethane, CH3 for the ends of linear molecules, and CH3s for the ends of branched molecules. CH2 united atoms were the same regardless of position in a molecule and molecule type.
United atoms interact with each other via Lennard-Jones potential (non-bonded interaction):
V i j ( L J ) = 4 ε i j σ i j r i j 12 σ i j r i j 6
where r i j —distance between i and j particles, ε i j and σ i j —parameters of non-bonded interaction. The interaction radius was limited using a cut-off function [37], which gradually decreases the interaction strength to zero in the section R c u t 2 > r i j > R c u t 1 . R c u t 1 and R c u t 2 were 1.5 and 1.7 nm. Larger cut-off radii did not change simulation results; however, smaller values lead to a less dense liquid phase. Non-bonded interaction parameters and masses of united atoms are presented in Table A1. United atoms which were separated by less than three bonds inside a molecule were excluded from non-bonded interactions. For pairs of particles connected via three bonds, the non-bonded interaction was reduced by a factor of two. Parameters of non-bonded interactions for different combinations of united atoms were calculated using Lorentz–Berthelot mixing rules:
ε i j = ε i i ε j j σ i j = σ i i + σ j j 2
Table A1. Properties of united atoms.
TypeMass (a.m.u.) ε (kJ/mol) σ (nm)
CH416.0431.23054000.3730
CH3e15.0350.83643490.3825
CH315.0350.86470410.3910
CH3s15.0350.69010040.3820
CH214.0270.38080240.3930
CH113.0190.33008420.3850
CH012.0110.14134590.3910
To compose a molecule, united atoms were connected with bonding potential:
V ( b o n d ) = k b l l 0 2 ,
where l is the bond length, k b and l 0 are the force constant and equilibrium bond length, correspondingly.
The angle between the covalent bonds was controlled by bond angle potential:
V ( a n g l e ) = k a θ θ 0 2 ,
where θ is the angle between i-j and j-k bonds, k a and θ 0 are the force constant and equilibrium angle, correspondingly.
Dihedral angles were controlled by the following potential:
V ( d i h e d r a l ) = 1 2 n = 1 4 F n 1 + ( 1 ) n 1 cos ( n ϕ ) ,
where ϕ is the angle between planes in a particle quadruplet. Zero ϕ corresponds to a cis-configuration. F 1 F 4 are numerical coefficients.
Parameters of bonded interactions (A3)–(A5) are presented in Table A2.
Table A2. Parameters of bonded interactions in molecules. X denotes a united atom of any type.
Bond l 0 (nm) k b (kJ/mol/nm2)
X-X0.15480234.99
Angle θ 0 (deg.) k a (kJ/mol/rad2)
X-CH2-X114.00519.657
X-CH1-X109.47519.657
X-CH0-X109.47519.657
Dihedral F 1 (kJ/mol) F 2 (kJ/mol) F 3 (kJ/mol) F 4 (kJ/mol)
X-CH2-CH2-X5.903802−1.13393313.1588780.000000
X-CH2-CH1-X6.6233362.313428−14.9860670.000000
X-CH2-CH0-X0.0000000.00000027.2000770.000000
X-CH1-CH1-X0.0000000.00000027.2000770.000000
X-CH1-CH0-X0.0000000.00000027.2000770.000000
X-CH0-CH0-X0.0000000.00000027.2000770.000000

Appendix A.2. Single Precision vs. Double Precision in GROMACS
Actually, the double precision calculations in MD simulation are the standard choice, so there is no need to justify using them. However, GROMACS software allows us to utilize GPUs in single precision, and that of course drastically improves the calculation performance. A few years ago, there was some discussion in the GROMACS community and attempts to motivate the software developers to incorporate double precision in GPU calculations, but at the moment of the main simulation runs for this paper, this had not yet been done.
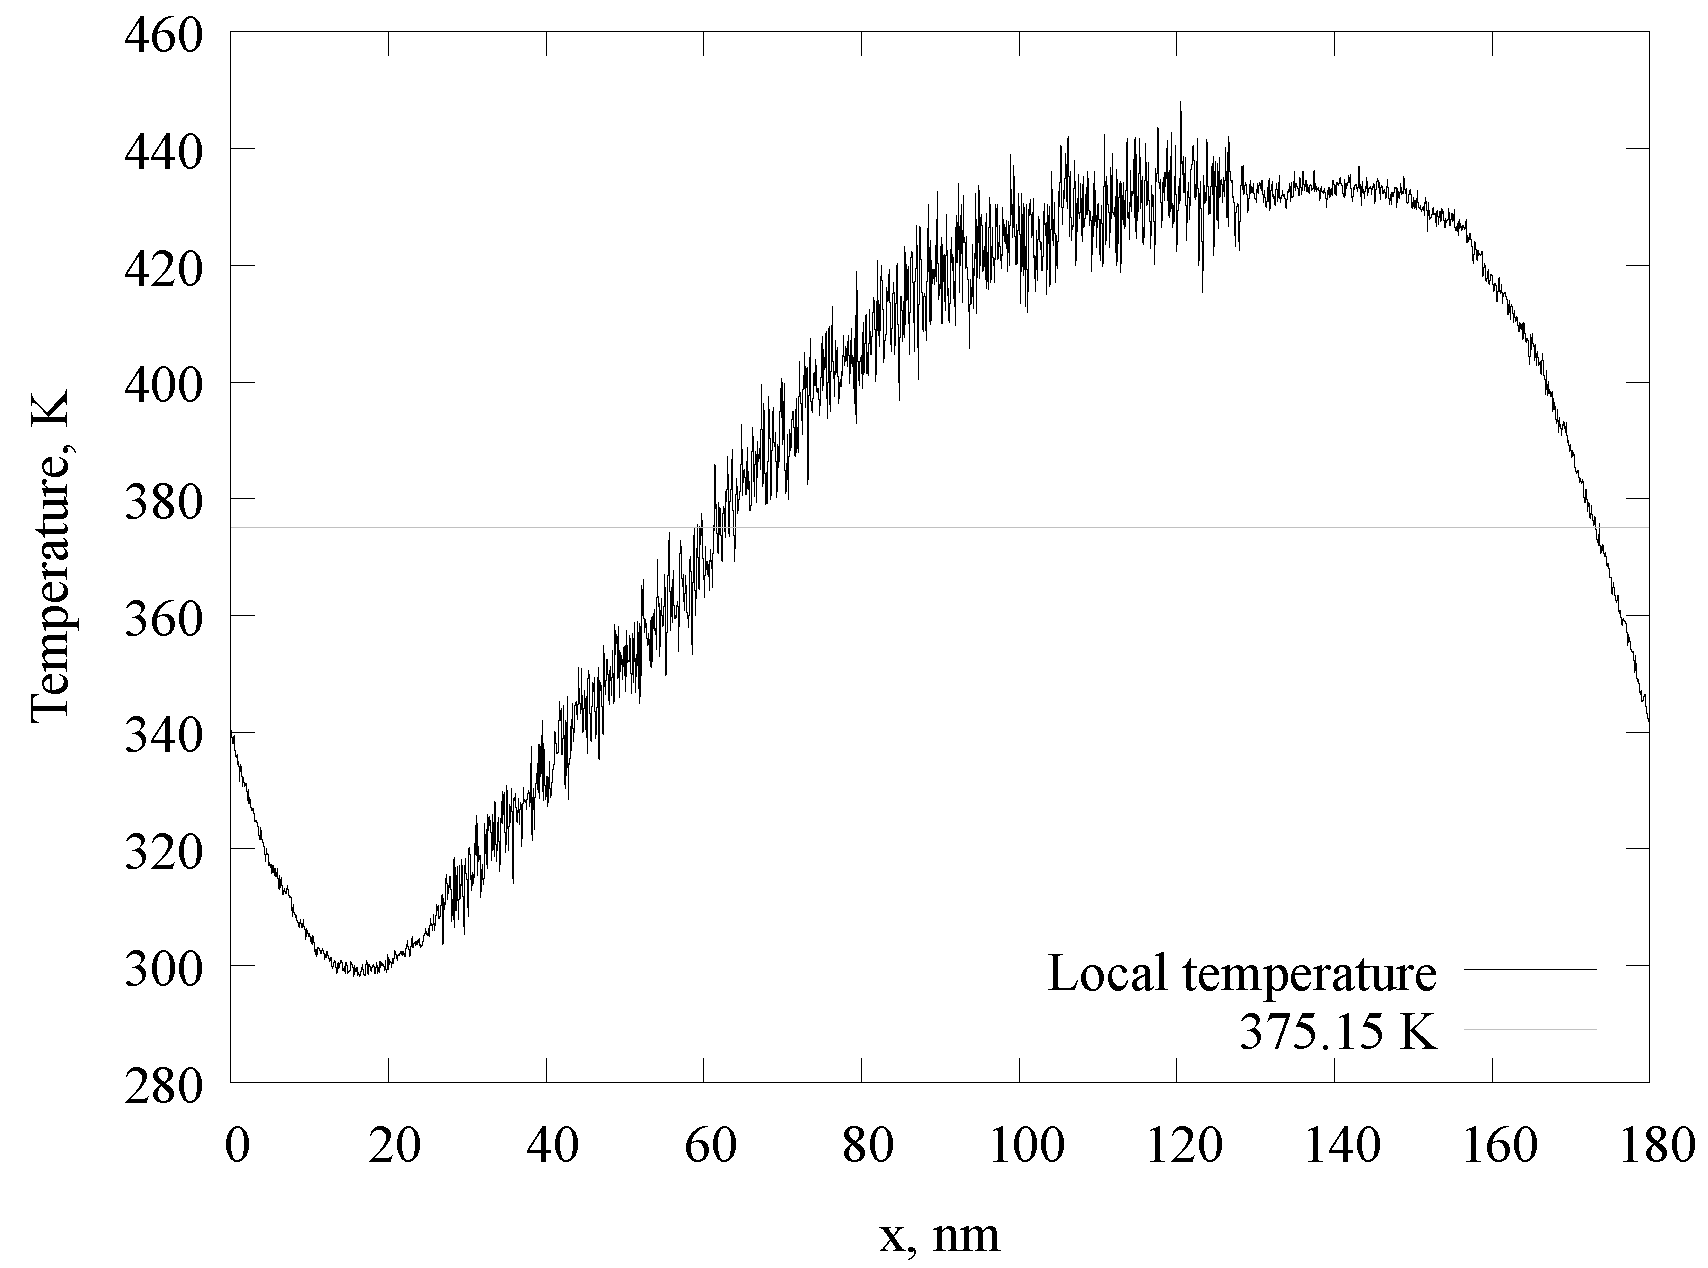
Therefore, we performed some tests to warn colleagues that simulations in the single precision regime on a GPU in GROMACS could lead to some artifacts and a non-physical picture, in particular, a spatial distribution of temperature is not uniform in the case of a two-phase system even when each of the fluid components is coupled to a separate thermal bath. In Figure A1, the temperature profile along the x-axis is shown for a gas–liquid system of 48,000 molecules in the simulation cell with dimensions of 180 × 12.5 × 12.5 nm3. The average temperature of the whole system and of each component was correctly reproduced (375.15 K), but the temperature profile along the x-axis was not uniform. This does not happen when double precision calculations are used.
Figure A1. Temperature profile of a gas–liquid system when using GROMACS in a single precision regime on GPUs.
Methane 04 00024 g0a1

Appendix B. Molecules Generation Algorithm

The molecule generation algorithm allows for the automatic creation of a large number of united atom models of saturated hydrocarbon molecules. Every molecule is being generated independently from any others. The algorithm is implemented as a Python script and is available at GitHub [38]. The output of the algorithm is the position of every united atom and a list of bonds. Every carbon atom has as many hydrogen atoms connected as possible depending on the number of bonds with other carbon atoms. Each carbon atom with corresponding hydrogen atoms is considered as one particle (a united atom, or a bead).
The generation process is iterative. The generation cycle ends when a molecule has a desired number of atoms. The generation starts with one united atom particle (methane molecule). At each iteration, a C-C bond is added, and this can lead to the addition of a neighbouring carbon atom or the creation of a bond between existing C atoms and, therefore, the creation of a cycle. Every united atom of a molecule being generated is placed in points of a diamond crystal lattice. It decreases the number of possible molecule types which can be generated. However, molecules, generated in such a way, have atom positions close to equilibrium, so there is no need to equilibrate intermediate states of a molecule being generated. At each step, a new bond can be added at different places of the existing molecule. The choice of position is made according to the list of probabilities set. This list contains “energies” of bonds of each type, depending on united atom types. At each step, creation probability weights of possible bonds are calculated as w i = exp ( U i / T ) where U i is bond “energy” and T is “temperature”. These bonds’ “energies” and the “temperature” may not have any physical meaning, in case hydrocarbon generation should be threatened as numerical parameters. In the current study, for all bond had equal probabilities. However, using different input bond “energies”, it is possible to generate dendritic molecules, with hydrocarbons with every C atom having less than 4 C-C bonds, archipelago-like molecules, and so on.

Appendix C. Analysis Methods

In this section we would like to present an analysis method which allows us to detect different phases while analyzing trajectories of atoms produced by molecular dynamics simulation.
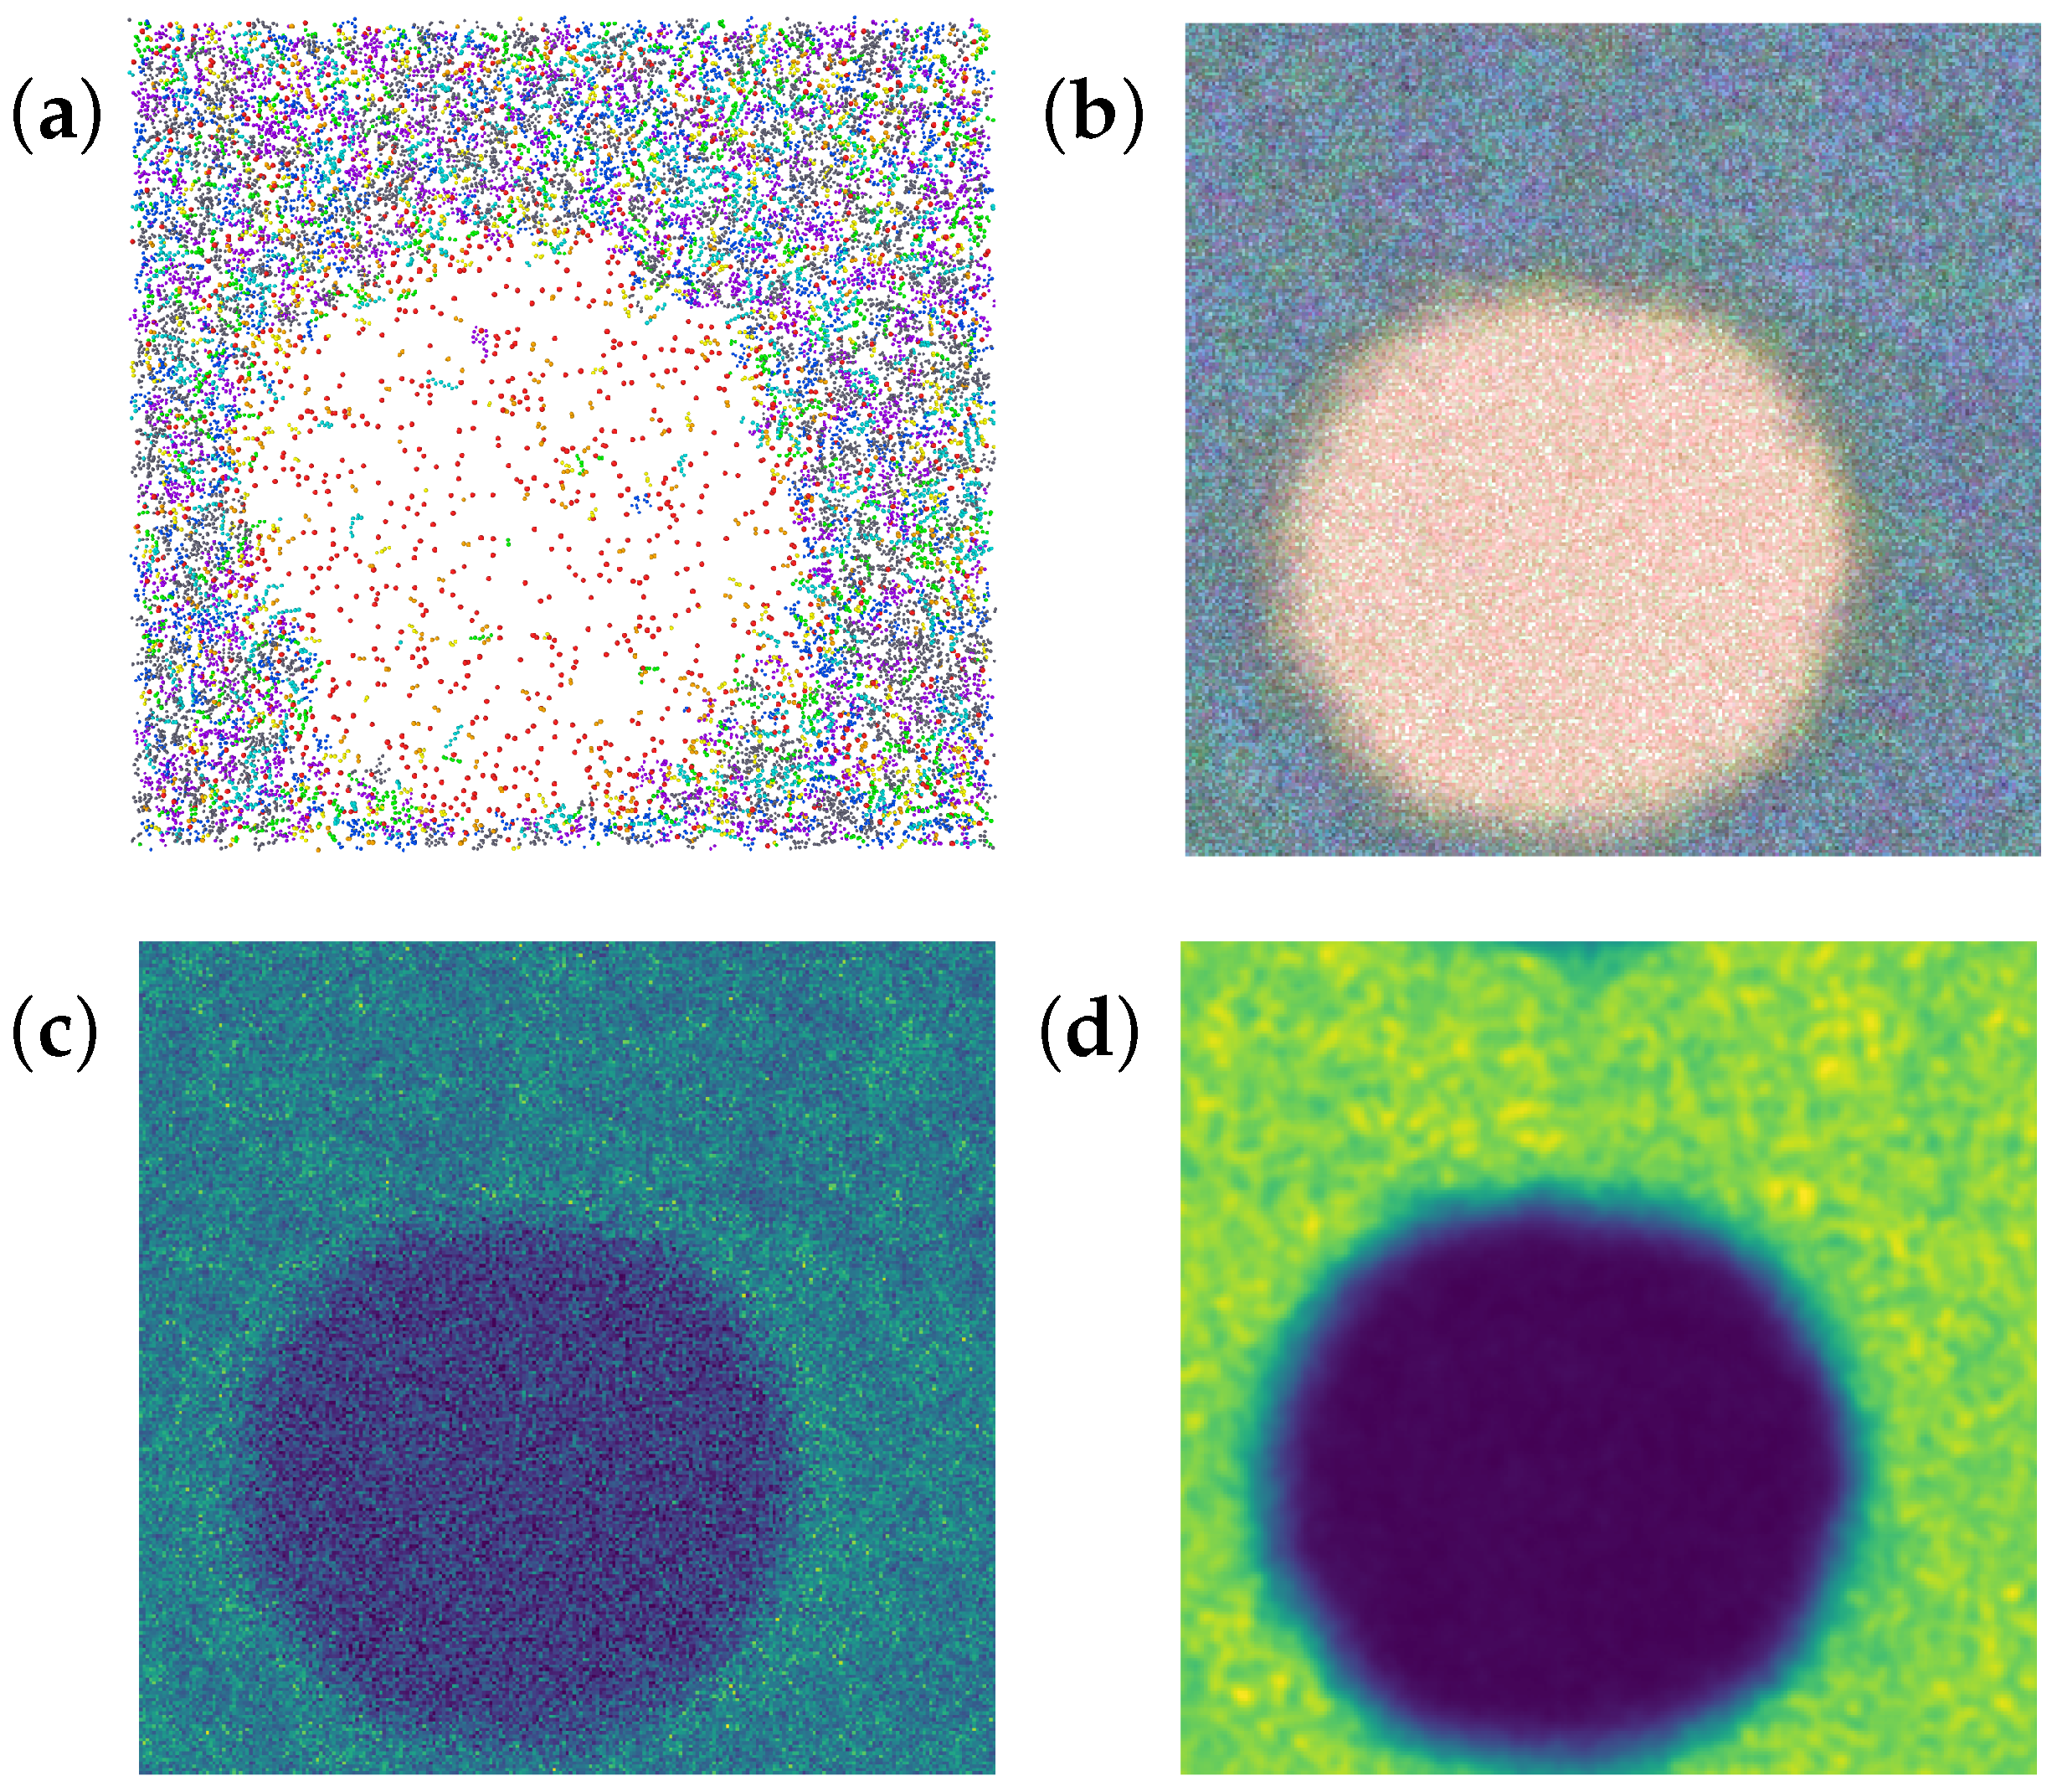
As an example, the analysis method will be shown applied to the results of the simulation of an eight-component mixture (48,000 molecules in total) in a 26 × 25 × 25 nm3 calculation cell at a temperature of 375.15 K and a pressure of 5.15 MPa, and the average density was 524.68 kg/m3. At these conditions, the final state of the system consists of two phases: a low-density phase (gas bubble) and a high-density phase (liquid). Figure A2a presents a slice of a snapshot of the system. The gas phase’s primary components were methane and ethane, while the liquid phase contained heavier molecules. Trajectories of molecules were averaged over several hundred configurations sampled during productive simulation runs (typically, 2 ns) and the molar density of each component was obtained (Figure A2b). The size of the bin for averaging was 0.1 nm, i.e., the side of the voxel (which is a small subvolume or 3d pixel), and this is smaller than the size of a methane molecule, for good spatial resolution. Molar densities were recalculated to the mass density (Figure A2c) and then smoothed with a Gauss filter ( σ = 0.25 nm) to obtain the local mass density map (Figure A2d), which was used for phase detection.
Figure A2. (a) A slice of a snapshot of the simulated system, and the thickness of the slice is 2 nm. (b) Time-averaged composition (molar densities of components). In both (a,b), the red color shows the methane concentration, the green color shows concentrations of ethane, butane, hexane, and octane, and the blue color shows the concentration of C12, C16, and C24 fractions. (c) Time-averaged mass density in the slice. (d) Smoothed average mass density (the local density). The thickness of the slices (bd) is 0.1 nm. In (c,d), the blue color refers to the gas and green color refers to the liquid.
Methane 04 00024 g0a2
The phase detection algorithm is as follows:
1.
A plotted histogram of the volume fraction (number of bins) on density (Figure A3). The bin size of this histogram was 2 kg/m3. There are two spikes on this plot—one refers to the gas phase, another refers to the liquid phase. Volume with intermediate density refers to the gas–liquid interface.
2.
Evaluate approximate average densities of gas and liquid ( M g a s , M l i q u i d ) and their dispersions ( D g a s , D l i q u i d ). For the calculation of these values, only values exceeding 0.25% of volume were used: small values on the histogram (below the green line in Figure A3), which refer to the phase interface, were omitted. Remaining values were divided into two groups (gas and liquid). For these groups, average values and dispersions were calculated.
3.
Evaluate two density values: a higher limit of gas density and a lower limit of liquid density ( L 1 and L 2 , correspondingly). These values were calculated using the following formulas L 1 = M g a s + 3 D g a s and L 2 = M l i q u i d 3 D l i q u i d (orange and purple lines in Figure A3).
4.
Get a rough estimate of the density of the intermediate layer M i n t e r f a c e as a mean between the density of the gas and liquid phases ( M i n t e r f a c e = ( M g a s + M l i q u i d ) / 2 ), to set all voxels with a local density less than M i n t e r f a c e as “gas”, voxels with a local density more than M i n t e r f a c e as “liquid”, and voxels with a density equal to M i n t e r f a c e as the “intermediate layer”. This is a temporary labeling of voxels. Some “intermediate” voxels are labeled as “gas” or “liquid” after this step.
5.
Iteratively find all voxels with intermediate densities laying between gas and liquid phases. At each step, one needs to label as “intermediate” all voxels which are neighboring current “intermediate” ones and have local densities between L 1 and L 2 values. The process repeats until the number of “intermediate” voxels does not rise.
6.
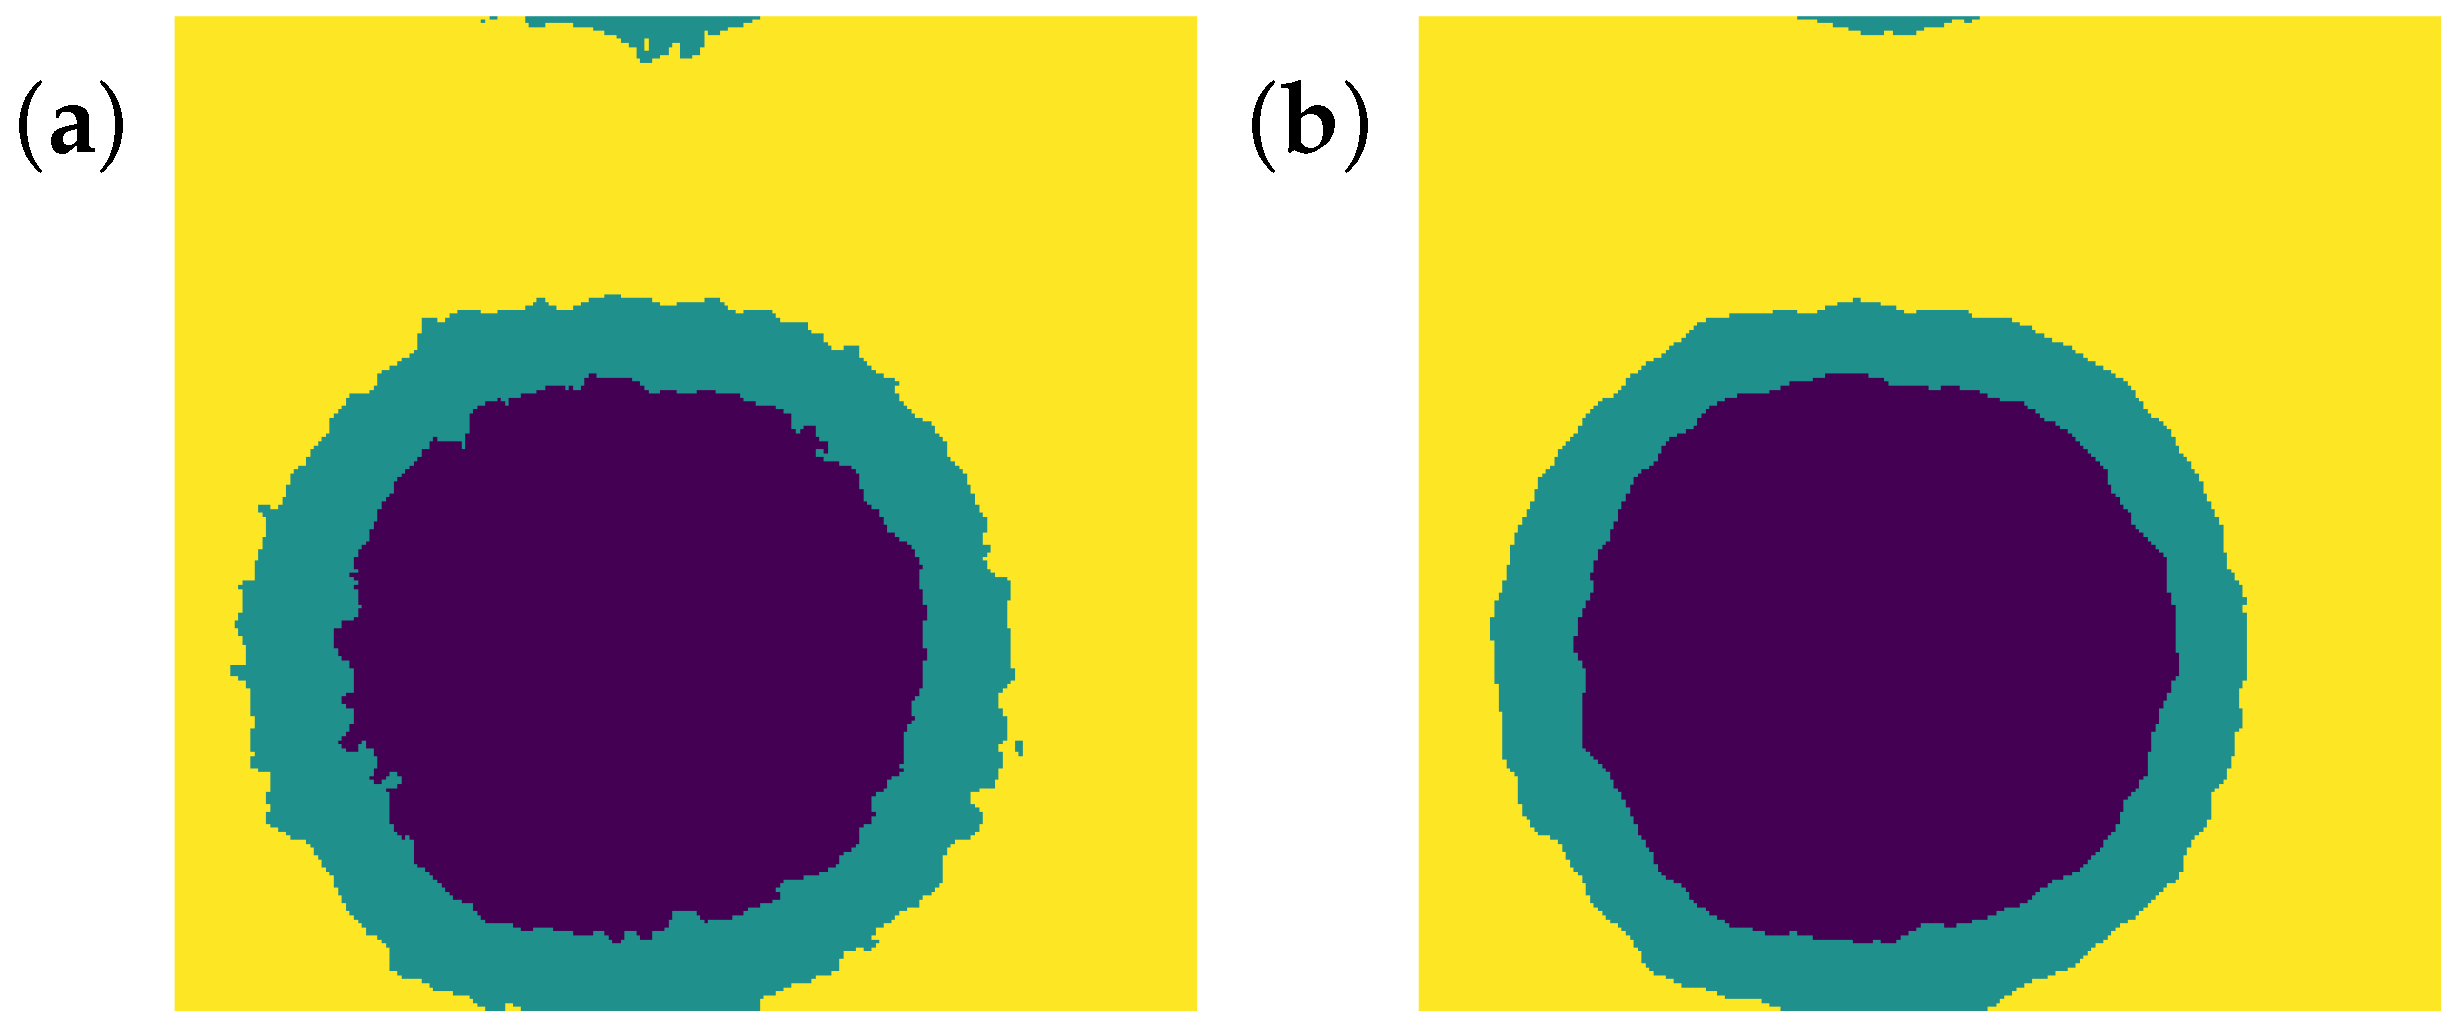
After the previous step, “intermediate” volume can have parts going deeply into a different phase (Figure A4a), so one should smooth surfaces which distinguish phases. This can be done with the following process: every voxel changes its label to the dominant label among its 26 neighbours. After some iterations, the label map stops changing, and the boundaries are smooth (Figure A4b).
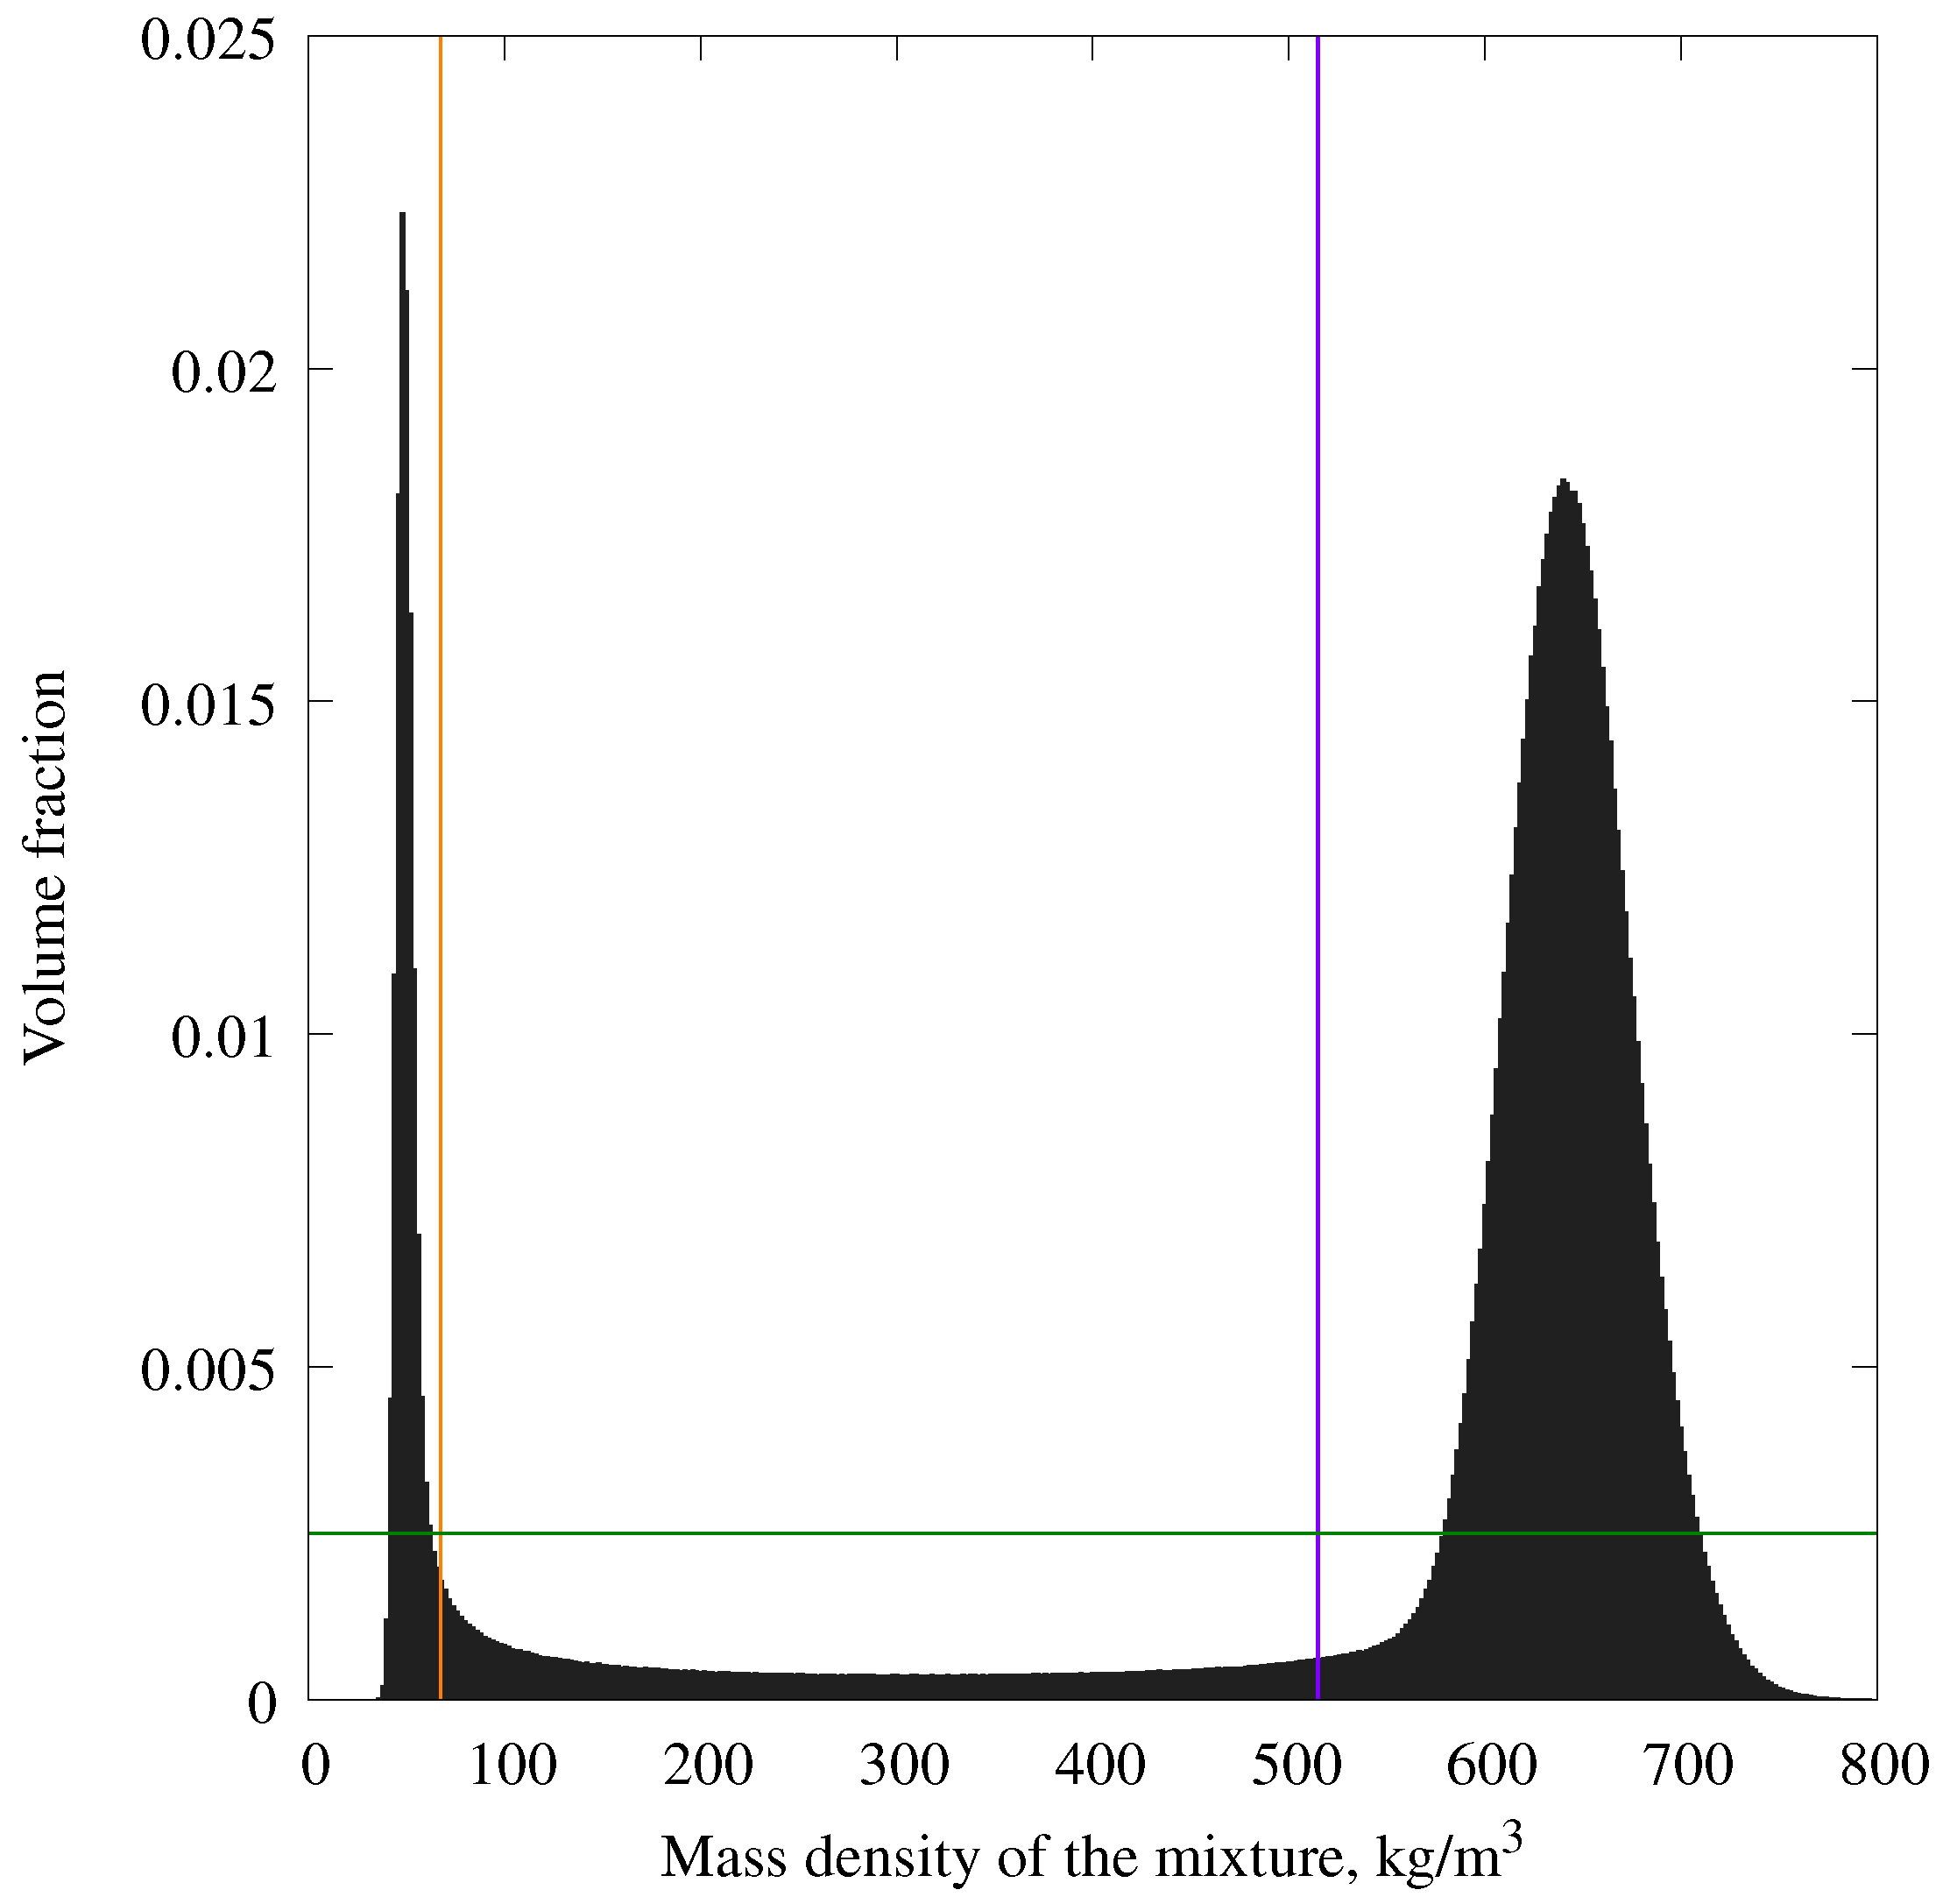
Figure A3. Density values distribution histogram. Green line corresponds to an average value. Orange and purple lines are approximate limits of gas and liquid densities.
Methane 04 00024 g0a3
Figure A4. Slice of label map (a) before smoothing, and (b) after smoothing. Gas is shown with yellow, the intermediate layer is shown in green, and the liquid is shown in purple. The slice position corresponds to Figure A2.
Methane 04 00024 g0a4
The phase detection algorithm described allows us to label all volumes with three different labels. In Figure A4b, different labels are shown with different colors. With this labeling, one can easily calculate spatial averages of phase densities and compositions (they are not equal to rough estimations M g a s , M l i q u i d , and M i n t e r f a c e ).
This method can be generalized to split the volume into any number of classes. If classes are distinguished by local density values, one can get the composition and volume fraction which are presented in Figure 10 (in the main text). Classes were separated with the binning of density values within 2 kg/m3 intervals (same as binning in the histogram in Figure A3). In Figure 10, the x-axis is the cumulative volume fraction scale (see the main text for an explanation). The left y-axis is the axis of components’ molar densities, which are plotted as a sequence of horizontal lines—one for each class. Vertical positions of these lines represent composition, horizontal length is the volume fraction of a class. The right y-axis is the mass density scale of classes (grey line). In this figure, one can see that gas consists of about 10–12 classes with the lowest mass density and occupies approximately 12–14% of the whole volume. There is also a methane density peak and a less pronounced ethane peak in the intermediate layer. This means that these molecules may be adsorbed on the gas–liquid surface. The right-hand side of the figure (high mass density) refers to the liquid phase. One can see that the liquid is not uniform at the molecular scale (spatial bin size is only 0.1 nm). The most dense voxels have high C24 molecule concentrations.
The following important remarks should be taken into account. This method of processing the results of molecular simulations allows us to determine the densities, compositions, and volume fractions of different phases of the simulated mixture, regardless of their location in the simulation box and its shape. When considering an eight-component mixture, this method of processing worked perfectly, but it is worth pointing out some of its weaknesses. Firstly, this method is based on dividing the areas of the simulation box by some value, the choice of which is arbitrary. In our work, we have taken the mass density of the mixture. This choice turned out to be successful: the values of the density of the interface layer between the liquid and gas turned out to be intermediate between the values of the gas and liquid density. If the density of the layer turned out to be, for example, higher than the density of the liquid, then in the area between the gas and the surface layer, the mixture would have the density of a liquid, but classifying it as a liquid would be wrong. Secondly, the results of processing depend, although weakly, on the size of the voxels (subvolumes) into which the simulation box is divided when averaging trajectories. In this paper, this size was taken as deliberately small (several times smaller than the size of the simulated UA beads) to obtain distributions in high spatial resolution. However, this size turned out to be too small—the mass density values were too noisy, and additional spatial averaging was required. Additional averaging was performed using a Gaussian filter, the spatial size of which was taken to be 2.5 times larger than the voxel size. This size is small enough to maintain good spatial resolution and large enough so that the density values do not have strong noise. However, the choice of this size is arbitrary. These features make this processing method inapplicable to the study of arbitrary complex systems (for example, in the presence of adsorption layers on the surface of a solid). It can be improved by the utilization of neural networks to automatically find the best distinguishing value for phases in a complex system. However, in this paper, the use of more advanced processing methods was not necessary.

References

  1. Salahshoor, S.; Fahes, M.; Teodoriu, C. A review on the effect of confinement on phase behavior in tight formations. J. Nat. Gas Sci. Eng. 2018, 51, 89–103. [Google Scholar] [CrossRef]
  2. Bao, B.; Zandavi, S.H.; Li, H.; Zhong, J.; Jatukaran, A.; Mostowfi, F.; Sinton, D. Bubble nucleation and growth in nanochannels. Phys. Chem. Chem. Phys. 2017, 19, 8223–8229. [Google Scholar] [CrossRef]
  3. Chen, F.; Bi, R.; Nasrabadi, H. Molecular Simulation of Multi-scale Multi-Component Hydrocarbon Phase Behavior in Liquid-Rich Shale Reservoirs. In Proceedings of the Unconventional Resources Technology Conference, Houston, TX, USA, 26–28 July 2021; pp. 2464–2476. [Google Scholar] [CrossRef]
  4. Yen, T.H.; Chen, Y.L. Analysis of Gas Nanoclusters in Water Using All-Atom Molecular Dynamics. Langmuir 2022, 38, 13195–13205. [Google Scholar] [CrossRef] [PubMed]
  5. Hunt, J.M.; Jamieson, G.W. Oil and Organic Matter in Source Rocks of Petroleum1. AAPG Bull. 1956, 40, 477–488. [Google Scholar] [CrossRef]
  6. Sidorenkov, A.; Aslyamov, T.; Ilinov, D.; Stukan, M. Methane storage in nano-pores: Molecular dynamics simulation and density functional theory. Geoenergy Sci. Eng. 2023, 222, 211419. [Google Scholar] [CrossRef]
  7. Sidorenkov, A.; Stukan, M.; Ivanov, V. Methane flow in nanopores: Analytical approximation based on MD simulations. Fuel 2023, 332, 126070. [Google Scholar] [CrossRef]
  8. Herdes, C.; Petit, C.; Mejía, A.; Müller, E.A. Combined Experimental, Theoretical, and Molecular Simulation Approach for the Description of the Fluid-Phase Behavior of Hydrocarbon Mixtures within Shale Rocks. Energy Fuels 2018, 32, 5750–5762. [Google Scholar] [CrossRef]
  9. Mao, S.; Kuldinow, D.; Haataja, M.P.; Košmrlj, A. Phase behavior and morphology of multicomponent liquid mixtures. Soft Matter 2019, 15, 1297–1311. [Google Scholar] [CrossRef] [PubMed]
  10. Sadus, R.J. Chapter 1—Survey of the High Pressure Phase Behaviour of Fluids. In High Pressure Phase Behaviour of Multicomponent Fluid Mixtures; Sadus, R.J., Ed.; Elsevier: Amsterdam, The Netherlands, 1992; pp. 1–12. [Google Scholar] [CrossRef]
  11. McCain, W. The Properties of Petroleum Fluids; PennWell Books: Tulsa, OK, USA, 1990. [Google Scholar]
  12. McCain, W. Heavy Components Control Reservoir Fluid Behavior. J. Pet. Technol. 1994, 46, 746–750. [Google Scholar] [CrossRef]
  13. MacDowell, L.G.; Virnau, P.; Müller, M.; Binder, K. The evaporation/condensation transition of liquid droplets. J. Chem. Phys. 2004, 120, 5293–5308. [Google Scholar] [CrossRef] [PubMed]
  14. MacDowell, L.G.; Shen, V.K.; Errington, J.R. Nucleation and cavitation of spherical, cylindrical, and slablike droplets and bubbles in small systems. J. Chem. Phys. 2006, 125, 034705. [Google Scholar] [CrossRef]
  15. Díaz-Herrera, E.; Cerón-García, E.; Gutiérrez, A.B.; Chapela, G.A. Finite size effect on the existence of the liquid–vapour spinodal curve. Mol. Phys. 2022, 120, e1989071. [Google Scholar] [CrossRef]
  16. MacDowell, L.G. Comment on ‘Finite size effect on the existence of the liquid–vapour spinodal curve’. Mol. Phys. 2022, 120, e2084466. [Google Scholar] [CrossRef]
  17. Yushchenko, T.S.; Brusilovsky, A.I. Step-by-step algorithm for creating and tuning a PVT model for a reservoir hydrocarbon system. Arab. J. Geosci. 2025, 18, 1866–7511. [Google Scholar] [CrossRef]
  18. Nath, S.K.; Khare, R. New forcefield parameters for branched hydrocarbons. J. Chem. Phys. 2001, 115, 10837–10844. [Google Scholar] [CrossRef]
  19. Van Der Spoel, D.; Lindahl, E.; Hess, B.; Groenhof, G.; Mark, A.E.; Berendsen, H.J.C. GROMACS: Fast, flexible, and free. J. Comput. Chem. 2005, 26, 1701–1718. [Google Scholar] [CrossRef]
  20. Available online: http://www.gromacs.org/ (accessed on 1 August 2025).
  21. Available online: https://manual.gromacs.org/current/reference-manual/algorithms/molecular-dynamics.html (accessed on 1 August 2025).
  22. Sheremata, J.M.; Gray, M.R.; Dettman, H.D.; McCaffrey, W.C. Quantitative molecular representation and sequential optimization of Athabasca asphaltenes. Energy Fuels 2004, 18, 1377–1384. [Google Scholar] [CrossRef]
  23. Lagache, M.H.; Ungerer, P.; Boutin, A. Prediction of thermodynamic derivative properties of natural condensate gases at high pressure by Monte Carlo simulation. Fluid Phase Equilibria 2004, 220, 211–223. [Google Scholar] [CrossRef]
  24. Boek, E.S.; Yakovlev, D.S.; Headen, T.F. Quantitative molecular representation of asphaltenes and molecular dynamics simulation of their aggregation. Energy Fuels 2009, 23, 1209–1219. [Google Scholar] [CrossRef]
  25. Uddin, M.; Coombe, D.; Ivory, J. Quantifying physical properties of Weyburn oil via molecular dynamics simulation. Chem. Eng. J. 2016, 302, 249–259. [Google Scholar] [CrossRef]
  26. Iwase, M.; Sugiyama, S.; Liang, Y.; Masuda, Y.; Morimoto, M.; Matsuoka, T.; Boek, E.S.; Ueda, R.; Nakagawa, K. Development of Digital Oil for Heavy Crude Oil: Molecular Model and Molecular Dynamics Simulations. Energy Fuels 2018, 32, 2781–2792. [Google Scholar] [CrossRef]
  27. Iwase, M.; Liang, Y.; Masuda, Y.; Morimoto, M.; Matsuoka, T.; Boek, E.S.; Kaito, Y.; Nakagawa, K. Application of a Digital Oil Model to Solvent-Based Enhanced Oil Recovery of Heavy Crude Oil. Energy Fuels 2019, 33, 10868–10877. [Google Scholar] [CrossRef]
  28. Mullins, O.C.; Forsythe, J.C.; Pomerantz, A.E.; Wilkinson, T.; Winkelman, B.; Mishra, V.K.; Canas, J.A.; Chen, L.; Jackson, R.; Betancourt, S.S.; et al. Downhole Fluid Analysis and Gas Chromatography; a Powerful Combination for Reservoir Evaluation. Petrophysics 2018, 59, 649–671. [Google Scholar] [CrossRef]
  29. Chen, X.; Hou, L.; Wei, X.; Bedrov, D. Transport Properties of Waxy Crude Oil: A Molecular Dynamics Simulation Study. ACS Omega 2020, 5, 18557–18564. [Google Scholar] [CrossRef]
  30. Fall, W.S.; Baschnagel, J.; Lhost, O.; Meyer, H. Role of Short Chain Branching in Crystalline Model Polyethylenes. Macromolecules 2022, 55, 8438–8450. [Google Scholar] [CrossRef]
  31. Ambrose, D.; Tsonopoulos, C. Vapor-Liquid Critical Properties of Elements and Compounds. 2. Normal Alkanes. J. Chem. Eng. Data 1995, 40, 531–546. [Google Scholar] [CrossRef]
  32. Available online: https://webbook.nist.gov/chemistry/fluid/ (accessed on 1 August 2025).
  33. Frenkel, D.; Smit, B. Understanding Molecular Simulation: From Algorithms to Applications; Academic Press: San Diego, CA, USA, 2002. [Google Scholar]
  34. Wilhelmsen, O.; Bedeaux, D.; Kjelstrup, S.; Reguera, D. Thermodynamic stability of nanosized multicomponent bubbles/droplets: The square gradient theory and the capillary approach. J. Chem. Phys. 2014, 140, 024704. [Google Scholar] [CrossRef]
  35. Gao, Z.; Wu, W.; Sun, W.; Wang, B. Understanding the Stabilization of a Bulk Nanobubble: A Molecular Dynamics Analysis. Langmuir 2021, 37, 11281–11291. [Google Scholar] [CrossRef]
  36. Voevodin, V.V.; Antonov, A.S.; Nikitenko, D.A.; Shvets, P.A.; Sobolev, S.I.; Sidorov, I.Y.; Stefanov, K.S.; Voevodin, V.V.; Zhumatiy, S.A. Supercomputer Lomonosov-2: Large Scale, Deep Monitoring and Fine Analytics for the User Community. Supercomput. Front. Innov. 2019, 6, 4–11. [Google Scholar] [CrossRef]
  37. Available online: https://manual.gromacs.org/current/reference-manual/functions/nonbonded-interactions.html (accessed on 1 August 2025).
  38. Available online: https://github.com/AlexanderSidorenkov/HydrocarbonGenerator (accessed on 1 August 2025).
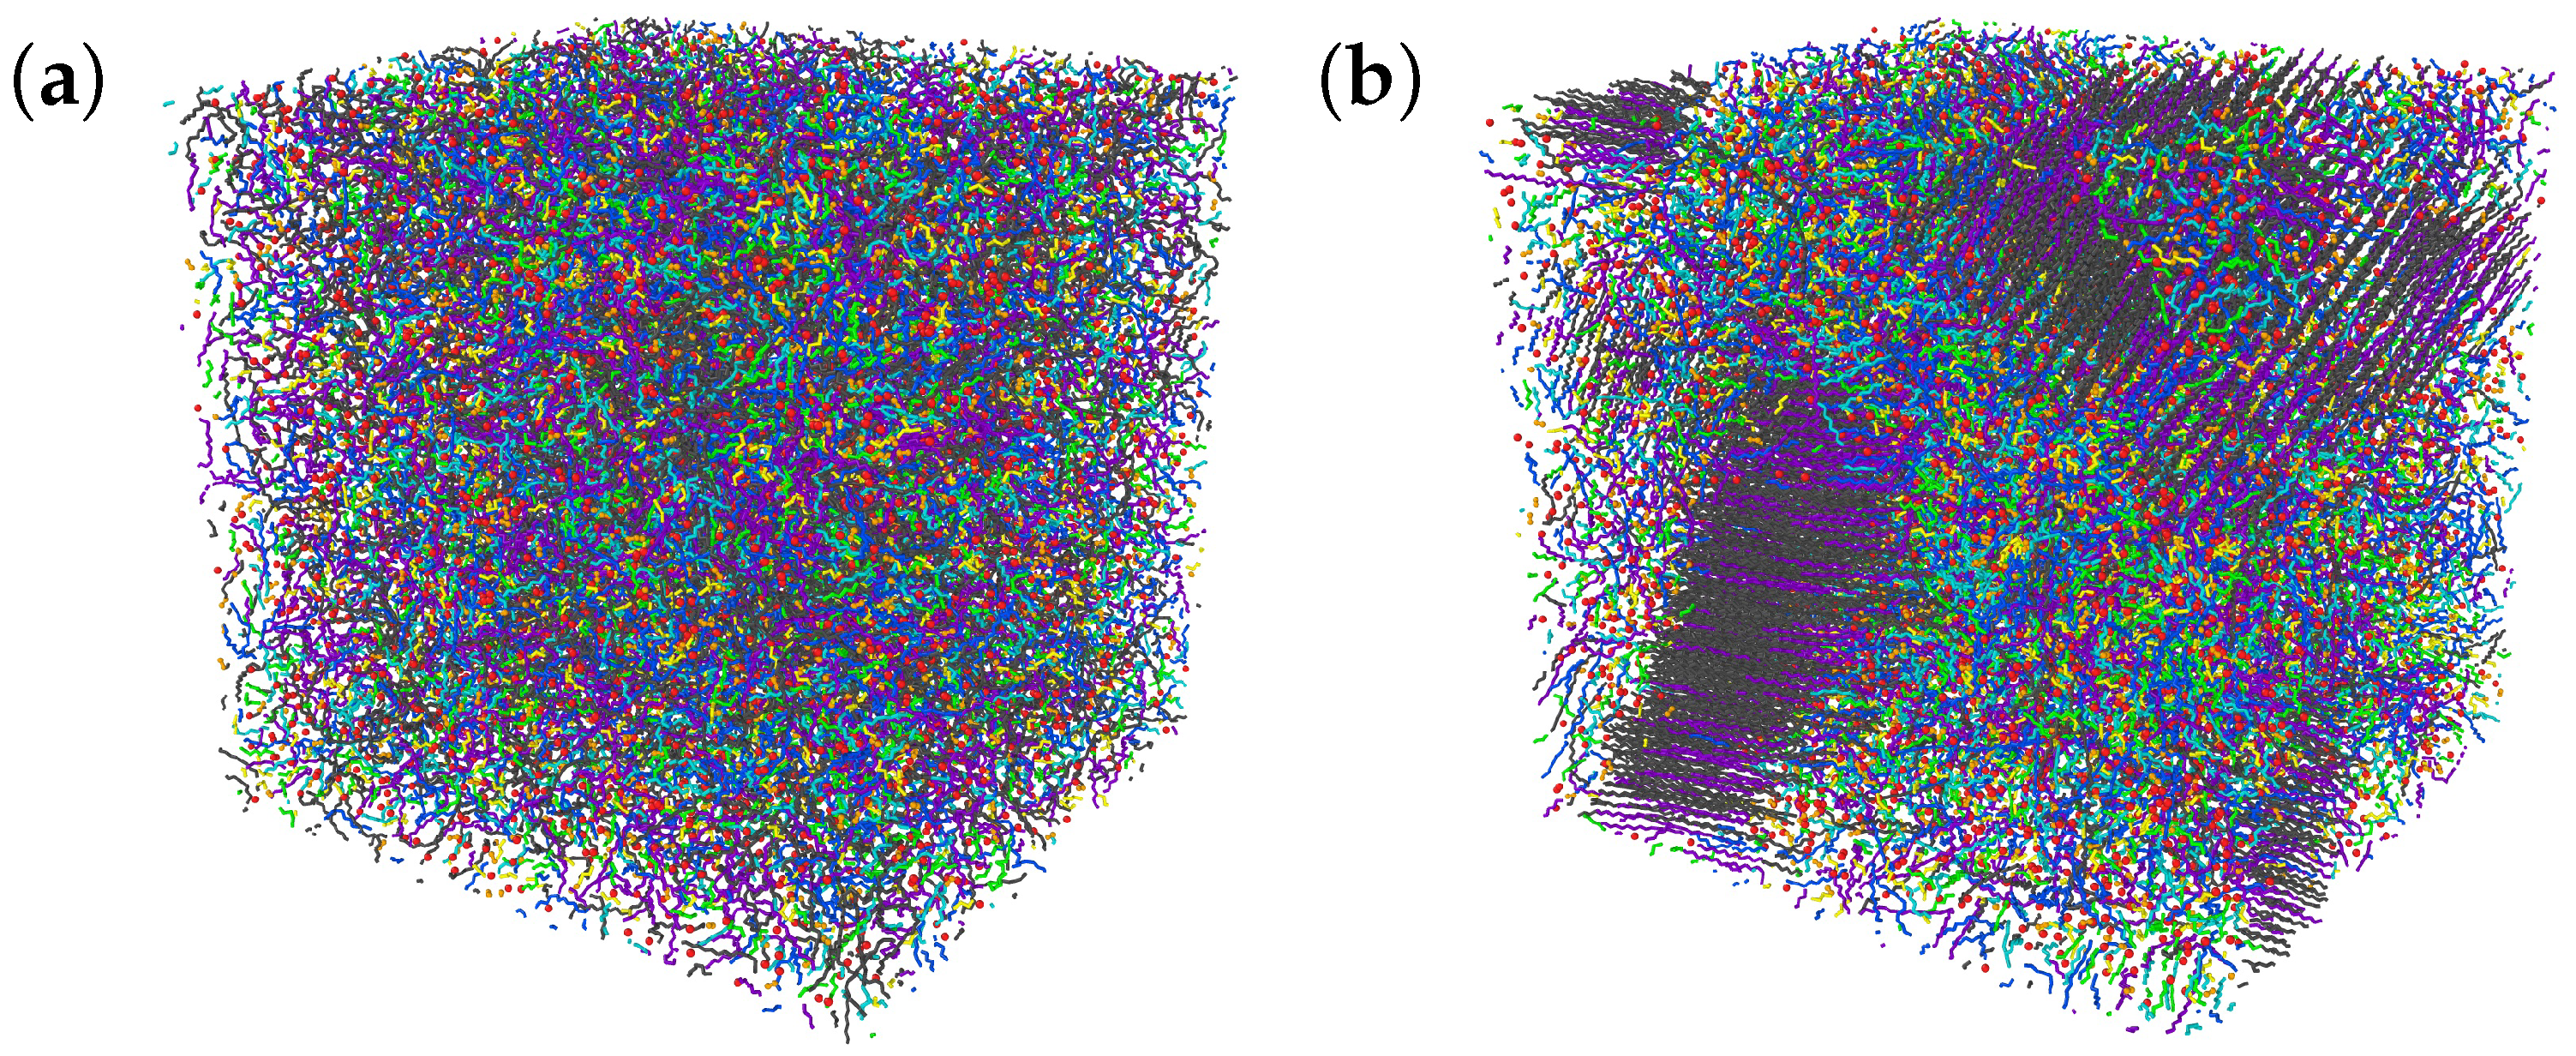
Figure 1. Snapshot of the initial state of the mixture of lineal molecules at a high temperature and pressure (a), and the equilibrium state in target conditions (b).
Methane 04 00024 g001
Figure 2. Pictures of a generation process for a C24 molecule. Process starts with one CH4 united atom (methane molecule, shown on the left in pink), then other C atoms are being added. Intermediate states with 6 and 12 C atoms are shown. The final state of the generated C24 molecule is shown on the right. Grey particles are C atoms, yellow—CH united atoms, orange—CH2 united atoms, and red—CH3 united atoms.
Methane 04 00024 g002
Figure 3. Phase diagram of the eight-component mixture at a constant temperature. The low pressure interval refers to two coexisting phases. The data are for the bubbles of spherical shape. The critical points for gas–liquid separation in methane, ethane, n-butane, n-hexane and n-octane are added for comparison (please note that these are experimental data, and they are valid for the thermodynamic limit, and that is not the case in our finite size systems). The hollow circles correspond to the case of vanishing low-density phase inside the spherical bubble.
Methane 04 00024 g003
Figure 4. (a) Densities of liquid and gas phases vs. pressure of the liquid phase in cases of different shapes of the gas–liquid interface. (b) Average density vs. pressure for one-phase and two-phase systems with different shapes of interfaces. Grey lines on both figures refer to a one-phase state. The hollow circles on both figures correspond to the case of vanishing low-density phase inside the spherical bubble.
Methane 04 00024 g004
Figure 5. Densities of liquid and gas phases vs. average density of systems in cases of different gas phase shapes. Grey line refers to one-phase state. The hollow circles correspond to the case of vanishing low-density phase inside the spherical bubble.
Methane 04 00024 g005
Figure 6. Volume fraction of phases and interface between them vs. average density of simulation cell. The hollow circles correspond to the case of vanishing low-density phase inside the spherical bubble.
Methane 04 00024 g006
Figure 7. Width of the gas–liquid interface vs. the average density for different interface shapes. The hollow circle corresponds to the case of vanishing low-density phase inside the spherical bubble.
Methane 04 00024 g007
Figure 8. Comparison of results obtained with different simulation cell shapes: a cubic cell and an elongated parallelepiped cell. (a) Volume fraction of phases and the interface between them vs. the average density of the simulation cell. (b) Pressure in the system vs. the average density of the two-phase mixture.
Methane 04 00024 g008
Figure 9. Molar compositions of components in the gas (a) and liquid (b) phases and in the interface layer (c). Colors represent the components. Squares, triangles and spheres indicate the systems with flat, cylindrical and spherical gas–liquid interfaces, respectively. The hollow circles correspond to the case of vanishing low-density phase inside the spherical bubble.
Methane 04 00024 g009
Figure 10. (a) Molar densities of fluid components (left y-axis, colored lines) and the average mass density of the mixture (right y-axis). The abscissa axis corresponds to the cumulative volume fraction of voxels (small local subvolumes) with the specific average mass density of the mixture (readable on the right y-axis) and the mixture composition (represented by the molar densities of components and readable on the left y-axis). The horizontal line segments indicate intervals of the volume fraction of voxels with the given density and composition. The composition is represented by the molar composition and the mass density in two other plots (b,c) in this figure. (b) Molar composition of the fluid (left y-axis, colored lines) and the average mass density of the mixture (right y-axis). (c) Average mass densities of fluid components (left y-axis, colored lines) and the average mass density of the mixture (right y-axis which is here identical with the left y-axis). The data for these plots (ac) are obtained for the case of the spherical gas bubble with a diameter of about 7 nm in the 26 × 25 × 25 nm3 system, a pressure of 5.15 MPa, and an average density of 524.68 kg/m3.
Methane 04 00024 g010
Table 1. MD systems description.
Number of
Molecules
Cell Size in x, y, and z
Directions (nm)
Pressure
(MPa)
Phase Interface
Shape
48,000170. 12.5 12.5 4.237 ± 0.013 plane
48,000150. 12.5 12.5 4.880 ± 0.023 plane
48,000130. 12.5 12.5 5.759 ± 0.016 plane
48,000110. 12.5 12.5 7.109 ± 0.024 plane
48,00090. 12.5 12.5 9.352 ± 0.033 plane
48,00045.0 25.0 25.0 3.776 ± 0.008 plane
48,00042.0 25.0 25.0 4.053 ± 0.018 plane
48,00038.0 25.0 25.0 4.496 ± 0.010 plane
48,00034.0 25.0 25.0 5.142 ± 0.021 plane
48,00030.0 25.0 25.0 5.922 ± 0.010 plane
48,00027.0 25.0 25.0 6.718 ± 0.027 plane
48,00026.0 25.0 25.0 6.946 ± 0.024 plane
48,00027.0 25.0 25.0 4.836 ± 0.046 sphere
48,00026.0 25.0 25.0 5.153 ± 0.035 sphere
48,00025.0 25.0 25.0 5.487 ± 0.023 sphere
48,00024.0 25.0 25.0 5.843 ± 0.027 sphere
48,00023.0 25.0 25.0 5.981 ± 0.024 sphere
48,00022.0 25.0 25.0 7.00 ± 0.11 interface only
48,00021.5 25.0 25.0 11.33 ± 0.07
48,00021.0 25.0 25.0 20.14 ± 0.04
48,00020.5 25.0 25.0 31.41 ± 0.13
48,00020.0 25.0 25.0 46.24 ± 0.10
48,00063.0 8.0 45.0 4.132 ± 0.020 cylinder
48,00057.0 8.0 45.0 4.584 ± 0.017 cylinder
48,00053.0 8.0 45.0 5.101 ± 0.015 cylinder
48,00049.0 8.0 45.0 5.571 ± 0.041 cylinder
48,00045.0 8.0 45.0 6.195 ± 0.022 cylinder
48,00041.0 8.0 45.0 7.721 ± 0.015 cylinder
48,00039.0 8.0 45.0 8.198 ± 0.037 cylinder
Table 2. Bulk density of C24 component at T = 375.15 K and P = 30 MPa.
C24 MoleculesNumber Density (nm−3)
n-tetracosane≈1.6 (non-uniform crystal structure)
c-tetracosane1.29
methyltridecane1.03
2-7-diheptylbicyclodecane1.36
randomly generated molecules1.45
Table 3. Number of different united atoms in 600 branched molecules of each type (C12, C16, C24).
CCHCH2CH3
C12334134324083115
C16540196131823917
C241115317145775537
Disclaimer/Publisher’s Note: The statements, opinions and data contained in all publications are solely those of the individual author(s) and contributor(s) and not of MDPI and/or the editor(s). MDPI and/or the editor(s) disclaim responsibility for any injury to people or property resulting from any ideas, methods, instructions or products referred to in the content.